

ABSTRACT
Purpose
Whole-body dynamic balance is necessary for both athletic activities and activities of daily living. This study aimed to investigate the effect of acute dynamic balance training on neural networks.
Methods
We evaluated resting-state functional connectivity (rs-FC), white matter fiber density, fiber-bundle cross-section, and gray matter volume in 28 healthy young adults (14 women) before and after 30 min of slackline training using a randomized, counterbalanced crossover design.
Results
The rs-FC between the left lateral prefrontal cortex (PFC) and the foot area of the primary sensorimotor (SM1) cortex increased significantly after slackline training compared with that after a control condition involving ergometer-based aerobic exercise. In addition, changes in rs-FC between the left lateral PFC and the primary sensorimotor were correlated with performance changes after training (i.e., offline process) rather than online learning. We also observed a main effect of time between the hippocampus and the cingulate cortex, including the anterior areas, and between the bilateral lateral PFC. Although we observed no structural changes, fiber density in the commissural fiber pathway before the first balance assessment was correlated with initial balance capability.
Conclusions
Our findings demonstrate that acute whole-body dynamic balance training alters specific rs-FC, and that this change is associated with performance changes after training. In addition, rs-FC changes in cognitive regions were modulated by both acute dynamic balance training and aerobic exercise. These findings have the potential to influence various fields (e.g., sports neuroscience, neurorehabilitation) and may aid in the development of methods that can improve motor and cognitive performance.
Key Words: MOTOR LEARNING, COORDINATION, POSTURAL CONTROL, MULTIMODAL MRI, FIXEL-BASED ANALYSIS
Whole-body dynamic balance, defined as adaptive postural control to the external environment, is essential for sports activities (1). Balance capability is also related to various everyday performances, and loss of dynamic balance function can lead to a slip, trip, or stumble. As whole-body motor tasks require several elements, such as interlimb coordination and postural control, the neural network associated with whole-body balance tasks is more complex than that associated with simple hand movements. A previous study indicated that the neural basis of simple motor skills cannot be generalized to more complex motor skills (2). However, given that it is methodologically more difficult to measure brain activity during whole-body motor tasks than during hand motor tasks, the neural network associated with whole-body dynamic balance training remains unclear.
Previous studies using positron emission tomography or single photon emission tomography have demonstrated that regional cerebral blood flow increases in widespread regions during walking or standing, including motor-related cortical areas, the basal ganglia, and the cerebellum (3,4). Studies using noninvasive functional near-infrared spectroscopy (fNIRS) have also reported that the lateral prefrontal cortex (PFC), premotor cortex, supplementary motor cortex, and primary motor cortex (M1) are activated during whole-body balance tasks, although fNIRS cannot provide information regarding activity in subcortical regions (5,6). In addition, gray matter volume (GMV) in several regions such as the frontal lobe, parietal lobe, basal ganglia, thalamus, and cerebellum has been associated with balance performance (7,8). These findings support the notion that several brain regions cooperate to control whole-body posture and limb coordination.
Elucidating the neural mechanisms of dynamic balance training can provide useful information for improving sports training and neurorehabilitation. Previous studies have demonstrated that repeated bouts of dynamic balance training induce functional and structural plasticity in the brain (9,10). For example, one study reported that functional connectivity in motor-related regions, including the premotor area, M1, basal ganglia, and cerebellum, increased after 6 wk of slackline balance training (10), while another reported that the GMV in the lateral prefrontal region increased after 6 wk of dynamic balance training (11). However, accumulating evidence regarding motor learning suggests that neuronal plasticity induced by motor learning is dependent on the learning phase (i.e., early or late phase) (12). Therefore, the neural substrate of the early phase of motor learning balance training remains unclear.
Taubert and colleagues (13) have demonstrated that GMV of the foot areas in M1 increases after 1 h of dynamic balance training. Other previous studies have suggested that functional connectivity of the motor-related regions, including M1, changes in a task-dependent manner after motor learning (14,15). Such activity changes are called as the motor engram or motor memory trace. Therefore, acute whole-body balance training may alter the functional connectivity of brain regions associated with dynamic postural control. However, changes in functional connectivity at the whole-brain network level caused by acute whole-body balance training cannot be evaluated using voxel-based morphometry (VBM), positron emission tomography, fNIRS, or conventional task–functional magnetic resonance imaging (fMRI).
Recently, we evaluated changes in resting-state functional connectivity (rs-FC) before and after sequential motor skill learning requiring use of the whole body (16). Then we observed rs-FC of specific regions altered by motor skill learning. Therefore, in the present study, we compared rs-FC recorded immediately before 30 min of acute dynamic balance training with that recorded after training to clarify the neural mechanisms underlying acute learning in whole-body dynamic balance tasks. We used slacklining as the whole-body dynamic balance task, as previously reported (6). We also analyzed the gray and white matter microstructure related to each participant’s initial balance capability with VBM using T1-weighted images and a newly developed fixel-based analysis (FBA) using diffusion-weighted images (17,18). Furthermore, as previous studies have indicated that 1–2 h of acute motor practice may induce structural changes in the white and gray matter, we investigated whether 30 min of dynamic balance training could induce structural changes (13,19).
METHODS
Participants
Twenty-eight right-handed, right-footed volunteers (14 women; mean age = 22 ± 1 yr, range = 19–24 yr; mean weight = 61 ± 11 kg, range = 43–88 kg; mean height = 1.66 ± 0.09 m, range = 1.51–1.80 m) were included in this study. All participants reported no history of neurological or psychological disorders and had no or little slackline experiences. Four women had past experience with classical ballet, one woman with gymnastic, and one woman with figure skating. Because handedness and footedness might influence brain structure, we included only right-handed and right-footed participants in the present study. Handedness was evaluated using the Edinburgh Handedness Inventory (mean laterality quotient = 0.9 ± 0.1, range = 0.7–1) (20). Footedness was evaluated using the 11-item Chapman’s foot preference test (mean score = 14 ± 3, range = 11–21) (21). All participants had received a detailed explanation of the experimental procedures before the experiment and gave written informed consent. This study was conducted in accordance with the Declaration of Helsinki, and the experimental procedures were approved by the Ethics Committee of Ritsumeikan University (BKC-IRB-2020-070).
Experimental design
In this randomized, counterbalanced crossover study, all participants completed two experimental sessions that were conducted at least 4 wk apart (mean interval = 29 ± 4 d, range = 28–47 d) (Fig. 1). In one session, participants underwent slackline training (SL), which requires dynamic balance and postural control. In the other session, participants performed aerobic exercises (AE) as a control motor task. Each session lasted 30 min. To compare the intensity of exercise between sessions, we measured the participants’ heart rates (HR) during each session using an HR monitor (WHS-3; UNION TOOL CO, Tokyo, Japan).
FIGURE 1.

Experimental design. A total of 28 right-handed, right-footed volunteers completed the two experimental sessions at least 4 wk apart. Two multimodal MRI scans, including resting-state functional MRI, T1-weighted images, and diffusion-weighted images, were obtained before and after the SL and AE sessions (pre- and post-SL or AE). Balance performance assessments were conducted immediately before and after the sessions (Post-1) and after the postsession MRI (Post-2).
Seven women and seven men participated in the SL session first, and the remaining participants participated in the AE session first (Fig. 1). For each participant, the two sessions were performed at the same time of day to minimize the effect of circadian variation (mean time difference = 21 ± 30 min, range = 0–150 min) (22). Eight participants performed the sessions in the morning, whereas the remaining participants performed the sessions in the afternoon.
We acquired multimodal MRI, including resting-state functional images, T1-weighted images, T2-weighted images, and diffusion-weighted images (DWI), before and after each training session using a harmonization protocol (HARP) (Fig. 1) (23). Assessments of balance performance were conducted immediately before and after the sessions and after the postsession MRI, as described below (Fig. 1).
Slackline training
SL was performed using four protocols using a slackline with the following characteristics: length, 4 m; height, 0.3 m; width, 0.05 m (Fitness Line, Gibbon, Stuttgart, Germany). First, the participants were asked to stand with one leg in the middle of the slackline for as long as possible. The standing leg was changed with every fall. This part of the session lasted 5 min. Then the participants were asked to attempt to walk five steps forward from a standing position with both legs on the slackline while maintaining their balance. This part of the SL session lasted 10 min. During the next 5 min, the participants bent both knees and held still for 5 s then extended both knees again and returned to the original standing position with both legs on the slackline. During the last 10 min of the session, the participants were asked to attempt to walk five steps in the forward direction while maintaining their balance, then to turn 180° on the spot, walk five steps, and return to the original position. All training sessions were repeated as many times as possible within the time limits.
Aerobic exercise
AE sessions were performed using an ergometer (Ergomedic 828E; Monark, Varberg, Sweden), the saddle height of which was set such that the participant’s knees were mildly flexed with the lower legs in the most extended position when sitting on the saddle with the upper body in a mild forward bending position. The starting load was 20 W, and the load was adjusted by the experimenter to maintain the participant’s HR between 100 bpm (easy) and 130 bpm (slightly difficult) for 30 min. The participants were asked to maintain their rotation speed at 60 rpm according to the pitch sound (i.e., 60 bpm). The rotation speed was displayed in front of the participants.
Assessments of balance performance
Five balance performance assessments were conducted for each leg. The total time required for these assessments was approximately 5 min. Each balance test was performed twice, and the better score of the two trials was used to calculate the mean score of both legs, which was used in the analyses.
The slackline standing (SLstand) balance assessment consisted of the participants attempting to stand with one leg on the slackline for as long as possible. The SLstand assessment was conducted on each leg. We measured the time spent balanced on one leg before falling. Participants were stopped after 60 s of balancing to prevent fatigue. The slackline walking (SLwalk) balance assessment included participants attempting to walk on the slackline for as long as possible. We evaluated the distance walked before falling, with a maximum distance of 4 m. During the third balance performance assessment, the participants attempted to stand with one leg on the floor with their eyes closed for as long as possible without moving the sole of the foot on the standing leg (STfloor). We measured the time until any other part of the body touched the floor, with a maximum time of 60 s to prevent fatigue. The STfloor assessment was conducted on each leg. Next, the participants were asked to stand on a balance disc (TR balance cushion; Japana, Aichi, Japan) on one leg with their eyes closed for as long as possible (STdisc). We measured the time until any other part of the body touched the floor, with a maximum time of 60 s to prevent fatigue. The STdisc assessment was conducted on each leg.
The final balance performance assessment was the star excursion balance test (SEBT), during which the participants stood on a single leg on the center of a platform and performed maximal reaches in several directions with the opposite leg before returning to the original position without touching the platform with the reaching leg. The participants were not permitted to lift the heel of the standing leg from the floor. If the reaching leg touched the platform or the heel of the standing leg was lifted, the trial was discarded and an additional trial was performed. A maximal of five trials in each direction were performed for each assessment. The SEBT assessment was conducted on each leg. The distances of the reach in eight directions at 45° angles to each other were measured to a precision of 0.01 m. The mean distance reached in all directions was calculated and normalized for the length of the lower extremity. The normalized mean distance was used in the analyses.
Behavioral analyses
The effect of SL on balance capability (i.e., learning effect) was evaluated based on differences in the pre- and postsession balance performance assessments, which were determined using paired t-tests for normally distributed data or Wilcoxon signed-rank tests for nonnormally distributed data. To check whether data fitted a normal distribution, one-sample Kolmogorov–Smirnov tests were performed. P values were corrected using the Bonferroni method for multiple comparisons (i.e., 5 indices × 2 conditions × 2 periods, corrected P = 0.05 corresponds to uncorrected P = 0.0025). For comparisons of learning effects and prebalance performance between SL and AE, P values were corrected using the Bonferroni method, respectively (i.e., 5 indices, corrected P = 0.05 corresponds to uncorrected P = 0.01). The effect of the session order on the amount of improvement was determined using two-sample t-tests or Wilcoxon signed-rank tests. To evaluate carryover effects from the first to the second session, we calculated differences between the first and the second prebalance assessments. Then we compared them using one-sample t-tests for general effects (combined SL and AE) and applied Mann–Whitney U-tests to both participant subgroups (i.e., n = 14 per session order). P values were corrected using the Bonferroni method (i.e., 5 indices, corrected P = 0.05 corresponds to uncorrected P = 0.01). The mean and the maximum HR values during the SL and AE were calculated and compared using paired t-tests. The one-sample Kolmogorov–Smirnov test, the t-test, the Wilcoxon signed-rank test, and the Mann–Whitney U-test were performed using MATLAB.
To evaluate the relationship between balance performance and MRI outcomes, we selected STdisc as the representative balance capability measure because some participants reached the upper limit of measurement in the SLstand, SLwalk, and STfloor assessments (see results and Fig. 2). Therefore, these variables were not suitable to calculate correlation coefficients. As SEBT results are influenced by the range of motion of the lower extremity (24), we did not perform correlation analysis using SEBT results.
FIGURE 2.
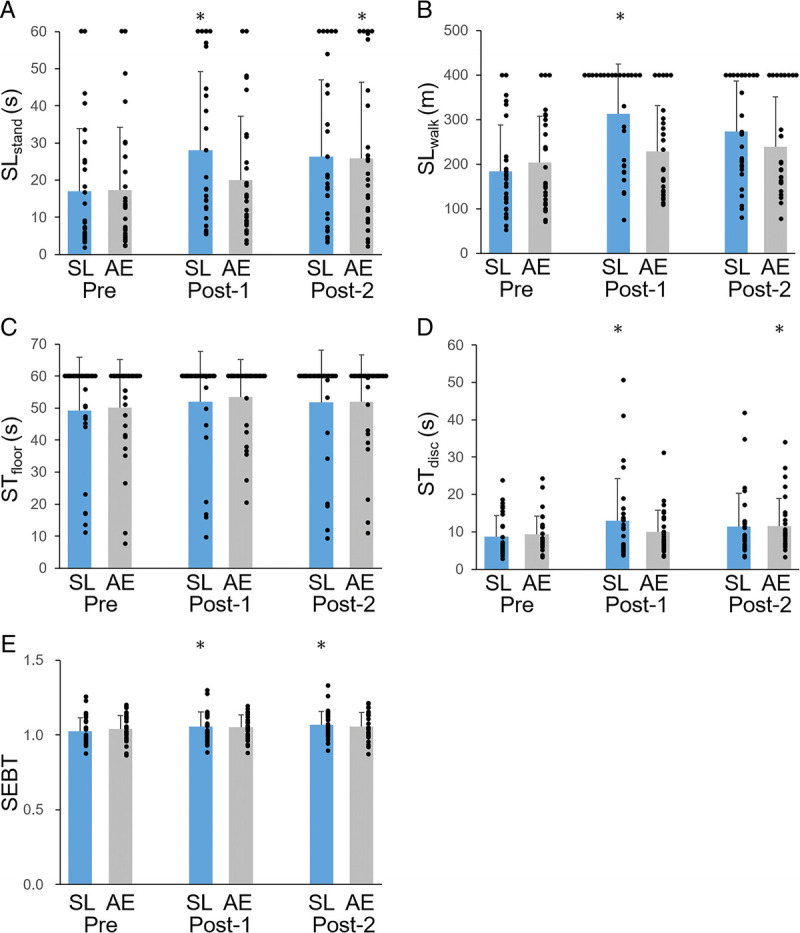
Balance assessments. The results of SLstand (A), SLwalk (B), STfloor (C), STdisc (D), and SEBT (E) in Pre, Post-1, and Post-2, respectively. Data are presented as mean ± SD. Black plots indicate individual values of each participant. *P < 0.05 as compared with Pre values.
Acquisition of MRI data
The participants were scanned using a 3-T Siemens Magnetom Skyra fit scanner (Siemens, Munich, Germany) equipped with a 32-channel head coil. Blood oxygenation level–dependent contrast functional images were acquired during the resting-state using multiband T2*-weighted echo-planar imaging (EPI) free induction decay sequences with the following parameters: field of view (FOV), 204 × 204 mm; voxel size, 2.4 mm isotropic, no gap; repetition time (TR), 800 ms; echo time (TE), 34.4 ms; and flip angle, 52°. All participants were instructed to keep their eyes open and focus on the fixation cross during the scan and to think about nothing in particular. Two 5-min resting-state fMRI scans were performed.
T1-weighted images were acquired using a magnetization-prepared rapid acquisition gradient echo (MPRAGE) sequence (224 sagittal slices; FOV, 240 × 256 mm; voxel size, 0.8 mm isotropic; TR, 2500 ms; TE, 2.18 ms; inversion time, 1000 ms; flip angle, 8°; GRAPPA acceleration factor, 2). The acquisition time was approximately 5 min.
T2-weighted images were acquired in accordance with the HARP based on the human connectome project (23), although these images were not analyzed in the present study. The acquisition time was approximately 5 min.
Two DWI were acquired with a double spin-echo sequence in 67 directions using AP phase encoding and 68 directions using PA phase encoding (b values, 0, 700, and 2000 s·mm−2; 84 slices; FOV, 204 × 204 mm; voxel size, 1.7 mm isotropic, no gap; TR, 3600 ms; TE, 89 ms; flip angle, 90°; GRAPPA acceleration factor, 2) using a multiband acceleration factor of 3. The acquisition times for the AP and PA scans were approximately 5 min each. The total scan time was approximately 35 min.
Functional image processing
We performed a seed region of interest (ROI)–based analysis to evaluate rs-FC using the CONN toolbox (Functional Connectivity Toolbox; Neuroimaging Informatics Tools and Resources Clearinghouse, USA; https://www.nitrc.org/projects/conn) implemented in SPM12 (Wellcome Trust Centre for Neuroimaging, University College London, London, UK, https://www.fil.ion.ucl.ac.uk/spm/software/spm12/) running on MATLAB (The MathWorks Inc., Natick, MA). EPI images were processed using the default preprocessing pipeline (realignment, normalization, segmentation, outlier detection, and smoothing with a full width at half maximum of 8 mm). Denoising was then performed using a component-based noise correction method, motion regression, and band-pass filtering (0.008–0.09 Hz). A previous study demonstrated that volume changes in M1 can be observed after 1 h of dynamic balance training (13). Therefore, the paracentral gyrus was used as the ROI. Another study demonstrated that the lateral PFC is associated with dynamic balance training (11,25), and other motor learning studies have highlighted the involvement of subcortical regions such as the striatum, hippocampus, and cerebellum (12,26). Therefore, we conducted 10 seed-based analyses (five regions × two hemispheres). These ROI values were defined in the CONN toolbox, which was created based on the FSL Harvard-Oxford Atlas as a typical anatomical region (https://fsl.fmrib.ox.ac.uk/fsl/fslwiki/Atlases).
Interactions [(SLpost > SLpre) > (AEpost > AEpre)] were analyzed to evaluate whether changes in rs-FC after SL differ from those after AE. Post hoc correlation analysis was performed to determine whether changes in rs-FC before and after SL were associated with learning. For this analysis, we depicted the individual values of changes in rs-FC in the SL. Post hoc correlation analysis using mean HR or maximum HR was also conducted to determine whether changes in rs-FC were associated with exercise intensity. In addition, the effects of the motor task before and after the training sessions were evaluated, and the SLpre and the AEpre were comparable.
All contrasts were analyzed using threshold-free cluster enhancement with 5000 permutations. The statistical threshold was set to P < 0.05 after family-wise error (FWE) correction for multiple comparisons.
T1 image processing
We performed VBM analysis using the Computational Anatomy Toolbox (CAT, Jena University Hospital, Departments of Psychiatry and Neurology, Germany; http://www.neuro.uni-jena.de/cat/), a toolbox for SPM12 used with MATLAB. T1-weighted images were modulated and normalized to the Montreal Neurological Institute standard space and segmented into gray matter, white matter, and cerebrospinal fluid using the default approach of combined affine and nonlinear registration. Then the segmented gray matter maps were smoothed with a Gaussian kernel of 8 mm full width at half maximum.
To evaluate changes in GMV, contrasts [(SLpost > SLpre) > (AEpost > AEpre)] were analyzed using a full-factorial design. Brain regions associated with initial balance capability were identified by calculating the correlation between GMV before the task and initial balance performance. The total intracranial volume, age, and sex were included as covariates of no interest.
All contrasts were analyzed using threshold-free cluster enhancement with 5000 permutations. The statistical threshold was set to P < 0.05 after FWE correction for multiple comparisons.
Diffusion image processing
We performed FBA using MRtrix3 (http://www.mrtrix.org/), as previously described (18). Standard preprocessing was performed. First, two images were combined into one image using the mrcat function. Then denoising, unringing, motion, distortion, and bias field corrections were performed using the dwidenoise, mrdegibbs, dwifslpreproc, and dwibiascorrect functions, respectively. The group-average white matter response function was then computed for subsequent analyses. The DWI data were upsampled to a voxel size of 1.25 mm (isotropic), as this has been shown to improve anatomical details. The fiber orientation distribution (FOD) functions were calculated using constrained spherical deconvolution. Then a global intensity normalization was conducted for all participants using a groupwise registration and the median b = 0 white matter value as a reference.
To create a study-specific FOD template, we used all FOD images from the pre-MRI scan on day 1. Spatial correspondence was obtained by registering all FOD to the FOD template. Then FOD functions in the template space were segmented to estimate fiber density (FD), fiber-bundle cross-section (FDC), and a combination of both FD and FDC. FC was log-transformed before the statistical analyses. Finally, the fixed data were smoothed based on the sparse fixel-fixel connectivity matrix using the fixelfilter function.
Postsession changes in rs-FC were compared by analyzing the interactions of [(SLpost > SLpre) > (AEpost > AEpre)] using different images of FD, log-FC, and FDC computed for each participant and paired t-tests.
Associations of white matter microstructure and initial balance capability were identified by calculating the correlation between the initial balance performance (calculated using the STdisc results) and FD, log-FC, or FDC. Age and sex were used as covariates of no interest.
These analyses were performed using connectivity-based fixel enhancement with 5000 permutations. The statistical threshold was set to P < 0.05 after FWE correction for multiple comparisons.
RESULTS
Balance performance
All five balance assessments, including individual data and statistical values in Pre, Post-1, and Post-2, are shown in Figure 2 and Table 1. Some participants reached the upper limit of measurement in the SLstand, SLwalk, and STfloor assessments conducted after SL (Fig. 2). Before SL, 16 participants reached the maximum time during the STfloor assessment; therefore, no improvement in STfloor was observed because of the ceiling effect, suggesting that this task was not suitable for evaluating learning. Scores for the remaining balance performance assessments improved significantly after SL training (Fig. 2, Table 1). Performance improvements after SL training tended to be greater than after AE (SLstand: z = 2.37, P = 0.09, d = 0.78; SLwalk: z = 3.26, P = 0.006, d = 1.18; STfloor: z = 0.37, P = 1, d = 0.06; STdisc: z = 1.66, P = 0.48, d = 0.57; SEBT: z = 1.57, P = 0.58, d = 0.47) (Fig. 3).
TABLE 1.
Behavioral results.
| SLstand (s) | SLwalk (m) | STfloor (s) | STdisc (s) | SEBT | |||||||||||
|---|---|---|---|---|---|---|---|---|---|---|---|---|---|---|---|
| Pre | Post-1 | Post-2 | Pre | Post-1 | Post-2 | Pre | Post-1 | Post-2 | Pre | Post-1 | Post-2 | Pre | Post-1 | Post-2 | |
| Slackline training | |||||||||||||||
| 17.0 ± 16.9 | 28.0 ± 21.1 | 26.4 ± 20.6 | 1.85 ± 1.03 | 3.13 ± 1.12 | 2.74 ± 1.13 | 49.3 ± 16.7 | 51.9 ± 15.9 | 51.7 ± 16.4 | 8.7 ± 5.7 | 12.9 ± 11.4 | 11.4 ± 8.9 | 1.02 ± 0.09 | 1.06 ± 0.10 | 1.07 ± 0.09 | |
| z-value | 3.64 | 3.00 | 4.39 | 3.41 | 1.48 | 1.80 | 3.26 | 2.21 | 3.16 | 3.67 | |||||
| P value | 0.005 | 0.06 | 0.0002 | 0.01 | 1 | 1 | 0.02 | 0.54 | 0.03 | 0.005 | |||||
| Cohen’s d | 0.58 | 0.50 | 1.20 | 0.83 | 0.16 | 0.15 | 0.46 | 0.36 | 0.33 | 0.47 | |||||
| (vs Pre) | |||||||||||||||
| Aerobic exercise | |||||||||||||||
| 17.3 ± 16.9 | 20.0 ± 17.2 | 25.8 ± 20.5 | 2.04 ± 1.04 | 2.28 ± 1.03 | 2.40 ± 1.12 | 50.2 ± 15.0 | 53.5 ± 11.7 | 51.9 ± 14.8 | 9.3 ± 4.9 | 10.0 ± 5.9 | 11.6 ± 7.4 | 1.04 ± 0.09 | 1.05 ± 0.08 | 1.06 ± 0.09 | |
| z-value | 2.07 | 3.44 | 1.88 | 1.97 | 1.59 | 0.91 | 1.16 | 3.07 | 2.6 | 2.96 | |||||
| P value | 0.78 | 0.01 | 1 | 0.98 | 1 | 1 | 1 | 0.04 | 0.19 | 0.06 | |||||
| Cohen’s d | 0.16 | 0.45 | 0.23 | 0.33 | 0.24 | 0.12 | 0.12 | 0.36 | 0.16 | 0.21 | |||||
| (vs Pre) | |||||||||||||||
Data are presented as mean ± SD.
FIGURE 3.

Learning effects. The learning effects of SLstand (A), SLwalk (B), STfloor (C), STdisc (D), and SEBT (E), respectively. Results were calculated as (Post-1 value) − (Pre value). Data are presented as mean ± SD. Black plots indicate individual values for each participant. *Comparison between SL and AE is statistically significant (corrected P < 0.05).
The balance performance assessment scores obtained before SL training did not significantly differ from those obtained before AE (SLstand: z = 0.52, P = 1, d = 0.02; SLwalk: z = 1.18, P = 1, d = 0.19; STfloor: z = 0.07, P = 1, d = 0.06; STdisc: z = 1.32, P = 0.93, d = 0.11; SEBT: z = 1.18, P = 1, d = 0.18). The amount of learning during SL was not influenced by task order (SLstand: z = 1.22, P = 1, d = 0.43; SLwalk: z = 1.85, P = 0.32, d = 0.77; STfloor: z = 0.36, P = 1, d = 0.18; STdisc: z = 0.53, P = 1, d = 0.47; SEBT: z = 1.10, P = 1, d = 0.32). Carryover effects were observed in SLstand and SLwalk [SLstand: t(27) = 4.50, P = 5.80 × 10⁻⁴, d = 0.81; SLwalk: t(27) = 5.95, P = 1.19 × 10⁻⁵, d = 0.84; STfloor: t(27) = 1.40, P = 0.87, d = 0.21; STdisc: t(27) = 1.78, P = 0.43, d = 0.25; SEBT: t(27) = 2.22, P = 0.17, d = 0.27]. However, we did not find any difference in carryover effects between SL and AE (SLstand: z = 0.53, P = 1, d = 0.04; SLwalk: z = 1.82, P = 0.35, d = 0.56; STfloor: z = 0.36, P = 1, d = 0.15; STdisc: z = 1.22, P = 1, d = 0.28; SEBT: z = 1.54, P = 0.62, d = 0.55).
The mean HR during SL (128 ± 17 bpm) was significantly greater than that during AE (116 ± 8 bpm) [t(27) = 4.33, P = 1.84 × 10⁻⁴, d = 0.89]. The maximum HR during SL (153 ± 16 bpm) was also significantly greater than that during AE (142 ± 5 bpm) [t(27) = 4.41, P = 1.47 × 10⁻⁴, d = 0.97].
Functional connectivity
Seed-based analyses with two-way ANOVA revealed a significant interaction in rs-FC between the left lateral PFC and the medial areas in the primary sensorimotor (SM1) area, indicating that this change was greater during SL than during AE (P < 0.05) (Fig. 4). However, we did not find any significant interaction in the right lateral PFC ROI or M1, striatum, hippocampus, or cerebellum. The strength of rs-FC before the motor task did not differ between the two training sessions.
FIGURE 4.

Seed-based analysis for resting-state fMRI. The seed is the left lateral PFC. The images indicate the interactions between tasks and times [(SLpost > SLpre) > (AEpost > AEpre)]. Statistical significance was set at P < 0.05 after FWE correction for multiple comparisons of threshold-free cluster enhancement with 5000 permutations. The scatter plot on the right shows relationship between offline process of balance learning in STdisc in the SL sessions [calculated as (Post-2 value) − (Post-1 value)] and changes in rs-FC between the left lateral PFC and the primary motor cortex.
Post hoc correlation analysis revealed that changes in rs-FC between the left lateral PFC and the medial areas in SM1 due to SL training were associated with the offline process of balance training (Post-2–Post-1) (r = 0.40, P = 0.036) (Fig. 4) rather than with online improvement (Post-1–Pre) (r = −0.32, P = 0.10), although the amount of online learning was strongly correlated with performance changes after balance training (Post-2–Post-1) (r = −0.66, P = 0.0001). In addition, changes in rs-FC between the left lateral PFC and the medial areas in SM1 due to SL were not associated with the mean HR (r = 0.25, P = 0.20) or maximum HR (r = 0.25, P = 0.20) during SL.
The rs-FC between the hippocampus and the cingulate cortex increased after both sessions (Fig. 5). In addition, rs-FC between the bilateral lateral PFC decreased after the sessions.
FIGURE 5.

The main effect of time (post vs pre) in the seed-based analysis of resting-state fMRI. In the left upper panel, the seed is the right hippocampus. In the right upper panel, the seed is the right lateral PFC (green region). The blue regions indicate a decrease in rs-FC. The statistical threshold was set at P < 0.05 after FWE correction for multiple comparisons of threshold-free cluster enhancement with 5000 permutations. The lower panels show mean and SD values of correlation coefficient of the upper regions, respectively. Black plots indicate individual values of each participant.
Gray matter volume
We observed no main effects or interactions in the VBM analysis, indicating that GMV did not change during SL or AE. In addition, we observed no correlation between GMV before the first balance assessment in the first session and balance capability at the first assessment. Furthermore, GMV before the first balance assessment in the SL session was not correlated with the amount of learning during the SL session.
White matter microstructure
We observed no main effects or interactions in the FBA, which indicates that the white matter microstructure did not change during SL or AE. Correlation analyses revealed a positive correlation between FD and FDC in the commissural fiber pathway before the first balance assessment in the first session and balance capability at the first assessment. This trend was observed near the medial areas in SM1, although the values were not significant (Fig. 6). The results of the FBA before the first balance assessment in the SL session and the amount of learning during the SL session were not correlated.
FIGURE 6.
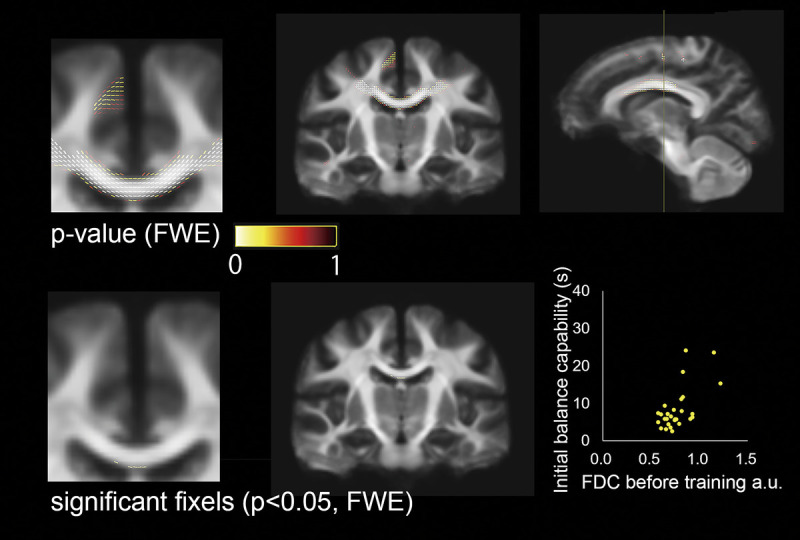
Fixel-based analysis. The upper panels show P values (after FWE correction for multiple comparisons of threshold-free fixel enhancement with 5000 permutations) for the combined index of both FD and FDC before the SL in association with the initial balance capability on a study-specific fixel template. The lower central and left panels indicate significant fixels of correspondent the upper panels. The lower right panel shows the relationship between initial balance capability and FDC.
DISCUSSION
We conducted this counterbalanced, crossover study to investigate the acute effect of whole-body dynamic balance training on rs-FC, GMV, and white matter microstructure. Here, we revealed, for the first time, that acute whole-body dynamic balance training increased rs-FC between the left lateral PFC and the bilateral SM1 foot area. In addition, this increase in rs-FC was associated with offline process of balance learning. Furthermore, initial dynamic balance capability was associated with initial FD and FDC in the commissural fiber pathway, which was extended to the SM1 foot area.
Previous studies have suggested that the lateral PFC and M1 are associated with the early phase of dynamic balance learning (11,13,25). Therefore, the brain regions in which changes in rs-FC were identified in this study are consistent with those reported in previous studies. The change in rs-FC between the lateral PFC and the SM1 was not correlated with HR during dynamic balance training, although HR during dynamic balance training was significantly greater than that during AE. Therefore, this change is unlikely to originate from individual differences in intensity of exercise during dynamic balance training. As changes in functional connectivity involving M1 after motor learning reflect offline learning, consolidation, or motor engram (e.g., memory trace) (15,27–29), changes in rs-FC between the lateral PFC and the SM1 are associated with motor learning rather than residual brain activation during a motor task. Indeed, post hoc correlation analysis suggested that changes in rs-FC are related to offline process of balance learning. Such evidence may allow for the development of methods that can improve motor performance using noninvasive brain stimulation. For example, transcranial alternating current stimulation for the lateral PFC and SM1 might augment the effect of dynamic balance training. However, in the present study, we observed no significant structural changes using VBM, which may be due to the amount of balance training. In a previous study, participants were trained 1.5 times longer (i.e., 45 min) than in this study (13). A weak trend of increases in the bilateral M1 of the foot area was observed in this study (data not shown). Our previous study also identified no structural changes, although significant changes in rs-FC were observed after 20 min of motor skill learning (16). These findings suggest that the sensitivity for the detection of rapid learning-induced changes is higher for rs-FC than for VBM, although it may depend on the specific task, acquisition parameters, as well as scan time.
In this study, initial balance capability was associated with initial FD and FDC in the commissural fiber pathway, which was extended to the SM1 foot area. Previous studies have suggested that individual differences in specific FD in healthy adults are associated with a specific capability (30). There may be a relationship between motor performance and the white matter microstructure connecting the motor-related regions. Individual differences in motor performance and brain structure are likely the result of interactions between genetic and environmental factors, including motor experiences (31). Thus, future studies should aim to clarify whether participants with higher motor-related FD are more capable of other lower extremity motor skills, such as juggling a football.
We observed changes in rs-FC between the hippocampus and the cingulate cortex, including the anterior area (ACC), and between the bilateral lateral PFC after dynamic balance training and the AE. Several previous studies have demonstrated that chronic and acute AE improve memory, mood, and cognitive function (32–34). The hippocampus is important for memory formation (35), which is improved by acute mild exercise (36). Changes in rs-FC involving the hippocampus are consistent with the results of previous studies. The cingulate cortex has various functions, including mood regulation, emotion, cognition, attention, and social function, and is involved in motor tasks. Furthermore, the cingulate cortex is a hub region for different neural networks because it connects with widespread brain regions both functionally and anatomically (37,38). In addition, 12 wk of moderate-intensity AE has been shown to induce structural changes in the ACC (39). Thus, a change in rs-FC involving the cingulate cortex, including the ACC, after acute exercise is not unexpected. The lateral PFC plays an important role in executive function and cognitive tasks (40). These changes in rs-FC after acute dynamic balance training and AE might be associated with the positive effects of exercise on various functions, although cognitive function, memory, and mood were not measured in this study. Such changes might be associated with dopamine or dopaminergic activity because systematic review reported that physical exercise would influence dopamine system (41). However, in the present study, we did not conduct a nontask control condition. Thus, we cannot exclude possible confounders, such as the effect of accustomedness on MRI scans and/or elapsed time. In addition, participants conducted not only main motor tasks (SL and AE) but also balance assessments between pre- and post-MRI scans. Therefore, changes in rs-FC might be affected by assessments, during which the participants lost their balance (e.g., error-based learning).
As previous studies have evaluated changes in rs-FC within intrinsic networks identified by model-free independent component analysis (27,42), the seed-based analysis conducted in the present study provides evidence of changes in rs-FC between regions that belong to distinct networks. Indeed, the lateral PFC belongs to the executive control network, and SM1 belongs to the sensorimotor network (43). Previous studies using independent component analysis have demonstrated that intrinsic networks are altered by acute AE (42,44). By contrast, seed-based analysis can be used to identify changes in rs-FC between distinct networks. However, seed-based analysis is a hypothesis-driven approach. Therefore, we might overlook significant changes in the association of the outside of the hypothesis or ROI. In addition, we used the same anatomically defined ROI for all participants in the present study. Previous studies parcellated brain areas in more detail using multimodal images (23), and some studies used participant-specific ROI (45,46). Therefore, this study’s statistical power may be improved if individual focal ROI values are used during the seed-based analysis.
A previous study suggested that spinal cord excitability is modulated by short-term balance training (47). Namely, excitability in the spinal cord or connectivity between cortical areas and the spinal cord might also be altered by acute whole-body dynamic balance training. The analysis of the relationship between changes in spinal reflexes and changes in rs-FC could provide interesting results for a comprehensive understanding of the effect of acute whole-body dynamic balance training on the central nervous system (48,49).
This study has several limitations. First, only healthy young adults participated in the current study. Therefore, results are relative to this group, and further research needs to investigate changes in rs-FC induced by balance training in different population groups, as brain activity during motor tasks may be different in older adults and patients with motor disorders (50). Second, we did not evaluate consolidation effect for next day or several days. We observed 4-wk carryover effects in two balance assessments (i.e., SLstand and SLwalk), whereas no difference between conditions was detected after 4-wk of the first session. Research investigating consolidation or retention for one or several days would provide useful information for related fields such as rehabilitation and sports training. Finally, in the present study, the ceiling effect occurred in some trials. Therefore, future studies should target task difficulty in the experimental design to obtain more accurate results.
CONCLUSIONS
In conclusion, we demonstrated that rs-FC were altered by acute whole-body dynamic balance training and aerobic exercise. Changes in rs-FC between the left lateral PFC and the foot area in SM1 tended to be correlated with the offline process of balance learning rather than with online improvement. These results also suggest that fixation on the participants’ heads during the motor task is not necessary to evaluate rs-FC before and after a motor task. Therefore, researchers can evaluate the neural mechanisms of motor learning in various natural tasks such as gymnastic movements, swimming, and physical therapy with robotic devices without constraints. In addition, rs-FC changes in cognitive regions were modulated by both acute dynamic balance training and aerobic exercise. These findings would be useful in various fields, including sports neuroscience and neural rehabilitation, in order to further develop effective assessments, training methods, and treatments.
Acknowledgments
The authors thank Dr. Toru Kawai and Ms. Chieri Takahashi for helping with the data collection. They thank Dr. Patrick Ragert, Mr. Tom Maudrich, and Mr. Rouven Kenville for their valuable comments on the previous version of this manuscript. This work was supported by JSPS KAKENHI (grant nos. 18K02468 and 16K01638), JST COI (grant no. JPMJCE1306), and Ritsumeikan University BKC Research Organization of Social Sciences Program for Research Institute Mission. The funders had no role.
All authors declare no conflicts of interest. The results of the present study do not constitute endorsement by the American College of Sports Medicine. The results of the study are presented clearly, honestly, and without fabrication or inappropriate data manipulation.
Contributor Information
Kenji Ueta, Email: ueta@fc.ritsumei.ac.jp.
Takashi Sugiyama, Email: t-sugi08@fc.ritsumei.ac.jp.
Tadao Isaka, Email: isaka@se.ritsumei.ac.jp.
Satoshi Otomo, Email: otomosatoshi@gmail.com.
REFERENCES
- 1.Ricotti L. Static and dynamic balance in young athletes. J Hum Sport Exerc. 2011;6(4):616–28. [Google Scholar]
- 2.Wulf G, Shea CH. Principles derived from the study of simple skills do not generalize to complex skill learning. Psychon Bull Rev. 2002;9(2):185–211. [DOI] [PubMed] [Google Scholar]
- 3.Fukuyama H Ouchi Y Matsuzaki S, et al. Brain functional activity during gait in normal subjects: a SPECT study. Neurosci Lett. 1997;228(3):183–6. [DOI] [PubMed] [Google Scholar]
- 4.Ouchi Y, Okada H, Yoshikawa E, Futatsubashi M, Nobezawa S. Absolute changes in regional cerebral blood flow in association with upright posture in humans: an orthostatic PET study. J Nucl Med. 2001;42(5):707–12. [PubMed] [Google Scholar]
- 5.Mihara M, Miyai I, Hatakenaka M, Kubota K, Sakoda S. Role of the prefrontal cortex in human balance control. Neuroimage. 2008;43(2):329–36. [DOI] [PubMed] [Google Scholar]
- 6.Seidel-Marzi O, Hähner S, Ragert P, Carius D. Task-related hemodynamic response alterations during slacklining: an fNIRS study in advanced slackliners. Front Neuroergon. 2021;2:644490. [DOI] [PMC free article] [PubMed] [Google Scholar]
- 7.Hüfner K Binetti C Hamilton DA, et al. Structural and functional plasticity of the hippocampal formation in professional dancers and slackliners. Hippocampus. 2011;21(8):855–65. [DOI] [PubMed] [Google Scholar]
- 8.Surgent OJ, Dadalko OI, Pickett KA, Travers BG. Balance and the brain: a review of structural brain correlates of postural balance and balance training in humans. Gait Posture. 2019;71:245–52. [DOI] [PMC free article] [PubMed] [Google Scholar]
- 9.Magon S Donath L Gaetano L, et al. Striatal functional connectivity changes following specific balance training in elderly people: MRI results of a randomized controlled pilot study. Gait Posture. 2016;49:334–9. [DOI] [PubMed] [Google Scholar]
- 10.Giboin LS Loewe K Hassa T, et al. Cortical, subcortical and spinal neural correlates of slackline training–induced balance performance improvements. Neuroimage. 2019;202:116061. [DOI] [PubMed] [Google Scholar]
- 11.Taubert M Draganski B Anwander A, et al. Dynamic properties of human brain structure: learning-related changes in cortical areas and associated fiber connections. J Neurosci. 2010;30(35):11670–7. [DOI] [PMC free article] [PubMed] [Google Scholar]
- 12.Dayan E, Cohen LG. Neuroplasticity subserving motor skill learning. Neuron. 2011;72(3):443–54. [DOI] [PMC free article] [PubMed] [Google Scholar]
- 13.Taubert M, Mehnert J, Pleger B, Villringer A. Rapid and specific gray matter changes in M1 induced by balance training. Neuroimage. 2016;133:399–407. [DOI] [PubMed] [Google Scholar]
- 14.Sami S, Robertson EM, Miall RC. The time course of task-specific memory consolidation effects in resting state networks. J Neurosci. 2014;34(11):3982–92. [DOI] [PMC free article] [PubMed] [Google Scholar]
- 15.Hamano YH, Sugawara SK, Yoshimoto T, Sadato N. The motor engram as a dynamic change of the cortical network during early sequence learning: an fMRI study. Neurosci Res. 2020;153:27–39. [DOI] [PubMed] [Google Scholar]
- 16.Mizuguchi N Maudrich T Kenville R, et al. Structural connectivity prior to whole-body sensorimotor skill learning associates with changes in resting state functional connectivity. Neuroimage. 2019;197:191–9. [DOI] [PubMed] [Google Scholar]
- 17.Ashburner J, Friston KJ. Voxel-based morphometry—the methods. Neuroimage. 2000;11(6 Pt 1):805–21. [DOI] [PubMed] [Google Scholar]
- 18.Dhollander T Clemente A Singh M, et al. Fixel-based analysis of diffusion MRI: methods, applications, challenges and opportunities. Neuroimage. 2021;241:118417. [DOI] [PubMed] [Google Scholar]
- 19.Sagi Y, Tavor I, Hofstetter S, Tzur-Moryosef S, Blumenfeld-Katzir T, Assaf Y. Learning in the fast lane: new insights into neuroplasticity. Neuron. 2012;73(6):1195–203. [DOI] [PubMed] [Google Scholar]
- 20.Oldfield RC. The assessment and analysis of handedness: the Edinburgh inventory. Neuropsychologia. 1971;9(1):97–113. [DOI] [PubMed] [Google Scholar]
- 21.Chapman JP, Chapman LJ, Allen JJ. The measurement of foot preference. Neuropsychologia. 1987;25(3):579–84. [DOI] [PubMed] [Google Scholar]
- 22.Thomas C Sadeghi N Nayak A, et al. Impact of time-of-day on diffusivity measures of brain tissue derived from diffusion tensor imaging. Neuroimage. 2018;173:25–34. [DOI] [PubMed] [Google Scholar]
- 23.Koike S Tanaka SC Okada T, et al. Brain/MINDS beyond human brain MRI project: a protocol for multi-level harmonization across brain disorders throughout the lifespan. Neuroimage Clin. 2021;30:102600. [DOI] [PMC free article] [PubMed] [Google Scholar]
- 24.Hoch MC, Staton GS, McKeon PO. Dorsiflexion range of motion significantly influences dynamic balance. J Sci Med Sport. 2011;14(1):90–2. [DOI] [PubMed] [Google Scholar]
- 25.Lehmann N, Tolentino-Castro JW, Kaminski E, Ragert P, Villringer A, Taubert M. Interindividual differences in gray and white matter properties are associated with early complex motor skill acquisition. Hum Brain Mapp. 2019;40(15):4316–30. [DOI] [PMC free article] [PubMed] [Google Scholar]
- 26.Jacobacci F Armony JL Yeffal A, et al. Rapid hippocampal plasticity supports motor sequence learning. Proc Natl Acad Sci U S A. 2020;117(38):23898–903. [DOI] [PMC free article] [PubMed] [Google Scholar]
- 27.Albert NB, Robertson EM, Miall RC. The resting human brain and motor learning. Curr Biol. 2009;19(12):1023–7. [DOI] [PMC free article] [PubMed] [Google Scholar]
- 28.Censor N, Horovitz SG, Cohen LG. Interference with existing memories alters offline intrinsic functional brain connectivity. Neuron. 2014;81(1):69–76. [DOI] [PMC free article] [PubMed] [Google Scholar]
- 29.Gregory MD Agam Y Selvadurai C, et al. Resting state connectivity immediately following learning correlates with subsequent sleep-dependent enhancement of motor task performance. Neuroimage. 2014;102(Pt 2(0 2)):666–73. [DOI] [PMC free article] [PubMed] [Google Scholar]
- 30.Clemente A Domínguez DJF Imms P, et al. Individual differences in attentional lapses are associated with fiber-specific white matter microstructure in healthy adults. Psychophysiology. 2021;58(9):e13871. [DOI] [PubMed] [Google Scholar]
- 31.Kanai R, Rees G. The structural basis of inter-individual differences in human behaviour and cognition. Nat Rev Neurosci. 2011;12(4):231–42. [DOI] [PubMed] [Google Scholar]
- 32.Hillman CH, Erickson KI, Kramer AF. Be smart, exercise your heart: exercise effects on brain and cognition. Nat Rev Neurosci. 2008;9(1):58–65. [DOI] [PubMed] [Google Scholar]
- 33.Herold F, Aye N, Lehmann N, Taubert M, Müller NG. The contribution of functional magnetic resonance imaging to the understanding of the effects of acute physical exercise on cognition. Brain Sci. 2020;10(3):175. [DOI] [PMC free article] [PubMed] [Google Scholar]
- 34.Voss MW Weng TB Narayana-Kumanan K, et al. Acute exercise effects predict training change in cognition and connectivity. Med Sci Sports Exerc. 2020;52(1):131–40. [DOI] [PMC free article] [PubMed] [Google Scholar]
- 35.Eichenbaum H. A cortical-hippocampal system for declarative memory. Nat Rev Neurosci. 2000;1(1):41–50. [DOI] [PubMed] [Google Scholar]
- 36.Suwabe K Byun K Hyodo K, et al. Rapid stimulation of human dentate gyrus function with acute mild exercise. Proc Natl Acad Sci U S A. 2018;115(41):10487–92. [DOI] [PMC free article] [PubMed] [Google Scholar]
- 37.Torta DM, Cauda F. Different functions in the cingulate cortex, a meta-analytic connectivity modeling study. Neuroimage. 2011;56(4):2157–72. [DOI] [PubMed] [Google Scholar]
- 38.Vogt BA. Midcingulate cortex: structure, connections, homologies, functions and diseases. J Chem Neuroanat. 2016;74:28–46. [DOI] [PubMed] [Google Scholar]
- 39.Lin K Stubbs B Zou W, et al. Aerobic exercise impacts the anterior cingulate cortex in adolescents with subthreshold mood syndromes: a randomized controlled trial study. Transl Psychiatry. 2020;10(1):155. [DOI] [PMC free article] [PubMed] [Google Scholar]
- 40.Yuan P, Raz N. Prefrontal cortex and executive functions in healthy adults: a meta-analysis of structural neuroimaging studies. Neurosci Biobehav Rev. 2014;42:180–92. [DOI] [PMC free article] [PubMed] [Google Scholar]
- 41.Marques A Marconcin P Werneck AO, et al. Bidirectional association between physical activity and dopamine across adulthood-a systematic review. Brain Sci. 2021;11(7):829. [DOI] [PMC free article] [PubMed] [Google Scholar]
- 42.Rajab AS, Crane DE, Middleton LE, Robertson AD, Hampson M, MacIntosh BJ. A single session of exercise increases connectivity in sensorimotor-related brain networks: a resting-state fMRI study in young healthy adults. Front Hum Neurosci. 2014;8:625. [DOI] [PMC free article] [PubMed] [Google Scholar]
- 43.Raichle ME. The restless brain. Brain Connect. 2011;1(1):3–12. [DOI] [PMC free article] [PubMed] [Google Scholar]
- 44.Schmitt A, Upadhyay N, Martin JA, Rojas S, Strüder HK, Boecker H. Modulation of distinct intrinsic resting state brain networks by acute exercise bouts of differing intensity. Brain Plast. 2019;5(1):39–55. [DOI] [PMC free article] [PubMed] [Google Scholar]
- 45.Pilgramm S de Haas B Helm F, et al. Motor imagery of hand actions: decoding the content of motor imagery from brain activity in frontal and parietal motor areas. Hum Brain Mapp. 2016;37(1):81–93. [DOI] [PMC free article] [PubMed] [Google Scholar]
- 46.Zabicki A, de Haas B, Zentgraf K, Stark R, Munzert J, Krüger B. Imagined and executed actions in the human motor system: testing neural similarity between execution and imagery of actions with a multivariate approach. Cereb Cortex. 2017;27(9):4523–36. [DOI] [PubMed] [Google Scholar]
- 47.Giboin LS, Tokuno C, Kramer A, Henry M, Gruber M. Motor learning induces time-dependent plasticity that is observable at the spinal cord level. J Physiol. 2020;598(10):1943–63. [DOI] [PubMed] [Google Scholar]
- 48.Lungu O, Frigon A, Piché M, Rainville P, Rossignol S, Doyon J. Changes in spinal reflex excitability associated with motor sequence learning. J Neurophysiol. 2010;103(5):2675–83. [DOI] [PubMed] [Google Scholar]
- 49.Vahdat S Khatibi A Lungu O, et al. Resting-state brain and spinal cord networks in humans are functionally integrated. PLoS Biol. 2020;18(7):e3000789. [DOI] [PMC free article] [PubMed] [Google Scholar]
- 50.St George RJ, Hinder MR, Puri R, Walker E, Callisaya ML. Functional near-infrared spectroscopy reveals the compensatory potential of pre-frontal cortical activity for standing balance in young and older adults. Neuroscience. 2021;452:208–18. [DOI] [PubMed] [Google Scholar]