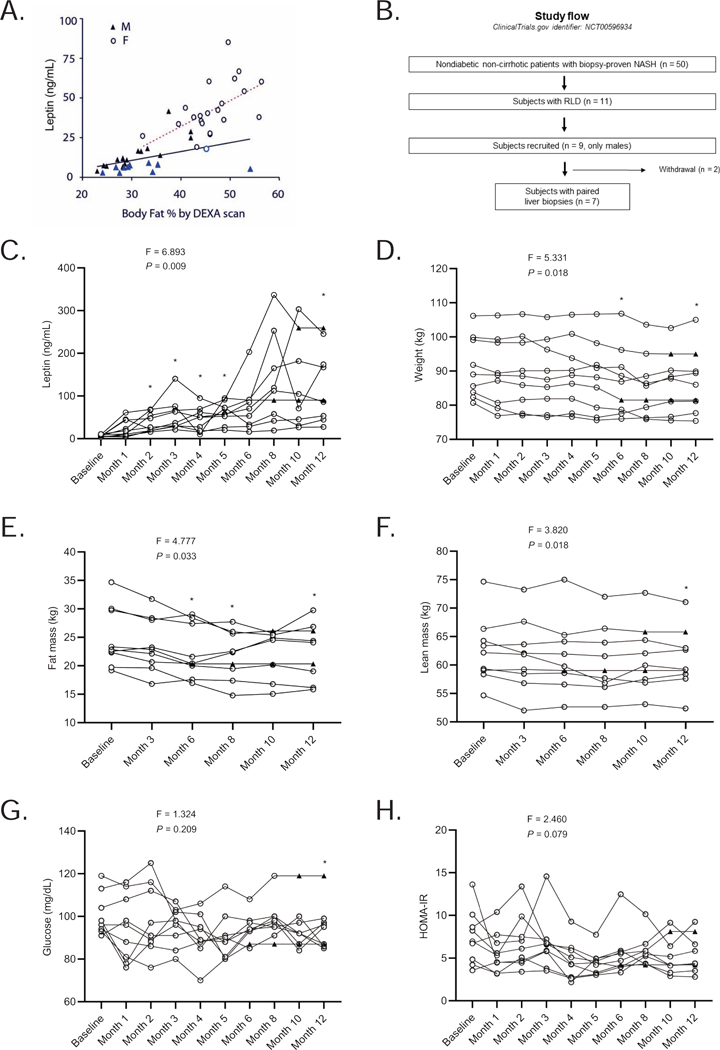
Figure 1. Correlation of circulating leptin levels with adiposity in patients with NASH, the RLD study design, and the effect of metreleptin therapy on metabolic parameters in the RLD study.
(A) Serum leptin levels against total body fat percentage determined by DEXA scan in 50 NASH patients. F = females (r = 0.540, P = 0.010), M = males (r = 0.430, P = 0.030). Blue symbols show 11 patients with RLD; (B) The RLD study design. For metabolic and body composition parameters, data carried forward. For liver related parameters, a decision was made to only conduct completer analysis since liver biopsy was done only at baseline and at month 12; and withdrawal reasons may have confounded the observations; (C) Effect of metreleptin therapy on leptin levels throughout the study period. Note that levels after month 3 may be confounded by circulating anti-drug antibodies; (D) Changes from baseline in weight; (E) fat percentage; (F) lean body mass percentage; (G) glucose; and (H) HOMA-IR studied at the indicated times. We report the F-statistic and P value from a repeated-measures ANOVA. *These P values are marked if they are significant versus baseline with post hoc paired sample t-test after multiplicity correction. Paired t-test was used to compare month-12 values to baseline (without multiplicity correction) as the change at 12 months vs. baseline was a prespecified endpoint. ▲ shows specific data points where the last observation was carried forward.

