

Summary
It has been suggested that during the period of respiratory worsening of severe COVID-19 patients, viral replication plays a less important role than inflammation. Using the droplet-based digital PCR (ddPCR) for precise quantification of plasma SARS-CoV-2 viral load (SARS-CoV-2 RNAemia), we investigated the relationship between plasma viral load, comorbidities, and mortality of 122 critically ill COVID-19 patients. SARS-CoV-2 RNAemia was detected by ddPCR in 90 (74%) patients, ranging from 70 to 213,152 copies per mL. A high (>1 000 copies/ml) or very high (>10,000 copies/ml) SARS-Cov-2 RNAemia was observed in 46 patients (38%), of which 26 were diabetic. Diabetes was independently associated with a higher SARS-CoV-2 RNAemia. In multivariable logistic regression models, SARS-CoV-2 RNAemia was strongly and independently associated with day-60 mortality. Early initiation of antiviral therapies might be considered in COVID-19 critically ill patients with high RNAemia.
Subject areas: Clinical medicine, Virology
Graphical abstract
Highlights
-
•
Plasma SARS-CoV-2 RNA was detected in 90 of 122 COVID-19 critically ill patients
-
•
Plasma SARS-CoV-2 RNA was high (>1000 copies per mL) in 46 patients
-
•
Diabetic patients had significantly higher levels of plasma SARS-CoV-2 RNA
-
•
Plasma SARS-CoV-2 RNA levels were independently associated with day-60 mortality
Clinical medicine; Virology ;
Introduction
Severe acute respiratory syndrome coronavirus 2 (SARS-CoV-2), responsible for the development of COVID-19, has been global public health problem since January 2020. Although the majority of cases of patients with COVID-19 disease have mild symptoms, a proportion of cases progress to severe pneumonia, acute respiratory distress syndrome (ARDS), and death (Zhu et al., 2020).
In severe cases, clinical observations typically describe a disease starting with a mild-to-moderate presentation followed by a secondary respiratory worsening 9 to 12 days after onset of first symptoms (Grasselli et al., 2020). Initial analysis of host response to SARS-CoV-2 suggested a unique and inappropriate inflammatory response to the virus, which is imbalanced with regard to controlling virus replication versus activation of the adaptive immune response (Blanco-Melo et al., 2020). It is defined by low levels of type I and III interferons juxtaposed to elevated cytokines such as IL-6. Given this dynamic, it has been suggested that during the secondary period of respiratory worsening occurring in severe patients, treatments for COVID-19 have less to do with virus replication and more to do with controlling inflammation. In fact, in severe COVID-19 patients, anti-inflammatory treatments such as systemic glucocorticoids (Rochwerg et al., 2020), anakinra (Kyriazopoulou et al., 2021), Janus kinase inhibitors (Marconi et al., 2021), and Interleukin-6 receptor antagonists (RECOVERY Collaborative Group, 2021; REMAP-CAP Investigators et al., 2021) reduced short-term mortality.
In the SARS-CoV-2 pathogenesis, after the worsening period and admission to the intensive care unit, the importance of viral replication rate is still unclear. It has been suggested that the detection of SARS-CoV-2 RNA in plasma at the time of respiratory deterioration is associated with a higher severity of the disease (Eberhardt et al., 2020; Hogan et al., 2021; Kawasuji et al., 2022; Ram-Mohan et al., 2021; The Massachusetts Consortium for Pathogen Readiness et al., 2020; Veyer et al., 2020; Zheng et al., 2020), with circulating SARS-CoV-2 viral load showing a large amplitude. Fajnzylber et al., (2020) also analyzed the association and predictability of SARS-CoV-2 RNAemia with mortality and showed a direct association of RNAemia with mortality (The Massachusetts Consortium for Pathogen Readiness et al., 2020). However, the association between the amplitude of SARS-CoV-2 RNA in plasma and mortality of the most severe patients after adjustment on other predictors of mortality in specific critically ill patients remains undetermined (Bermejo-Martin et al., 2020).
This relationship between plasma viral load and mortality may be of major importance, because, until now, antiviral therapies have been recommended mainly in the early stages of the disease and in noncritically ill patients.
The availability of precise quantification of the plasmatic SARS-Cov-2 RNA by droplet-based digital PCR (ddPCR) led us to evaluate systematically the SARS-CoV-2 RNAemia as an estimation of whole body viral replication on admission in our intensive care unit (ICU) during the Covid-19 “third wave,” mainly induced by the alpha variant of SARS-CoV-2 in France.
The aim of this retrospective study is to describe the relationship between SARS-Cov-2 Plasma RNA levels, comorbidities, and mortality of a COVID-19 critically ill patients’ cohort, after adjustment on other predictors of mortality.
Results
A total of 122 COVID-19 patients were admitted in our ICU during the “third-wave” period of the pandemic, from March 04 to June 22, 2021. Thirteen patients (11%) were treated by remdesivir and 46 (38%) with sarilumab.
Patient characteristics according to day-60 survival status and plasma SARS-CoV-2 viral loads were shown in Tables 1 and 2. Median age was 60 (IQR 54 to 68), and plasmatic RNA levels were positive by ddPCR in 90 (74%) patients, ranging from 70 to 213,152 copies per mL. Plasmatic RNA categories were low in 45 patients (37%), medium in 31 patients (25%), high in 27 patients (22%), and very high in 19 patients (16%). The alpha SARS-CoV-2 variant was detected in 78 (64%) of patients, without a significant association with mortality or plasmatic SARS-CoV-2 RNA levels.
Table 1.
Patients’ characteristics
| Characteristic | Total population | Survivors | Non survivors | p value |
|---|---|---|---|---|
| Number of patients | 122 | 84 | 38 | |
| Age | 60 (54–68) | 57 (53–65) | 65 (59–73) | 0.0002 |
| Male sex | 82 (67%) | 54 (64%) | 28 (73%) | 0.31 |
| BMI | 30.4 (25.8–35.2) | 30.3 (26.4–34.5) | 30.4 (25.1–35.8) | 0.93 |
| Diabetes | 45 (37%) | 30 (36%) | 15 (40%) | 0.69 |
| Hypertension | 78 (64%) | 48 (57%) | 30 (79%) | 0.020 |
| Immunosuppression | 10 (8%) | 5 (6%) | 5 (13%) | 0.18 |
| SAPS-2 severity score | 36 (29–44) | 35 (28–41) | 39 (34–48) | 0.005 |
| SOFA severity score | 4 (3–5) | 4 (3–5) | 5 (4–7) | 0.019 |
| PaO2 on FiO2 ratio | 108 (85–152) | 112 (86–156) | 105 (77–148) | 0.54 |
| Neutrophil count (109/L) | 6.9 (4.8–9.4) | 7.0 (4.9–9.3) | 6.8 (4.8–10.1) | 0.71 |
| Lymphocyte count (109/L) | 0.76 (0.57–1.20) | 0.86 (0.59–1.42) | 0.67 (0.45–0.86) | 0.0025 |
| D-dimer, mg/L | 1.3 (0.7–3.1) | 1.2 (0.7–3.3) | 1.6 (1.0–2.9) | 0.34 |
| Serum Creatinine (μmol/L) | 67 (54–84) | 64 (50–77) | 82 (62–95) | 0.001 |
| eGFR (MDRD) (Levey, 1999) | 99 (77–125) | 109 (83–133) | 81 (63–108) | 0.0001 |
| CRP (mg/L) | 61 (32–114) | 58 (31–112) | 76 (34–131) | 0.40 |
| Alpha Variant (%) | 78 (64%) | 54 (64%) | 24 (63%) | 0.34 |
| Anti-Spike antibodies | 23 (4–148) | 21 (4–148) | 36 (1–157) | 0.83 |
| Treated by Remdesivir | 13 (11%) | 9 (11%) | 4 (11%) | 0.98 |
| Treated by Sarilumab | 46 (38%) | 34 (41%) | 12 (32%) | 0.29 |
| Days from symptom onset to ICU admission | 12 (9–15) | 12 (9–15) | 11 (9–16) | 0.55 |
| Plasma RNA load (log 10 copies/ml) | 2.63 (<2.0 to 3.45) | 2.47 (<2.0 to 3.19) | 3.35 (<2.0 to 4.16) | 0.0062 |
eGFR: estimated glomerular filtration rate.
PaO2 on FiO2 ratio is the ratio of arterial oxygen partial pressure (PaO2 in mmHg) to fractional inspired oxygen.
SAPS-2: simplified acute physiology score 2 (Le Gall, 1993).
SOFA: sequential organ failure assessment (Vincent et al., 1996).
Table 2.
Characteristics according to plasma SARS-Cov-2 RNA categories
| Plasma SARS-Cov-2 RNA levels (copies/ml) | ≤100 (low) | >100 to ≤1000 (medium) | >1000 to 10,000 (high) | >10,000 (very high) | P |
|---|---|---|---|---|---|
| Number of patients | 45 | 31 | 27 | 19 | |
| Age | 61 (57–68) | 55 (48–66) | 61 (56–68) | 61 (47–69) | 0.23 |
| Male sex | 28 (62%) | 21 (67%) | 21 (78%) | 12 (63%) | 0.57 |
| BMI | 29.7 (26.3–36.2) | 30.1 (25.8–31.7) | 30.9 (25.1–34.2) | 31.3 (26.7–3.8) | 0.92 |
| Diabetes | 14 (31%) | 6 (19%) | 15 (56%) | 10 (53%) | 0.013 |
| Hypertension | 29 (64%) | 16 (52%) | 20 (74%) | 13 (68%) | 0.33 |
| Immunosuppression | 3 (7%) | 1 (3%) | 3 (11%) | 3 (16%) | 0.40 |
| SAPS-2 severity score | 37 (31–44) | 34 (28–40) | 36 (33–47) | 36 (28–46) | 0.41 |
| SOFA severity score | 4 (4–6) | 4 (3–4) | 4 (3–6) | 5 (3–5) | 0.02 |
| PaO2 on FiO2 ratio | 105 (85–157) | 121 (87–171) | 108 (80–142) | 107 (78–140) | 0.86 |
| Neutrophil count (109/L) | 7.3 (5.0–10.1) | 7.1 (5.8–8.9) | 6.6 (5.4–9.4) | 5.0 (3.8–7.4) | 0.05 |
| Lymphocyte count (109/L) | 0.9 (0.7–1.5) | 0.8 (0.7–1.0) | 0.7 (0.5–1.1) | 0.6 (0.3–0.9) | 0.0046 |
| D-dimer mg/L | 1.0 (0.6–2.0) | 1.0 (0.7–3.7) | 2.8 (1.5–4.1) | 1.3 (1.0–1.9) | 0.0045 |
| Serum Creatinine (μmol/L) | 66 (52–77) | 62 (52–79) | 71 (58–91) | 81 (61–100) | 0.19 |
| CRP (mg/L) | 58 (30–104) | 54 (32–89) | 82 (26–145) | 76 (48–190) | 0.18 |
| Alpha Variant (%) | 22/28 (78%) | 24/29 (83%) | 19/25 (76%) | 13/18 (72%) | 0.54 |
| Anti-Spike antibodies (U/ml) | 159 (45–297) | 13 (3–96) | 20 (4–62) | 1 (0–8) | 0.0001 |
| Treated by Remdesivir | 2 (4%) | 5 (16%) | 3 (11%) | 3 (16%) | 0.34 |
| Treated by Sarilumab | 13 (29%) | 14 (45%) | 14 (44%) | 7 (37%) | 0.43 |
| Days from symptom onset to ICU admission | 14 (12–20) | 12 (9–15) | 11 (9–12) | 9 (7–12) | 0.0001 |
| Mortality | 12 (26%) | 4 (13%) | 11 (41%) | 11 (58%) | 0.005 |
| Days alive out of ICU at day 60 | 46 (0–54) | 52 (36–55) | 28 (0–46) | 0 (0–37) | 0.0003 |
PaO2 on FiO2 ratio is the ratio of arterial oxygen partial pressure (PaO2 in mmHg) to fractional inspired oxygen.
SAPS-2: simplified acute physiology score 2.
SOFA: sequential organ failure assessment.
Hypertension was significantly more frequent in non-survivors (79 vs 57%, p = 0.02). Survivors had lower ICU severity scores, lower serum creatinine levels and higher lymphocyte counts. The level of median plasmatic SARS-CoV-2 RNA was almost 8 times higher in non-survivors (p = 0.0062).
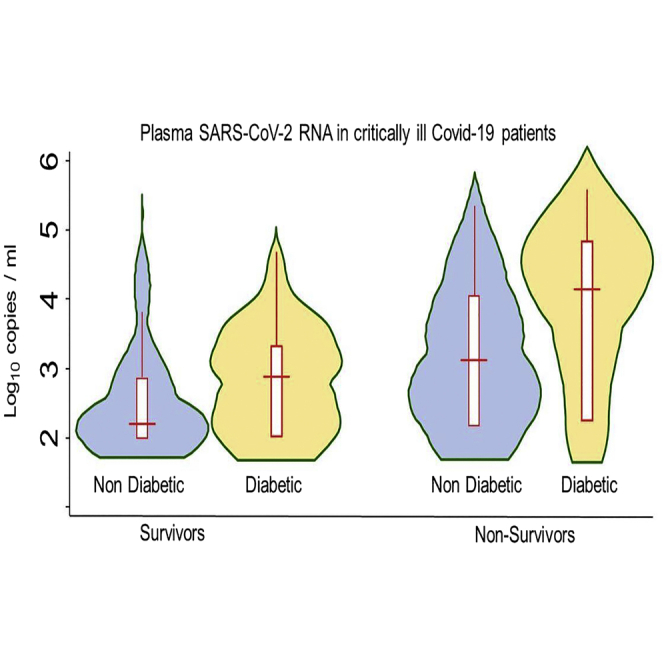
Patients with high and very high plasmatic SARS-CoV-2 RNA levels were diabetic in more than 50% of cases (p < 0.0001 vs low and medium RNA categories). Median (IQR) plasmatic SARS-CoV-2 RNAemia were 265 (0–1156) and 1544 (70–7518) copies/mL in nondiabetic and diabetic patients (p = 0.03), respectively. Plasmatic SARS-CoV-2 RNA levels according to the diabetic status and survival are shown in the graphical abstract.
Increasing plasma RNA categories were significantly associated with decreasing Neutrophil (p = 0.05) and Lymphocyte (p = 0.0046) counts (Table2).
Increasing plasmatic SARS-CoV-2 RNA levels were associated with lower neutrophil and lymphocyte counts. Patients with higher SARS-CoV-2 RNAemia had shorter intervals from symptom onset to ICU admission and lower levels of Anti-spike protein antibodies.
In the ordered logistic regression analysis including variables significantly associated with increasing plasmatic SARS-Cov-2 RNA categories (Table 3), diabetes, shorter intervals from symptom onset to ICU, higher d-dimer levels, and lower anti-spike antibodies were significantly related to higher levels of plasmatic SARS-CoV-2 RNA.
Table 3.
Ordered logistic regression for variables associated with increasing plasmatic SARS-Cov-2 RNA levels
| Variable | OR for a 10 fold (1 log10) increase in plasmatic SARS-CoV-2 RNA copies per mL | 95% Confidence Interval for odds ratio | P |
|---|---|---|---|
| Diabetes | 3.30 | 1.51 to 7.21 | 0.003 |
| Days from symptom onset to ICU (per day) | 0.83 | 0.76 to 0.91 | <0.001 |
| SOFA severity score | 1.03 | 0.86 to 1.23 | 0.75 |
| Neutrophil count (per 1 × 10⁹/L) | 0.96 | 0.85 to 1.08 | 0.46 |
| lymphocyte count (per 1 × 10⁹/L) | 0.74 | 0.47 to 1.17 | 0.19 |
| D-dimer (per mg/L) | 1.06 | 1.00 to 1.12 | 0.042 |
| Anti-Spike antibodies (per 1 log10 increase above 1 U/ml) | 0.44 | 0.29 to 0.67 | <0.001 |
SOFA: sequential organ failure assessment.
Variables having a significant association with higher plasmatic SARS-Cov-2 RNA levels in univariate analysis (Table 2) were included in the multivariable model.
In both multivariable logistic regression models, including previously published parameters associated with mortality (Table 4) or those observed in our cohort (Table 5), plasmatic SARS-CoV-2 RNA levels were independently associated with day-60 mortality.
Table 4.
Multivariable logistic regression model 1 for day-60 mortality, including previously published variables associated with mortality of COVID-19 critically ill patients (COVID-ICU Group on behalf of the REVA Network)
| Variable | Odds ratio for day 60 mortality | 95% Confidence Interval for Odds Ratio | P |
|---|---|---|---|
| Plasmatic SARS-Cov2 RNA, per 1 log10 increase above 2.5 (10 fold increase above 316 copies/mL) | 3.53 | 1.66 to 7.53 | 0.001 |
| Age, per year above 50 | 1.11 | 1.04 to 1.20 | 0.003 |
| eGFR, per ml above 40 (ml/min per 1.73 m2) | 0.98 | 0.96 to 0.99 | 0.028 |
| Immunosuppression | 1.52 | 0.25 to 9.22 | 0.61 |
| Body mass index ≥35 | 1.88 | 0.59 to 6.06 | 0.35 |
| Diabetes | 0.50 | 0.16 to 1.57 | 0.24 |
| Days from symptom onset to ICU (per day) | 1.07 | 1.00 to 1.14 | 0.048 |
| absolute lymphocyte count (per 1.0 × 10⁹/L) | 0.36 | 0.10 to 1.32 | 0.12 |
| PaO2 on FiO2 ratio ≤100 | 1.54 | 0.58 to 4.17 | 0.39 |
| Hemodynamic component of SOFA score ≥3 | 0.84 | 0.23 to 3.07 | 0.80 |
eGFR: estimated glomerular filtration rate.
PaO2 on FiO2 ratio is the ratio of arterial oxygen partial pressure (PaO2 in mmHg) to fractional inspired oxygen.
SOFA: sequential organ failure assessment.
Table 5.
Multivariable logistic regression model 2 for day-60 mortality, including the variables associated with mortality of our cohort in univariable analysis (Table 1)
| Variable | Odds ratio for day 60 mortality | 95% Confidence Interval for Odds Ratio | P |
|---|---|---|---|
| Plasmatic SARS-Cov2 RNA, per 1 log10 increase above 2.5 (10 fold increase above 316 copies/mL) | 2.45 | 1.30 to 4.65 | 0.006 |
| Age, per year above 50 | 1.10 | 1.03 to 1.17 | 0.003 |
| eGFR, per ml above 40 (ml/min per 1.73 m2) | 0.99 | 0.97 to 1.00 | 0.09 |
| SOFA severity score (per 1 point) | 1.10 | 0.90 to 1.36 | 0.36 |
| Hypertension | 1.75 | 0.60 to 5.11 | 0.30 |
| Lymphocyte count (per 1.0 × 10⁹/L) | 0.39 | 0.12 to 1.28 | 0.12 |
eGFR: estimated glomerular filtration rate.
PaO2 on FiO2 ratio is the ratio of arterial oxygen partial pressure (PaO2 in mmHg) to fractional inspired oxygen.
SOFA: sequential organ failure assessment.
Discussion
In this study of patients admitted to our ICU for severe COVID-19 disease, we found that plasmatic viral RNA level assessed by ddPCR was measurable in 74% of patients; high or very high in nearly 40% of patients; besides, the intensity of SARS-CoV-2 RNAemia was independently associated with day-60 mortality with a very strong relationship. We also observed that plasmatic SARS-CoV-2 RNA levels were notably higher in diabetic patients, even after adjustment on the interval between symptom onset and ICU admission (Table 3).
The inverse relationship between plasmatic SARS-CoV-2 RNA levels and anti-spike protein antibodies (Table 2) seems, at least partially, related to the higher interval between symptom onset and ICU admission in patients with higher levels of antibodies.
Several comorbidities including diabetes mellitus can result in a more severe course of COVID-19 that leads to higher mortality (Fleming et al., 2021; Guo et al., 2020; Kamyshnyi et al., 2020). However, to our knowledge, until now, a higher viral load in COVID-19 diabetic patients was not clearly described. Factors contributing to a higher severity of COVID-19 in diabetic patients may include increased inflammation and other comorbidities including hypertension, but the underlying pathophysiology of this increased risk is yet to be fully determined. It has been suggested that changes in the immunometabolism of lymphocytes, as is observed in diabetes, directly affect the course of the disease and thus point out the importance of glycemic control in people with COVID-19 infection (Pozzilli et al., 1987). Unlike bacterial infections, the physiological response in normal individuals to viral replication is activation of transcription factors including interferon regulatory factors and nuclear factor kappa B (NF-KB) (tenOever, 2016). This in turn leads to antiviral response by induction of type I interferon (IFN-I) and IFN-III (Lazear et al., 2019). One study showed that patients with diabetes had decreased antiviral response demonstrated by a diminished production of IFN-α (Summers et al., 2006). Another study performed on human peripheral blood mononuclear cells and human monocyte cell lines in vitro showed that hyperglycemia suppressed IFN-I production and that pre-exposure to high glucose concentrations rendered monocytes more sensitive to IFN-α stimulation with heightened signaling (Hu et al., 2018).Therefore, it is probable that patients with diabetes may have a defective host defense system against viral infections by impeding IFN-I production and signaling.
SARS-CoV-2 has a high affinity toward ACE2, and upon binding the virus, the complex is internalized resulting in intracellular replication of the virus (Jin et al., 2020). Hence, ACE2 acts as the “ receptor ” for SARS-CoV-2 and is the dominant path of the virus’s entry into the lungs and other cells in the body (Wan et al., 2020). Expression of ACE2 is increased in patients with diabetes and in response to elevated glucose levels (Bindom and Lazartigues, 2009).
These facts in part may explain the higher susceptibility of diabetic patients to contract a severe form of the disease. Unfortunately, we do not have data on the previous glycemic control of the patients included in our study and we have not measured glycated hemoglobin A1c on ICU or hospital admission. Thus, we cannot evaluate the relationship between previous glycemic levels and SARS-CoV-2 RNAemia. The association between diabetes and disease severity has already been highlighted in several studies (Huang et al., 2020). However, this association has been described mainly in infected populations before any selection of a severity justifying admission to intensive care. When patients with diabetes are compared to a nondiabetic population admitted to intensive care, the nondiabetic population having been selected on criteria of respiratory severity, the differences in mortality are probably attenuated, explaining the fact that diabetes is not associated with mortality in our ICU. Moreover, there is an interaction between diabetes, hypertension, and impaired renal function, and in fact, in our cohort, glomerular filtration is a more powerful predictor of mortality in both logistic regression models than diabetes.
Some prior studies have reported that cycle threshold values of nasopharyngeal swab samples were associated with the severity of the disease (Magleby et al., 2020; Pujadas et al., 2020), but these findings have been challenged by other groups (Le Borgne et al., 2021). In a recent randomized study, Remdesivir was associated with a significant reduction of Covid-19-related hospitalizations (0.7 vs 5.3%, p = 0.008) without any effect on nasopharyngeal viral load (Gottlieb et al., 2021); besides, in rhesus macaques infected with SARS-CoV-2, remdesivir reduced viral replication in the lower respiratory tract without any effect in the upper respiratory tract (Williamson et al., 2020). These data support the hypothesis that nasopharyngeal viral load may be not representative of the viral load in the lower respiratory tract. Plasmatic samples are easier to standardize and may be more representative of the viral replication rate throughout the whole body. Several published studies have already suggested that detection of SARS-CoV-2 RNA in the blood was predictive of the severity of the disease, without showing a clear relationship between the levels of plasmatic SARS-CoV-2 RNA copies and the mortality (Prebensen et al., 2021; Veyer et al., 2020). The relationship that we have observed may be explained by the greater severity of our patients and the precision provided by ddPCR technology. In fact, ddPCR technology is able to detect plasma SARS-CoV-2 RNA in a higher proportion of hospitalized patients than real-time PCR (Veyer et al., 2020).
The association between plasmatic SARS-CoV-2 RNAemia and mortality leads to several questions.
First, so far, antiviral therapies have been reserved for the early stages of the disease, mainly in noncritically ill patients. This is because of the lack of studies describing a clear efficacy of antiviral therapies in the most severe patients. However, as shown by our data, ICU COVID-19 patients have highly variable viral loads, and it is likely that the inclusion of a significant proportion of patients with a low level of viral replication in antiviral treatment studies may decrease the observed efficacy of these therapies. Therefore, it is reasonable to think that in the most severe forms of COVID-19, antiviral treatments should be evaluated in patients with a high level of SARS-CoV-2 RNAemia. Indeed, plasma SARS-CoV-2 RNA levels could be a reasonable estimation of whole body viral replication even if it only quantitates viral genome and not infectious viral particles. Given the relative limited efficiency of antiviral therapies, it is also reasonable to assume that combined therapies could be necessary in patients with high viral replication levels. Repeated measures of plasmatic SARS-CoV-2 RNA levels by a precise method like ddPCR may help to define the best combination of antiviral therapies for these patients in preliminary studies before larger trials on mortality.
Second, the efficacy of anti-inflammatory therapies such as systemic glucocorticoids (Rochwerg et al., 2020), anakinra (Kyriazopoulou et al., 2021), Janus kinase inhibitors (Marconi et al., 2021), and Interleukin-6 receptor antagonists (RECOVERY Collaborative Group, 2021; REMAP-CAP Investigators et al., 2021) on short-term mortality of COVID-19 patients has been described in large studies without any evaluation of viral replication rate or plasmatic SARS-CoV-2 RNA levels. The benefit observed with these treatments could be very different depending on the patient’s viral replication rate.
Limitations of the study
Our study has some limitations. We analyzed only the plasmatic viral RNA levels at the time of ICU admission and we could not assess viral load dynamics over time before and after ICU admission. However, we found that this single parameter at admission had important prognosis value and might lead to new therapeutic strategies.
Another limitation is that our study was retrospective and relied on data that were documented in the electronic medical record. However, the quality of the data collected is fairly robust, all data were double checked.
Last, as we previously evoked, we cannot be certain that plasmatic SARS-CoV-2 RNA level is a reliable reflection of the viral replication rate. However, plasma RNA seems to be a reasonable parameter for the evaluation of viral replication rate in other viral infections such as HIV (Antela et al., 2021) and may be more reliable than nasopharyngeal swabs.
Conclusion
In conclusion, we found that in severe COVID-19 patients, ICU admission plasmatic SARS-CoV-2 RNA levels, as determined by ddPCR, are notably higher in diabetic patients and are strongly associated with day-60 mortality. These findings could lead to a better selection of patients who could benefit from antiviral and anti-inflammatory therapies.
STAR★Methods
Key resources table
| REAGENT or RESOURCE | SOURCE | IDENTIFIER |
|---|---|---|
| Antibodies | ||
| anti-Androgen Receptor (441) | Santa Cruz | Cat# sc-7305 |
| anti-BAG1 (CC9E8) | Santa Cruz | Cat# sc-33704 |
| anti-β-actin | Santa Cruz | Cat# sc-47778 |
| Bacterial and virus strains | ||
| E. coli strain BL21 (DE3) | Invitrogen | Cat# EC0114 |
| E. coli strain DH5α | Invitrogen | Cat# EC0112 |
| Chemicals, peptides, and recombinant proteins | ||
| (FITC-VQRKRQKLMPGLRKRLRKFRNKKLENP LDYGSAWAAAAAQCRY) |
Peptide 2.0 Inc. | N/A |
| Control FITC-labeled NLS-CPP peptide | Peptide 2.0 Inc. | N/A |
| (Dulbecco’s Modified Eagle’s Medium) DMEM | Gibco | Cat# 41966-029 |
| Roswell Park Memorial Institute (RPMI) 1640 Without phenol red |
Gibco | Cat# 11875-085 Cat# 11835030 |
| Fetal Bovine Serum (FBS) | Gibco | Cat# 10270-106 |
| 5α-Androstan-17β-ol-3-on (Dihydrotestosterone) | Merck AG | Cat# A8380 |
| Penicillin- Streptomycin | Gibco | Cat# 15140122 |
| L-glutamine | Gibco | Cat# 25030081 |
| Fish water 60 μg/ml f.c. sea salts | Instant Ocean Spectrum Brands | Cat# SS15-10 |
| Dimethyl sulfoxide | Carl Roth | Cat# A994.2 |
| Passive lysis buffer | Promega | Cat# E1941 |
| FuGENE HD | Promega | Cat# E2311 |
| Dulbecco's phosphate buffered saline | Gibco | Cat# 14190094 |
| Glyglycin | Carl Roth | Cat# 3794.4 |
| Magnesium sulphate heptahydrate | Carl Roth | Cat# P027.1 |
| 1,4-Dithiothreitol | Carl Roth | Cat# 6908.2 |
| Adenosine-5′-triphosphate-disodium salt | Carl Roth | Cat# HN35.2 |
| D-Luciferin Firefly | Biosynth/Carbosynth | Cat# L-8200 |
| EGTA | Carl Roth | Cat# 3054.1 |
| Potassium dihydrogen phosphate | Carl Roth | Cat# P018.1 |
| di-Potassium hydrogen phosphate | Carl Roth | Cat# P749.1 |
| Sodium chloride | Carl Roth | Cat# 3957.2 |
| Ethylenediamine tetraacetic acid disodium salt dihydrate | Carl Roth | Cat# 8043.1 |
| Coelenterazine | Biosynth/Carbosynth | Cat# C-7002 |
| Hoechst stain 33258 | abcam | Cat# ab228550 |
| Hoechst stain 33342 | Invitrogen | Cat# 62249 |
| 3-(4,5-dimethylthiazol-2-yl)-2,5-diphenyltetrazolium bromide (MTT) | Sigma-Aldrich | Cat# 1.11714 |
| 2-propanol | Carl Roth | Cat# 9866.1 |
| Crystal Violet | SERVA | Cat# 27335.01 |
| Methanol | Carl Roth | Cat# 8388.3 |
| 2′7-dichlorofluorescein diacetate | Thermo Fisher | Cat# D399 |
| R1881 (Metribolone) | Sigma-Aldrich | Cat# R0908 |
| Enzalutamide (MDV3100) | Selleckchem | Cat# S1250 |
| Ammonium Chloride (15N) | Cambridge Isotope Laboratories | Cat# NLM-467-10 |
| 2-amino-4-(trifluoromethyl)benzenethiol; hydron; chloride | Sigma-Aldrich | Cat# 365734 |
| 4-fluorobenzoyl chloride | Sigma-Aldrich | Cat# 119946 |
| dioxane | Fisher Scientific | Cat# 10141470 |
| methylene chloride | Fisher Scientific | Cat# 10616642 |
| NaHCO3 | Fisher Scientific | Cat# 10553325 |
| Na2SO4 | Fisher Scientific | Cat# 10032590 |
| Celite | Fisher Scientific | Cat# 10316691 |
| cyclohexane | VWR | Cat# 23224.327 |
| ethyl acetate | VWR | Cat# 23882.330 |
| Silica gel | Interchim | Cat# OV004A |
| corn oil | Sigma Aldrich | Cat# C8267 |
| Matrigel | Corning | Cat# 354248 |
| Critical commercial assays | ||
| Venor®GeM Classic Mycoplasma Detection Kit | Minerva Biolabs | Cat# 11-1250 |
| InnuPrep RNA Mini Kit 2. | Analytik Jena | Cat# 845-KS-2040250 |
| NEBNext® UltraTM RNA Library Prep Kit | New England Biolabs | Cat# E7530L |
| PE Cluster Kit cBot-HS | Illumina - Novogene | |
| M-MLV Reverse Transcriptase | Promega | Cat# M1701 |
| SYBR Green GoTaq PCR mix | Promega | Cat# A6002 |
| Deposited data | ||
| The RNA-seq data deposited at the GEO repository |
This study This study |
GSE89939 GSE159606 GSE182278 |
| Experimental models: Cell lines | ||
| LNCaP | ATCC | Cat# CRL-1740 |
| LNCaP-95 | ||
| LAPC-4 | ATCC | Cat# CRL-13009 |
| HeLa | ATCC | Cat# CCL-2 |
| MCF-7 | ATCC | Cat# HTB-22 |
| ZR75-1 | ATCC | Cat# CRL-1500 |
| MDA-MB-231 | ATCC | Cat# HTB-26 |
| LNCaP control and BAG1LKO cells | N/A | |
| Experimental models: Organisms/strains | ||
| Zebrafish wild-type AB strain | EZRC | #1175 |
| Male athymic nude-Foxn1nu mice | Envigo | #6901M |
| Oligonucleotides | ||
| Rib36B4 For | 5′-CTCCTGAGCGCAAGTACTCC-3′ | metabion |
| Rib36B4 Rev | 5′-GTCACCTTCACCGTTGTTCCA-3′ | metabion |
| KLK3 For | 5’-CCCGGTTGTCTTCCTCACCC-3′ | metabion |
| KLK3 Rev | 5’-GCCTCCCACAATCCGAGACA-3′ | metabion |
| F5 For | 5′-TCCAGGCCGAGAATACACCTA-3′ | metabion |
| F5 Rev | 5′-CGATTTGCTTGTCAAACGTCTTC-3′ | metabion |
| DUOX1 For | 5′-GTGCTCCCTCTGTTGTTCGT-3′ | metabion |
| DUOX1 Rev | 5′-GCTTCTCAGACACGATGCTCT-3′ | metabion |
| MICAL1 For | 5′-ATGGGCAGCCTGATGTCTCT-3′ | metabion |
| MICAL1 Rev | 5′-GGCGCCATGCTTCTCTTG-3′ | metabion |
| NNT For | 5′-TGGTCAAGCAGGGTTTTAATGT-3′ | metabion |
| NNT Rev | 5′-TCCTTTGCCCCTTGGATTTGG-3′ | metabion |
| BAG1 For | 5′-GGTGACCAGGGAGGAAATGG-3′ | metabion |
| BAG1 Rev | 5′-GTGCTGACAACGGTGTTTCC-3′ | metabion |
| AR For | 5′-AGCGACTTCACCGCACCT-3′ | metabion |
| AR Rev | 5′-GTTTCCCTTCAGCGGCTCTTTT-3′ | metabion |
| FKBP5 For | 5′-TTCAAGGGAGGCAAATACATG-3′ | metabion |
| FKBP5 Rev | 5′-TCCAAGGGCCTTGTCACAG-3′ | metabion |
| SLC7A11 For | 5′-ATGCAGTGGCAGTGACCTTT-3′ | metabion |
| SLC7A11 Rev | 5′-CATGGAGCCAAAGCAGGAGA-3′ | metabion |
| HMOX1 For | 5′-ACTGCGTTCCTGCTCAACAT-3′ | metabion |
| HMOX1 Rev | 5′-GGGGCAGAATCTTGCACTTT-3′ | metabion |
| S100P For | 5′-CATGGGCATGATCATAGACGTCTTTT-3′ | metabion |
| S100P Rev | 5′-AATTTATCCACGGCATCCTTGTCTTTT-3′ | metabion |
| FTH1 For | 5′-CGCCAGAACTACCACCAG-3′ | metabion |
| FTH1 Rev | 5′-TTCAAAGCCACATCATCG-3′ | metabion |
| OSGIN For | 5′-AGAAGAAGCGAAGAGGTC-3′ | metabion |
| OSGIN Rev | 5′-CGGACACAAAGTTATGCC-3′ | metabion |
| Recombinant DNA | ||
| pG5 ΔE4 luc | N/A | |
| Ubi-Renilla luciferase | N/A | |
| pM AR τ5 | N/A | |
| pcDNA3.1 | Thermo Fisher | Cat# V79020 |
| pcDNA3.1 BAG1L | N/A | |
| VP-16 | Clontech | Cat# 630305 |
| VP-16 BAG1L | Katia Jehle | N/A |
| AR-mEos2 | Emmanuel Oppong | N/A |
| Software and algorithms | ||
| ImageJ | https://imagej.nih.gov/ij/download.html | |
| ColonyArea | N/A | |
| GraphPad Prism8 | GraphPad | https://www.graphpad.com/ |
| SoftMax Pro 7 | Molecular Devices | N/A |
| GSEA Software v4.1.0 | http://www.gsea-msigdb.org/gsea/login.jsp; jsessionid = 3B86CA472E2D1D71844F8EC8F4872140 | |
| Image Lab | Bio-Rad | https://www.bio-rad.com/de-de/product/image-lab-software?ID=KRE6P5E8Z |
Resource availability
Lead contact
Further information and requests for resources and reagents should be directed to and will be fulfilled by the lead contact Hélène Péré (helene.pere@aphp.fr)
Materials availability
This study did not generate unique reagents or materials.
Experimental model and subject details
Human subjects and study setting
This retrospective, observational study consisted of all COVID-19 patients who were admitted in the 34-bed ICU of our hospital, in the Great-Paris area (France), during the third wave of COVID-19 pandemic (from March 04, 2021 to June 22, 2021).
The study was conducted in accordance with the Declaration of Helsinki and national and institutional standards. The study was approved by” Société de reanimation de Langue Française” Review Board. According to French law, the non-interventional nature of the study required only the absence of patients’ opposition for data abstraction with a waiver of informed consent (Deplanque et al., 2017).
Patient characteristics, laboratory data, and clinical outcomes were collected through the software used in routinely daily activity (Sillage v17.2.4.5 and CGM Lab channel 1.20.33686).
Data were retrospectively abstracted manually from the electronic medical record using a quality-controlled protocol. Data collectors were trained, and each parameter was checked by two data collectors.
Method details
Data included age, gender, body mass index (BMI), diabetes, hypertension, immunodeficiency, simplified acute physiology score II (SAPS-2) (Le Gall, 1993), Sequential Organ Failure Assessment (SOFA) severity score (Vincent et al., 1996), ICU duration of stay and mortality at day 60 of ICU admission. Immunodeficiency was defined as hematological malignancies, active solid tumor, having received specific anti-tumor treatment within a year, solid-organ transplant, human immunodeficiency virus, or having received immunosuppressant drugs within 3 months. The following laboratory parameters were collected within 12 h of ICU admission: PaO2 on FiO2 ratio, neutrophil count, lymphocyte count, D-dimer, plasma creatinine, CRP, plasmatic SARS-CoV-2 RNA and anti-Spike protein antibodies. Estimated glomerular filtration rate (eGFR) was calculated using the MDRD formula (Levey, 1999).
Anti-SARS-CoV-2 antibodies
Anti-SARS-CoV-2 Spike protein antibodies were measured within 24 h of ICU admission using the Elecsys Anti-SARS-CoV-2 S immunoassay (Roche Diagnostics GmbH). The Elecsys Anti-SARS-CoV-2 S assay detects high-affinity antibodies to the SARS-CoV-2 Spike protein and has a low risk of detecting weakly cross-reactive and unspecific antibodies. Results are automatically reported in U/mL, with <0.80 U/mL interpreted as negative for anti-SARS-CoV-2 Spike antibodies (Riester et al., 2021).
Quantification of SARS-CoV-2 RNAemia
Plasma samples were extracted using the Cellfree200 V7 DSP 200 protocol with the QIAsymphony® DSP virus/pathogen mini kit (QIAGEN, UK). Samples loaded onto the QIAsymphony® SP as instructed by the manufacturer, with a 200 μl sample input volume (composed of 150μl of plasma and 50μl of NaCl) and 60 μl elution output volume of AVE buffer, unless stated (QIAGEN, UK). SARS-CoV-2 RT-ddPCR assays were performed using the One-Step RT-ddPCR Advanced Kit for 90 Probes (Bio-Rad Laboratories, Hercules, CA, USA) and the QX200 ddPCR platform (Biorad). A 2-plex RT-ddPCR assay was developed, which targets the Nucleocapside (N1) gene of the SARS-CoV-2 positive-strand RNA genome with specific FAM- probe and primers Cy5-labeled probe for the detection of a human housekeeping gene (RNAseP). RNAseP positivity was necessary to validate the RT-PCR assay prior to any further analysis. Briefly, 9.9 μL of extracted RNA was diluted in a 22 μL final reaction volume containing 5.5 μL of One Step SuperMix, 2.2 μL of Reverse Transcriptase, 1.1 μL of 300mM DTT (One-Step RT-ddPCR Advanced Kit for Probes, Bio-Rad),1.1 μL of primers and probes mix (final probe concentration: 200 nM each, final primer concentration: 600 nM each) and 2.2 μL (QS) of nuclease-free water. Then, each sample was primarily partitioned into 13000 to 20000 droplets using the QX200™ Droplet Generator™ (Bio-Rad). PCR amplification was then performed on a C1000 Touch™ thermal cycler (Bio-Rad). This protocol included an initial retro-transcription step (60 min, 50°C, and 10 min, 95°C) followed by 45 cycles of cDNA amplification, each cycle including a denaturation step (94°C for 30 s) and a step of annealing and extension at (55.6°C for 1 min). A final denaturation step was realized at 98°C for 10 min. Then the final step of the run was performed at 4°C for 30 min for droplet stabilization. The droplet reading and quantification were performed using the QX200™ Droplet Reader™ and data analysis was performed using the QuantaSoft™ Analysis Pro software (Bio-Rad).
Plasmatic samples are considered of positive SARS-CoV2 RNA if RNAseP concentration was detected above 3.4 log copies per mL and SARS-CoV-2 RNA concentration above the assay limit of detection of 70 copies per mL.
Plasmatic SARS-CoV-2 levels were classified according to base 10 logarithm values and considered as low (≤100 copies/ml, including values below the limit of detection), medium (101–1000), high (1001–10,000) and very high (>10,000).
Quantification and statistical analysis
Continuous variables were represented with medians and interquartile ranges (IQR) and categorical variables were represented as proportions.
We compared baseline characteristics association with day-60 survival status and Plasmatic RNA categories. For these analyses, we used nonparametric Mann-Whitney or Kruskal-Wallis tests for continuous variables and chi-square tests for categorical data.
Variables significantly associated with increasing plasma RNA ordered categories (low, medium, high, very high) were included in a multivariable ordered logistic regression model and adjusted odds for each 10-fold increase of plasma SARS-Cov-2 RNA levels were determined for each parameter.
We then considered plasmatic SARS-Cov-2 RNA and variables previously described to be associated with COVID-19 outcome in ICU patients (COVID-ICU Group on behalf of the REVA Network and the COVID-ICU Investigators, 2021) for their association with day-60 mortality using a multivariable logistic regression. The previously described variables were age, immunodeficiency, BMI≥35, diabetes, days from symptoms to ICU admission, hemodynamic component of SOFA score ≥3, renal insufficiency, PaO2 on FiO2 ratio ≤100 and lymphocyte count ≤1.0 × 10⁹/L. For this analysis, to assess the relationship between each numerical variable and mortality, we first plotted continuous variables against mortality at day 60, using the lowest smoothing function with locally weighted least squares. The results of these analysis indicated that age (above 50), eGFR (above 40 ml/min per 1.73 m2), plasmatic SARS-Cov-2 RNA (above 2.5 base 10 logarithmic copies per ml) and lymphocyte counts were near linearly associated with mortality (Figures S1–S4). These variables were then entered into a multivariable logistic regression model and adjusted odds ratios of mortality were calculated for each of these variables with 95% confidence intervals (CIs) (Hosmer et al., 2013). A second multivariable logistic regression model was calculated using SARS-Cov-2 RNAemia and variables associated with day-60 survival status in univariable analysis of our cohort. For this second multivariable analysis, we choose to include the SOFA score instead of the SAPS-2 score because the SAPS-2 score includes an age component and age was included in the model.
Analyses were conducted using Stata, version 13.0. (Stata corp, college station, Texas). p values less than 0.05 were considered statistically significant. All statistical tests were two-tailed.
Acknowledgments
The authors acknowledge the work of the clinical laboratory scientists who performed the severe acute respiratory syndrome coronavirus 2 laboratory testing. Funding: This work was supported by the Groupe Hospitalier Sud-Ile-de-France.
Author contributions
M.M. initiated the project and drafted the manuscript. T.B., D.V., A.P., M.P., and V.T. conceptualized and performed plasma measurements by ddPCR. S.J., O.E., O.S., and S.M. processed, analyzed, and interpreted the data. H.P. supervised the project and edited the manuscript.
Declaration of interests
H.P., D.V., and V.T. have a patent related to the present work to declare: PCT/EP2021/064575 “QUANTIFICATION OF CORONAVIRUS RNAemia".
Published: May 20, 2022
Footnotes
Supplemental information can be found online at https://doi.org/10.1016/j.isci.2022.104075.
Contributor Information
Mehran Monchi, Email: mehran.monchi@ghsif.fr.
Hélène Péré, Email: helene.pere@aphp.fr.
Supplemental information
Data and code availability
De-identified human participant research data used in this analysis was granted for this analysis, and further data sharing is restricted and is not publically available. No standardized data types are reported in this manuscript. Data requests can be submitted to the lead contact. These requests are assessed on a case-by-case basis and require an agreement of the Institutional Review Board. Summary statistics have been reported in the main Manuscript.
Any additional information required to reanalyze the data reported in this paper is available from the lead contact upon request.
References
- Antela A., Rivero A., Llibre J.M., Moreno S., the RET Group. Antela A., Llibre J.M., Moreno S., Rivero A., Alonso Montero M., Bernal E., et al. Redefining therapeutic success in HIV patients: an expert view. J. Antimicrob. Chemother. 2021;76:2501–2518. doi: 10.1093/jac/dkab168. [DOI] [PMC free article] [PubMed] [Google Scholar]
- Bermejo-Martin J.F., González-Rivera M., Almansa R., Micheloud D., Tedim A.P., Domínguez-Gil M., Resino S., Martín-Fernández M., Ryan Murua P., Pérez-García F., et al. Viral RNA load in plasma is associated with critical illness and a dysregulated host response in COVID-19. Crit. Care. 2020;24:691. doi: 10.1186/s13054-020-03398-0. [DOI] [PMC free article] [PubMed] [Google Scholar]
- Bindom S.M., Lazartigues E. The sweeter side of ACE2: physiological evidence for a role in diabetes. Mol. Cell Endocrinol. 2009;302:193–202. doi: 10.1016/j.mce.2008.09.020. [DOI] [PMC free article] [PubMed] [Google Scholar]
- Blanco-Melo D., Nilsson-Payant B.E., Liu W.-C., Uhl S., Hoagland D., Møller R., Jordan T.X., Oishi K., Panis M., Sachs D., et al. Imbalanced host response to SARS-CoV-2 drives development of COVID-19. Cell. 2020;181:1036–1045.e9. doi: 10.1016/j.cell.2020.04.026. [DOI] [PMC free article] [PubMed] [Google Scholar]
- COVID-ICU Group on behalf of the REVA Network and the COVID-ICU Investigators Clinical characteristics and day-90 outcomes of 4244 critically ill adults with COVID-19: a prospective cohort study. Intensive Care Med. 2021;47:60–73. doi: 10.1007/s00134-020-06294-x. [DOI] [PMC free article] [PubMed] [Google Scholar]
- Deplanque D., Sénéchal-Cohen S., Lemaire F., Bertoye P.-H., Bureau S., Callies I., Chassany O., Comet D., Dubray C., Duchossoy L., et al. French Jardé’s law and European regulation on drug trials: harmonization and implementation of new rules. Therapies. 2017;72:73–80. doi: 10.1016/j.therap.2016.12.006. [DOI] [PubMed] [Google Scholar]
- Eberhardt K.A., Meyer-Schwickerath C., Heger E., Knops E., Lehmann C., Rybniker J., Schommers P., Eichenauer D.A., Kurth F., Ramharter M., et al. RNAemia corresponds to disease severity and antibody response in hospitalized COVID-19 patients. Viruses. 2020;12:1045. doi: 10.3390/v12091045. [DOI] [PMC free article] [PubMed] [Google Scholar]
- Fleming N., Sacks L.J., Pham C.T., Neoh S.L., Ekinci E.I. An overview of COVID-19 in people with diabetes: pathophysiology and considerations in the inpatient setting. Diabetic Med. 2021;38 doi: 10.1111/dme.14509. [DOI] [PMC free article] [PubMed] [Google Scholar]
- Gottlieb R.L., Vaca C.E., Paredes R., Mera J., Webb B.J., Perez G., Oguchi G., Ryan P., Nielsen B.U., Brown M., et al. Early remdesivir to prevent progression to severe covid-19 in outpatients. N. Engl. J. Med. 2021 doi: 10.1056/NEJMoa2116846. NEJMoa2116846. [DOI] [PMC free article] [PubMed] [Google Scholar]
- Grasselli G., Zangrillo A., Zanella A., Antonelli M., Cabrini L., Castelli A., Cereda D., Coluccello A., Foti G., Fumagalli R., et al. COVID-19 lombardy ICU Network, 2020. Baseline characteristics and outcomes of 1591 patients infected with SARS-CoV-2 admitted to ICUs of the lombardy region. Italy. JAMA. 2020;323:1574–1581. doi: 10.1001/jama.2020.5394. [DOI] [PMC free article] [PubMed] [Google Scholar]
- Guo W., Li M., Dong Y., Zhou H., Zhang Z., Tian C., Qin R., Wang H., Shen Y., Du K., et al. Diabetes is a risk factor for the progression and prognosis of Covid-19. Diabetes/Metabolism Res. Rev. 2020;36 doi: 10.1002/dmrr.3319. [DOI] [PMC free article] [PubMed] [Google Scholar]
- Hogan C.A., Stevens B.A., Sahoo M.K., Huang C., Garamani N., Gombar S., Yamamoto F., Murugesan K., Kurzer J., Zehnder J., Pinsky B.A. High frequency of SARS-CoV-2 RNAemia and association with severe disease. Clin. Infect. Dis. 2021;72:e291–e295. doi: 10.1093/cid/ciaa1054. [DOI] [PMC free article] [PubMed] [Google Scholar]
- Hosmer D.W., Lemeshow S., Sturdivant R.X. Wiley series in probability and statistics. Wiley; 2013. Applied logistic regression; p. 3. [Google Scholar]
- Hu R., Xia C.-Q., Butfiloski E., Clare-Salzler M. Effect of high glucose on cytokine production by human peripheral blood immune cells and type I interferon signaling in monocytes: implications for the role of hyperglycemia in the diabetes inflammatory process and host defense against infection. Clin. Immunol. 2018;195:139–148. doi: 10.1016/j.clim.2018.06.003. [DOI] [PMC free article] [PubMed] [Google Scholar]
- Huang I., Lim M.A., Pranata R. Diabetes mellitus is associated with increased mortality and severity of disease in COVID-19 pneumonia – a systematic review, meta-analysis, and meta-regression. Diabetes Metab. Syndr. Clin. Res. Rev. 2020;14:395–403. doi: 10.1016/j.dsx.2020.04.018. [DOI] [PMC free article] [PubMed] [Google Scholar]
- Jin Y., Yang H., Ji W., Wu W., Chen S., Zhang W., Duan G. Virology, epidemiology, pathogenesis, and control of COVID-19. Viruses. 2020;12:E372. doi: 10.3390/v12040372. [DOI] [PMC free article] [PubMed] [Google Scholar]
- Kamyshnyi A., Krynytska I., Matskevych V., Marushchak M., Lushchak O. Arterial hypertension as a risk comorbidity associated with COVID-19 pathology. Int. J. Hypertens. 2020;2020:1–7. doi: 10.1155/2020/8019360. [DOI] [PMC free article] [PubMed] [Google Scholar]
- Kawasuji H., Morinaga Y., Tani H., Yoshida Y., Takegoshi Y., Kaneda M., Murai Y., Kimoto K., Ueno A., Miyajima Y., et al. SARS-CoV-2 RNAemia with a higher nasopharyngeal viral load is strongly associated with disease severity and mortality in patients with COVID-19. J. Med. Virol. 2022;94:147–153. doi: 10.1002/jmv.27282. [DOI] [PMC free article] [PubMed] [Google Scholar]
- Kyriazopoulou E., Poulakou G., Milionis H., Metallidis S., Adamis G., Tsiakos K., Fragkou A., Rapti A., Damoulari C., Fantoni M., et al. Early treatment of COVID-19 with anakinra guided by soluble urokinase plasminogen receptor plasma levels: a double-blind, randomized controlled phase 3 trial. Nat. Med. 2021;27:1752–1760. doi: 10.1038/s41591-021-01499-z. [DOI] [PMC free article] [PubMed] [Google Scholar]
- Lazear H.M., Schoggins J.W., Diamond M.S. Shared and distinct functions of type I and type III interferons. Immunity. 2019;50:907–923. doi: 10.1016/j.immuni.2019.03.025. [DOI] [PMC free article] [PubMed] [Google Scholar]
- Le Borgne P., Solis M., Severac F., Merdji H., Ruch Y., Alamé Intern K., Bayle E., Hansmann Y., Bilbault P., Fafi-Kremer S., Meziani F., for the CRICS TRIGGERSEP Group (Clinical Research in Intensive Care and Sepsis Trial Group for Global Evaluation and Research in Sepsis) SARS-CoV-2 viral load in nasopharyngeal swabs in the emergency department does not predict COVID-19 severity and mortality. Acad. Emerg. Med. 2021;28:306–313. doi: 10.1111/acem.14217. [DOI] [PMC free article] [PubMed] [Google Scholar]
- Le Gall J.R. A new Simplified Acute Physiology Score (SAPS II) based on a European/North American multicenter study. JAMA: J. Am. Med. Assoc. 1993;270:2957–2963. doi: 10.1001/jama.270.24.2957. [DOI] [PubMed] [Google Scholar]
- Levey A.S. A more accurate method to estimate glomerular filtration rate from serum creatinine: a new prediction equation. Ann. Intern. Med. 1999;130:461. doi: 10.7326/0003-4819-130-6-199903160-00002. [DOI] [PubMed] [Google Scholar]
- Magleby R., Westblade L.F., Trzebucki A., Simon M.S., Rajan M., Park J., Goyal P., Safford M.M., Satlin M.J. Impact of SARS-CoV-2 viral load on risk of intubation and mortality among hospitalized patients with coronavirus disease 2019. Clin. Infect. Dis. 2020:Ciaa851. doi: 10.1093/cid/ciaa851. [DOI] [PMC free article] [PubMed] [Google Scholar]
- Marconi V.C., Ramanan A.V., de Bono S., Kartman C.E., Krishnan V., Liao R., Piruzeli M.L.B., Goldman J.D., Alatorre-Alexander J., de Cassia Pellegrini R., et al. COV-BARRIER Study Group Efficacy and safety of baricitinib for the treatment of hospitalised adults with COVID-19 (COV-BARRIER): a randomised, double-blind, parallel-group, placebo-controlled phase 3 trial. Lancet Respir. Med. 2021;9 doi: 10.1016/S2213-2600(21)00331-3. [DOI] [PMC free article] [PubMed] [Google Scholar]
- Pozzilli P., Pagani S., Arduini P., Visalli N., Cioccia G.P., Negri M., Andreani D. In vivo determination of cell mediated immune response in diabetic patients using a multiple intradermal antigen dispenser. Diabetes Res. 1987;6:5–8. [PubMed] [Google Scholar]
- Prebensen C., Myhre P.L., Jonassen C., Rangberg A., Blomfeldt A., Svensson M., Omland T., Berdal J.-E. Severe acute respiratory syndrome coronavirus 2 RNA in plasma is associated with intensive care unit admission and mortality in patients hospitalized with coronavirus disease 2019. Clin. Infect. Dis. 2021;73:e799–e802. doi: 10.1093/cid/ciaa1338. [DOI] [PMC free article] [PubMed] [Google Scholar]
- Pujadas E., Chaudhry F., McBride R., Richter F., Zhao S., Wajnberg A., Nadkarni G., Glicksberg B.S., Houldsworth J., Cordon-Cardo C. SARS-CoV-2 viral load predicts COVID-19 mortality. Lancet Respir. Med. 2020;8:e70. doi: 10.1016/S2213-2600(20)30354-4. [DOI] [PMC free article] [PubMed] [Google Scholar]
- Ram-Mohan N., Kim D., Zudock E.J., Hashemi M.M., Tjandra K.C., Rogers A.J., Blish C.A., Nadeau K.C., Newberry J.A., Quinn J.V., et al. Stanford COVID-19 Biobank Study Group SARS-CoV-2 RNAemia predicts clinical deterioration and extrapulmonary complications from COVID-19. Clin. Infect. Dis. 2021:ciab394. doi: 10.1093/cid/ciab394. [DOI] [PMC free article] [PubMed] [Google Scholar]
- RECOVERY Collaborative Group Tocilizumab in patients admitted to hospital with COVID-19 (RECOVERY): a randomised, controlled, open-label, platform trial. Lancet. 2021;397:1637–1645. doi: 10.1016/S0140-6736(21)00676-0. [DOI] [PMC free article] [PubMed] [Google Scholar]
- REMAP-CAP Investigators. Gordon A.C., Mouncey P.R., Al-Beidh F., Rowan K.M., Nichol A.D., Arabi Y.M., Annane D., Beane A., van Bentum-Puijk W., et al. Interleukin-6 receptor antagonists in critically ill patients with covid-19. N. Engl. J. Med. 2021;384:1491–1502. doi: 10.1056/NEJMoa2100433. [DOI] [PMC free article] [PubMed] [Google Scholar]
- Riester E., Findeisen P., Hegel J.K., Kabesch M., Ambrosch A., Rank C.M., Pessl F., Laengin T., Niederhauser C. Performance evaluation of the roche Elecsys anti-SARS-CoV-2 S immunoassay. J. Virol. Methods. 2021;297:114271. doi: 10.1016/j.jviromet.2021.114271. [DOI] [PMC free article] [PubMed] [Google Scholar]
- Rochwerg B., Agarwal A., Siemieniuk R.A., Agoritsas T., Lamontagne F., Askie L., Lytvyn L., Leo Y.-S., Macdonald H., Zeng L., et al. A living WHO guideline on drugs for covid-19. BMJ. 2020;370:m3379. doi: 10.1136/bmj.m3379. [DOI] [PubMed] [Google Scholar]
- Summers K.L., Marleau A.M., Mahon J.L., McManus R., Hramiak I., Singh B. Reduced IFN-alpha secretion by blood dendritic cells in human diabetes. Clin. Immunol. 2006;121:81–89. doi: 10.1016/j.clim.2006.05.015. [DOI] [PubMed] [Google Scholar]
- tenOever B.R. The evolution of antiviral defense systems. Cell Host Microbe. 2016;19:142–149. doi: 10.1016/j.chom.2016.01.006. [DOI] [PubMed] [Google Scholar]
- The Massachusetts Consortium for Pathogen Readiness. Fajnzylber J., Regan J., Coxen K., Corry H., Wong C., Rosenthal A., Worrall D., Giguel F., Piechocka-Trocha A., Atyeo C., et al. SARS-CoV-2 viral load is associated with increased disease severity and mortality. Nat. Commun. 2020;11:5493. doi: 10.1038/s41467-020-19057-5. [DOI] [PMC free article] [PubMed] [Google Scholar]
- Veyer D., Kernéis S., Poulet G., Wack M., Robillard N., Taly V., L’Honneur A.-S., Rozenberg F., Laurent-Puig P., Bélec L., et al. Highly sensitive quantification of plasma severe acute respiratory syndrome coronavirus 2 RNA sheds light on its potential clinical value. Clin. Infect. Dis. 2020:Ciaa1196. doi: 10.1093/cid/ciaa1196. [DOI] [PMC free article] [PubMed] [Google Scholar]
- Vincent J.-L., Moreno R., Takala J., Willatts S., De Mendonça A., Bruining H., Reinhart C.K., Suter P.M., Thijs L.G. The SOFA (Sepsis-related organ failure assessment) score to describe organ dysfunction/failure: on behalf of the working group on sepsis-related problems of the European society of intensive care medicine (see contributors to the project in the appendix) Intensive Care Med. 1996;22:707–710. doi: 10.1007/BF01709751. [DOI] [PubMed] [Google Scholar]
- Wan Y., Shang J., Graham R., Baric R.S., Li F. Receptor recognition by the novel coronavirus from wuhan: an analysis based on decade-long structural studies of SARS coronavirus. J. Virol. 2020;94 doi: 10.1128/JVI.00127-20. e00127-20. [DOI] [PMC free article] [PubMed] [Google Scholar]
- Williamson B.N., Feldmann F., Schwarz B., Meade-White K., Porter D.P., Schulz J., van Doremalen N., Leighton I., Yinda C.K., Pérez-Pérez L., et al. Clinical benefit of remdesivir in rhesus macaques infected with SARS-CoV-2. Nature. 2020;585:273–276. doi: 10.1038/s41586-020-2423-5. [DOI] [PMC free article] [PubMed] [Google Scholar]
- Zheng S., Fan J., Yu F., Feng B., Lou B., Zou Q., Xie G., Lin S., Wang R., Yang X., et al. Viral load dynamics and disease severity in patients infected with SARS-CoV-2 in Zhejiang province, China, January-March 2020: retrospective cohort study. BMJ. 2020:m1443. doi: 10.1136/bmj.m1443. [DOI] [PMC free article] [PubMed] [Google Scholar]
- Zhu N., Zhang D., Wang W., Li X., Yang B., Song J., Zhao X., Huang B., Shi W., Lu R., et al. A novel coronavirus from patients with pneumonia in China, 2019. N. Engl. J. Med. 2020;382:727–733. doi: 10.1056/NEJMoa2001017. [DOI] [PMC free article] [PubMed] [Google Scholar]
Associated Data
This section collects any data citations, data availability statements, or supplementary materials included in this article.
Supplementary Materials
Data Availability Statement
De-identified human participant research data used in this analysis was granted for this analysis, and further data sharing is restricted and is not publically available. No standardized data types are reported in this manuscript. Data requests can be submitted to the lead contact. These requests are assessed on a case-by-case basis and require an agreement of the Institutional Review Board. Summary statistics have been reported in the main Manuscript.
Any additional information required to reanalyze the data reported in this paper is available from the lead contact upon request.