Abstract
We report the design and development of a compact optical fiber-based apparatus for in situ time-resolved laser-induced fluorescence spectroscopy (tr-LIFS) of biological systems. The apparatus is modular, optically robust, and compatible with the clinical environment. It incorporates a dual output imaging spectrograph, a gated multichannel plate photomultiplier (MCP-PMT), an intensified charge-coupled-device (ICCD) camera, and a fast digitizer. It can accommodate various types of light sources and optical fiber probes for selective excitation and remote light delivery/collection as required by different applications. The apparatus allows direct recording of the entire fluorescence decay with high sensitivity (nM range fluorescein dye concentration with signal-to-noise ratio of 46) and with four decades dynamic range. It is capable of resolving a broad range of fluorescence lifetimes from hundreds of picoseconds (as low as 300 ps) using the MCP-PMT coupled to the digitizer to milliseconds using the ICCD. The data acquisition and analysis process is fully automated, enabling fast recording of fluorescence intensity decay across the entire emission spectrum (0.8 s per wavelength or ~40 s for a 200 nm wavelength range at 5 nm increments). The spectral and temporal responses of the apparatus were calibrated and its performance was validated using fluorescence lifetime standard dyes (Rhodamin B, 9-cyanoanthracene, and rose Bengal) and tissue endogenous fluorophores (elastin, collagen, nicotinamide adenine dinucleotide, and flavin adenine dinucleotide). Fluorescence decay lifetimes and emission spectra of all tested compounds measured with the current tr-LIFS apparatus were found in good agreement with the values reported in the literature. The design and performance of tr-LIFS apparatus have enabled in vivo studies of atherosclerotic plaques and brain tumors.
I. INTRODUCTION
Fluorescence spectroscopy and imaging have the potential to provide information about biochemical, functional, and structural changes of biomolecular complexes in tissues that occur as a result of either pathological transformation or therapeutic intervention.1–4 Early detection, diagnosis, and monitoring of pathological conditions using fluorescence spectroscopy of tissues may lead to more effective treatment of critical diseases including atherosclerosis and cancer.2–8 As fluorescence-based devices, moreover, allow light delivery and collection using fiber-optic probes, they cannot only facilitate non- or minimally invasive investigations of tissues with catheters or endoscopic probes, but also enhance the diagnostic capability of traditional clinical devices.4,6,9–13
The fluorescence emission of tissue is characterized by parameters including intensity, spectral distribution, and radiative lifetime. Steady-state (time-integrated) fluorescence measurements have been used to characterize biological samples in terms of overall intensity, peak wavelength, and spectral shape.1,4,14 This approach has been widely investigated and applied to optical diagnosis of tissues due to relatively simple and cost effective implementation.15–22 Several research groups reported clinical applications of fluorescence spectroscopy to atherosclerotic lesions4,11,15,23–26 and malignant tumors.2–5,7,27–30 There are several disadvantages associated with steady-state techniques that limit their effectiveness. These limitations include relatively broad emission bands, which may reduce their capability for discrimination of spectrally overlapping fluorophores, and strong influence of the acquired spectral profile by endogenous chromophores, excitation/collection geometry, and probe design.2,13,14
Time-dependent measurements resolve fluorescence intensity decay in terms of lifetimes, and thus provide additional information about the underlying fluorescence dynamics. Therefore, fluorescence lifetime information could have distinct advantages in clinical research and practice as it: (a) may enhance the discrimination among fluorophores, especially for those with overlapping emission spectra but with different emission characteristics; (b) is sensitive to various parameters of the biological microenvironment (pH, ion concentration and binding, enzymatic activity, temperature), allowing these variables to be analyzed; and (c) is not, or only minimally affected by the variation of excitation or emission intensity due to intervening absorbers (e.g., hemoglobin), photobleaching, or fluorescence collection efficiency. A limited number of in vivo fluorescence lifetime studies have been reported on human bronchi,31 bladder,6,31 colonic polyp,32,33 and skin.13 These studies suggest that the use of fluorescence lifetime not only improves the specificity of fluorescence measurements but also allows a more robust evaluation of data collected in clinical environments.
Despite these recognized inherent advantages, the potential value of fluorescence lifetime information has not been broadly implemented in clinical settings due to barriers including complexity of instrumentation, long data acquisition and analysis, and high instrumentation costs. The overall objective of the present work is to develop an apparatus and associated practical methodologies for lifetime fluorescence spectroscopy of tissues that account for clinical needs and overcome some of the barriers mentioned above. These include rapid fluorescence data acquisition with high temporal resolution and sensitivity within a broad range of emission wavelengths; rapid data processing, analysis and display; and compact and portable instrumentation.
Time-resolved fluorescence techniques are implemented in either the frequency domain (sample excited with a sinusoidally modulated cw light source) or time domain (sample excited with short pulses).1,2,14 The frequency-domain systems are more extensively used due to their lower cost and light source availability. The time-domain techniques are usually preferred for in vivo or clinical settings because of several unique features. First, data with sufficient signal-to-noise ratio (SNR) can be recorded quickly since the relatively broad Fourier spectrum of the short excitation laser pulse allows precise recording of distinct fluorescence dynamics in a single measurement. In contrast, in conventional frequency-domain systems the data quality may be compromised unless the phase shift of modulation is determined at a sufficient number of distinct excitation frequencies, which significantly prolongs acquisition times. Second, employing pulsed light sources at low repetition rate does not require complete darkness at the collection site, and thus they are compatible with clinical settings.1,14
Typical time-domain techniques include time-correlated single-photon counting (TCSPC), high-speed time-gated cameras, streak cameras, or pulse sampling with a fast digitizer.1,14 Current instruments based upon TCSPC, the traditional approach, can resolve picosecond lifetime with high sensitivity and dynamic range.14 However, in addition to hardware complexity, TCSPC techniques require repetitive excitation pulses for the recording of a single fluorescence decay curve, thus resulting in impractically slow data acquisition for clinical settings. Faster recording can be achieved using more expensive detection systems such as high-speed cameras.34 For example, a streak camera-based instrument that allows rapid data acquisition (~20 s for decays across the entire emission spectrum) with picosecond resolution was reported.6 The instrument was used in endoscopic studies. The disadvantages associated with a time-gated camera, however, include relatively small dynamic range, low SNR, and a small number of data points in the time domain, which is often insufficient for complex data analysis.
An alternative way of acquiring the time-dependent fluorescence intensity decay is the pulse sampling method using fast-gated detection and a digitizer, in which the decay curve is sampled repetitively at shorter time intervals than the sample’s fluorescence lifetime. The ability of the pulse sampling technique to resolve fast decays, however, relies heavily on the analog bandwidth and sampling frequency of the transient digitizer, which limits the application of this method only to specimens with relatively long lifetimes.1,13,35 Due to significant advancements made over the past decade in the area of digital signal processing technology, sampling of the entire fluorescence decay is possible today using affordable transient digitizers. They are characterized by GHz bandwidth, thus they are able to resolve the temporal response of most endogenous fluorophores in tissue. Assuming adequate SNR, the fluorescence decay can be measured from a single excitation pulse. As a result, data can be acquired rapidly with minimal photobleaching to the sample. Both ex vivo and in vivo studies of diseased tissues using transient digitizers have been reported.13,35 A compact fluorometer for rapid (~1s, for single decay) and simultaneous acquisition of fluorescence emission spectra and the overall decay has also been described.13
Tissue fluorescence usually originates from several fluorophores and is influenced by many factors reflecting the complexity of the biological system. Although fluorescence decay lifetime of a single spectral band may offer sufficient diagnostic information in many cases,7,36 additional knowledge about changes in fluorescence lifetime as a function of wavelength provides essential contrast between normal and diseased tissues or for staging of atherosclerotic plaques.35 Consequently, recording of variations in fluorescence intensity decay across emission spectra provides a more complete description of biochemical content and underlying metabolic transformation of tissue. The purpose of this work is to develop a new apparatus that can rapidly acquire fluorescence temporal response across the emission spectrum in clinical settings.
More specifically, the goals of this study were to: (a) design, engineer, and develop a compact and mobile time-domain fluorescence spectroscopy apparatus that is compatible with the clinical environment and capable of rapid recording of the fluorescence emission decay at multiple wavelengths along a predefined spectral range with high temporal resolution, sensitivity, and dynamic range; (b) develop a custom interface allowing for near-real-time data analysis and display; (c) calibrate and characterize the apparatus using fluorescence lifetime standards; and (d) validate performance with several biomolecules known to be the main fluorescent constituents of human tissues.
II. APPARATUS
The time-resolved laser-induced fluorescence spectroscopy (tr-LIFS) apparatus [Fig. 1(a)] was implemented using a modular design. The system consists of an excitation light source, a fiber-optic probe for light delivery and collection, a dual-mode spectrometer with two associated detectors, a digital oscilloscope, a computer workstation, and peripheral electronics. The excitation light pulses are focused into the illumination channel of the fiber-optic probe. Following sample excitation, the emitted fluorescence light is captured and directed, via the collection channel of the probe, into the entrance slit of the dual-mode spectrometer. One of the two outputs (in scanning monochromator mode) is connected to a multichannel plate photomultiplier tube (MCP-PMT) while the other output (in spectrograph mode) is coupled to an intensified charge-coupled-device (ICCD) camera. Operation as a scanning monochromator allows for time-resolved measurements at discrete steps across the emission spectrum. Operation as a spectrograph allows for rapid single-shot acquisition of steady-state spectral emissions and time-gated detection of long lifetime decays (> 100 ns) in a scan-free fashion. Both outputs are digitized and directed to the computer workstation, which controls all major subcomponents of the apparatus and serves as the user interface.
FIG. 1.
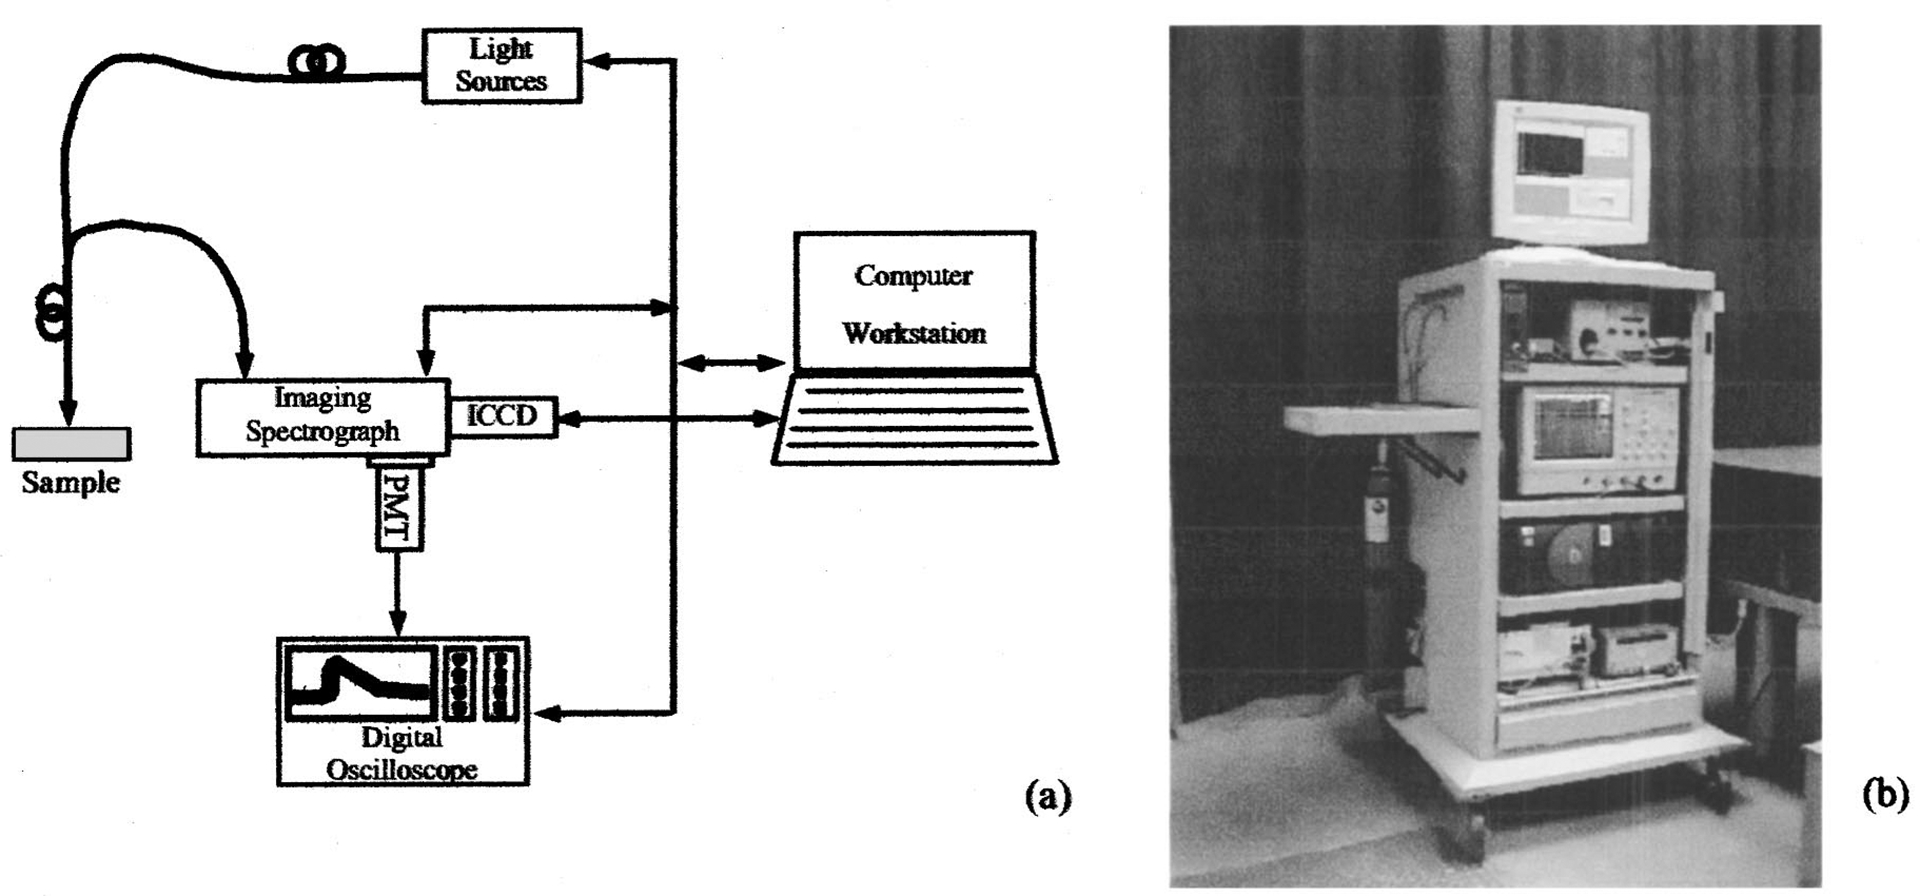
(a) Schematic diagram illustrating the modular tr-LIFS apparatus setup; and (b) photograph of the system hosted in a mobile endoscopic cart; PMT: multichannel plate photomultiplier tube; ICCD: intensified charge-coupled-device camera.
The tr-LIFS instrument was fully contained in a modified endoscopic cart (70×70×150 cm3) as shown in Fig. 1(b). The imaging spectrograph with the associated detectors is placed on the top shelf. The digital oscilloscope is located on the second level, while the computer is on the third shelf. The bottom shelf contains a nitrogen laser and a compact nitrogen generator. A dual-input liquid crystal display (LCD) display is placed on top of the cart and used to monitor outputs from the computer and oscilloscope. A small nitrogen tank is mounted on the side of the cart as the backup nitrogen supply.
Light delivery and collection are implemented using a sterilizable fiber-optic probe through standard subminiature type A (SMA) connectors. This prevents light leakage to the surrounding environment and requires no alignment when changing probes or light sources, which is of particular importance for safety in the clinical environment. The tr-LIFS system is also equipped with a medical grade isolation transformer (ISB-170A, Toroid Corp, MD) with sufficient power rating (1700 V A) to accommodate all connected equipment. The case leakage (68 μA) and ground resistance (0.07 Ω) were tested and their values were found below the safety limits (300 μA, 0.5 Ω) for anesthetizing, critical care, and wet and ambulatory care locations.
A. Light sources
For this study, we used two types of pulsed laser systems. The first laser used in this study is a subnanosecond pulsed nitrogen laser (MNL200 Lasertechnik Berlin, Berlin, Germany) with a dye module and second-harmonic-generation (SHG) module (ATM200-UV1). The nitrogen laser provides excitation at 337.1 nm [full width at half maximum (FWHM) bandwidth (BW): 0.1 nm] with a pulse width of ~700 ps (maximum pulse energy 100 μJ, repetition rate: 50 Hz), while the additional modules allow selection of excitation wavelength from a broad spectral range (225–900 nm) with slightly shorter pulses. The peak pulse energy output is about 20 μJ for the dye module (400–900 nm) and about 1 μJ for the SHG module (225–400 nm). The second light source is a picosecond pulsed diode laser (LDH400, PicoQuant, Berlin, Germany). The diode laser provides excitation at 391 nm (BW 10 nm) with a nominal pulse width of 60 ps (average power 4 mW at 40 MHz). The diode laser can operate in single-shot mode to a maximum repetition rate of 40 MHz. The calibration, characterization, and validation of the instrument reported in this study were conducted primarily using the nitrogen laser excitation at 337.1 nm. Nevertheless, the system can accommodate many types of light sources.
B. Fiber-optic probe
The output of the excitation source can be coupled to a variety of fiber-optic probes. The choice of probe type is dictated by the nature of the application (anatomical site, target fluorophores, tissue homogeneity, etc.). We have investigated several probe configurations, including single fiber and bifurcated probes. The results of these studies are reported elsewhere.37
In the current study, a custom-made bifurcated probe (nonsolarizing silica/silica step index fibers of 0.11 NA, CeramOptec, East Longmeadow, MA) was used. The probe consists of a central excitation fiber (600 μm core diameter) surrounded distally by a collection ring of fourteen 200 μm core diameter fibers. The collection fibers are beveled at a 10° angle in order to improve excitation/collection overlap for small tissue-to-probe distances. The source–detector separation (center to center) is 480 μm. The input of the illumination fiber is coupled to the laser via an SMA connector, while the distal end of the collection channel forms into a straight line in order to facilitate coupling to the spectrograph. SMA connection and overall design allow for easy probe replacement. It also prevents light leakage to the surrounding environment with the exception of the intended light output. Additionally, the probe is ethylene oxide sterilizable, rendering it suitable for clinical use. The total length of the probe is about 3 m. The pulse energy at the probe output can be adjusted continuously using a variable attenuator attached to the SMA connector.
C. Spectroscopic detection
The collected fluorescence emission is dispersed with a 0.25 m, f/4 dual-output imaging spectrograph (250is/sm, Chromex, Inc., Albuquerque, NM). The spectrograph incorporates three holographic UV–VIS gratings: two with 1200 grooves/mm (blazed at 190 and 500 nm) and one with 600 grooves/mm (blazed at 500 nm). The spectral resolution ranges from 0.5 to 10 nm depending on the choice of grating, the entrance/exit slit settings (monochromator mode), and/or the charge-coupled-device (CCD) pixel binning width (spectrograph mode). All parameters of the imaging spectrograph can be selected either through a handheld remote control unit or by the host computer.
Depending on the excitation wavelength and collection spectral band, appropriate long-pass filters may be placed before the entrance slit of the spectrograph preventing the excitation light from entering into the system. Two long-pass filters were used in this study, a 360 nm filter (WB360, Optima, Tokyo, Japan, <0.1% at 340 nm) to block the 337 nm (nitrogen laser) and a 400 nm filter (GG400, Schott Glass, Mainz, Germany, < 10% at 390 nm) to block the 390 nm (diode laser).
The fluorescence emission is temporally resolved using a multialkali cathode, gated MCP-PMT (a rise time of 180 ps, spectral response 160–850 nm, BW: cw to 2.0 GHz, R5916-50, Hamamatsu, Bridgewater, NJ) coupled to a preamplifier (BW: 50 k–1.5 GHz; C5594, Hamamatsu) and a digital phosphor oscilloscope (BW: 1 GHz, sampling rate: 5 G samples/s, TDS5104, Tektronix, Beaverton, OR). The time-resolved intensity decay curves across the entire emission spectrum can be obtained by scanning the grating of the monochromator.
Full emission spectra can be also collected rapidly with single-shot excitation using a CCD camera coupled to the imaging spectrograph output. In this study, we used a fiber optically coupled image-intensified CCD camera (ICCD, ITE/CCD, Princeton Instruments, Trenton, NJ, 256×1024 pixel array, pixel area 26×26 μm2). The ICCD camera head was thermoelectrically cooled to −25 °C for thermal noise reduction. Spectral acquisition was carried out with all pixel columns binned. Typically, for sufficient SNR, ten spectra were recorded and averaged. Acquisition of steady-state fluorescence spectra takes less than 0.5 s at typical laser repetition rates of 30–50 Hz. Time-resolved fluorescence spectra can also be acquired by sweeping the ICCD gate (minimum gate width ~3 ns) at different delay times with respect to the excitation pulse.
Scan-free acquisition of steady-state spectra through the ICCD allows for a quick preview of the overall spectral emission characteristics of biological targets. Detailed, time-resolved studies can then be focused on spectral areas that appear to be of particular interest. Such previews facilitate optimized acquisition and can minimize acquisition time during intraoperative procedures.
D. System synchronization
A schematic for the electronics configuration, designed to ensure proper synchronization of various components and automation of the data acquisition/analysis process, is given in Fig. 2.
FIG. 2.
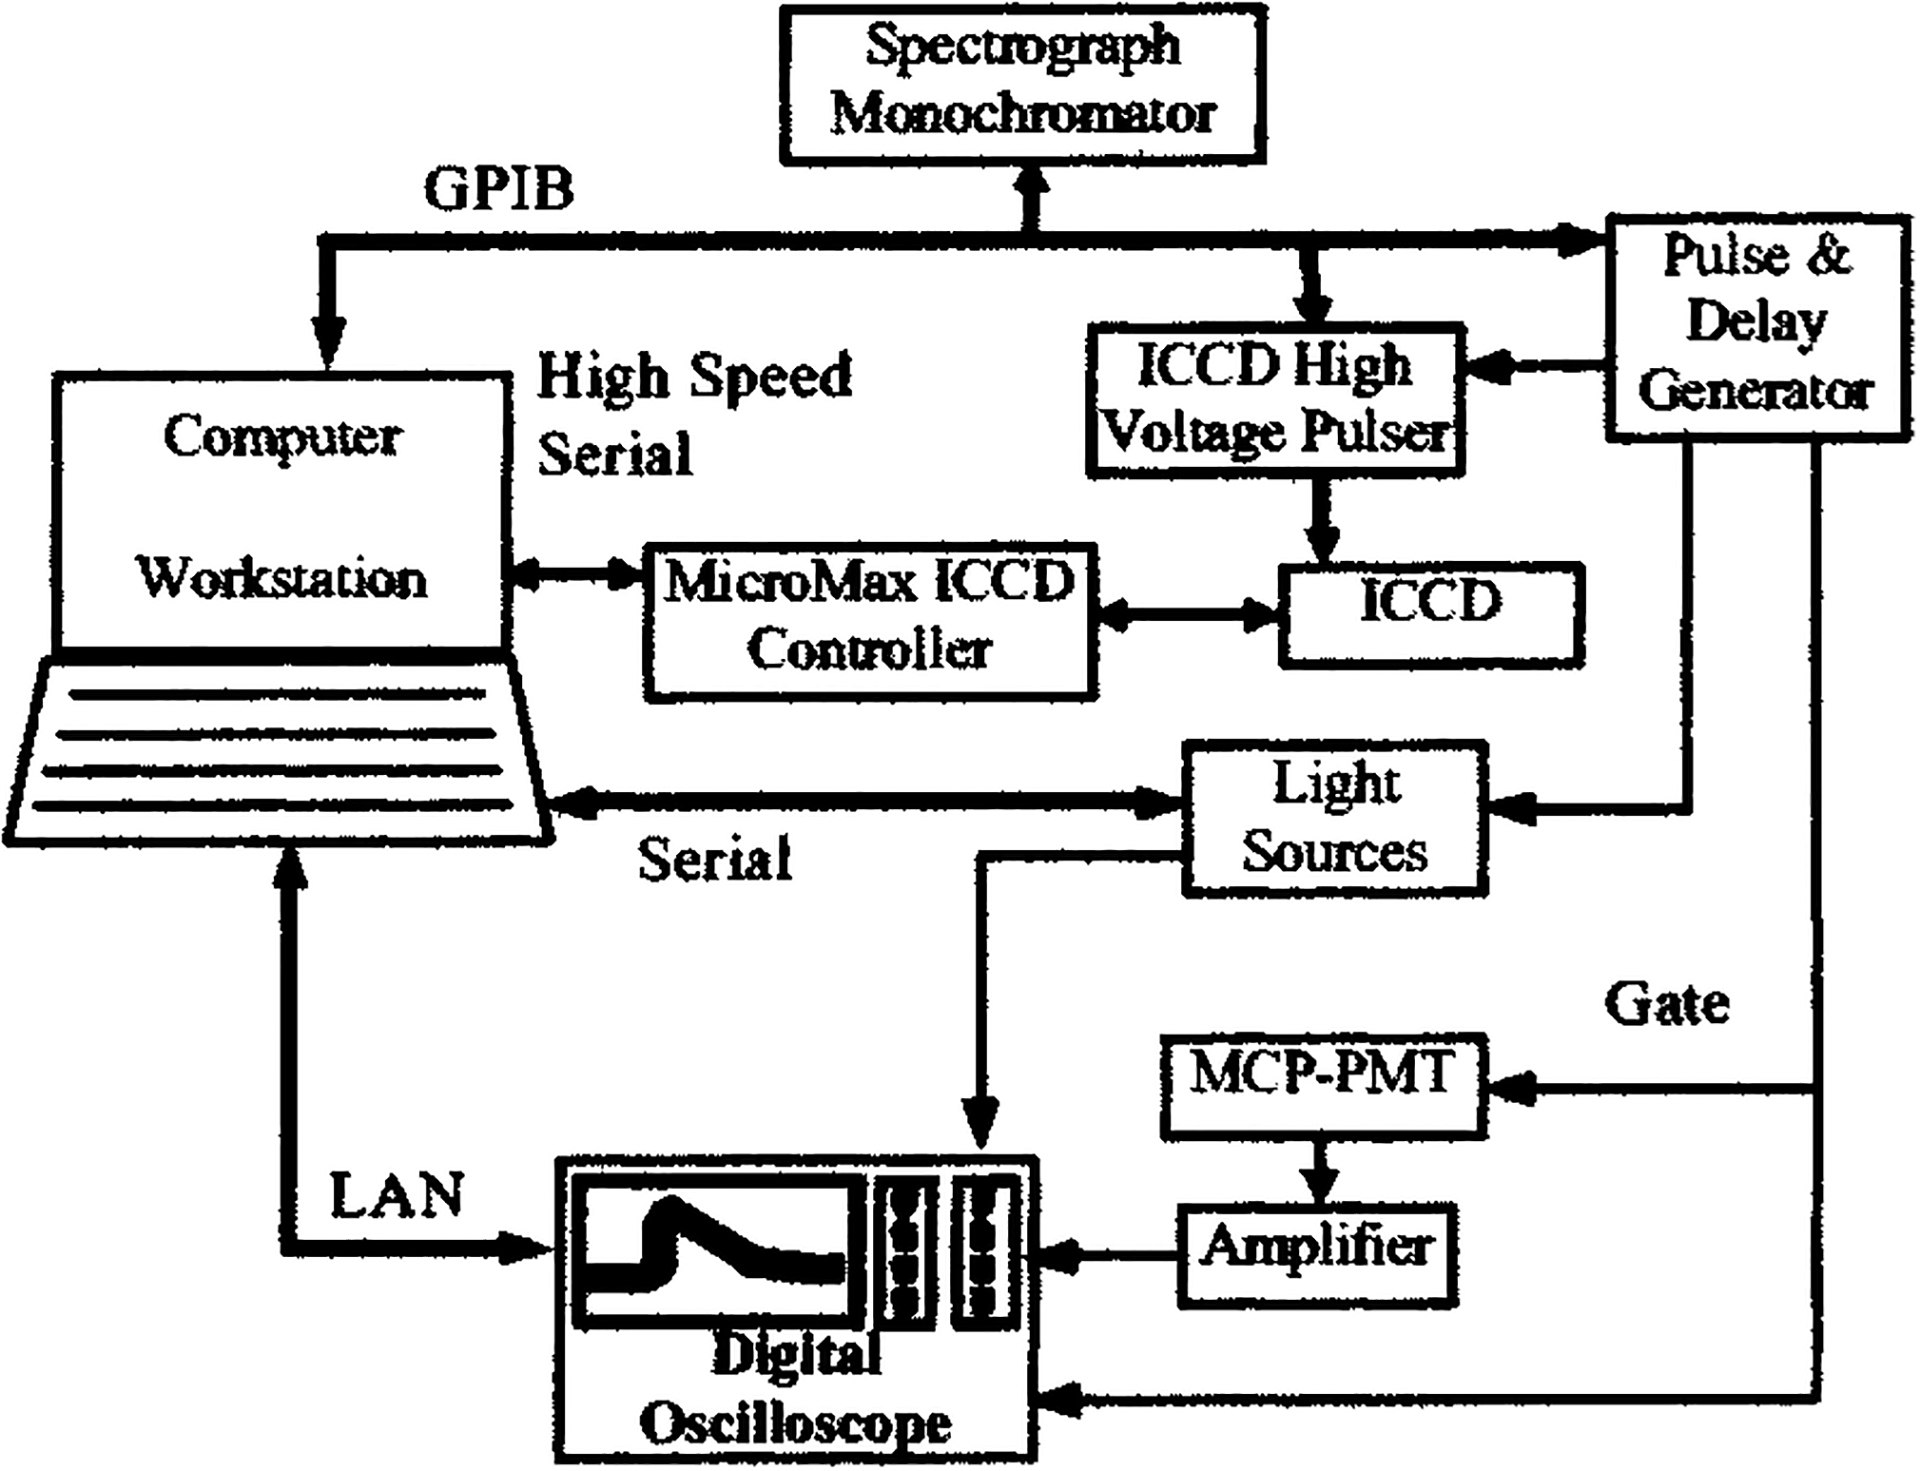
Schematic diagram illustrating the electronics and interfacing setup of the tr-LIFS apparatus.
To accurately determine fluorescence lifetime in the nanosecond and picosecond regime, precise knowledge and control of the timing between excitation, fluorescence emission, and detection electronics are required. The factors that influence system timing include: (a) the electronic delays and jitter, (b) the optical delays due to light propagation through different paths, and (c) the detector (PMT and/or ICCD) gate width and associated edge ringing. The objective of the system synchronization design is to trigger the detector gates, the light source, and the oscilloscope in such a way that the fluorescence pulse will fall within the effective region of the detector gate; and the jitter between the fluorescence pulses is minimized.
A digital pulse/delay generator (DG535, Stanford Research Systems, Sunnyvale, CA) was used as the master clock for synchronization. It generates two synchronized pulse trains at variable delays sequentially triggering the gating electronics of the detectors (MCP-PMT or ICCD) and the laser. The delay between the two pulse trains accommodates the inherent delay between the trigger pulse of the detector gating electronics and the opening of the high-voltage gating pulse on the detectors and places the fluorescence pulse about 200 ns after the rising edge of the detector gate.
The nitrogen laser provided a low jitter (< 50 ps) optical trigger output, which was used to trigger the data acquisition on the oscilloscope. The fluorescence emission signal arrives at the oscilloscope about 30 ns later than the optical trigger, which was sufficient to acquire the fluorescence decay on the oscilloscope. The delay between the fluorescence signal and the optical trigger is the result of the light propagation inside the probe and the inherent delay of the detector and the amplifier.
The combination of external triggering of the laser and detector gating and optical triggering of the oscilloscope ensures proper timing of the detection of the fluorescence pulse and low jitter. Moreover, the synchronization design avoids using long fibers for optical decay, which is a common practice in time-resolved instruments. Consequently, the optical pulse elongation induced by using multimode fiber is minimized.
E. Data acquisition and analysis software
The data acquisition process was fully automated. This was achieved through computer control of all major system subcomponents (laser, digital oscilloscope, pulse/delay generator, CCD, and imaging spectrograph) via serial (RS-232), general purpose interface bus (GPIB), and local area networking (LAN) interfaces. Special consideration was given to the selection of hardware so that all major components of the system have computer-interface capabilities.
The main objective of the data acquisition/analysis software design was to provide (a) simplicity of operation required by clinical applications, and (b) flexibility and expandability to accommodate clinical and laboratory environments. To this end, the instrumentation software provides a graphic user interface (GUI) for system parameter adjustments and various data acquisition tasks. The software was developed in house using the LabView® graphic programing package (National Instruments, Inc., Austin, TX).
A typical data acquisition sequence consists of three primary steps. First, the software initializes individual components with predetermined parameters. Next, the user is given a list of data acquisition options to choose from. These options include: (a) single wavelength acquisition, (b) wavelength band scanning at designated steps, and (c) user-specified wavelength sequence acquisition. Once the acquisition options are chosen, the program will wait for the “start” command to initiate data acquisition sessions. At the end of each data acquisition session, a MATLAB® (The MathWorks, Natick, MA) subroutine generates a preliminary analysis of the raw data and plots the results in a number of output windows. These results are presented in terms of the time-resolved and time-integrated spectra as well as fluorescence decay traces at user-specified wavelengths. The fluorescence emission peak wavelength, pulse width (FWHM) of user-specified decay traces are also analyzed and displayed in the output windows. This feature allows for a quick assessment of the acquired data, which is of particular importance during in vivo studies. The processed data are saved for further off-line data analysis.
F. Data analysis methods
The impulse response function IRF(t) is what would be recorded as the observed fluorescence decay F(t) in the ideal case of a δ-function excitation I0(t) and a δ-function instrument response is SR(t). In a practical time-domain instrument, however, the instrument response function and the laser excitation are usually several hundreds of picoseconds wide, as the case of this study. Therefore, taking these considerations into account, the observed fluorescence decay, F(t), corresponds to the convolution of I0(t) with SR(t) and the intrinsic impulse response function IRF(t):
| (1) |
Experimentally, the excitation function I0(t) is also obtained through direct measurement of the laser light using the same data acquisition settings. Therefore, the observed excitation function I(t) would also be given by the convolution of the excitation function I0(t) with the instrument response function SR(t):
| (2) |
Combining Eqs. (1) and (2), it can be shown that the observed fluorescence decay F(t) is simply the convolution of the measured excitation function I(t) with the intrinsic fluorescence impulse response function IRF(t):
| (3) |
Estimation of the intrinsic fluorescence decay was carried out via deconvolution of the observed fluorescence traces from the excitation pulse with the most commonly used least-squares iterative reconvolution approach.
The fluorescence impulse response function is typically assumed to be a multiple exponential decay function, which has been widely used in fluorescence lifetime analysis.1 The goodness of fit is ensured by testing of the randomness and autocorrelation of residuals. The average lifetime is estimated as the time at which the fluorescence impulse response function decays to 1/e of its peak amplitude. An example of this analysis technique is shown in Fig. 3, which illustrates fitting the fluorescence decay of Rhodamin B in ethanol solution with a monoexponential function at its emission spectral peak.
FIG. 3.
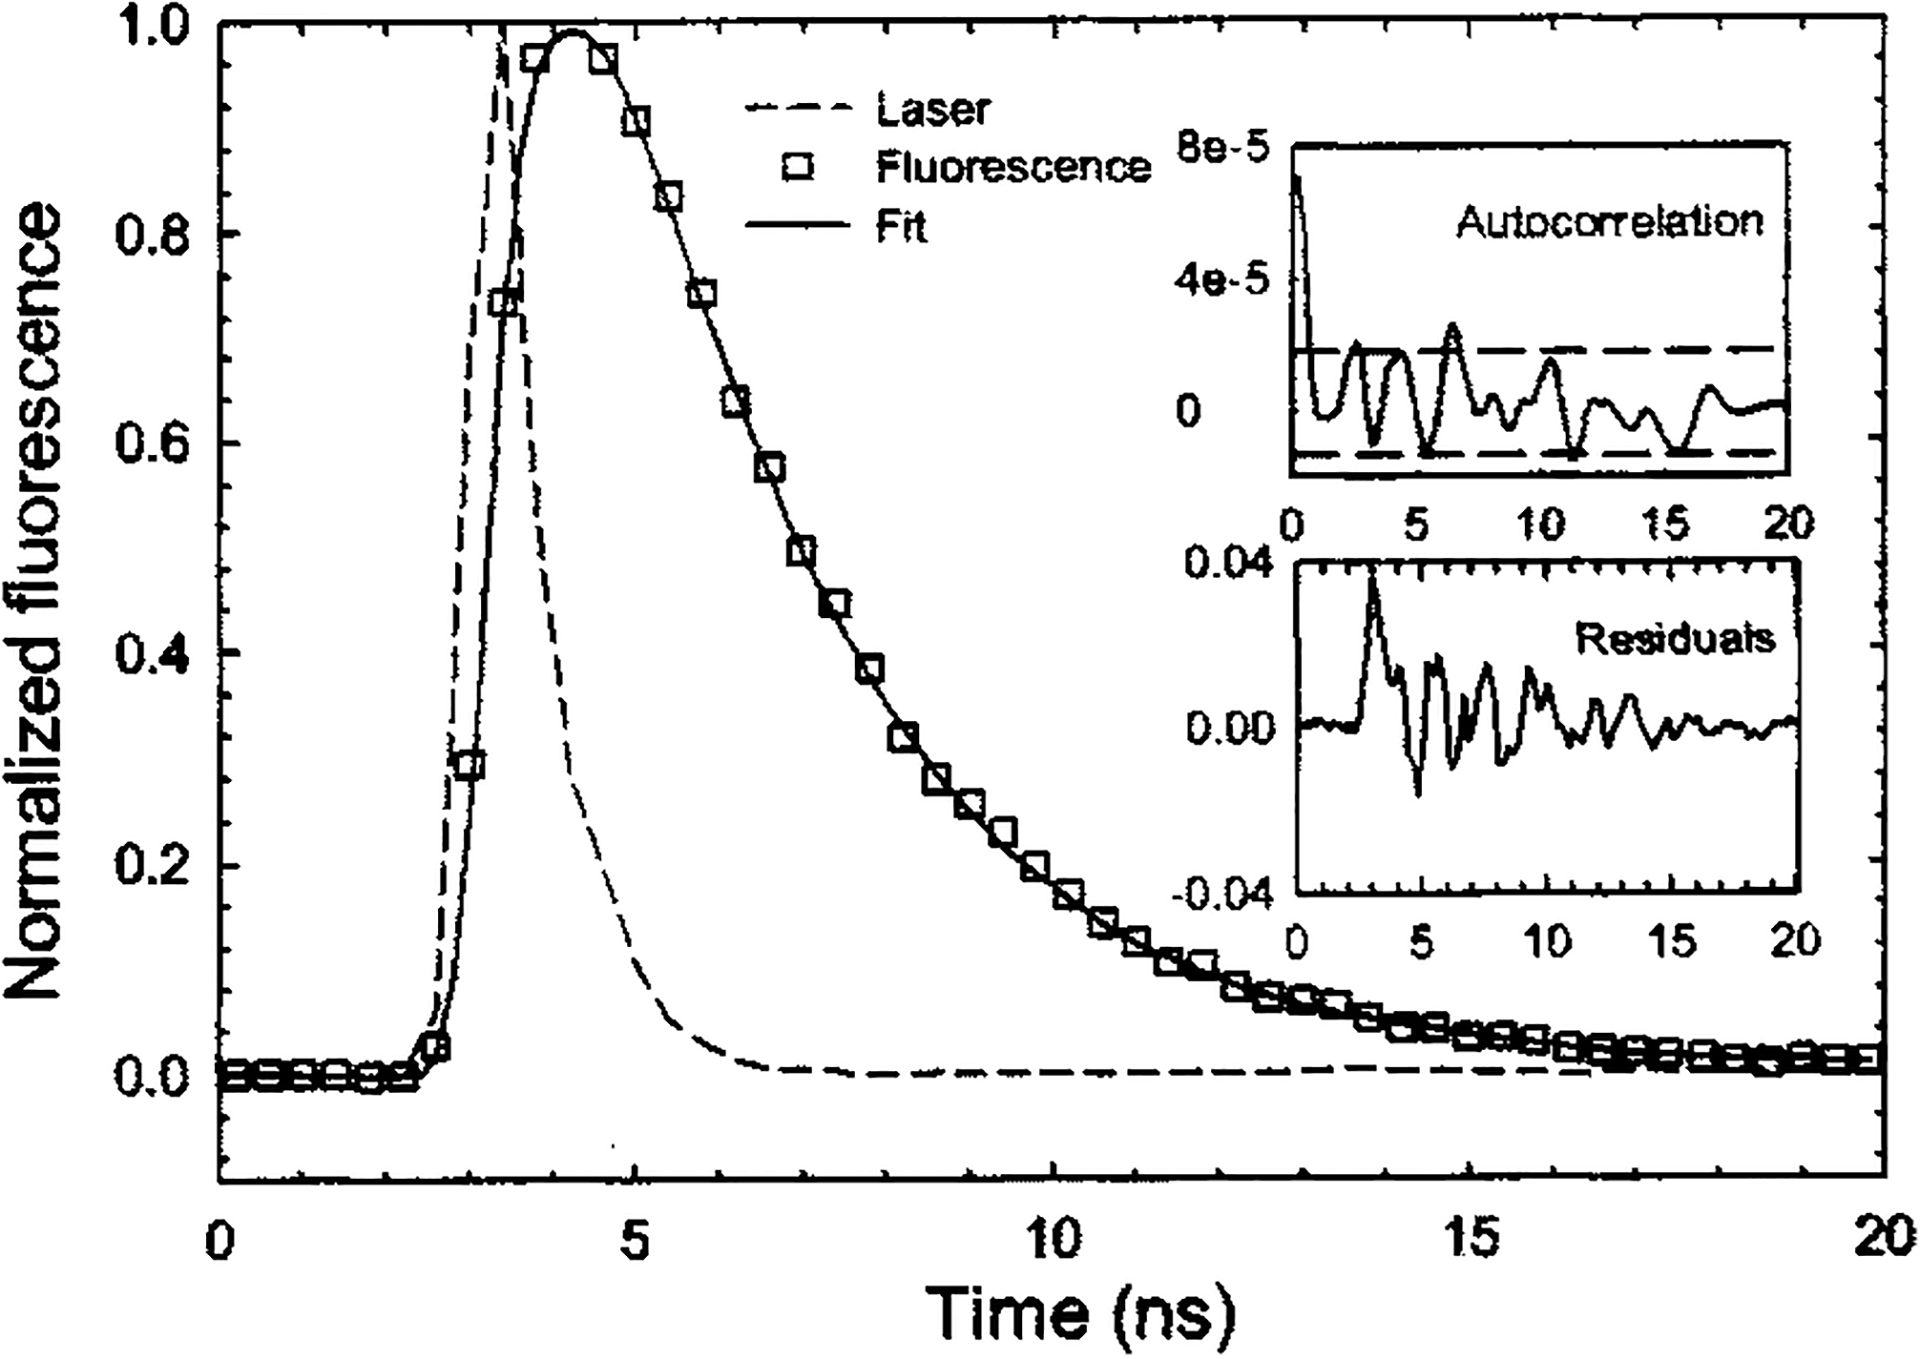
Excitation laser pulse and Rhodamin B fluorescence emission response (experimental data and theoretical fit). Residuals are nearly randomly distributed. Autocorrelation of the residuals is mostly contained within the 95% confidence interval.
Other investigations have shown that, in complex systems, the parameters of a multiple exponential fit of the fluorescence IRF cannot readily be interpreted in terms of fluorophore content.1,38 In addition, an apparently satisfactory fit to the multiple exponential expansion may conceal the actual complexity in the decay mechanisms.38 Instead of multiple exponential functions, the expansion of the IRF on an orthogonal Laguerre basis provides a unique solution and can be used to reconstruct fluorescence responses of arbitrary form.39 Consequently, the Laguerre method has the potential to allow accurate decay estimation and provide a unique representation of the fluorescence dynamics for further characterization.40 We have also recently shown that the Laguerre technique is significantly more efficient than the multiple exponential approach in terms of computation time,41 which is advantageous for in vivo applications of fluorescence lifetime studies.
In the present study, both the multiple exponential and the Laguerre techniques were applied to analyze the data. The data are reported as mean ± standard error on repeated measurements.
III. APPARATUS CALIBRATION AND CHARACTERIZATION
A. Spectral response
Wavelength calibration was performed for both modalities of fluorescence collection. The monochromator/MCP-PMT configuration was calibrated with a xenon flash lamp with UV-enhanced window (FXQ-853, EG&G Electro-Optics, Salem, MA), while the spectrograph/ICCD configuration was calibrated with a low-pressure Mercury lamp (90-0002-01, BHK, Inc., Claremont, CA 90711). The xenon and mercury emission lines were used as respective references.
Spectral intensity calibration was performed with a NIST traceable tungsten–halogen calibration lamp (63358, Oriel, Stratford, CT). The system’s spectral correction function S(λ) was obtained by
| (4) |
where, Ilamp(λ) is the measured emission spectrum of the calibration lamp and Tlamp(λ) is its emission spectrum provided by the manufacturer. All measured emission spectra, Imeasured(λ), were corrected by dividing with this system spectral correction function S(λ).
Spectral resolution was determined, in the UV region, by measuring the width of the nitrogen laser light line at 337.1 nm (0.1 nm FWHM). The spectral resolution of the instrument is determined by the combination the linear dispersion of the grating, the entrance slit width, and the exit slit width (monochromator detection mode) or the ICCD pixel binning size (spectrograph mode). Regardless of the type of grating or detection mode being used, the highest resolution of this system was determined to be less than 0.5 nm with the entrance/exit slits set at the minimum width of 10 μm (in the UV region). When the maximum entrance slit (2000 μm) and the 600 g/mm grating were used, the spectral resolution was ~10 nm. By selecting the grating and entrance/exit slit settings, the spectral resolution can be varied between 0.5 and 10 nm. For measurements reported in this study, unless otherwise specified, the 600 g/mm grating and 1000 μm entrance/exit slits were used with a spectral resolution of 5 nm.
The spectral range of the monochromator/MCP-PMT configuration is 350–800 nm, and is limited by the long-pass filters used and the spectral efficiency of the gratings and detectors. The length of the CCD chip and the linear dispersion of the grating limit the spectral range of the spectrograph/ICCD configuration, which was subsequently determined to be about 110 nm with the 600 g/mm grating.
The overall intensity spectral response of the system was tested by acquiring the steady-state fluorescence spectrum of 10−6 M fluorescein (CI 45350, Kodak, Rochester, NY) in ethanol (27,074-1, Sigma-Aldrich, St. Louis, MO) solution. The intensity corrected spectra were found matching closely the fluorescein emission spectrum reported in the literature.42
B. Temporal response
Typical endogenous tissue fluorophores have fluorescence lifetimes in the range of a few hundred picoseconds to less than a few hundred nanoseconds. Therefore, a temporal resolution of less than a few hundred picoseconds is required for a tr-LIFS instrument to accurately measure radiative lifetime of tissue endogenous fluorophores. The temporal resolution of the entire system was determined by measuring the output pulse width (FWHM) of a short (nearly delta function) laser input. The time resolution of the described system is mainly affected by the temporal response of the MCP-PMT, the preamplifier, and the digital oscilloscope. Their rise times as specified by the manufacturers are 180, 233, and 350 ps, respectively. Taking into account these rise times, the 60 ps pulse width output of the diode laser was considered as a nearly delta function input for estimation of the temporal resolution of the system. The measured output was found to be approximately 300 ps (FWHM). This was considered to be the temporal resolution of the instrument, which was further verified by measuring the radiative lifetime of fluorophores with well-characterized subnanosecond fluorescence lifetimes. These fluorophores included rose Bengal (R3877, Sigma-Aldrich) and the reduced form of nicotinamide adenine dinucleotide (NADH, N8129, Sigma-Aldrich). The lifetimes for rose Bengal dissolved in methanol (M3641, Sigma-Aldrich) and NADH dissolved in phosphate-buffered saline (PBS-1, Sigma-Aldrich) were determined to be 0.55 and 0.34 ns, respectively. These values are in good agreement with the values of 0.54 and 0.3–0.4 ns previously reported.1,13,43
C. Sensitivity, dynamic range, and amplification linearity
The sensitivity of the entire system was determined by measuring the fluorescence emission of fluorescein solutions at gradually decreasing concentrations. The sensitivity limit was then determined for the lowest fluorescein concentration, which yielded measurements with a SNR that allows retrieval of accurate lifetimes. Time-resolved fluorescence spectra of fluorescein solutions in ethanol were measured at concentrations ranging from 10−5 to 10−9 M, within 1 h of sample preparation. For each concentration, 16 consecutive decay traces, at the peak emission of 515 nm, were acquired and averaged. The SNR was calculated from these average traces. Table I shows the calculated SNR at the various fluorescein concentrations used. The lowest value of SNR, which allowed for accurate estimation of lifetime, was 46. The corresponding fluorescein concentration of 10−9 M was thus determined to be the system’s sensitivity.
TABLE I.
SNR of the fluorescence decay of fluorescein in ethanol solutions at different concentrations.
| Concentration (M) | SNR |
|---|---|
| 10−5 | 5.26×10⁴ |
| 10−6 | 9.69×10³ |
| 3.16×10⁻⁷ | 2.33×10³ |
| 10−7 | 898 |
| 3.16×10⁻⁸ | 138 |
| 10−8 | 104.7 |
| 10−9 | 45.9 |
The linearity of signal amplification was determined by evaluating the distortion of the amplified output signal as a function of input signal to the amplifier. As an optical signal for this test, we used the emission decay from 10−6 M Coumarin 120 (7-Amino-4-methylcoumarin, 25,737-0, Sigma-Aldrich) in methanol solution at its peak of 440 nm. The amplitude of the amplifier’s input can be varied by gain adjustment of the MCP-PMT through increase of the high voltage from 1.60 to 2.26 kV The resulting amplitude of the corresponding fluorescence decay curves varied from ~10 mV to 2.98 V. The retrieved fluorescence decay lifetimes are plotted in Fig. 4 as a function of the signal amplitude. The error bar shows the standard deviation over ten repeated measurements. As shown by the normalized fluorescence decay curves, the pulse width (FWHM) broadened when the signal amplitude exceeded 2.00 V, thus resulting in overestimation of the fluorescence lifetime. It is also noteworthy that at low signal amplitudes (< 10 mV) the error in the lifetime estimation increased owing to the low SNR (~28) obtained at this signal range. Accordingly, in order to avoid nonlinearities, all measurements in this study were performed with maximum output signal amplitude between 20 mV and 1.5 V. This was achieved by the selection of the optimal range of MCP-PMT high-voltage settings. Once the output signal levels are higher than 2.0 V, a software routine warns the operator with a popup message prompting for adjustment of the high-voltage setting.
FIG. 4.
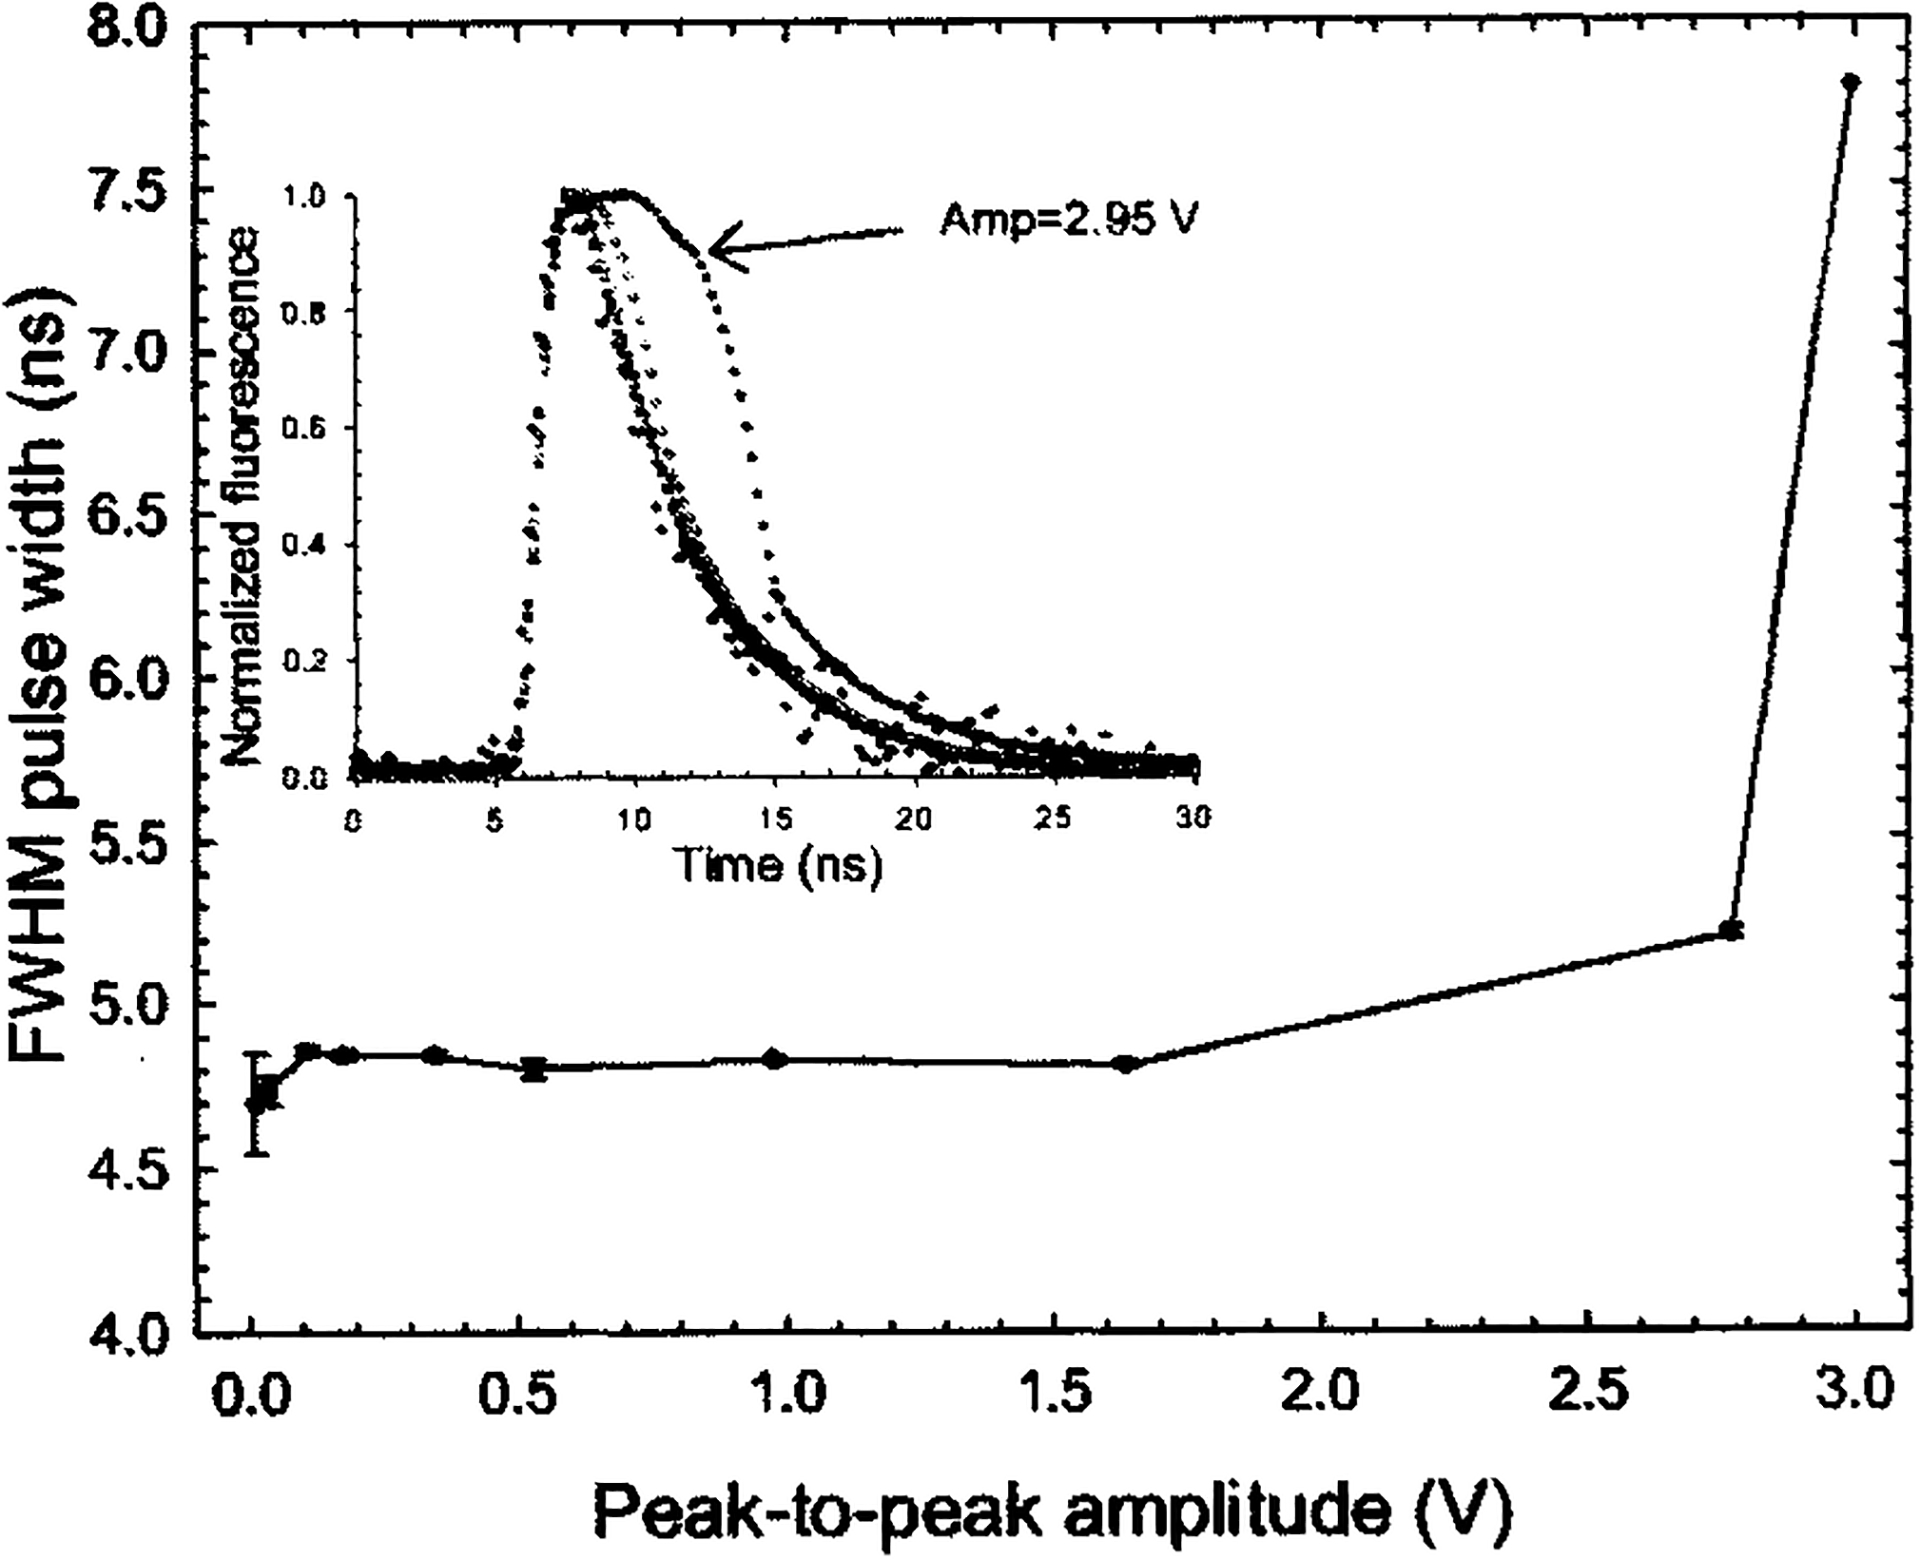
Calculated fluorescence lifetimes of 10−6 M Coumarin 120 in methanol solution at 445 nm were plotted as a function of maximum signal amplitudes. Signal amplitudes from 100 mV to 2.95 V were achieved with different MCP-PMT gain settings. The directly recorded fluorescence traces are plotted in the inset.
Based on the previously described measurements, the dynamic range of the system was determined to be larger than four decades. This dynamic range is defined as the ratio of maximum signal amplitude that introduces no more than 5% pulse broadening to the standard deviation of the signal noise.6
D. Data acquisition time
On average, fluorescence decays were acquired within 0.8 s per wavelength. This time included averaging of 16 consecutive pulses at laser repetition rate of 30 Hz, rotation of the grating to the targeted wavelength, digitization of the fluorescence decay pulse, data storage, and preliminary analysis. Typically, 40 s were needed to scan, collect, process, and display a time-resolved spectrum of 200 nm wavelength range at 5 nm intervals. This period can be reasonably accommodated in clinical settings. Moreover, the tr-LIFS system has implemented a fast deconvolution of the fluorescence IRF technique using Laguerre expansion as an additional offline data analysis along with the conventional multiexponential method. In a separate study, we have shown the Laguerre technique can retrieve fluorescence decays significantly faster (more than three times) than the conventional multiple exponential technique.41
IV. VALIDATION OF INSTRUMENT PERFORMANCE
The performance of the tr-LIFS instrument was validated by measuring the fluorescence emission of a number of fluorophores with well-characterized fluorescence lifetimes. These included fluorescence lifetime standard dyes and purified biomolecules known to contribute to native tissue fluorescence.
A. Fluorescence lifetime standards
The fluorescence lifetime standards were selected to cover a broad range of emission wavelengths (360–650 nm) and radiative lifetimes (0.54–12 ns). The fluorophores used were rose Bengal (33,000, Sigma-Aldrich), Rhodamin B (25,242, Sigma-Aldrich), and 9-cyanoanthracene (15,276, Sigma-Aldrich). These fluorophores are commercially available in powder form.
Stock solutions of 10−3 M were first prepared from the powder dyes and appropriate solvents. These solutions were further diluted into 10−6 M solutions, which were used on all measurements. All solutions were kept in dark storage before measurement and all data acquisition was completed within 4 h of sample preparation. Measurements were conducted with the solutions placed in a 5 cc quartz cuvette and with the fiber probe tip positioned 3 mm above the solution surface. The laser pulse energy at the tip of the excitation fiber probe was measured with a power meter (PD10, Ophir Optronics, Ltd., Boston, MA) and adjusted to 2.0 μJ/pulse. The pulse-to-pulse fluctuation of the nitrogen laser was less than ±3%.
The emission spectrum of each fluorophore was initially obtained with the ICCD camera, as shown in Fig. 5(a). The scanning range of the time-resolved measurements was subsequently determined so that it covers the entire emission spectrum of that particular fluorophore. For each sample solution, the time-resolved fluorescence spectrum was collected over a 200 nm spectral range at 5 nm increments. To verify the reproducibility of the fluorescence response, five successive fluorescence transients were recorded at the peak emission wavelength. After each measurement sequence, the laser pulse temporal profile was measured at a wavelength slightly below the excitation laser line. Background spectra were also taken for the solvents (ethanol and methanol) using the same cuvette and were subtracted from the measured steady-state spectra. The lifetime of each fluorophore (at their peak emission wavelengths) was obtained using both multiple exponential and Laguerre expansion methods, as summarized in Table II. The deconvolved fluorescence intensity decays are shown in Fig. 5(b). All fluorescence decays were found best fitted to monoexponential decay. The fluorescence lifetime values were in very good agreement with those reported in the literature using TCSPC (Refs. 1 and 43–45) or pulse sampling techniques (Ref. 13).
FIG. 5.
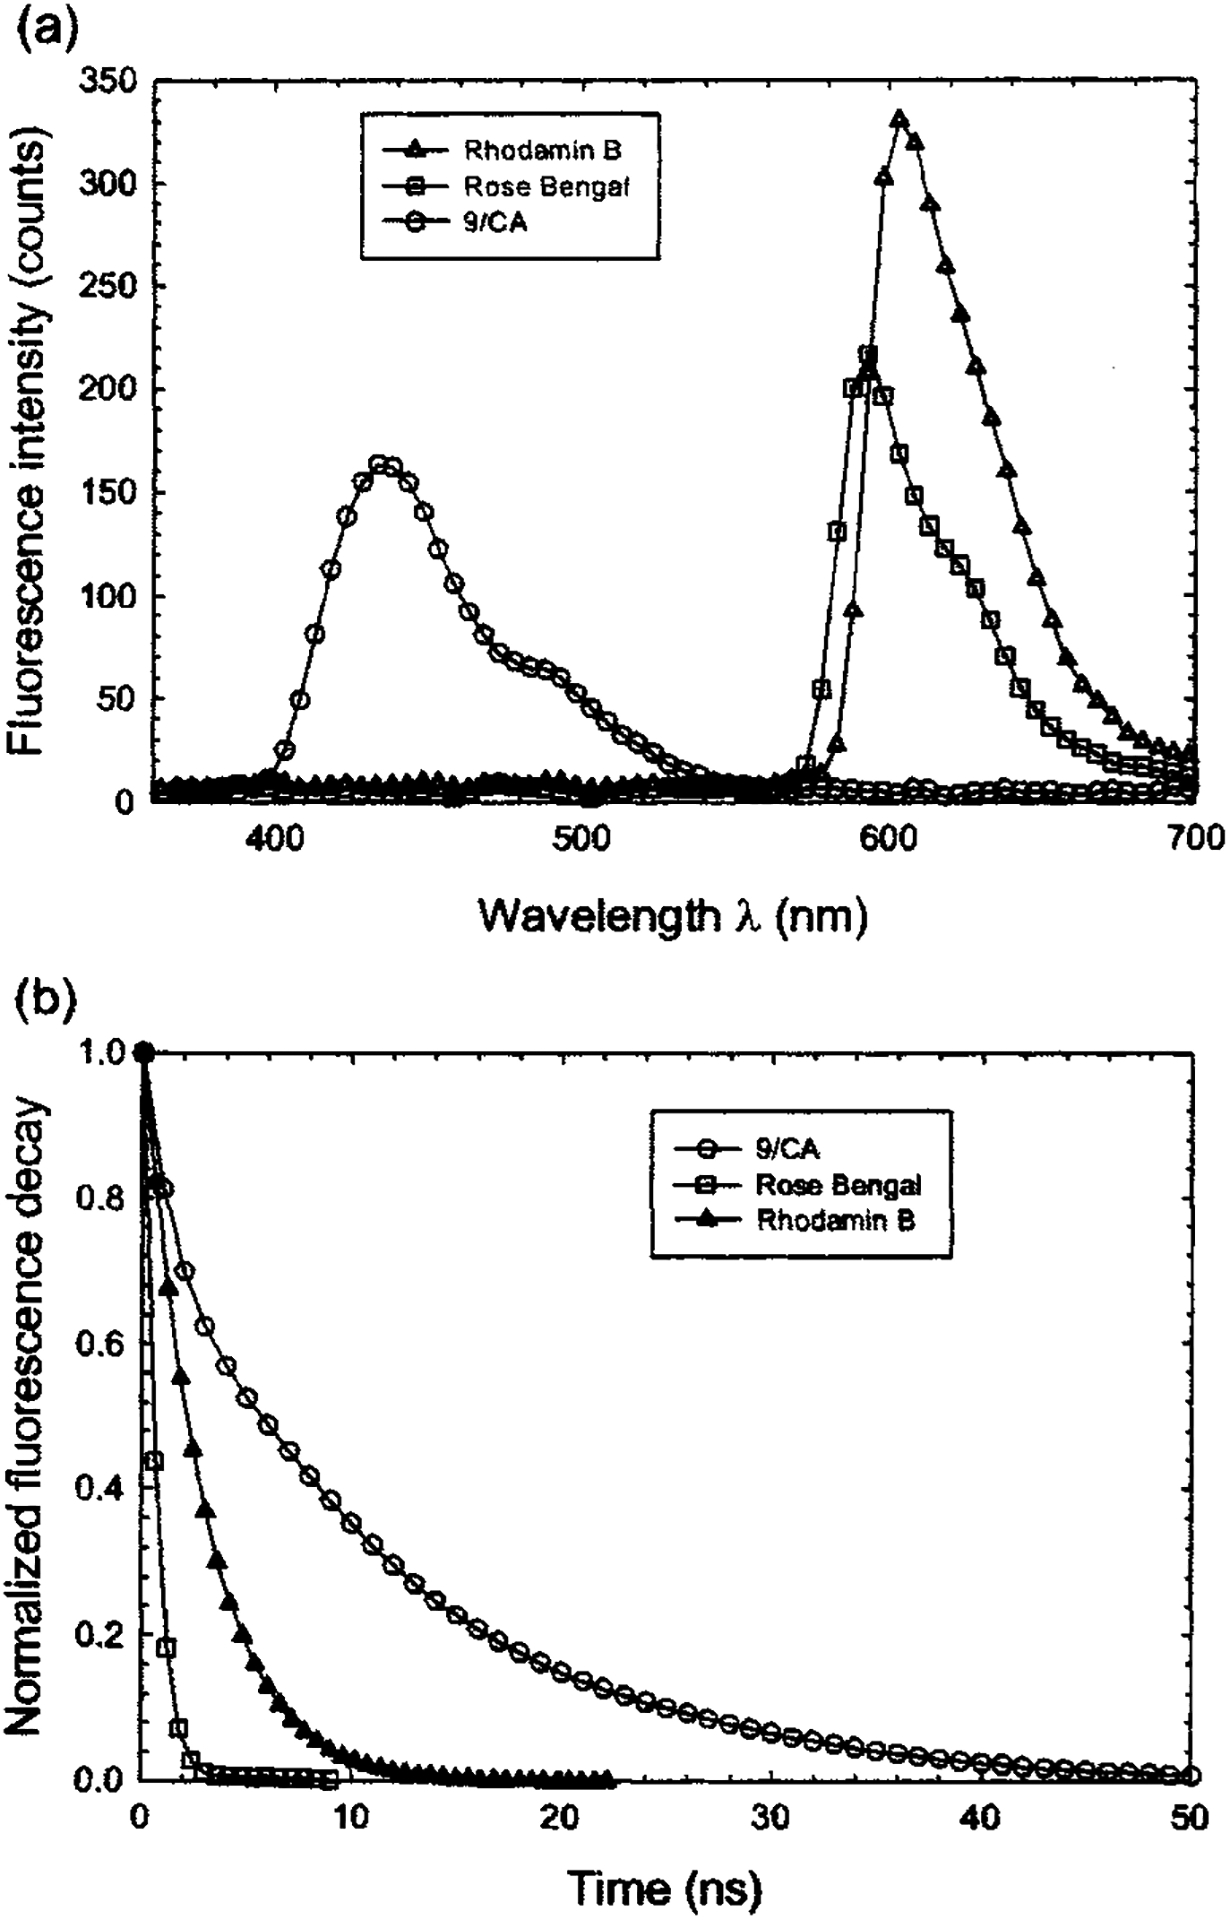
Experiment results of 9-cyanoanthracene, rose Bengal, and Rhodamin B in 10−6 M ethanol solution: (a) Steady-state fluorescence spectra collected with the ICCD camera. (b) Deconvolved fluorescence decay traces.
TABLE II.
Fluorescence lifetime values of standard fluorescence dyes. All measurements were at 22 °C, in equilibrium with air.
B. Mixtures of fluorescence lifetime standards
The fluorescence emission of biological systems originates in general from a mixture of various fluorescent biomolecules. To demonstrate the ability of our system to simultaneously resolve these fluorescence emissions spectrally and temporally, the system was used to measure the time-resolved fluorescence spectra of a series of mixtures of two distinct fluorophores in solution.
The tr-LIFS instrument was first used for resolving the fluorescence emission of Rhodamin B and 9-cyanoanthracene. These two fluorophores were chosen because they have distinct spectral and lifetime signatures (Rhodamin B: peak emission at ~580 nm, lifetime: of ~2.85 ns;45 9-cyanoanthracene: ~445 nm, lifetime ~11.85 ns).1,13,44 Equal volumes of 10−6 M solutions of both Rhodamin B and 9-cyanoanthracene in ethanol were used to produce the mixture solution. As shown in Fig. 6(a), the tr-LIFS system clearly differentiated the two fluorophores both spectrally and temporally. Both the lifetimes [Fig. 6(b)] and the peak fluorescence emission [Fig. 6(c)] of the two fluorophores were well separated. The decay traces of the mixture were best fit by a monoexponential decay yielding lifetimes of 12.58±0.05 ns at 445 nm for the 9-cyanoanthracene and 2.89±0.01ns at 580 nm for the Rhodamin B. These values are sufficiently close to those obtained from the solutions containing only a single fluorophore (12.28 and 2.92 ns).
FIG. 6.
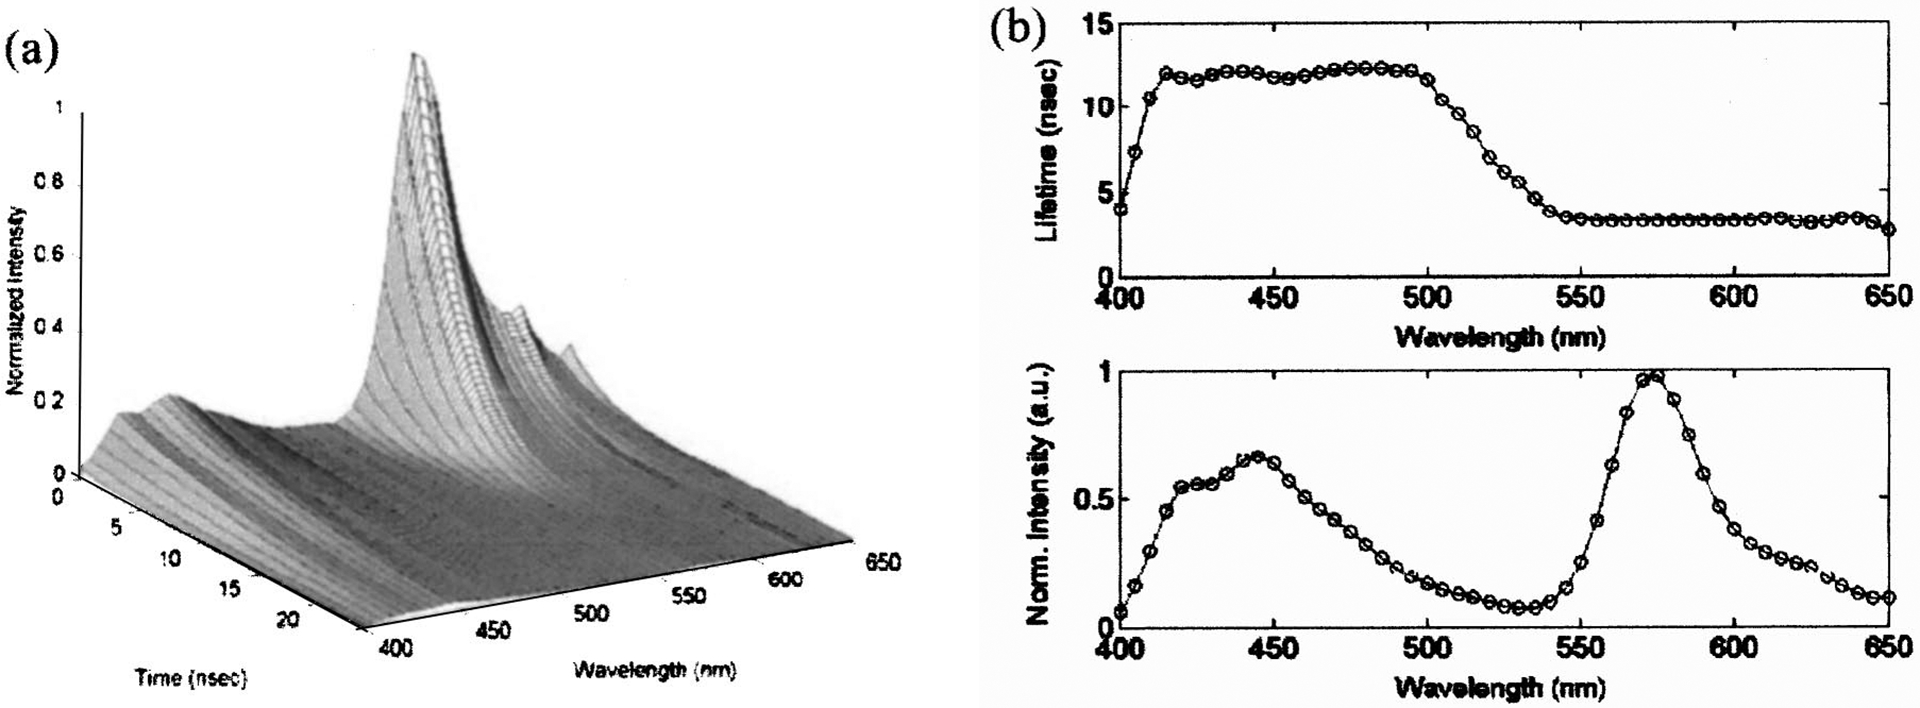
Fluorescence emission spectrum of 5×10⁻⁶ M solutions of 9-cyanoanthracene and Rhodamin B mixture dissolved in ethanol: (a) three-dimensional time-resolved spectra; (b) fluorescence lifetime of the mixture solution is shown as a function of wavelength (top) and time-integrated spectra (bottom).
Furthermore, the tr-LIFS instrument was used to record the time-resolved fluorescence spectra of the mixture of two fluorophores (Rhodamin B, rose Bengal) with overlapping fluorescence emission spectra but distinct lifetimes. Five different solutions with various fluorophore concentrations were used. Three mixture solutions were prepared with Rhodamin B/rose Bengal concentration values equal to 0.25/0.75, 0.50/0.50, and 0.75/0.25 μM, respectively. The 10−6 M rose Bengal and Rhodamin B single dye solutions were also measured representing Rhodamin B/rose Bengal concentrations of 0/1.0 and 1.0/0 μM, respectively. The resulting time-integrated fluorescence spectra of the mixtures overlapped between 570 and 580 nm, as shown in the inset panel of Fig. 7. The decays of these mixtures were best fitted by biexponential functions with time constants τ1 and τ2 of 2.97±0.08 and 0.89±0.10 ns, respectively. Both values were in good agreement with the lifetime values obtained from the corresponding single fluorophore solutions.
FIG. 7.
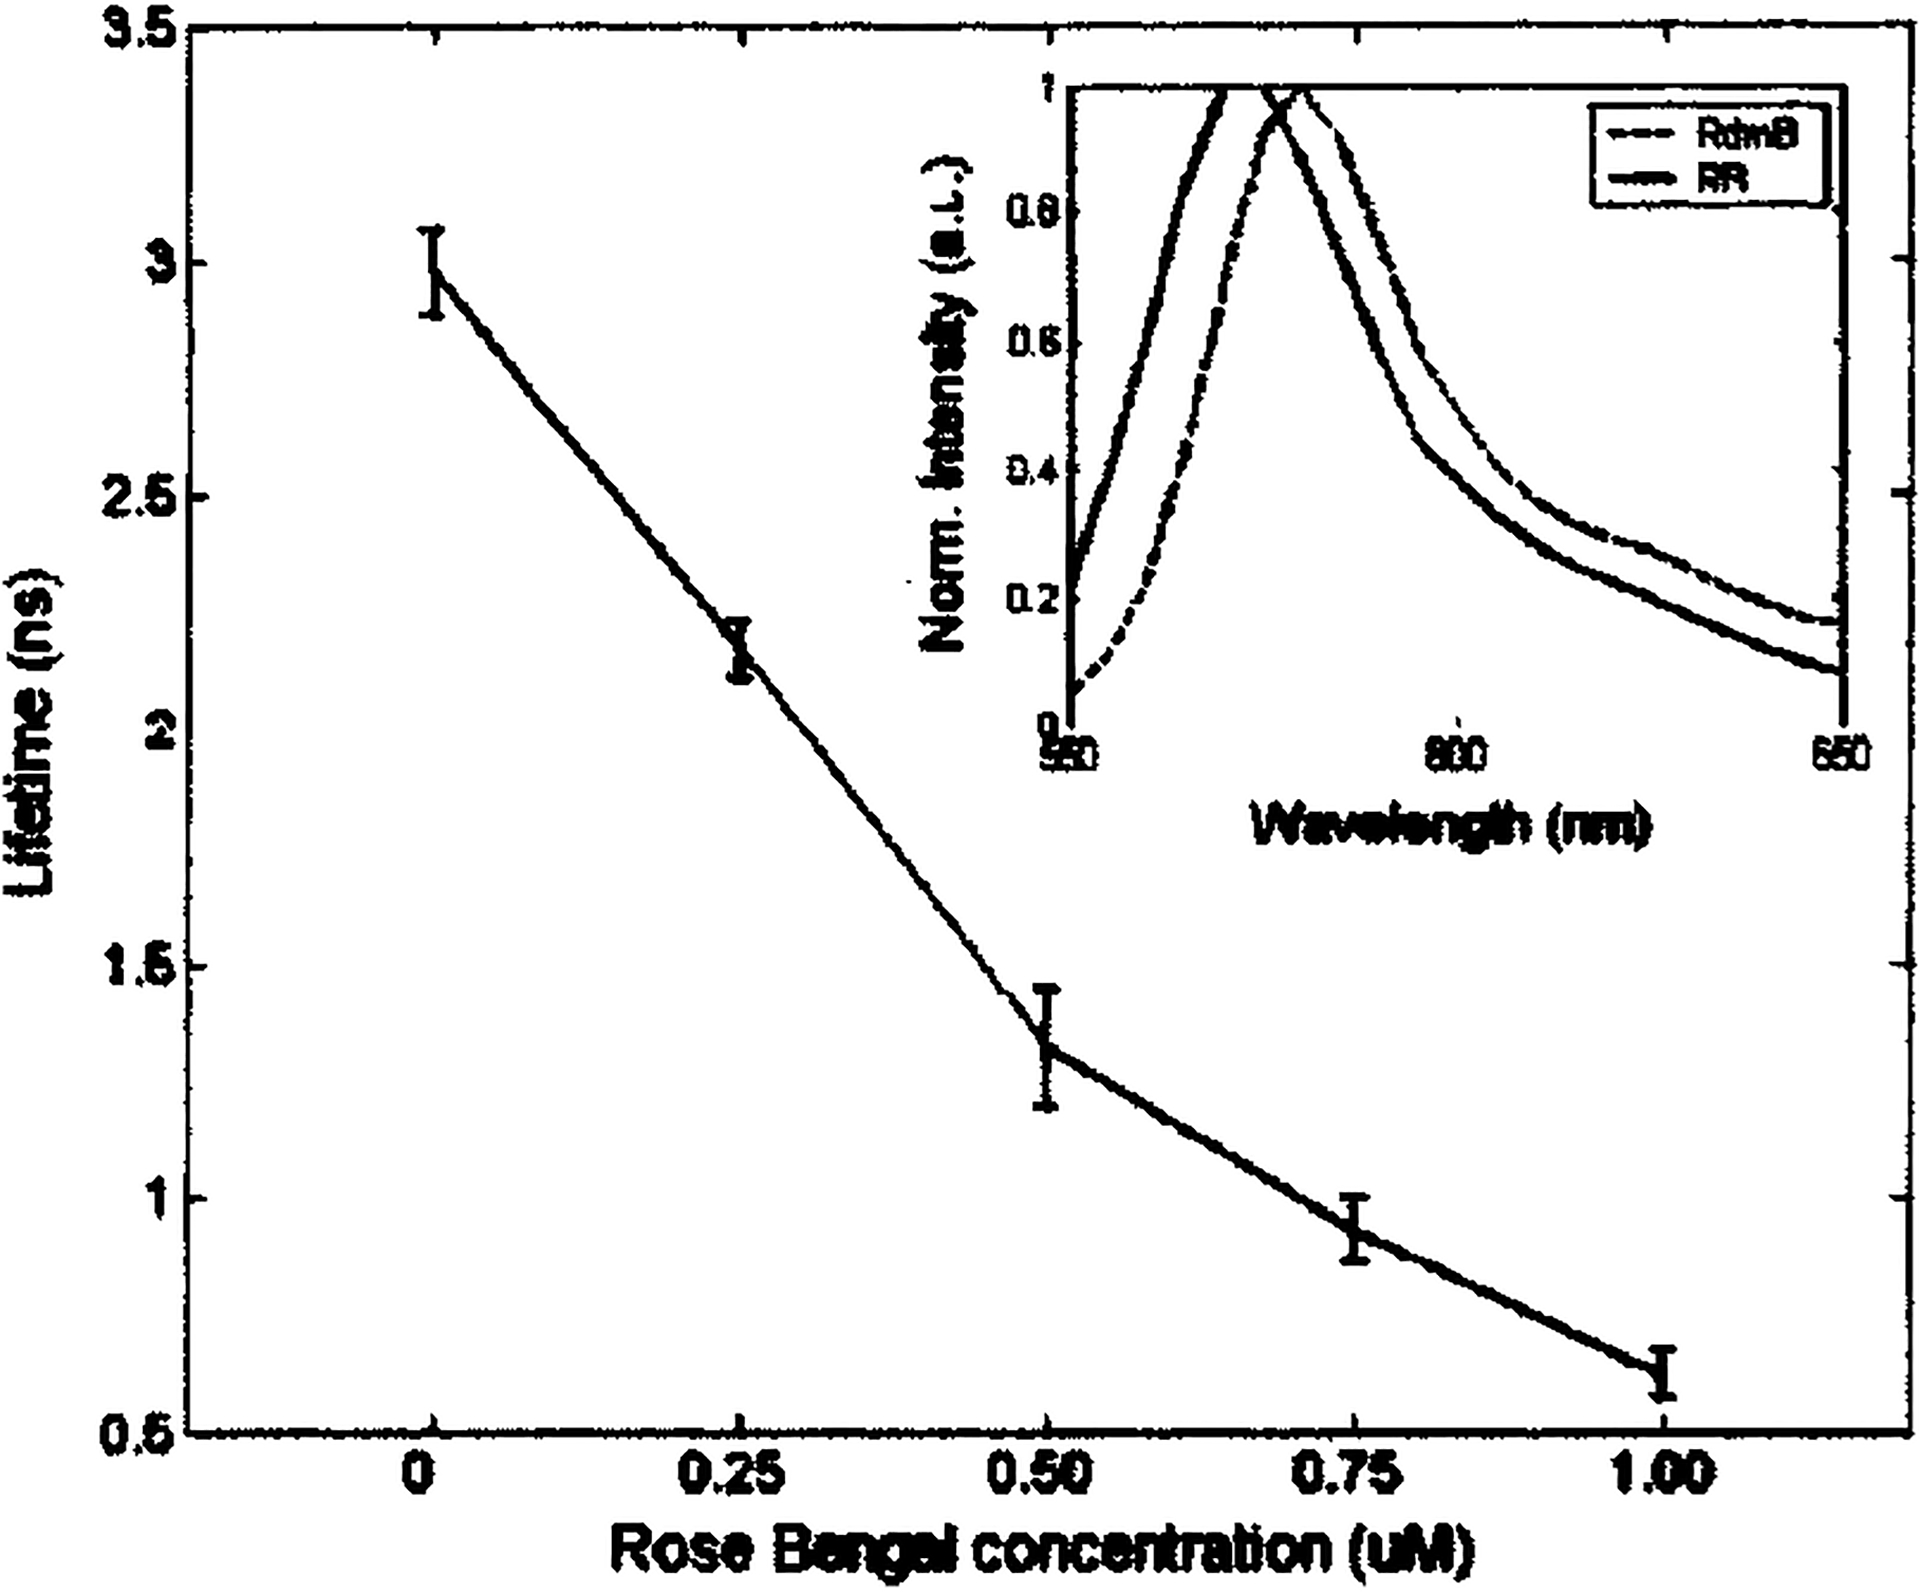
Fluorescence lifetime of rose Bengal and Rhodamin B mixture solution changes as a function of the concentration of rose Bengal. In the mixture solutions, rose Bengal concentrations of 0, 0.25, 0.50, 0.75, and 1.0 μM also correlate to Rhodamin B concentrations of 1.0, 0.75, 0.50, 0.25, and 0 μM, respectively. Lifetime was deconvoluted based on the Laguerre basis expansion technique.
The fluorescence decay traces of the five sample solutions were also deconvolved using the Laguerre basis technique. The average lifetimes were plotted as a function of the rose Bengal concentrations in Fig. 7. A nearly linear dependence was found between the average fluorescence lifetime and the concentration ratio of the mixture solution. This indicates that the tr-LIFS system cannot only resolve the two fluorophores qualitatively, but also retrieve their relative concentrations quantitatively.
C. Fluorescent bio-molecules
The fluorescent tissue constituents tested in this study include commercially available samples of collagen type I from calfskin (C3511, Sigma-Aldrich), elastin from human aorta (E6777, Sigma-Aldrich), NADH, and flavin adenine dinucleotide (FAD) disodium salt dihydrate (F6625, Sigma-Aldrich). The collagen and elastin were tested in dry form while NADH and FAD were tested in 10−6 M PBS solutions. Prior to measurements, the samples were kept refrigerated at 4 °C in the dark. Measurements were conducted at room temperature.
The time-resolved spectra of these specimens were obtained in the same manner as the fluorescence standard dyes. For specimens in dry form (collagen and elastin), a nonfluorescent sample holder was used to avoid background fluorescence. The NADH and FAD solutions were measured in a quartz cuvette. The sample holder and cuvette were cleaned using alcohol and distilled water after each acquisition. The dry specimens were prepared to have a nearly flat surface and the fiber probe tip was positioned 3 mm above the sample. The excitation pulse energy at the output of the fiber probe was adjusted to 2.0 μJ. For each dry specimen, five time-resolved spectra were taken at five different spots. During a single measurement sequence (200 nm at 5 nm steps, 40 s), the total dose delivered to the illuminated sample spot was less than 0.9 mJ/mm2. In a previous study, we reported that the photobleaching of collagen emission is minimal at this exposure.46
The time-resolved spectra of elastin from human aorta are shown in Fig. 8(a). In Fig. 8(b) the average fluorescence lifetime of elastin was plotted as a function of wavelength. In this spectral range (380–520 nm) the average lifetime of elastin slightly increases from 2.05 to ~2.4 ns. Figure 9(a) shows the time-integrated spectra of these biomolecules while their typical fluorescence decay curves are shown in Fig. 9(b). The average lifetime of each fluorophore was obtained using both biexponential and Laguerre expansion methods. The emission spectral peaks, their spectral widths (FWHM), and lifetimes at these peaks were estimated and compared with literature values as shown in Table III.8,13,40,47 Although collagen (type I from calf skin) and elastin (from human aorta) have closely overlapping steady-state emission spectra as shown in Fig. 9(a), they can be clearly differentiated since collagen has a faster decay than elastin around 400 nm, as shown in Fig. 9(b) and Table III.
FIG. 8.
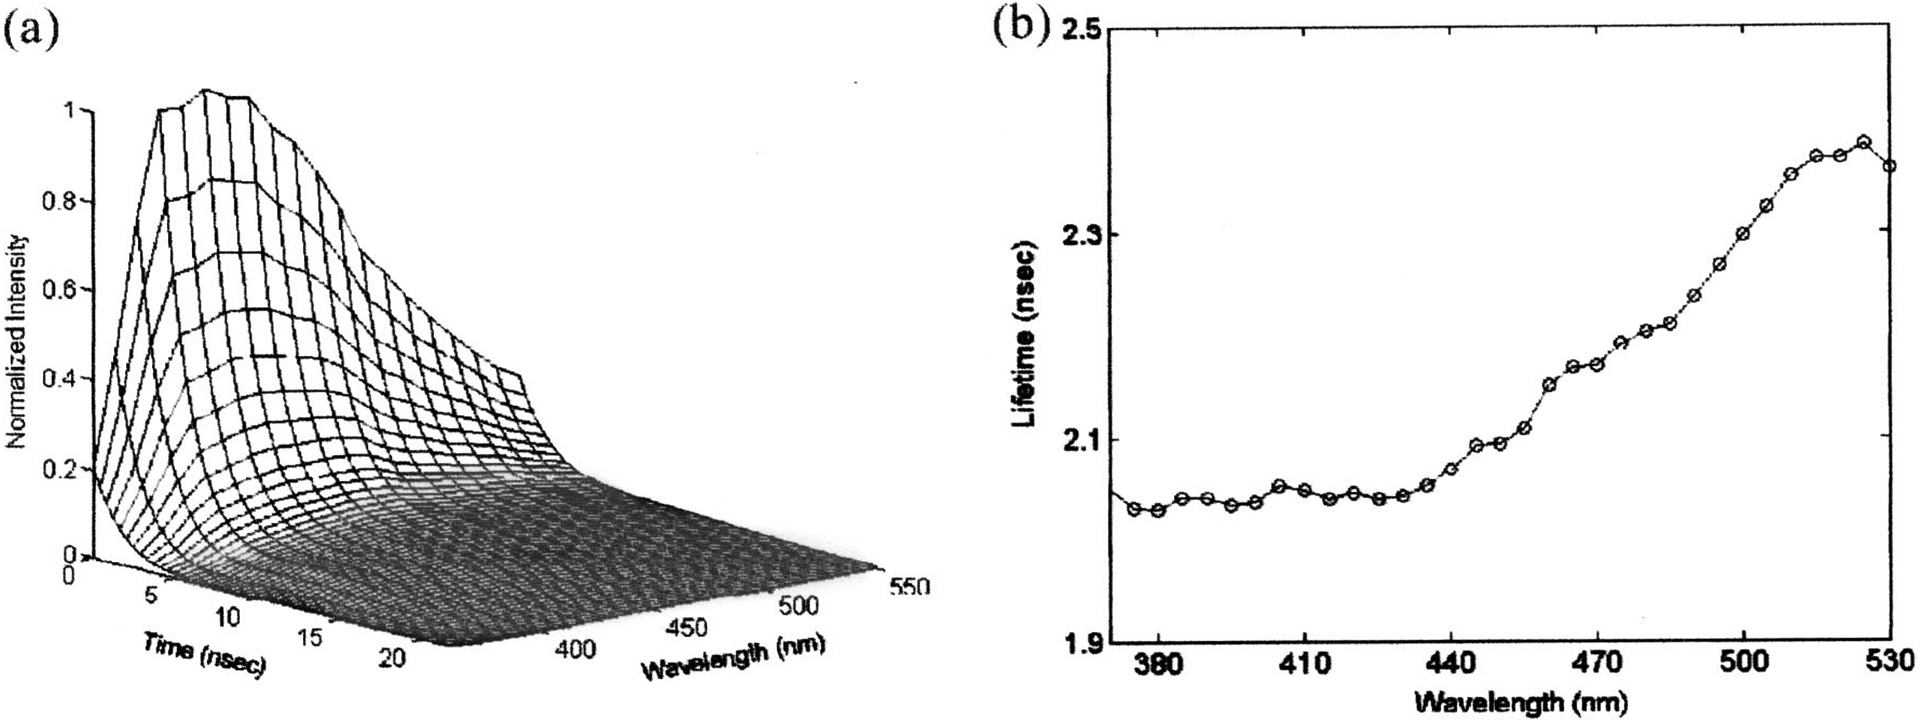
Fluorescence emission spectrum and lifetime of elastin from human aorta; (a) three-dimensional time-resolved spectrum, (b) florescence lifetime as a function of wavelength (top) and time-integrated fluorescence spectrum (bottom). Lifetime was deconvoluted based on the Laguerre basis expansion technique.
FIG. 9.
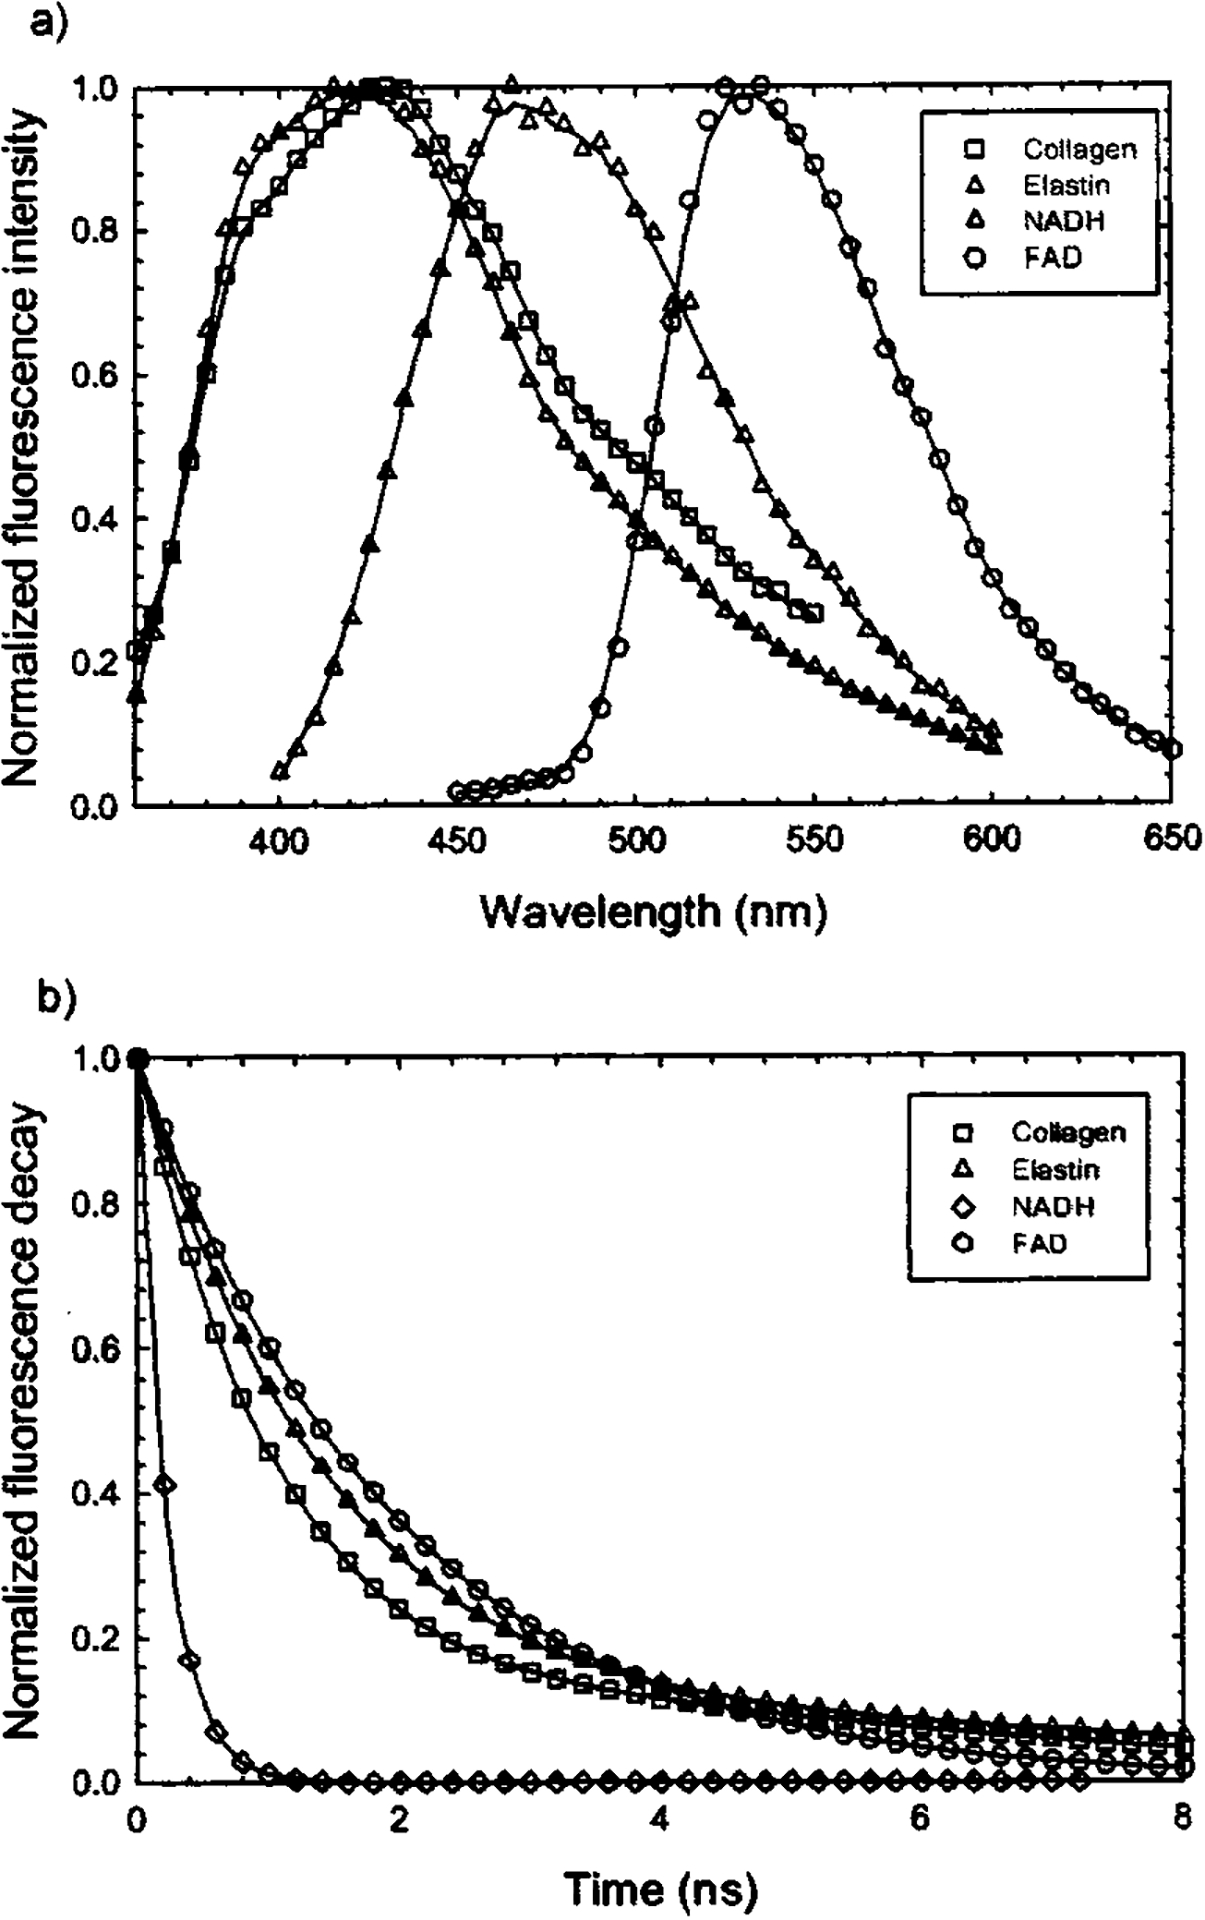
Fluorescence emission spectra and decay traces of elastin (420 nm), collagens type I from calfskin (410 nm), NADH (450 nm), and FAD (550 nm): (a) time-integrated spectra; (b) deconvolved (based on the Laguerre basis expansion technique) fluorescence decay traces obtained at the specified wavelength.
TABLE III.
Fluorescence lifetime values of typical biomolecules.
V. DISCUSSION
In this work we developed a robust time-domain fluorescence spectroscopy apparatus for in vivo investigation of biological systems. The apparatus enables fast acquisition of the entire fluorescence decay at multiple wavelengths with high sensitivity, and is compatible with the clinical environment.
The commercially available fast digitizers with bandwidth of 1 GHz or higher have enabled the use of pulse sampling techniques for acquiring fluorescence decay in a single-shot fashion with subnanosecond resolution.36,48 Endogenous fluorescence decay from biological tissue components is, typically, on the subnanosecond to nanosecond scales. Hence, based on this technique, we have developed a tr-LIFS apparatus able to meet these requirements. For a given 200 nm spectral range, the acquisition and display of fluorescence decay can be completed within 40 s, which is within the practical time limits of clinical procedures.
To minimize data acquisition time, several design aspects have been addressed in the new apparatus. All major components were selected such that they can be easily interfaced with a computer. Therefore, data acquisition and analysis are fully automated. One of the primary restrictions preventing fast data acquisition in earlier pulse sampling based systems has been the necessity to move large amounts of data from the digitizer to the host computer. This issue has been addressed in two ways. Taking advantage of the fully functional computer integrated inside the digital oscilloscope, the acquired data were initially saved directly on the oscilloscope memory and later transferred to the computer workstation. This technique lowers the acquisition bandwidth requirement between the oscilloscope and the host computer from 9 M bytes (including both command and data) to less than 100 bytes per wavelength (command only). In addition, the LAN between the scope and the host computer increases the bandwidth to 100 Mbytes/s from 1.5 Mbytes/s of the conventional GPIB interface. As a result, the time required to acquire each fluorescence decay trace and transfer to the host computer has been reduced to less than 200 ms. This time is mostly spent on grating rotation and waveform acquisition by the oscilloscope.
The use of imaging spectrograph provides some intrinsic advantages over the traditional monochromator. First, it acquires the whole spectrum in a scan-free manner using detector arrays such as photodiode arrays or CCD. Second, when a streak camera6 or ICCD camera is used, the time-resolved fluorescence spectra can be obtained without scanning in the spectral domain. Third, it can provide location-specific information along the direction of the input slit height. In the current system, these features enable the instrument obtaining the steady-state spectral quickly without spectral domain scanning. Furthermore, future expansion to the apparatus based on these features may lead to a fluorescence lifetime imaging system by using a fast time-gated ICCD camera.
The current tr-LIFS apparatus also incorporates fast data analysis features to analyze the acquired data in near real time providing the time-resolved and time-integrated spectra as well as the decay traces at user-defined wavelengths. The lifetime of the fluorescence decay at each wavelength, however, still needs to be retrieved offline using various data analysis techniques. Recent development of advanced deconvolution algorithms has shown that using the Laguerre basis expansion for retrieving the lifetime has several advantages over classic multiexponential expansion in terms of faster convergence to a unique solution and stronger correlation between the Laguerre expansion coefficients and lifetime.41 The tr-LIFS system reported here has implemented both techniques for data analysis.
The spectral resolution of the system can be selected to fit the nature of the application. Although the highest spectral resolution of the system is 0.5 nm, it can be substantially reduced as a trade-off for better SNR depending on the sample and/or acquisition geometry. For example, a resolution of 5.0 nm may be necessary for clinical investigation where fast data acquisition is required and signal intensity may be low. On the other hand, a resolution of 1.0 nm or higher may be suitable for ex vivo investigations where the data acquisition time may be of lesser concern.
The MCP-PMT is capable of detecting fast fluorescence decay (~300 ps) with a large dynamic range and high sensitivity. In this study, the MCP-PMT was gated with a 1.0 μs, 30 V square-wave pulse train provided by the digital delay generator. Using such a configuration, the current apparatus is capable of measuring fluorescence decay from a few hundred picoseconds up to a few hundred nanoseconds in the monochromator mode. For longer decay, the ICCD camera can be used with nanosecond resolution or when additional high-voltage gating electronics are needed for the MCP-PMT.
In the monochromator mode, the current system’s temporal resolution has been determined to be 300 ps by measuring the response of picosecond laser pulses and it is sufficient for measuring the subnanosecond or longer fluorescence decay of most biological components known to fluoresce in tissue. The results were verified by obtaining the lifetime of a series of standard fluorophores with fast fluorescence decay. The temporal resolution of this system is mainly limited by the analog bandwidth of the real-time digital storage oscilloscope (1 GHz), the MCP-PMT (1.5 GHz), and the preamplifier (1.5 GHz). At present, there is no commercially available MCP-PMT with bandwidth higher than 1.5 GHz, while the fastest commercial digital oscilloscopes are 6 GHz with 75 ps rise time. These factors currently limit the application of the pulse sampling technique to measurements of fluorescence decay of a few hundred picoseconds or longer.
We have used several fluorescence standard dyes and typical tissue fluorophores to evaluate the tr-LIFS system performance. The retrieved lifetimes are in reasonable agreement with the values reported in the literature obtained using TCSPC and pulse sampling techniques (Table II). The differences between our measurements and the previously reported values are due to various purification and preparation methods used by different vendors. We have further demonstrated the ability of the tr-LIFS instrument to resolve mixed fluorophores both spectrally and temporally. Diluted (10−6 M) mixture solutions were used in these measurements to minimize the interaction between the two fluorophores used in the mixtures.
In summary, the tr-LIFS instrument is a compact and mobile system that can be used for performing spectroscopic studies of endogenous fluorescence from biological tissues in vitro and in vivo. It provides both time-resolved and spectrally resolved fluorescence emission information of the sample in less than 0.8 s per wavelength and with good dynamic range and sensitivity. These features are important for clinical studies on patients undergoing routine diagnostic and intraoperative procedures. Current studies are underway for in vivo investigation of atherosclerotic lesions on a rabbit atherosclerotic plaque model and on human brain tumors.
ACKNOWLEDGMENTS
The authors would like to acknowledge Nazanin Yaghoobian and Chien Sun for their help with the experimental setup and sample preparation. This work was supported in part by the National Institutes of Health Research Grant No. RO1 HL 67377 and the Whitaker Foundation.
References
- 1.Lakowicz JR, Principles of Fluorescence Spectroscopy, 2nd ed. (Kluwer Academic/Plenum, New York, 1999). [Google Scholar]
- 2.Wagnieres GA, Star WM, and Wilson BC, Photochem. Photobiol 68, 603 (1998). [PubMed] [Google Scholar]
- 3.Ramanujam N, Neoplasia 2, 89 (2000). [DOI] [PMC free article] [PubMed] [Google Scholar]
- 4.Richards-Kortum R and Sevick-Muraca EM, Annu. Rev. Phys. Chem 47, 555 (1996). [DOI] [PubMed] [Google Scholar]
- 5.Alfano RR, Tata DB, Cordero J, Tomashefsky P, Longo FW, and Alfano MA, IEEE J. Quantum Electron 20, 1507 (1984). [Google Scholar]
- 6.Glanzmann T, Ballini JP, van den Bergh H, and Wagnieres G, Rev. Sci. Instrum 70, 4067 (1999). [Google Scholar]
- 7.Pitts JD, Sloboda RD, Dragnev KH, Dmitrovsky E, and Mycek MA, J. Biomed. Opt 6, 31 (2001). [DOI] [PubMed] [Google Scholar]
- 8.Anderssonengels S, Johansson J, Svanberg K, and Svanberg S, Photochem. Photobiol 53, 807 (1991). [DOI] [PubMed] [Google Scholar]
- 9.Wagnieres G, Hadjur C, Grosjean P, Braichotte D, Savary JF, Monnier P, and van den Bergh H, Photochem. Photobiol 68, 382 (1998). [PubMed] [Google Scholar]
- 10.Siegel J, Suhling K, Leveque-Fort S, Webb SED, Davis DM, Phillips D, Sabharwal Y, and French PMW, Rev. Sci. Instrum 74, 182 (2003). [Google Scholar]
- 11.Deckelbaum LI, Desai SP, Kim C, and Scott JJ, Lasers Surg. Med 16, 226 (1995). [DOI] [PubMed] [Google Scholar]
- 12.Gregoire J, Edwards WD, Jeong MH, Camrud AR, Lerman A, VanTassel RA, Bailey KR, Holmes DR, and Schwartz RS, Lasers Surg. Med 21, 374 (1997). [DOI] [PubMed] [Google Scholar]
- 13.Pitts JD and Mycek MA, Rev. Sci. Instrum 72, 3061 (2001). [Google Scholar]
- 14.Cubeddu R, Comelli D, D’Andrea C, Taroni P, and Valentini G, J. Phys. D 35, R61 (2002). [Google Scholar]
- 15.Anghelolu GO, van de Poll SWE, Arendt JT, Mueller MG, Georgakoudi I, Haka A, Kuban B, Zhang QG, Myles J, Fitzmaurice M, Kramer JR, and Feld MS, J. Am. Coll. Cardiol 39, 45A (2002). [Google Scholar]
- 16.Georgakoudi I, Sheets EE, Muller MG, Backman V, Crum CP, Badizadegan K, Dasari RR, and Feld MS, Am. J. Obstet. Gynecol 186, 374 (2002). [DOI] [PubMed] [Google Scholar]
- 17.Georgakoudi I, Jacobson BC, Muller MG, Sheets EE, Badizadegan K, Carr-Locke DL, Crum CP, Boone CW, Dasari RR, Van Dam J, and Feld MS, Cancer Res. 62, 682 (2002). [PubMed] [Google Scholar]
- 18.Georgakoudi I, Jacobson BC, Van Dam J, Backman V, Wallace MB, Muller MG, Zhang Q, Badizadegan K, Sun D, Thomas GA, Perelman LT, and Feld MS, Gastroenterology 120, 1620 (2001). [DOI] [PubMed] [Google Scholar]
- 19.Wallace MB, Perelman LT, Backman V, Crawford JM, Fitzmaurice M, Seiler M, Badizadegan K, Shields SJ, Itzkan I, Dasari RR, Van Dam J, and Feld MS, Gastroenterology 119, 677 (2000). [DOI] [PubMed] [Google Scholar]
- 20.Wang TD, Crawford JM, Feld MS, Wang Y, Itzkan I, and Van Dam J, Gastrointest. Endosc 49, 447 (1999). [DOI] [PubMed] [Google Scholar]
- 21.Dhingra JK, Zhang X, McMillan K, Kabani S, Manoharan R, Itzkan I, Feld MS, and Shapshay SM, Laryngoscope 108, 471 (1998). [DOI] [PubMed] [Google Scholar]
- 22.Ingrams DR, Dhingra JK, Roy K, Perrault DF, Bottrill ID, Kabani S, Rebeiz EE, Pankratov MM, Shapshay SM, Manoharan R, Itzkan I, and Feld MS, Head Neck 19, 27 (1997). [DOI] [PubMed] [Google Scholar]
- 23.Das BB, Liu F, and Alfano RR, Rep. Prog. Phys 60, 227 (1997). [Google Scholar]
- 24.Alexander AL, Davenport CMC, and Gmitro AF, Opt. Eng. (Bellingham) 33, 167 (1994). [Google Scholar]
- 25.Stavridi M, Marmarelis VZ, and Grundfest WS, Med. Eng. Phys 17, 595 (1995). [DOI] [PubMed] [Google Scholar]
- 26.Warren S, Pope K, Yazdi Y, Welch AJ, Thomsen S, Johnston AL, Davis MJ, and Richardskortum R, IEEE Trans. Biomed. Eng 42, 121 (1995). [DOI] [PubMed] [Google Scholar]
- 27.Goujon D, Zellweger M, Radu A, Grosjean P, Weber BC, van den Bergh H, Monnier P, and Wagnieres G, J. Biomed. Opt 8, 17 (2003). [DOI] [PubMed] [Google Scholar]
- 28.Mycek MA, Pitts JD, Sloboda RD, Dragnev KH, and Dmitrovsky E, Biophys. J 80, 1532 (2001). [DOI] [PubMed] [Google Scholar]
- 29.Zellweger M, Goujon D, Conde R, Forrer M, van den Bergh H, and Wagnieres G, Appl. Opt 40, 3784 (2001). [DOI] [PubMed] [Google Scholar]
- 30.Zellweger M, Grosjean P, Goujon D, Monnier P, van den Bergh H, and Wagnieres G, J. Biomed. Opt 6, 41 (2001). [DOI] [PubMed] [Google Scholar]
- 31.Mizeret J, Stepinac T, Hansroul M, Studzinski A, van den Bergh H, and Wagnieres G, Rev. Sci. Instrum 70, 4689 (1999). [Google Scholar]
- 32.Mycek MA, Schomacker KT, and Nishioka NS, Gastrointest. Endosc 48, 390 (1998). [DOI] [PubMed] [Google Scholar]
- 33.Pfefer TJ, Paithankar DY, Poneros JM, Schomacker KT, and Nishioka NS, Lasers Surg. Med 32, 10 (2003). [DOI] [PubMed] [Google Scholar]
- 34.Wiessner A and Staerk H, Rev. Sci. Instrum 64, 3430 (1993). [Google Scholar]
- 35.Maarek JMI, Marcu L, Fishbein MC, and Grundfest WS, Lasers Surg. Med 27, 241 (2000). [DOI] [PubMed] [Google Scholar]
- 36.Pogue BW, Pitts JD, Mycek MA, Sloboda RD, Wilmot CM, Brandsema JF, and O’Hara JA, Photochem. Photobiol 74, 817 (2001). [DOI] [PubMed] [Google Scholar]
- 37.Papaioannou T, Preyer NW, Fang Q, Brightwell A, Carnohan M, Cottone G, Ross R, Jones LR, and Marcu L, Appl. Opt (submitted). [DOI] [PMC free article] [PubMed]
- 38.Lee KCB, Siegel J, Webb SED, Leveque-Fort S, Cole MJ, Jones R, Dowling K, Lever MJ, and French PMW, Biophys. J 81, 1265 (2001). [DOI] [PMC free article] [PubMed] [Google Scholar]
- 39.Marmarelis VZ, Ann. Biomed. Eng 21, 573 (1993). [DOI] [PubMed] [Google Scholar]
- 40.Maarek JMI, Marcu L, Snyder WJ, and Grundfest WS, Photochem. Photobiol 71, 178 (2000). [DOI] [PubMed] [Google Scholar]
- 41.Jo JA, Fang Q, Papaioannou T, and Marcu L, J. Biomed. Opt (in press). [DOI] [PMC free article] [PubMed]
- 42.Du H, Fuh RCA, Li JZ, Corkan LA, and Lindsey JS, Photochem. Photobiol 68, 141 (1998). [Google Scholar]
- 43.Fleming GR, Knight AWE, Morris JM, Morrison RJS, and Robinson GW, J. Am. Chem. Soc 99, 4306 (1977). [Google Scholar]
- 44.Chen RF, Anal. Biochem 57, 593 (1974). [DOI] [PubMed] [Google Scholar]
- 45.Koester VJ and Dowben RM, Rev. Sci. Instrum 49, 1186 (1978). [DOI] [PubMed] [Google Scholar]
- 46.Marcu L, Grundfest WS, and Maarek JMI, Photochem. Photobiol 69, 713 (1999). [PubMed] [Google Scholar]
- 47.Marcu L, Cohen D, Maarek JMI, and Grundfest WS, Proc. SPIE 3917, 93 (2000). [Google Scholar]
- 48.Marcu L, Fishbein MC, Maarek JMI, and Grundfest WS, Arterioscler., Thromb., Vasc. Biol 21, 1244 (2001). [DOI] [PubMed] [Google Scholar]


