

Abstract
Red tilapia (Oreochromis spp.) is one of the most popular fish in China due to its bright red appearance, fast growth rate, and strong adaptability. Understanding the sex determination mechanisms is of vital importance for the selection of all-male lines to increase aquacultural production of red tilapia. In this research, the genetic architecture for sex from four mapping populations (n=1 090) of red tilapia was analyzed by quantitative trait loci (QTL)-seq, linkage-based QTL mapping, and linkage disequilibrium (LD)-based genome-wide association studies. Two genome-wide significant QTL intervals associated with sex were identified on ChrLG1 (22.4–23.9 Mb) and ChrLG23 (32.0–35.9 Mb), respectively. The QTL on ChrLG1 was detected in family 1 (FAM1), FAM2, and FAM4, and the other QTL on ChrLG23 was detected in FAM3 and FAM4. Four microsatellite markers located within the QTL were successfully developed for marker-assisted selection. Interestingly, three (lpp, sox14, and amh) of the 12 candidate genes located near or on the two QTL intervals were abundantly expressed in males, while the remaining genes were more highly expressed in females. Seven genes (scly, ube3a, lpp, gpr17, oca2, cog4, and atp10a) were significantly differentially expressed between the male and female groups. Furthermore, LD block analysis suggested that a cluster of genes on ChrLG23 may participate in regulating sex development in red tilapia. Our study provides important information on the genetic architecture of sex in red tilapia and should facilitate further exploration of sex determination mechanisms in this species.
Keywords: Red tilapia, QTL mapping, Sex, SNPs
INTRODUCTION
Sex determination (SD) is highly complex in vertebrates and can be classified into environmental sex determination (ESD), genetic sex determination (GSD), and their combination (Bachtrog et al, 2014; Li & Gui, 2018; Nagahama et al, 2021; Rajendiran et al, 2021; Renn & Hurd, 2021). The GSD system can be further classified into the male heterogametic system (sex chromosome: XX/XY), female heterogametic system (sex chromosome: ZW/ZZ), and polygenic SD system (Geffroy et al, 2021; Nagahama et al, 2021; Toyota et al, 2021). The two sex chromosome systems have been identified in fish, but most species have no obvious morphological sex chromosome (Feller et al, 2021; Nakamura, 2009; Sarre et al, 2011; Xue et al, 2021). Recently, multiple chromosomes have been found to determine sex in distinct fish species such as Amazonian catfish (Sassi et al, 2020).
Tilapia is one of the most important fish groups in world aquaculture. In 2018, global aquaculture production of tilapia (including Oreochromis niloticus, O. aureus (blue tilapia), and Oreochromisspp. (e.g., red tilapia)) reached 5.57 million tons, second only to carp (FAO, 2020). Tilapia is an excellent model for exploring sex determination mechanisms (Wessels et al, 2017). Both GSD and ESD sex regulation have been identified in different tilapia species. The female ZW/ZZ system is dominant in O. aureus (Mair et al, 1991b), while the male XX/XY system is found inO. niloticus and Sarotherodon melanotheron (Gammerdinger et al, 2016; Mair et al, 1991a).
Genetic markers associated with sex determination have been successfully detected on ChrLG1 (O. niloticus), ChrLG3 (O. karongae, Tilapia mariae, and O. aureus), and ChrLG23 (a cross between red tilapia andO. niloticus) in various tilapia (Cnaani et al, 2008; Cnaani et al, 2004; Ezaz et al, 2004; Gammerdinger et al, 2016; Lee et al, 2004; Lee et al, 2005; Liu et al, 2013). ChrLG3 has been considered as a potential sex chromosome due to the abnormal morphology of chromosomes in blue and Nile tilapia (Cnaani et al, 2008; Triay et al, 2020). Recent progress in quantitative trait loci (QTL) mapping with high-throughput sequencing data suggests there are genome-wide significant QTL controlling sex on ChrLG1 (10.1–18.9 Mb), ChrLG3 (40–80 Mb), ChrLG20 (12.6–29.1 Mb), ChrLG22 and ChrLG23 (24–40 Mb) in Nile tilapia (Gammerdinger et al, 2016; Palaiokostas et al, 2013; Triay et al, 2020).
Identification of sex-related genes is of great significance for tilapia breeding using molecular techniques. The first SD gene reported in fish, Dmy, is required for normal male development in medaka (Matsuda et al, 2002). In tilapia, amhy, a Y-specific duplicate of the anti-Müllerian hormone (amh) gene, regulates male development in Nile tilapia (Li et al, 2015; Taslima et al, 2020; Triay et al, 2020). Recently, several sex-related genes, such as tsp1a, have been implicated in female folliculogenesis development in Nile tilapia (Jie et al, 2020), and Paics shows female-specific patterns during early gonadogenesis (Tao et al, 2021). However, most studies have focused on the identification of sex-related genes in Nile and blue tilapia, with limited research on red tilapia.
Red tilapia is popular in aquaculture due to its bright red appearance, fast growth rate, high salinity tolerance, high commercial value, and strong adaptability (Jiang et al, 2019; Li et al, 2019; Pradeep et al, 2014). Nevertheless, red tilapia has a complex genetic background, and may originate from Nile, blue, and Mozambique tilapia (Sandeep et al, 2012; Xia et al, 2015). To increase red tilapia yield in aquaculture by controlling sex, it is crucial to explore the genetic architecture of sex. At present, however, the sex determination mechanism in red tilapia remains unclear.
In this study, we carried out integrative QTL mapping analysis for sex in four mapping populations using QTL-seq, linkage-based QTL mapping, and linkage disequilibrium (LD)-based genome-wide association studies (GWAS). Two genome-wide significant QTL associated with sex were identified and four sex-related markers were developed for red tilapia. Our findings provide a basis for the functional analysis of the sex determination mechanism and selection of all-male lines in red tilapia.
METHODS AND MATERIALS
Ethics statement
This project was conducted in accordance with the regulations and guidelines established by the Animal Care and Use Committee of the School of Life Sciences, Sun Yat-Sen University, Guangzhou, China. All experiments received approval.
Fish sources and management
Four red tilapia families were produced and raised at the hatchery of the Aquatic Science and Technology Development Company of Guangdong Wulonggang (China). A full-sibling family (named FAM1) was produced by crossing a pair of red tilapia parents. A second full-sibling family (FAM2) was generated by crossing a male red tilapia and a female Nile tilapia. A mixed population (FAM3) was generated by crossing multiple pairs of red tilapias (28 females and 10 males). In addition, we selected a male red tilapia from FAM3 and a female red tilapia from another population to produce a full-sibling F2 family (FAM4). Information on all populations is shown in Table 1.
Table 1. Summary information on parents and QTL mapping for four families/populations.
| Population name | Male parent | Female parent | Offspring number sampled (n) | QTL interval defined | Fst value | Peak LOD value | Minimum
P-value |
Significant SNP number (n) | |
| –: Not available. LOD: Logarithm of odds. | |||||||||
| FAM1 | Red tilapia | Red tilapia | 204 | Female: 80 | ChrLG1(22.4Mb-25.7Mb) | 0.208–0.269 | – | – | – |
| Male: 124 | |||||||||
| FAM2 | Red tilapia | Nile tilapia | 103 | Female: 46 | ChrLG1(19.0Mb-23.9Mb) | – | 5.01 | – | 18 |
| Male: 57 | |||||||||
| FAM3 | 10 red tilapias | 28 red tilapias | 496 | Female: 286 | ChrLG23(32.4Mb-36.0Mb) | – | – | 4.56E-6 | 4 |
| Male: 210 | |||||||||
| FAM4 | Red tilapia
(FAM3) |
Red tilapia | 287 | Female: 144 | ChrLG1(22.5Mb-28.8Mb) | – | 8.03 | – | 37 |
| Male: 143 | ChrLG23(32.0Mb-35.9Mb) | 27.71 | 31 | ||||||
All fingerlings from each family at 30 days post-hatch were transferred to a pond (~1 000 m2) until sexual maturity (3–4 months). Phenotypic sex for each tilapia was determined by visual inspection. Fins from each fish were collected and stored in absolute ethanol until DNA extraction.
To identify gonadal gene expression, four male and four female red tilapia (~180 days post-hatch) were randomly selected at the fish facility of the School of Life Sciences, Sun Yat-Sen University. Indoor tanks (water depth 70 cm, volume 500 L) with a recirculating freshwater system and a 12 D:12 L photoperiod were used. The fish room was maintained at 25–28 °C and dissolved oxygen (DO) was kept at >6 mg O 2/L. The fish were fed with tilapia pellets twice a day. We immediately dissected collected gonads from each individual after the tilapia had been anesthetized by MS-222. The tissue samples were immediately frozen in liquid nitrogen and stored at −80 °C.
DNA extraction
Genomic DNA was extracted from fin tissue using a HiPure Tissue DNA Mini Kit (Magen, China) according to the manufacturer’s protocols. RNA was extracted using RNase A, and genomic DNA quality was then evaluated with 0.8% agarose gel electrophoresis and quantified using a Qubit Fluorometer (v3.0; Invitrogen, USA).
Genotyping FAM1 using QTL-seq
FAM1 contained 204 individuals. For QTL mapping using QTL-seq, 30 females and 30 males from FAM1 were selected. Genomic DNA was extracted from each sample. We pooled 300 ng of genomic DNA from each sample to form two sex-special bulk DNA samples. The two DNA samples were then submitted to the Novogene Company (China) for Illumina Hiseq PE150 sequencing.
Clean data were obtained by removing adapters and low-quality reads using FASTQC software (v0.11.2) and then mapped against the Nile tilapia reference genome (oreNil2.fa) downloaded from the Ensembl database (www.ensembl.org) using bowtie2 (Langmead & Salzberg, 2012). Popoolation2 (Kofler et al, 2011) was applied to calculate genome-wide Fst values using a sliding window approach between female and male samples with parameters set to min-qual 20, -min-count 2, -min-coverage 16, -max-coverage 200, -min-covered-fraction 0.0, -window-size 10 000, and -step-size 5 000. Generated Fst values with single-nucleotide polymorphisms (SNPs) less than three in a window were then filtered. The empirical threshold a=0.001 was considered as the genome-wide significance threshold. Only QTL intervals containing at least two genome-wide significant Fst values were considered to be genome-wide significant. The data were deposited in the DDBJ BioProject database under BioProject No. PRJDB7709.
Genotyping FAM2, FAM3, and FAM4 using ddRAD-seq
Three DNA libraries (libraries 1, 2, and 3) were constructed for FAM2, FAM3, and FAM4 using previously described protocols (Nyinondi et al, 2020; Peterson et al, 2012; Zhu et al, 2021). For each sample, 300 ng of genomic DNA was used during library construction. The FAM2, FAM3, and FAM4 libraries were composed of 103, 496, and 287 samples, respectively. The libraries were submitted to Novogene Company (China) for Illumina HiSeq PE150 sequencing.
Clean data for each sample were aligned against the Nile tilapia reference genome (Oreochromis_niloticus.O_niloticus_UMD_NMBU.dna.toplevel.fa) using Bowtie2 (Langmead & Salzberg, 2012) and Stacks (v2.0) (Rochette et al, 2019). SNP calling was carried out using the mpileup pipeline implemented in SAMtools and bcftools (parameter set to Dugf) (Li et al, 2009). To identify SNPs with high confidence, a strict filtering process was established to refine the genotype data. Firstly, the output data were filtered with a total depth >2 000 reads with a Phred-scaled quality score (assertion made in alternate base) <10. For each sample, SNPs with a read depth <4, genotype quality (GQ) <10, and PL (likelihoods of given genotypes) >10 were then removed. The remaining SNPs from the two full-sibling families (FAM2 and FAM4) with missing data rates ≤1% were retained. For the mass cross-population FAM3, SNPs with missing data rates ≤5% were retained. All allele frequencies less than 0.1 or larger than 0.9 within each library were filtered in case of genotyping errors.
Linkage-based QTL analysis, GWAS, and population stratification assessment
Phenotypic sex was treated as a binary trait (0 for females and 1 for males). For the two full-sibling families (FAM2 and FAM4), a genetic map was first generated using JoinMap (v4.0) (van Ooijen, 2011), with QTL for sex then mapped using MapQTL (v6.0) (van Ooijen, 2009). Interval mapping (IM) was used to identify potential QTL for the initial time. Cofactor automatic selection analysis was used. Ultimately, multiple QTL mapping (MQM) analysis was performed using the recommended cofactors to identify QTL. In addition, 10 000 permutation tests were conducted, and relative cumulative values in the interval of 0.95 were used to determine the significant logarithm of odds (LOD) thresholds at the genome-wide and chromosomal levels.
For GWAS analysis of FAM3 (mass cross population), TASSEL v5.0 (http://www.maizegenetics.net/tassel) was applied. The possible population structure was detected using the allele sharing coefficient matrix (K) and principal component analysis (PCA) (Menozzi et al, 1978). A mixed linear model (MLM) and general linear model (GLM) were executed on the genotypic and sex data. Significance of multiple SNP loci was adjusted using the false discovery rate (FDR) and Bonferroni method. A genome-wide significant SNP was defined by a raw P-value of <0.05/ N (number of SNP loci tested in this population) (Zhang et al, 2013). Genomic inflation (λ) was applied to estimate population stratification based on P-value data by R (method=“median”), with that closest to 1.00 considered optimal (Leamy et al, 2017). Quantile-quantile (QQ) plots were used to appraise deviation from the expected distribution of SNPs not associated with the trait of interest (Wang et al, 2014). The R function “CMplot” was used to draw the Manhattan plots of the association data and QQ plots of theP-values.
LD analysis
LDBlockShow software (Dong et al, 2021) was applied to generate an LD heatmap from VCF files after the genotype data format was converted by TASSEL v5.0 (http://www.maizegenetics.net/tassel). The region for LD analysis and method to detect Block were set using parameters “-Region” and “- BlockType”. P-values for the GWAS and GFF3 files were entered using parameters “-InGWAS” and “-InGFF”. An LD block was recognized when the lower bounds of the R2 value exceeded 0.8. A map of candidate genes in the interval was downloaded from the Ensembl website (https://www.ensembl.org/index.html).
Confirmation of QTL by microsatellite genotyping
To verify the identified QTL intervals, we designed four microsatellite markers on chrLG1 and five microsatellite markers on chrLG23 using the online program Primer-BLAST (www.ncbi.nlm.nih.gov/tools/primer-blast/). The markers on chrLG1 were genotyped for 204 individuals in FAM1, and the markers on chrLG23 were used for genotyping 204 fish in FAM4. All primer sequences are listed in Supplementary Table S1.
Polymerase chain reaction (PCR) amplifications were carried out in a total volume of 20 μL containing 2×PCR master mix, 10 ng of genomic DNA, and 0.5 μmol/L forward and reverse primers (Aiji, China) in a Bio-Rad cycler (USA). The following PCR program during was applied (one cycle of 3 min at 95 °C, 35 cycles of 30 s at 95 °C, 30 s at 60 °C, and 30 s at 72 °C, final extension of 10 min at 72 °C). The PCR products were detected by electrophoresis using 8% polyacrylamide gels and silver staining.
RNA extraction and quantitative real-time PCR (qRT-PCR) analysis
Total RNA from samples was isolated using TRIzol reagent (Invitrogen, UK) according to the manufacturer’s protocols. RNA quality and quantity were assessed using a NanoDrop 2000 (Thermo Scientific, USA) and electrophoresis in 1.5% agarose gel.
RNA samples collected from four male and four female red tilapia gonads at 180 dph were used for gene expression analysis. And cDNA was reverse transcribed using 2 μg of total RNA for each sample with an RT-PCR kit (Dongsheng Biotech, China). In brief, a mixture of 2 μg of DNAse I-treated total RNA, 1 μL of oligo dT primer, and RNase-free ddH2O in a volume of 13.4 μL was kept at 70 °C for 5 min, and then placed in an ice bath for 5 min. In total, 6.6 μL of the mixture (including 4 μL of 5×first-strand buffer, 1 μL of dNTPs, 0.6 μL of RNasin, and 1 μL of M-MLV) was added to the tube and maintained at 42 °C for 60 min, then a final step at 70 °C for 5 min to end the reaction. The thermal cycles were conducted in a PCR machine (Bio-Rad, USA). The obtained cDNA was kept at −20 °C until use.
Here, qRT-PCR was conducted in a Roche photoperiod 480 real-time PCR system (Roche, Switzerland). The total volume for each reaction was 10 μL, including 5 μL of 2×SYBR green MasterMix reagents, 1 μL of 1:10 diluted cDNA template, and 0.2 μL of each primer (10 μmol/L) (Supplementary Table S2). The thermal cycling profile was composed of pre-incubation at 95 °C for 3 min, 40 cycles of denaturing at 95 °C for 15 s, annealing at 60 °C for 15 s, and expansion at 72 °C for 20 s. A final cycle including 95 °C for 15s, 65 °C for 15s and increase slowly to 95 °C was used in creating the melting curve. Four replicates were applied to each of the samples. The Ef1α gene was used as an internal reference gene. A two-sided t-test was used to compare expression levels.
Verifying Y-specific duplicate of amh gene using amh Y chromosome markers
To verify whether there was a Y-specific duplicate of theamh gene in red tilapia, six females and six males from each of the FAM2, FAM3, and FAM4 families were randomly selected. Three amh Y chromosome markers (amhΔY+5, amhΔY-233, and amhY-5608) were applied to verify amhy in red tilapia males (Supplementary Figure S1) (Triay et al, 2020). The marker sequences are listed in Supplementary Table S1. The PCR amplification reaction system and program during reactions were similar to those above. The PCR products were detected using 1.5% agarose gel electrophoresis.
RESULTS
QTL analysis of full-sibling family (FAM1)
Two pooled DNA samples (male and female groups) from the full-sibling family FAM1 were submitted for resequencing. In total, 20 Gb of data were obtained for each library. After removing low-quality reads, 70 007 450 and 65 904 289 reads were retained for the male and female libraries, respectively. Overall, 91.71% of reads were successfully mapped to the tilapia genome. Furthermore, 2 975 575 SNPs and 70 946 sliding windows were detected in the two libraries. Total SNP number in each window was more than 20 (average of 41.9). The Fst values in each window ranged from 0.005 to 0.269 (average of 0.053). The minimum Fst value for the first 1/1 000 window was 0.208 (ranging from 0.208 to 0.269), which was empirically considered as the genome-wide significant threshold (experience threshold of α=0.001). The Fst values of each chromosome in the QTL-seq results are summarized in Supplementary Table S2.
Based on the empirical threshold, we discovered a genome-wide significant QTL interval between chrLG1: 22.4 Mb and 25.7 Mb (Figure 1). The average Fst value of the QTL region was 0.230 (0.014 SD, standard deviation), which was much higher than the average Fst value of each window between the two sex groups. Within the QTL interval, the peak position was ~24.0 Mb and Fst value was 0.269.
Figure 1.

Genome-wide significant QTL intervals for sex identified by QTL-seq in FAM1
X-axis indicates chromosome numbers labeled with different colors. Y-axis is Fst values for each window in QTL-seq analysis. Experience threshold α=0.001 (Fst=0.2073) is indicated. Top Fst value for ChrLG1 is 0.269. Legend on upper right shows density of SNPs across genome, with green indicating low density and red indicating high density.
QTL analysis of FAM2 data generated from red tilapia and Nile tilapia cross
In total, 103 offspring (46 females and 57 males) and two parents in FAM2 were sampled and genotyped using ddRAD-seq. A total of 120 Gb of high-quality data were obtained and 1 724 high-quality SNP markers were identified after rigorous filtering. The SNP distribution across the tilapia genome is shown in Supplementary Table S3.
A QTL interval associated with sex in tilapia on chrLG1 was identified using MapQTL (v6.0). By MQM mapping, a genome-wide significant QTL located on chrLG1 (19–23.9 Mb) was detected in the hybrid tilapia family (FAM2). According to the permutation test results, the LOD values at 95% and 99% confidence intervals at the genome-wide level were 3.4 and 4.2, respectively. The QTL explained an average of 18.2% of phenotypic variance in the family. The LOD value for the SNP (ChrLG1_21096680) under the QTL peak was 5.01, with a phenotypic variance effect of 20.1%. The top 10 genome-wide significant SNP markers on ChrLG1 are listed in Table 2 and Supplementary Table S4. The genome scan for sex in tilapia using MapQTL (v6.0) is presented in Figure 2A.
Table 2. Phenotypic variance explained by top 10 SNPs with genome-wide significance on ChrLG1 or ChrLG23 in FAM2 and FAM4.
| Chromosome | Population name | Position (bp) | LOD value | Expl ( %) |
| LOD: logarithm of odds. Expl: Pecentage of phenotypic variance explained. | ||||
| ChrLG1 | FAM2 | 21096680 | 5.01 | 20.1 |
| ChrLG1 | 21096664 | 5.01 | 20.1 | |
| ChrLG1 | 21096727 | 5.01 | 20.1 | |
| ChrLG1 | 20761648 | 5.01 | 20.1 | |
| ChrLG1 | 20761731 | 5.01 | 20.1 | |
| ChrLG1 | 20761592 | 5.01 | 20.1 | |
| ChrLG1 | 18807025 | 4.56 | 18.4 | |
| ChrLG1 | 22632441 | 4.56 | 18.4 | |
| ChrLG1 | 22632627 | 4.56 | 18.4 | |
| ChrLG1 | 22632634 | 4.56 | 18.4 | |
| ChrLG1 | FAM4 | 25773945 | 8.03 | 12.7 |
| ChrLG1 | 23290008 | 7.69 | 12.8 | |
| ChrLG1 | 22511506 | 7.63 | 12.2 | |
| ChrLG1 | 28756890 | 7.47 | 14.4 | |
| ChrLG1 | 28756856 | 7.47 | 14.4 | |
| ChrLG1 | 22632460 | 7.47 | 11.7 | |
| ChrLG1 | 22632424 | 7.41 | 11.7 | |
| ChrLG1 | 22632442 | 7.37 | 11.6 | |
| ChrLG1 | 22511490 | 7.31 | 11.7 | |
| ChrLG1 | 22632627 | 7.27 | 11.6 | |
| ChrLG23 | FAM4 | 32948918 | 27.71 | 37.5 |
| ChrLG23 | 32970125 | 26.82 | 36.6 | |
| ChrLG23 | 33386273 | 26.25 | 36 | |
| ChrLG23 | 32512288 | 23.95 | 35 | |
| ChrLG23 | 35555909 | 22.11 | 30.9 | |
| ChrLG23 | 35555920 | 21.53 | 30.3 | |
| ChrLG23 | 35934888 | 18.86 | 27 | |
| ChrLG23 | 32904594 | 16.46 | 31.9 | |
| ChrLG23 | 43270127 | 16.38 | 28.7 | |
| ChrLG23 | 43738701 | 16 | 27.1 | |
Figure 2.

Genome-wide significant QTL intervals identified in FAM2, FAM3, and FAM4
A: FAM2: X-axis indicates chromosome numbers labeled with different colors. Y-axis is LOD value for each SNP marker. LOD values in 95% and 99% confidence intervals at genome-wide (GW) levels are 3.4 and 4.2, respectively. LOD value for peak SNP located on ChrLG1_21096680 is 5.01, with a phenotypic effect of 20.1%. B: FAM3: Y-axis is P-value for each SNP in GWAS, corrected by Bonferroni method. Corrected genome-wide significant threshold (8.12E−6) is indicated. There is one SNP on chrLG23 above the corrected threshold level. C: FAM4: X-axis indicates chromosome numbers labeled with different colors. Y-axis is LOD value for each SNP marker. LOD values in 95% and 99% confidence intervals at genome-wide (GW) level are 4.5 and 5.3, respectively. Top LOD value located on ChrLG1_25773945 is 8.03, with a phenotypic effect of 12.7%, top LOD value located on ChrLG23_32948918 is 27.71, with a phenotypic effect of 37.5%. Legend on upper right shows density of SNPs across genome, with green indicating low density and red indicating high density.
QTL analysis of FAM3 data using GWAS
FAM3 (mass cross population) was generated from a mixture of 38 red tilapia. In total, 496 offspring, including 286 females and 210 males, were sampled and genotyped, resulting in 210 Gb of data. After removing low-quality reads and SNPs, we retained 6 607 SNPs for QTL analysis. The SNP distributions across each chromosome were determined by GWAS and are shown in Supplementary Table S5.
The association of genotyping data with sex in red tilapia was analyzed using GWAS. Eleven PCs in the population were detected by PCA, which appropriately explained the population structure shown in the QQ plot (Supplementary Figure S2). According to the P<0.001 threshold, 26 SNPs were associated with sex on ChrLG23, with the remaining two SNPs located on ChrLG1 and ChrLG9, respectively. According to previous studies (Devlin et al, 2003; Yang et al, 2005), P-value correction was necessary to effectively reduce the false positive probability of SNPs. There were only 4 genome-wide significant SNPs on ChrLG23 associated with sex when FDR value was used as a threshold (Supplementary Fig.3), and only one SNP was still significant after being corrected by the Bonferroni method (pcorr < 8.12E −6) (Table 3).
Figure 3.

LD block analysis showing association of candidate genes within sex QTL interval on ChrLG23 in FAM3 and FAM4
A: Distribution of LD blocks along QTL interval on ChrLG23 in FAM3. B: Distribution of genes along QTL interval on ChrLG23. Five genes in orange show no significant expression difference between male and female groups, six genes in red show significant expression difference between male and female groups. C: Distribution of LD blocks along QTL interval on ChrLG23 in FAM4. LD blocks with R2 value=0.8 are shown in black triangles.
Table 3. Summary statistics of GWAS analysis for sex in FAM3.
| Marker ID | Marker_F | P-value | FDR | Add_F | Add_P-value |
| Marker ID indicates the chromosome name and the SNP position on the chromosome. The F value (Marker_F) and its probability (P-value) fromF statistics for the additive effect are provided. FDR: False discovery rate. | |||||
| ChrLG23_35663457 | 12.60914 | 4.65E-06 | 0.028636207 | 3.59342 | 0.05863 |
| ChrLG23_36005136 | 11.57792 | 1.24E-05 | 0.038201107 | 7.02688 | 0.00831 |
| ChrLG23_32401194 | 11.27328 | 1.66E-05 | 0.03398664 | 1.01453 | 0.31434 |
| ChrLG23_35647040 | 10.61033 | 3.11E-05 | 0.047895303 | 4.9333 | 0.02682 |
Thus, we identified a QTL interval on ChrLG23 that regulates sex in red tilapia, located between 32.4 and 36.0 Mb. The peak of this QTL was located at ChrLG23_35663457 bp (F=12.61, P=4.56E−6). The P-value distribution of all SNPs across the tilapia genome detected by GWAS analysis is shown in Figure 2B.
Within the sex QTL interval on ChrLG23 in FAM3, 12 LD blocks were identified when R2=1. The coverage distance for the larger six LD blocks was more than 50 kb, however, the distance for each of the remaining six blocks was less than 1 kb. This suggests strong LD at the gene level within the QTL region. When R2=0.8, four larger blocks (LB1:32.14–32.9 Mb, LB2:32.94–33.65 Mb, LB3:33.92–35.03 Mb, and LB4:35.38–35.93 Mb) were observed in the QTL interval (Figure 3A, B). The strong LD among genes within each block suggests possible interactions in the regulation of sex in red tilapia (Figure 3B).
QTL analysis of FAM4
In total, 287 offspring (143 females and 144 males) in FAM4 generated from a pair of red tilapias and their parents were sampled, with 120 Gb of raw data obtained by ddRAD-seq. The overall read alignment rate was 93.12% (0.69 SD). We detected 1 422 high-quality SNP markers with missing data rates ≤1%. The SNP distribution across the whole tilapia genome is shown in Supplementary Table S6.
Two genome-wide significant QTL intervals on ChrLG1 and ChrLG23 were located by MQM mapping implemented in MapQTL 6.0. The minimum LOD values with 95% and 99% confidence intervals at the genome-wide level were 4.5 and 5.3, respectively, as estimated by permutation tests. There were 68 SNP markers with LOD values higher than 4.4 (Supplementary Table 4). The top 10 SNP markers on ChrLG23 and ChrLG1 are summarized in Table 2 (Figure 2C). The QTL interval (22.5–28.8 Mb) on ChrLG1 explained 12.3% of phenotypic variance in the family, and the QTL interval (32.0–35.9 Mb) on ChrLG23 explained 33.15% of phenotypic variance (pve). The QTL peak for ChrLG1 was located at ChrLG1_25773945 bp (LOD value=8.03, pve=12.7%) and the QTL peak for ChrLG23 was located at ChrLG23_32948918 bp (LOD value=27.71, pve=37.5%).
Within the sex QTL interval on ChrLG23 in FAM4, 12 LD blocks were identified when R2=1. The coverage distance for the larger eight LD blocks was more than 50 kb, however, the distance for one of the remaining blocks was 17.59 kb and all other remaining blocks was less than 1 kb. These results suggest strong LD at the gene level within the QTL region. Interestingly, whenR2=0.8, one large block (LB5:32.01–34.08 Mb) was observed in the QTL interval (Figure 3B, C), which contained many genes. This LD result provides additional evidence on the possible interactions of genes in blocks in the regulation of sex in red tilapia.
Validation of two genome-wide significant QTL using microsatellite markers
Two genome-wide QTL intervals were identified in the four families. In total, 104 individuals (20 females and 84 males) from FAM1 and 180 individuals (94 males and 86 females) from FAM4 were used for genotyping by microsatellite markers. Four microsatellite markers near or within the QTL on ChrLG1 and five microsatellite markers near or within QTL on ChrLG23 were developed.
For the QTL on ChrLG1, two microsatellite markers (SSR141 & SSR147) showed significant association with sex (Fisher’s exact test, P<0.00001). For the SSR147 marker, the genotype linked to the male was J/K and to the female was J/J, and genotype accuracy was 92% for males among 204 offspring (Figure 4A).
Figure 4.
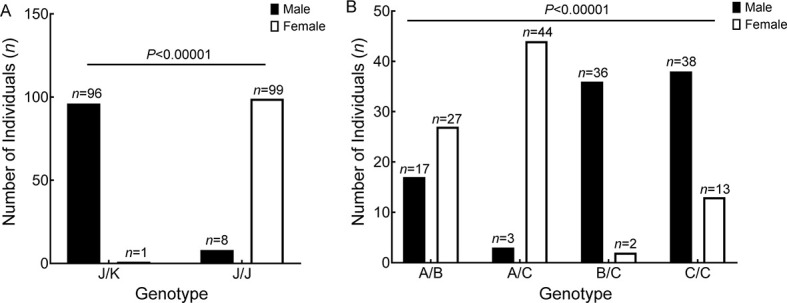
Significant differences for sex detected among microsatellite genotypes in mapping families (FAM1 & FAM4)
A: For microsatellite marker SSR147 (ChrLG1), individuals with male genotype are J/K and female genotype are J/J, with genotype accuracy of 92% for males among 204 offspring. B: For microsatellite marker SSR3204 (ChrLG23), the main genotypes for males in 180 offspring are “B/C” and “C/C”, but for females are “A/B” and “A/C”. Accuracy for genotype “B/C” is 94.7% for identifying males in the population. Differences among groups are significant at P<0.00001, as indicated byChi-square test.
Two of the five markers (SSR3204 & SSR3293) near or within the QTL on ChrLG23 were significantly associated with sex (Chi-square test, P<0.00001). For the SSR3204 marker on ChrLG23, the main genotypes for males in 180 offspring were “B/C” and “C/C”, but for females were “A/B” and “A/C”. Genotype accuracy of “B/C” was 94.7% for identifying males in the population (Figure 4B). Genotype accuracy of “A/C” was 93.6% for females. Association analysis based on the microsatellite markers suggested that the QTL identified in this study were reliable.
Exploring candidate genes in two QTL intervals associated with sex
Based on the QTL data from the four populations, two QTL intervals on ChrLG1 and ChrLG23 were identified. The QTL on ChrLG1 was the major QTL in FAM1 and FAM2, and the QTL on ChrLG23 was the major QTL in FAM3 and FAM4. Totally, 105 genes were identified in these QTL. Several genes (e.g., amh and ube3a) are reported to be involved in sex regulation (Figure 3A–C). To identify the potential candidate genes in the QTL, specific primers for 12 candidate genes (tp63, ube3a, lpp, gpr17, oca2, cog4, atp10a, sox14, scly, slco2a1, dot1l, and amh) near and on the QTL peak regions were successfully developed and their expression levels were analyzed in gonadal tissue using qRT-PCR (Figure 3B).
Interestingly, three genes (lpp, sox14, and amh) were abundantly expressed in males, while the remaining genes are more highly expressed in females (Figure 5). Seven genes (scly, ube3a, lpp, gpr17, oca2, cog4, and atp10a) were significantly differentially expressed between the male and female groups (Figure 5). Moreover, there was no significant expression difference between the male and female groups for four genes (sox14, dot1l, tp63, and slco2a1). As indicated by the LD plot, strong associations between several candidate genes were identified. Three candidate genes in block LB1 (sox14, scly, and slco2a1), five candidate genes in LB2 (lpp, tp63, atp10a, ube3a, and oca2), and two candidate genes in LB3 (dot11 and amh) were observed, while no candidate genes were identified in LB4. All 11 candidate genes were observed in LB5 (Figure 3C). The gene expression and LD data suggested that a cluster of genes on ChrLG23 may participate in regulating sex development in red tilapia.
Figure 5.
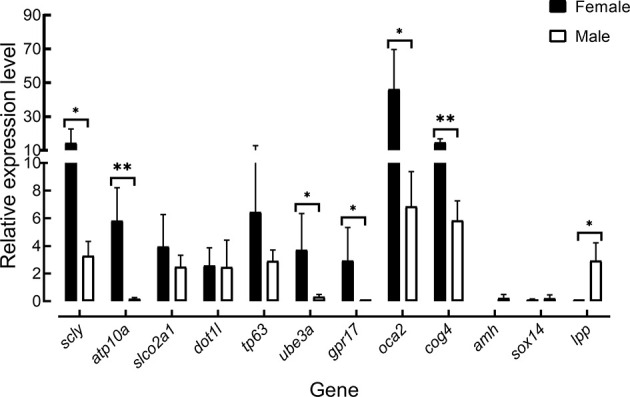
Expression profiles of QTL candidate genes in gonad samples between males and females revealed by qRT-PCR analysis
Ef1α was used as a reference gene. Bars indicate mean value for three biological replicates. *: P<0.05;**: P<0.01.
Three amh Y chromosome markers were used to verify whether amhy is a sex-determining gene in red tilapia. The genotypic data of three amh Y chromosome markers showed no significant differences between male and female individuals. The absence or presence for the AmhΔY+5 (1 500 bp fragment) and amhΔY-233 (767 bp fragment) markers was random in FAM2, but the products were present in all samples from FAM4. The absence or presence of the marker AmhY-5608 amplifying both 8 022 bp and 2 414 bp fragments was random among males and females in FAM2 and FAM3, but only a 2 414 bp fragment was present in FAM4 males (Supplementary Figure S1). In addition, a 1 000 bp fragment was amplified for the AmhΔY-233 marker in all individuals. Our results showed no obvious evidence for the presence of Y-specific replication of the amh gene controlling sex in red tilapia.
DISCUSSION
QTL mapping for sex in red tilapia
QTL mapping in tilapia has been conducted in relation to economic traits, including ammonia-nitrogen tolerance (Zhu et al, 2021), body traits (Yoshida & Yáñez, 2021), salt tolerance (Jiang et al, 2019), body color (Li et al, 2019), and tilapia lake virus resistance (Barría et al, 2021). QTL mapping for sex has also been explored in tilapia previously. A sex-related QTL on LG22 (according to the current version of the tilapia genome, LG22 was integrated into ChrLG23) has been reported for a hybrid Nile and Mozambique tilapia population (Liu et al, 2013). Another study detected a sex-associated QTL on ChrLG1 in Nile tilapia with red body color (Palaiokostas et al, 2015). However, little information is available for red tilapia.
In this study, a total of 1 090 individuals from four red tilapia-origin populations were used to identify QTL associated with sex. Compared to previously reported tilapia data (Liu et al, 2013; Palaiokostas et al, 2015), the population and genotyping data in this study were much larger, which was helpful for detecting the precise position of sex QTL intervals in red tilapia. Two genome-wide significant QTL on ChrLG1 and ChrLG23 controlling sex in red tilapia were identified in this study. The QTL on ChrLG1 was detected in FAM1, FAM2, and FAM4, and the QTL on ChrLG23 was detected in FAM3 and FAM4. This suggests it may be difficult to develop universal markers for all-male selection in multiple red tilapia populations. These results are in accordance with previous studies showing that red tilapia have a complex genetic background, which may originate from Nile, blue, and Mozambique tilapia (Sandeep et al, 2012; Xia et al, 2015). These findings are an important addition to current knowledge of sex genetic architecture in tilapia and may help in further studies on sex regulation in tilapia species.
Sex-related QTL on ChrLG1 in red tilapia
For the QTL associated with sex on ChrLG1, there are significant differences in the location among species and families. A QTL interval of 10.1–18.9 Mb is recognized in Nile tilapia (Palaiokostas et al, 2015), while a larger QTL interval of 10.1–28.0 Mb is reported for Sarotherodon melanotheron (Gammerdinger et al, 2016). However, update of the tilapia reference genome resulted in tremendous changes in the QTL intervals from previous studies (Conte et al, 2019). In our research, slightly differentiated QTL intervals were found among populations. Based on QTL mapping, the interval position in the full-sibling family FAM1 (red tilapia pair) was 22.4–25.7 Mb, the position in the full-sibling family FAM2 (cross of red and Nile tilapia) was 19.0–23.9 Mb, and the position for the full-sibling family FAM4 (cross of red tilapia pair) was 22.5–28.8 Mb. Therefore, the overlapping QTL interval among the three populations was 22.4–23.9 Mb. This is the first fine-mapping identification of a sex-associated QTL on ChrLG1 in red tilapia. Thus, this work provides a basis for studying genes regulating sex on ChrLG1 in red tilapia.
Identifying QTL interval across ChrLG23 controlling for sex in red tilapia
Sex-related QTL on ChrLG23 have been reported in tilapia in previous studies. Using the earlier version of the Nile tilapia genome, an interval from 0.99–2.47 Mb on ChrLG23 associated with sex was identified by SSR and SNP markers (Eshel et al, 2012). Another interval from 0.92–11.07 Mb that contained the amh gene (location in latest version: 34498945–34502800 bp) exerted a significant effect on temperature-dependent sex (Li et al, 2015; Wessels et al, 2017). However, little information on QTL on ChrLG23 is available for red tilapia.
In our study, a QTL interval from 32.4–36.0 Mb on ChrLG23 controlled sex in the mass cross family (FAM3) and an interval from 32.0–35.9 Mb in the full-sibling family crossed by a pair of red tilapias (FAM4) was identified for the first time in red tilapia. The position of QTL on ChrLG23 differs from previously reported data, which is likely due to the application of different versions of the tilapia reference genomes or linkage maps. However, we found that the amh gene was located within the QTL in red tilapia, suggesting that our results are reliable. This study provides the latest referenced QTL interval for sex determination in red tilapia.
Candidate genes controlling sex in red tilapia
Only a few genes have been identified to regulate sex development in fish. For males, Doublesex and mab-3 related transcription factor (dmrt1) is an essential gene that regulates testicular development and differentiation in male zebrafish and Nile tilapia (Li et al, 2013; Lin et al, 2017; Webster et al, 2017). Amhy acts in sex determination in tilapia (Li et al, 2015). GsdfY is the main SD gene and shows high male-specific expression during sex differentiation inOryzias luzonensis (Myosho et al, 2012). In females, forkhead box l2 (foxl2) is a potential SD gene involved in the promotion of ovarian differentiation by up-regulating the expression of cyp19a1a and inhibiting the expression of male regulatory genes (Dai et al, 2021; Zhang et al, 2017).
LD mapping is an approach for identifying candidate genes of natural phenotypic variation (Alqudah et al, 2020; Courtois et al, 2013). Interestingly, four large LD blocks in the sex-related QTL on ChrLG23 in FAM3 and one large LD block in FAM4 were observed. Several candidate genes showed significant LD in both populations. These results suggest that a cluster of genes in this region may co-regulate sex in red tilapia. Further gene expression analysis provided additional evidence in support of this, as shown in Figure 5. Seven of the 12 candidate genes were significantly and highly expressed in female gonads. The amh gene (ChrLG23:34498945-34502800 bp) was located near the QTL peak. Our results showed no obvious evidence for the presence of Y-specific replication of the amh gene controlling sex in red tilapia (Supplementary Figure S1A). We detected the expression of amh in the male gonads of sexually mature red tilapia, suggesting that amh may play an important role in the regulation of sex development in red tilapia. In addition, the gene lpp (ChrLG23: 32838916–33018161) was located under the peak of the QTL interval on ChrLG23. The lpp gene may be a novel candidate for polycystic ovary syndrome (PCOS), which is characterized by oligo-ovulation and/or anovulation in humans (Carmina & Azziz, 2006; Zhang et al, 2012). The relative expression level of lpp was extremely low in females but was relatively abundant in males in the current study. Our results suggest that lpp may be a potential SD factor regulating sex development in red tilapia.
Based on our qRT-PCR data, seven genes (scly, ube3a, lpp, gpr17, oca2, cog4, and atp10a) were significantly differentially expressed between the male and female groups. The E6-associated protein (E6-AP), as a co-activator of estrogen receptor alpha (ERα), is encoded by the ube3a gene, the lack of which results in Angelman syndrome (AS). AS mice contain many differentially regulated estrogen-dependent genes (Catoe & Nawaz, 2011; Hattori et al, 2013; Koyavski et al, 2019). In the current study, ube3a showed significantly different expression levels in gonadal tissues, suggesting that the ube3a gene may be important for sex differentiation in red tilapia. In addition, atp10a is the second maternally expressed imprinted gene on 15q11-q13 in a region of autism, and several studies have reported that females are more likely than males to exhibit monoallelic atp10a expression (Guffanti et al, 2011; Hogart et al, 2008). Our red tilapia results are consistent with previous findings that atp10a shows higher relative expression in females, but extremely low expression in males. Several genes are not directly involved in sex determination but have been found to regulate sexually dimorphic traits. For example, males might be with light eye color and females with dark eye color if the rs12913832 in oca2 gene is CC homozygous mutation in Spanish. (Martinez-Cadenas et al, 2013). Knockout of selenocysteine lyase (scly) can lead to sexual dimorphism in mice (Ogawa-Wong et al, 2018). Our results suggested that a cluster of genes on ChrLG23 may participate in regulating sex development in tilapia.
For the QTL on ChrLG1, researchers have been unable to identify the sex-determining gene with the male heterogametic system XX/XY. In this study, we selected the gene cog4, which contained the most associated SNPs, for expression analysis by qRT-PCR and found that it was highly expressed in the gonads of female red tilapia. Further research using gene knockout may provide hints on its function in sex determination.
CONCLUSIONS
In this research, two sex-related QTL intervals on ChrLG1 (22.5–28.8 Mb) and ChrLG23 (32.0–35.9 Mb) were first identified from four populations of red tilapia. Four microsatellite markers located within the QTLs were successfully developed. Seven candidate genes (scly, ube3a, lpp, gpr17, oca2, cog4, and atp10a) within the two QTL intervals were significantly differentially expressed between the male and female groups. This research lays a foundation for the mining of regulatory genes in controlling sex in red tilapia.
DATA AVAILABILITY
The raw read data for FAM2 are available at the Science Data Bank database (Data doi: 10.11922/sciencedb.01457). All raw read data are available at the DDBJ database (BioProject accession: PRJDB12542) and GSA database (BioProject accession: PRJCA007977).
SUPPLEMENTARY DATA
Supplementary data to this article can be found online.
COMPETING INTERESTS
The authors declare that they have no competing interests.
AUTHORS’ CONTRIBUTIONS
J.H.X. and H.R.L. contributed to project conception. Z.X.Z. and C.H.C. collected the materials. Z.X.Z., Y.L.L., C.H.A., Y.Y.X., D.D.H., and Y.Y.Y. conducted the experiments. Z.X.Z, Y.L.L., and J.H.X. conducted data analysis. Z.X.Z, T.D.L., and J.H.X. prepared the manuscript. H.R.L. critically reviewed the manuscript. All authors read and approved the final version of the manuscript.
ACKNOWLEDGEMENTS
We thank all anonymous reviewers for their comments on the manuscript.
Funding Statement
This work was supported by the Guangdong Provincial Key R&D Program (2021B0202020001), Independent Research and Development Projects of Maoming Laboratory (2021ZZ007), National Natural Science Foundation of China (32072970), and Special Science and Technology Program of Maoming, Guangdong, China (2019S002004)
References
- 1.Alqudah AM, Sallam A, Baenziger PS, Börner A GWAS: fast-forwarding gene identification and characterization in temperate Cereals: lessons from barley - a review. Journal of Advanced Research. 2020;22:119–135. doi: 10.1016/j.jare.2019.10.013. [DOI] [PMC free article] [PubMed] [Google Scholar]
- 2.Bachtrog D, Mank JE, Peichel CL, Kirkpatrick M, Otto SP, Ashman TL, et al Sex determination: why so many ways of doing it? PLoS Biology. 2014;12(7):e1001899. doi: 10.1371/journal.pbio.1001899. [DOI] [PMC free article] [PubMed] [Google Scholar]
- 3.Barría A, Trịnh TQ, Mahmuddin M, Peñaloza C, Papadopoulou A, Gervais O, et al A major quantitative trait locus affecting resistance to Tilapia lake virus in farmed Nile tilapia (Oreochromis niloticus) . Heredity. 2021;127(3):334–343. doi: 10.1038/s41437-021-00447-4. [DOI] [PMC free article] [PubMed] [Google Scholar]
- 4.Carmina E, Azziz R. 2006. Diagnosis, phenotype, and prevalence of polycystic ovary syndrome. Fertility and Sterility, 86(Suppl 1): S7–S8.
- 5.Catoe HW, Nawaz Z E6-AP facilitates efficient transcription at estrogen responsive promoters through recruitment of chromatin modifiers. Steroids. 2011;76(9):897–902. doi: 10.1016/j.steroids.2011.04.007. [DOI] [PubMed] [Google Scholar]
- 6.Cnaani A, Lee BY, Zilberman N, Ozouf-Costaz C, Hulata G, Ron M, et al Genetics of sex determination in tilapiine species. Sexual Development. 2008;2(1):43–54. doi: 10.1159/000117718. [DOI] [PubMed] [Google Scholar]
- 7.Cnaani A, Zilberman N, Tinman S, Hulata G, Ron M Genome-scan analysis for quantitative trait loci in an F2 tilapia hybrid . Molecular Genetics and Genomics. 2004;272(2):162–172. doi: 10.1007/s00438-004-1045-1. [DOI] [PubMed] [Google Scholar]
- 8.Conte MA, Joshi R, Moore EC, Nandamuri SP, Gammerdinger WJ, Roberts RB, et al Chromosome-scale assemblies reveal the structural evolution of african cichlid genomes. Gigascience. 2019;8(4):giz030. doi: 10.1093/gigascience/giz030. [DOI] [PMC free article] [PubMed] [Google Scholar]
- 9.Courtois B, Audebert A, Dardou A, Roques S, Ghneim-Herrera T, Droc G, et al Genome-wide association mapping of root traits in a japonica rice panel. PLoS One. 2013;8(11):e78037. doi: 10.1371/journal.pone.0078037. [DOI] [PMC free article] [PubMed] [Google Scholar]
- 10.Dai SF, Qi SS, Wei XY, Liu XY, Li YB, Zhou X, et al Germline sexual fate is determined by the antagonistic action of dmrt1 and foxl3/foxl2 in tilapia . Development. 2021;148(8):dev199380. doi: 10.1242/dev.199380. [DOI] [PubMed] [Google Scholar]
- 11.Devlin B, Roeder K, Wasserman L Analysis of multilocus models of association. Genetic Epidemiology. 2003;25(1):36–47. doi: 10.1002/gepi.10237. [DOI] [PubMed] [Google Scholar]
- 12.Dong SS, He WM, Ji JJ, Zhang C, Guo Y, Yang TL LDBlockShow: a fast and convenient tool for visualizing linkage disequilibrium and haplotype blocks based on variant call format files. Briefings in Bioinformatics. 2021;22(4):bbaa227. doi: 10.1093/bib/bbaa227. [DOI] [PubMed] [Google Scholar]
- 13.Eshel O, Shirak A, Weller JI, Hulata G, Ron M Linkage and physical mapping of sex region on LG23 of Nile tilapia (Oreochromis niloticus) . G3 Genes| Genomes| Genetics. 2012;2(1):35–42. doi: 10.1534/g3.111.001545. [DOI] [PMC free article] [PubMed] [Google Scholar]
- 14.Ezaz MT, Harvey SC, Boonphakdee C, Teale AJ, McAndrew BJ, Penman DJ Isolation and physical mapping of sex-linked AFLP markers in Nile tilapia (Oreochromis niloticus L. ) . Marine Biotechnology. 2004;6(5):435–445. doi: 10.1007/s10126-004-3004-6. [DOI] [PubMed] [Google Scholar]
- 15.FAO. 2020. The State of World Fisheries and Aquaculture 2020. Sustainability in Action. Rome, Italy.
- 16.Feller AF, Ogi V, Seehausen O, Meier JI Identification of a novel sex determining chromosome in cichlid fishes that acts as XY or ZW in different lineages. Hydrobiologia. 2021;848(16):3727–3745. doi: 10.1007/s10750-021-04560-7. [DOI] [PMC free article] [PubMed] [Google Scholar]
- 17.Gammerdinger WJ, Conte MA, Baroiller JF, D'Cotta H, Kocher TD Comparative analysis of a sex chromosome from the blackchin tilapia. Sarotherodon melanotheron. BMC Genomics. 2016;17:808. doi: 10.1186/s12864-016-3163-7. [DOI] [PMC free article] [PubMed] [Google Scholar]
- 18.Geffroy B, Besson M, Sánchez-Baizán N, Clota F, Goikoetxea A, Sadoul B, et al Unraveling the genotype by environment interaction in a thermosensitive fish with a polygenic sex determination system. Proceedings of the National Academy of Sciences of the United States of America. 2021;118(50):e2112660118. doi: 10.1073/pnas.2112660118. [DOI] [PMC free article] [PubMed] [Google Scholar]
- 19.Guffanti G, Lievers LS, Bonati MT, Marchi M, Geronazzo L, Nardocci N, et al Role of UBE3A and ATP10A genes in autism susceptibility region 15q11-q13 in an italian population: a positive replication for UBE3A. Psychiatry Research. 2011;185(1-2):33–38. doi: 10.1016/j.psychres.2010.04.057. [DOI] [PubMed] [Google Scholar]
- 20.Hattori T, Kishino T, Stephen S, Eberspaecher H, Maki S, Takigawa M, et al E6-AP/UBE3A protein acts as a ubiquitin ligase toward SOX9 protein. Journal of Biological Chemistry. 2013;288(49):35138–35148. doi: 10.1074/jbc.M113.486795. [DOI] [PMC free article] [PubMed] [Google Scholar]
- 21.Hogart A, Patzel KA, LaSalle JM Gender influences monoallelic expression of ATP10A in human brain . Human Genetics. 2008;124(3):235–242. doi: 10.1007/s00439-008-0546-0. [DOI] [PMC free article] [PubMed] [Google Scholar]
- 22.Jiang DL, Gu XH, Li BJ, Zhu ZX, Qin H, Meng ZN, et al Identifying a long QTL cluster across chrLG18 associated with salt tolerance in tilapia using GWAS and QTL-seq. Marine Biotechnology. 2019;21(2):250–261. doi: 10.1007/s10126-019-09877-y. [DOI] [PubMed] [Google Scholar]
- 23.Jie MM, Ma H, Zhou L, Wu JH, Li MH, Liu XY, et al Regulation of female folliculogenesis by Tsp1a in Nile tilapia (Oreochromis niloticus) . International Journal of Molecular Sciences. 2020;21(16):5893. doi: 10.3390/ijms21165893. [DOI] [PMC free article] [PubMed] [Google Scholar]
- 24.Kofler R, Pandey RV, Schlötterer C PoPoolation2: identifying differentiation between populations using sequencing of pooled DNA samples (pool-seq) Bioinformatics. 2011;27(24):3435–3436. doi: 10.1093/bioinformatics/btr589. [DOI] [PMC free article] [PubMed] [Google Scholar]
- 25.Koyavski L, Panov J, Simchi L, Rayi PR, Sharvit L, Feuermann Y, et al Sex-dependent sensory phenotypes and related transcriptomic expression profiles are differentially affected by angelman syndrome. Molecular Neurobiology. 2019;56(9):5998–6016. doi: 10.1007/s12035-019-1503-8. [DOI] [PubMed] [Google Scholar]
- 26.Langmead B, Salzberg SL Fast gapped-read alignment with Bowtie 2. Nature Methods. 2012;9(4):357–359. doi: 10.1038/nmeth.1923. [DOI] [PMC free article] [PubMed] [Google Scholar]
- 27.Leamy LJ, Zhang HY, Li CB, Chen CY, Song BH A genome-wide association study of seed composition traits in wild soybean (Glycine soja) . BMC Genomics. 2017;18:18. doi: 10.1186/s12864-016-3397-4. [DOI] [PMC free article] [PubMed] [Google Scholar]
- 28.Lee BY, Hulata G, Kocher TD Two unlinked loci controlling the sex of blue tilapia (Oreochromis aureus) . Heredity. 2004;92(6):543–549. doi: 10.1038/sj.hdy.6800453. [DOI] [PubMed] [Google Scholar]
- 29.Lee BY, Lee WJ, Streelman JT, Carleton KL, Howe AE, Hulata G, et al A second-generation genetic linkage map of tilapia (Oreochromis spp. ) . Genetics. 2005;170(1):237–244. doi: 10.1534/genetics.104.035022. [DOI] [PMC free article] [PubMed] [Google Scholar]
- 30.Li BJ, Zhu ZX, Gu XH, Lin HR, Xia JH Qtl mapping for red blotches in malaysia red tilapia (Oreochromis spp. ) . Marine Biotechnology. 2019;21(3):384–395. doi: 10.1007/s10126-019-09888-9. [DOI] [PubMed] [Google Scholar]
- 31.Li H, Handsaker B, Wysoker A, Fennell T, Ruan J, Homer N, et al The sequence alignment/map format and SAMtools. Bioinformatics. 2009;25(16):2078–2079. doi: 10.1093/bioinformatics/btp352. [DOI] [PMC free article] [PubMed] [Google Scholar]
- 32.Li MH, Sun YL, Zhao JE, Shi HJ, Zeng S, Ye K, et al A tandem duplicate of anti-mullerian hormone with a missense SNP on the Y chromosome is essential for male sex determination in Nile tilapia. Oreochromis niloticus. PLoS Genetics. 2015;11(11):e1005678. doi: 10.1371/journal.pgen.1005678. [DOI] [PMC free article] [PubMed] [Google Scholar]
- 33.Li MH, Yang HH, Li MR, Sun YL, Jiang XL, Xie QP, et al Antagonistic roles of Dmrt1 and Foxl2 in sex differentiation via estrogen production in tilapia as demonstrated by TALENs. Endocrinology. 2013;154(12):4814–4825. doi: 10.1210/en.2013-1451. [DOI] [PubMed] [Google Scholar]
- 34.Li XY, Gui JF Diverse and variable sex determination mechanisms in vertebrates. Science China Life Sciences. 2018;61(12):1503–1514. doi: 10.1007/s11427-018-9415-7. [DOI] [PubMed] [Google Scholar]
- 35.Lin QH, Mei J, Li Z, Zhang XM, Zhou L, Gui JF Distinct and cooperative roles of amh and dmrt1 in self-renewal and differentiation of male germ cells in zebrafish . Genetics. 2017;207(3):1007–1022. doi: 10.1534/genetics.117.300274. [DOI] [PMC free article] [PubMed] [Google Scholar]
- 36.Liu F, Sun F, Li J, Xia JH, Lin G, Tu RJ, et al A microsatellite-based linkage map of salt tolerant tilapia (Oreochromis mossambicus x Oreochromis spp. ) and mapping of sex-determining loci . BMC Genomics. 2013;14:58. doi: 10.1186/1471-2164-14-58. [DOI] [PMC free article] [PubMed] [Google Scholar]
- 37.Mair GC, Scott AG, Penman DJ, Beardmore JA, Skibinski DOF Sex determination in the genus oreochromis: 1. Sex reversal, gynogenesis and triploidy in O. Niloticus (L.) . Theoretical and Applied Genetics. 1991a;82(2):144–152. doi: 10.1007/BF00226205. [DOI] [PubMed] [Google Scholar]
- 38.Mair GC, Scott AG, Penman DJ, Skibinski DOF, Beardmore JA Sex determination in the genus Oreochromis: 2. Sex reversal, hybridisation, gynogenesis and triploidy in O. Aureus steindachner . Theoretical and Applied Genetics. 1991b;82(2):153–160. doi: 10.1007/BF00226206. [DOI] [PubMed] [Google Scholar]
- 39.Martinez-Cadenas C, Peña-Chilet M, Ibarrola-Villava M, Ribas G Gender is a major factor explaining discrepancies in eye colour prediction based on HERC2/OCA2 genotype and the IrisPlex model . Forensic Science International:Genetics. 2013;7(4):453–460. doi: 10.1016/j.fsigen.2013.03.007. [DOI] [PubMed] [Google Scholar]
- 40.Matsuda M, Nagahama Y, Shinomiya A, Sato T, Matsuda C, Kobayashi T, et al DMY is a Y-specific DM-domain gene required for male development in the medaka fish . Nature. 2002;417(6888):559–563. doi: 10.1038/nature751. [DOI] [PubMed] [Google Scholar]
- 41.Menozzi P, Piazza A, Cavalli-Sforza L Synthetic maps of human gene frequencies in Europeans: these maps indicate that early farmers of the Near East spread to all of Europe in the Neolithic. Science. 1978;201(4358):786–792. doi: 10.1126/science.356262. [DOI] [PubMed] [Google Scholar]
- 42.Myosho T, Otake H, Masuyama H, Matsuda M, Kuroki Y, Fujiyama A, et al Tracing the emergence of a novel sex-determining gene in medaka. Oryzias luzonensis. Genetics. 2012;191(1):163–170. doi: 10.1534/genetics.111.137497. [DOI] [PMC free article] [PubMed] [Google Scholar]
- 43.Nagahama Y, Chakraborty T, Paul-Prasanth B, Ohta K, Nakamura M Sex determination, gonadal sex differentiation, and plasticity in vertebrate species. Physiological Reviews. 2021;101(3):1237–1308. doi: 10.1152/physrev.00044.2019. [DOI] [PubMed] [Google Scholar]
- 44.Nakamura M Sex determination in amphibians. Seminars in Cell & Developmental Biology. 2009;20(3):271–282. doi: 10.1016/j.semcdb.2008.10.003. [DOI] [PubMed] [Google Scholar]
- 45.Nyinondi CS, Mtolera MSP, Mmochi AJ, Pinto FAL, Houston RD, de Koning DJ, et al Assessing the genetic diversity of farmed and wild Rufiji tilapia (Oreochromis urolepis urolepis) populations using ddRAD sequencing . Ecology and Evolution. 2020;10(18):10044–10056. doi: 10.1002/ece3.6664. [DOI] [PMC free article] [PubMed] [Google Scholar]
- 46.Ogawa-Wong AN, Hashimoto AC, Ha H, Pitts MW, Seale LA, Berry MJ Sexual dimorphism in the selenocysteine lyase knockout mouse. Nutrients. 2018;10(2):159. doi: 10.3390/nu10020159. [DOI] [PMC free article] [PubMed] [Google Scholar]
- 47.Palaiokostas C, Bekaert M, Khan MGQ, Taggart JB, Gharbi K, McAndrew BJ, et al Mapping and validation of the major sex-determining region in Nile tilapia (Oreochromis niloticus L. ) using RAD sequencing . PLoS One. 2013;8(7):e68389. doi: 10.1371/journal.pone.0068389. [DOI] [PMC free article] [PubMed] [Google Scholar]
- 48.Palaiokostas C, Bekaert M, Khan MGQ, Taggart JB, Gharbi K, McAndrew BJ, et al A novel sex-determining QTL in Nile tilapia (Oreochromis niloticus) . BMC Genomics. 2015;16(1):171. doi: 10.1186/s12864-015-1383-x. [DOI] [PMC free article] [PubMed] [Google Scholar]
- 49.Peterson BK, Weber JN, Kay EH, Fisher HS, Hoekstra HE Double digest RADseq: an inexpensive method for De novo SNP discovery and genotyping in model and non-model species . PLoS One. 2012;7(5):e37135. doi: 10.1371/journal.pone.0037135. [DOI] [PMC free article] [PubMed] [Google Scholar]
- 50.Pradeep PJ, Srijaya TC, Hassan A, Chatterji AK, Withyachumnarnkul B, Jeffs A Optimal conditions for cold-shock induction of triploidy in red tilapia. Aquaculture International. 2014;22(3):1163–1174. doi: 10.1007/s10499-013-9736-4. [DOI] [Google Scholar]
- 51.Rajendiran P, Jaafar F, Kar S, Sudhakumari C, Senthilkumaran B, Parhar IS Sex determination and differentiation in teleost: roles of genetics, environment, and Brain. Biology. 2021;10(10):973. doi: 10.3390/biology10100973. [DOI] [PMC free article] [PubMed] [Google Scholar]
- 52.Renn SCP, Hurd PL Epigenetic regulation and environmental sex determination in cichlid fishes. Sexual Development. 2021;15(1-3):93–107. doi: 10.1159/000517197. [DOI] [PMC free article] [PubMed] [Google Scholar]
- 53.Rochette NC, Rivera-Colón AG, Catchen JM Stacks 2: analytical methods for paired-end sequencing improve RADseq-based population genomics. Molecular Ecology. 2019;28(21):4737–4754. doi: 10.1111/mec.15253. [DOI] [PubMed] [Google Scholar]
- 54.Sandeep M, Sun F, Liu F, Li J, David PB, Yue GH Novel polymorphic microsatellites from Florida red tilapia and cross-species amplification in Mozambique and Nile tilapia. Journal of Genetics. 2012;91(3):e97–e99. [PubMed] [Google Scholar]
- 55.Sarre SD, Ezaz T, Georges A Transitions between sex-determining systems in reptiles and amphibians. Annual Review of Genomics and Human Genetics. 2011;12:391–406. doi: 10.1146/annurev-genom-082410-101518. [DOI] [PubMed] [Google Scholar]
- 56.Sassi FDMC, Deon GA, Moreira-Filho O, Vicari MR, Bertollo LAC, Liehr T, et al Multiple sex chromosomes and evolutionary relationships in amazonian catfishes: the outstanding model of the genus Harttia (Siluriformes: Loricariidae) . Genes. 2020;11(10):1179. doi: 10.3390/genes11101179. [DOI] [PMC free article] [PubMed] [Google Scholar]
- 57.Tao WJ, Xu LH, Zhao L, Zhu ZX, Wu X, Min QW, et al High-quality chromosome-level genomes of two tilapia species reveal their evolution of repeat sequences and sex chromosomes. Molecular Ecology Resources. 2021;21(2):543–560. doi: 10.1111/1755-0998.13273. [DOI] [PubMed] [Google Scholar]
- 58.Taslima K, Wehner S, Taggart JB, de Verdal H, Benzie JAH, Bekaert M, et al Sex determination in the GIFT strain of tilapia is controlled by a locus in linkage group 23. BMC Genetics. 2020;21(1):49. doi: 10.1186/s12863-020-00853-3. [DOI] [PMC free article] [PubMed] [Google Scholar]
- 59.Toyota K, Miyakawa H, Hiruta C, Sato T, Katayama H, Ohira T, et al Sex determination and differentiation in decapod and cladoceran crustaceans: an overview of endocrine regulation. Genes. 2021;12(2):305. doi: 10.3390/genes12020305. [DOI] [PMC free article] [PubMed] [Google Scholar]
- 60.Triay C, Conte MA, Baroiller JF, Bezault E, Clark FE, Penman DJ, et al Structure and sequence of the sex determining locus in two wild populations of Nile tilapia. Genes. 2020;11(9):1017. doi: 10.3390/genes11091017. [DOI] [PMC free article] [PubMed] [Google Scholar]
- 61.van Ooijen JW, 2009. MapQTL 6, Software for the Mapping of Quantitative Trait Loci in Experimental Populations. Kyazma B.V., Wageningen, Netherlands.
- 62.van Ooijen JW Multipoint maximum likelihood mapping in a full-sib family of an outbreeding species. Genetics Research. 2011;93(5):343–349. doi: 10.1017/S0016672311000279. [DOI] [PubMed] [Google Scholar]
- 63.Wang HY, Misztal I, Aguilar I, Legarra A, Fernando RL, Vitezica Z, et al Genome-wide association mapping including phenotypes from relatives without genotypes in a single-step (ssGWAS) for 6-week body weight in broiler chickens. Frontiers in Genetics. 2014;5:134. doi: 10.3389/fgene.2014.00134. [DOI] [PMC free article] [PubMed] [Google Scholar]
- 64.Webster KA, Schach U, Ordaz A, Steinfeld JS, Draper BW, Siegfried KR Dmrt1 is necessary for male sexual development in zebrafish. Developmental Biology. 2017;422(1):33–46. doi: 10.1016/j.ydbio.2016.12.008. [DOI] [PMC free article] [PubMed] [Google Scholar]
- 65.Wessels S, Krause I, Floren C, Schütz E, Beck J, Knorr C ddRADseq reveals determinants for temperature-dependent sex reversal in Nile tilapia on LG23. BMC Genomics. 2017;18(1):531. doi: 10.1186/s12864-017-3930-0. [DOI] [PMC free article] [PubMed] [Google Scholar]
- 66.Xia JH, Bai ZY, Meng ZN, Zhang Y, Wang L, Liu F, et al Signatures of selection in tilapia revealed by whole genome resequencing. Scientific Reports. 2015;5:14168. doi: 10.1038/srep14168. [DOI] [PMC free article] [PubMed] [Google Scholar]
- 67.Xue LZ, Gao Y, Wu MY, Tian T, Fan HP, Huang YJ, et al Telomere-to-telomere assembly of a fish Y chromosome reveals the origin of a young sex chromosome pair. Genome Biology. 2021;22(1):203. doi: 10.1186/s13059-021-02430-y. [DOI] [PMC free article] [PubMed] [Google Scholar]
- 68.Yang Q, Cui J, Chazaro I, Cupples LA, Demissie S. 2005. Power and type I error rate of false discovery rate approaches in genome-wide association studies. BMC Genetics, 6 Suppl 1 (Suppl 1): S134.
- 69.Yoshida GM, Yáñez JM Multi-trait GWAS using imputed high-density genotypes from whole-genome sequencing identifies genes associated with body traits in Nile tilapia. BMC Genomics. 2021;22(1):57. doi: 10.1186/s12864-020-07341-z. [DOI] [PMC free article] [PubMed] [Google Scholar]
- 70.Zhang B, Zhao H, Li T, Gao X, Gao Q, Tang R, et al Association study of gene LPP in women with polycystic ovary syndrome. PLoS One. 2012;7(10):e46370. doi: 10.1371/journal.pone.0046370. [DOI] [PMC free article] [PubMed] [Google Scholar]
- 71.Zhang L, Liu JS, Zhao FP, Ren HX, Xu LY, Lu J, et al Genome-wide association studies for growth and meat production traits in sheep. PLoS One. 2013;8(6):e66569. doi: 10.1371/journal.pone.0066569. [DOI] [PMC free article] [PubMed] [Google Scholar]
- 72.Zhang XB, Li MR, Ma H, Liu XY, Shi HJ, Li MH, et al. 2017. Mutation of foxl2 or cyp19a1a results in female to male sex reversal in XX Nile tilapia. Endocrinology, 158(8): 2634–2647.
- 73.Zhu ZX, Lin YL, Qin H, Xiong YY, Jiang DL, Lin HR, et al. 2021. Identifying a genome-wide QTL interval controlling for ammonia-nitrogen tolerance on chrLG1 of Nile tilapia. Aquaculture, 543: 736946.
Associated Data
This section collects any data citations, data availability statements, or supplementary materials included in this article.
Supplementary Materials
Supplementary data to this article can be found online.
Data Availability Statement
The raw read data for FAM2 are available at the Science Data Bank database (Data doi: 10.11922/sciencedb.01457). All raw read data are available at the DDBJ database (BioProject accession: PRJDB12542) and GSA database (BioProject accession: PRJCA007977).