

Abstract
Optimal methods could effectively improve the accuracy of predicting and identifying candidate driver genes. Various computational methods based on mutational frequency, network and function approaches have been developed to identify mutation driver genes in cancer genomes. However, a comprehensive evaluation of the performance levels of network-, function- and frequency-based methods is lacking. In the present study, we assessed and compared eight performance criteria for eight network-based, one function-based and three frequency-based algorithms using eight benchmark datasets. Under different conditions, the performance of approaches varied in terms of network, measurement and sample size. The frequency-based driverMAPS and network-based HotNet2 methods showed the best overall performance. Network-based algorithms using protein–protein interaction networks outperformed the function- and the frequency-based approaches. Precision, F1 score and Matthews correlation coefficient were low for most approaches. Thus, most of these algorithms require stringent cutoffs to correctly distinguish driver and non-driver genes. We constructed a website named Cancer Driver Catalog (http://159.226.67.237/sun/cancer_driver/), wherein we integrated the gene scores predicted by the foregoing software programs. This resource provides valuable guidance for cancer researchers and clinical oncologists prioritizing cancer driver gene candidates by using an optimal tool.
Keywords: TCGA, computational method, cancer driver gene, performance evaluation, Pan-cancer analysis
Introduction
Cancer is a collection of diseases characterized by cellular abnormalities and uncontrolled growth mainly caused by gene mutations [1]. Cancer genomes are characterized by the accumulation of molecular alterations such as driver and non-driver mutations. Driver mutations have selective advantages and initiate cancer and propagate tumors. By contrast, non-driver mutations have no selective advantage in tumor progression [2]. The prognostic effect of individual mutations is usually significantly changed by the presence or absence of other driver mutations [3]. Driver gene mutations usually occur in a group of genes (‘cancer driver genes’) that affect the homeostatic development of key cellular functions. Hence, several massive cancer sequencing projects such as The Cancer Genome Atlas (TCGA) [4], the International Cancer Genome Consortium (ICGC) [5] and the Therapeutically Applicable Research to Generate Effective Treatments (TARGET) [6] have been designed and applied to identify driver mutations and genes. The driver genes identified by these projects shed new light on cancer initiation, tumor propagation, remote organ metastasis, the development of paradigm of targeted anticancer therapies, and the search for genomic biomarkers of prognosis as well as response to treatments [7].
Several computational methods have been developed to identify cancer driver genes based on their mutation profiles. These methods are classified into frequency-, function- and network-based categories according to their predicting principles. Frequency-based methods such as driverMAPS [8], WITER [9] and DriverML [10] identify candidate driver genes based on the assumption that their mutation rates are higher than the background mutation rate (BMR) across a patient cohort. However, it is still challenging for accurate estimation of the background mutation frequency [11]. Function-based methods such as MutPanning [12] assess the functional impact of mutations in hotspot functional domains. They identify oncogenes harboring gain-of-function mutations but are inadequate in terms of predicting tumor suppressor genes characterized by loss-of-function mutations [10]. Somatic mutations in different genes and patients are enriched in various functional pathways in each cancer type. Thus, network-based methods such as HotNet2 [13], MUFFINN [14] and NetSig [15] comprehensively elucidate pathways, networks and mutation frequencies. They can identify driver genes with low-mutation frequencies that are usually missed by frequency-based methods [16]. Methods of analyzing cancer drivers are also gradually diversifying. These include our recently developed platform OncoVar, which identifies cancer driver genes based on the ensemble learning method AI-Driver [17] and prior oncological knowledge [18].
Previous studies have evaluated the performance of algorithms at predicting pathogenic and driver mutations and genes [10, 14, 19–24]. However, most evaluation studies only compared newly developed methods against other limited software. Therefore, independent assessments of driver gene identification methods are urgently needed. Recently developed methods such as Moonlight [25], nCOP [26], OncoIMPACT [27], MutPanning [12], driverMAPS [8], WITER [9] and DriverML [10] have not yet been compared against each other. Furthermore, comparisons among various network datasets used in network-based approaches have not been made. The lack of accepted gold standards for driver genes and appropriate measurements has limited studies assessing cancer driver gene prediction methods. Thus, a comprehensive, independent evaluation of computational methods for predicting cancer driver genes is required.
In the present study, we independently assessed the performance of 12 recently published (eight network-based, one function-based and three frequency-based) methods of driver gene prediction. We then integrated the gene driver scores into a website named the Cancer Driver Catalog. The gene driver scores represent the possibility of correct cancer driver prediction by various tools. We performed eight measurements on 12 methods with six network datasets based on eight benchmark datasets. The relative performance levels of these approaches varied under different conditions, and driverMAPS and HotNet2 outperformed all other methods. To the best of our knowledge, this study is the first to assess the performance of algorithms at predicting candidate cancer driver genes and to compare the properties of various network datasets considering gene length and sample size. Our findings provide important guidance for researchers and clinicians in ranking mutational cancer driver genes.
Materials and methods
Existing methods of driver gene identification
The performance levels of 12 computational methods published since 2014 (and not heretofore comprehensively compared against each other) were assessed based on the published dates for the cancer driver gene identification methods and source code availability (Figure 1). They comprised (i) eight network-based algorithms [Moonlight (Moonlight score) [25], nCOP (nCOP score) [26], OncoIMPACT (IMPACT score) [27], HotNet2 (HotNet2 score) [13], MaxMIF (MaxMIF score) [20], DNsum (MUFFINN_DNsum, MUFFINN score) [14], DNmax (MUFFINN_DNmax, MUFFINN score) [14] and NetSig (log10(1/p)) [15]], (ii) one function-based algorithm [MutPanning (log10(1/FDR)) [12]] and (iii) three frequency-based algorithms [driverMAPS (Model-based Analysis of Positive Selection) (BayesFactor) [8], WITER (RandomForestScore) [9] and DriverML (DriverML score) [10]]. They were analyzed using unified somatic mutation and network datasets. Most methods showed no significance level such as P-value or false discovery rate (FDR), and the numbers of genes predicted by each software program were inconsistent. Therefore, their performance was evaluated using the top 100 gene scores ranked by each method and by indicating the probability of true cancer driver detection. We noted that reasonable changes in the number of selected genes (top 50 genes, top 150 genes and all genes) did not influence the overall conclusion (Supplementary Figure S1).
Figure 1.

Overview of the evaluation of function-based, frequency-based and network-based methods to identify driver genes.
Benchmark driver gene datasets
The lack of comprehensive, unbiased gold standard benchmark driver gene sets poses a challenge for optimal method selection [14, 23]. Seven benchmark datasets were curated and combined into an independent ‘benchmark’ dataset (Figure 1; http://159.226.67.237/sun/cancer_driver/resource/benchmark-datasets.xlsx). From the Cancer Gene Census (CGC; Tier 1; January 2019), 576 genes were collected [28]. The genes included in the CGC set had documented cancer-associated activity and harbored mutations that could alter their oncogenic activity. A CGC subset containing 118 cancer genes was also curated. These genes participated in carcinogenesis via point mutations (CGCpointMut). Another 124 cancer genes were included on the basis of characteristic mutational patterns in oncogenes and tumor suppressor genes (20/20 Rule) [2]. There were 288 high-confidence driver genes that were identified by the rule-based HCD approach [29]. Candidate genes were defined as cancer driver genes if they were predicted in a pan-cancer or other item analysis by at least two frequency-based methods including MuSiC [30], OncodriveFM [31], Oncodrive-CLUST [32] and ActiveDriver [33]. There were 797 human orthologs of mouse cancer genes that were identified by insertional mutagenesis (MouseMut) [34]. There were 698 human oncogenes that were manually curated from 8849 articles and a public oncogene database (OncoGene) [35]. There were 299 CTAT (combined tool adjusted total) genes that were obtained according to a previously reported method [36]. Briefly, 258 genes were identified by systematic methods and 41 others were recovered after manual curation of earlier TCGA-labeled reports. Most of the latter were supported by other omics network tools used to detect the original significantly mutated genes (SMGs). By eliminating redundancy among these datasets, 233 driver genes common to at least three of the curated benchmark datasets were collected and defined as ‘benchmark.’
Somatic mutation datasets
These software programs required mutation data to predict driver genes in the cancer cohorts. Hence, MAF (mutation annotation format) files including SNVs and INDELs for 36 types of cancers were downloaded from TCGA database (https://gdc-portal.nci.nih.gov/) [4]. The cancer types included adrenocortical carcinoma (ACC), bladder urothelial carcinoma (BLCA), breast invasive carcinoma (BRCA), cervical squamous cell carcinoma and endocervical adenocarcinoma (CESC), cholangiocarcinoma (CHOL), colon adenocarcinoma (COAD), colon adenocarcinoma (COAD/READ), lymphoid neoplasm diffuse large B-cell lymphoma (DLBC), esophageal carcinoma (ESCA), glioblastoma multiforme (GBM), glioma (GBMLGG), head and neck squamous cell carcinoma (HNSC), kidney chromophobe (KICH), kidney renal clear cell carcinoma (KIRC), kidney renal papillary cell carcinoma, (KIRP), pan-kidney cohort (KICH+KIRC+KIRP) (KIPAN), acute myeloid leukemia (LAML), brain lower grade glioma (LGG), liver hepatocellular carcinoma (LIHC), lung adenocarcinoma (LUAD), lung squamous cell carcinoma (LUSC), ovarian serous cystadenocarcinoma (OV), pancreatic adenocarcinoma (PAAD), pheochromocytoma and paraganglioma (PCPG), prostate adenocarcinoma (PRAD), rectal adenocarcinoma (READ), sarcoma (SARC), skin cutaneous melanoma (SKCM), stomach adenocarcinoma (STAD), stomach and esophageal carcinoma (STES), testicular germ cell tumors (TGCT), thyroid carcinoma (THCA), thymoma (THYM), uterine corpus endometrial carcinoma (UCEC), uterine carcinosarcoma (UCS) and uveal melanoma (UVM). A total of 11 858 samples were collected. MAF data including pan-cancer SNVs and INDELs (PCAWG cohort; 1950 samples) were downloaded from the UCSC Xena database (https://xenabrowser.net/) to facilitate the subsequent analyses and evaluations (Supplementary Table S1). Finally, 18 499 protein-coding genes were retained to calculate mutation rates and perform network analyses.
Weighted gene co-expression network analysis
Gene co-expression analyses effectively identify genes involved in the same molecular processes and regulatory relationships [37]. The gene expression profiles of 36 human cancers (RNA-seq) and pan-cancer were curated from the TCGA and UCSC Xena database, respectively, and used to build a gene co-expression network (Supplementary Table S1). For pan-cancer and each cancer type, WGCNA was employed for the co-expression analysis using a previously developed pipeline [38] (Figure 1). The weight score represented the degree of co-expression. When it was <0.1, the network was filtered.
Protein–protein interaction networks used in performance evaluation
Five protein–protein interaction (PPI) networks including STRINGv10, HumanNet, InBio_Map, GeneMANIA and mentha were used to establish whether the various protein–protein network datasets and the WGCNA network affect network-based software performance (Figure 1). All networks contained the weight values between two genes that are required as inputs for the network-based methods. Edges with larger weights in the network had higher confidence levels and, therefore, higher priority assignment to function-related genes [39]. In STRINGv10, there were 2 615 912 interactions. This database contained direct (physical) and indirect (functional) associations [40]. In HumanNet, there were 460 479 interactions. This database contained predicted and validated interactions [41]. In InBio_Map, there were 612 996 interactions. This database is widely used to interpret and visualize biomedical big data within the context of system biology [42]. In GeneMANIA, there were 6 311 975 interactions. This database is a platform for fast gene network construction and functional prediction in Cytoscape [43]. In mentha, there were 316 376 interactions. This database is a resource for browsing integrated protein interaction networks [44].
Measurements used in performance evaluation
The area under the receiver operating characteristic (ROC) are under the curve (AUC) was used to evaluate the performance of each method. The ROC was drawn with the ‘pROC’ package in R [45]. The other seven criteria used to evaluate the methods [22] included (i) the accuracy indicating the driver gene: non-driver gene ratios in the benchmark datasets that were correctly predicted as drivers and non-drivers, respectively; (ii) the sensitivity representing the proportion of driver genes in the benchmark data that were correctly predicted as driver genes by the model; (iii) the specificity representing the proportion of non-driver genes in the benchmark data that were correctly predicted as non-driver genes by the model; (iv) the precision representing the conditional probability that the driver genes in the benchmark data were correctly predicted as driver genes by the model; (v) the error rate representing the proportion of false drivers and non-drivers in the benchmark dataset that were incorrectly predicted as drivers and non-drivers, respectively; (vi) the F1 score representing the harmonic means of the precision and recall numbers; (vii) the Matthews correlation coefficient (MCC) representing the correlation between the observed and predicted classifications (range: −1 to 1; where 1 indicates perfect prediction, 0 indicates random prediction and − 1 indicates inconsistency between prediction and true classification) (Figure 1). All seven measurements were calculated with the ‘precrec’ package in R [46]. The foregoing measurements were also derived using true positive (TP), true negative (TN), false positive (FP) and false negative (FN), as shown below:
 |
(1) |
 |
(2) |
 |
(3) |
 |
(4) |
 |
(5) |
 |
(6) |
 |
(7) |
Similarity of driver genes predicted by various cancer types
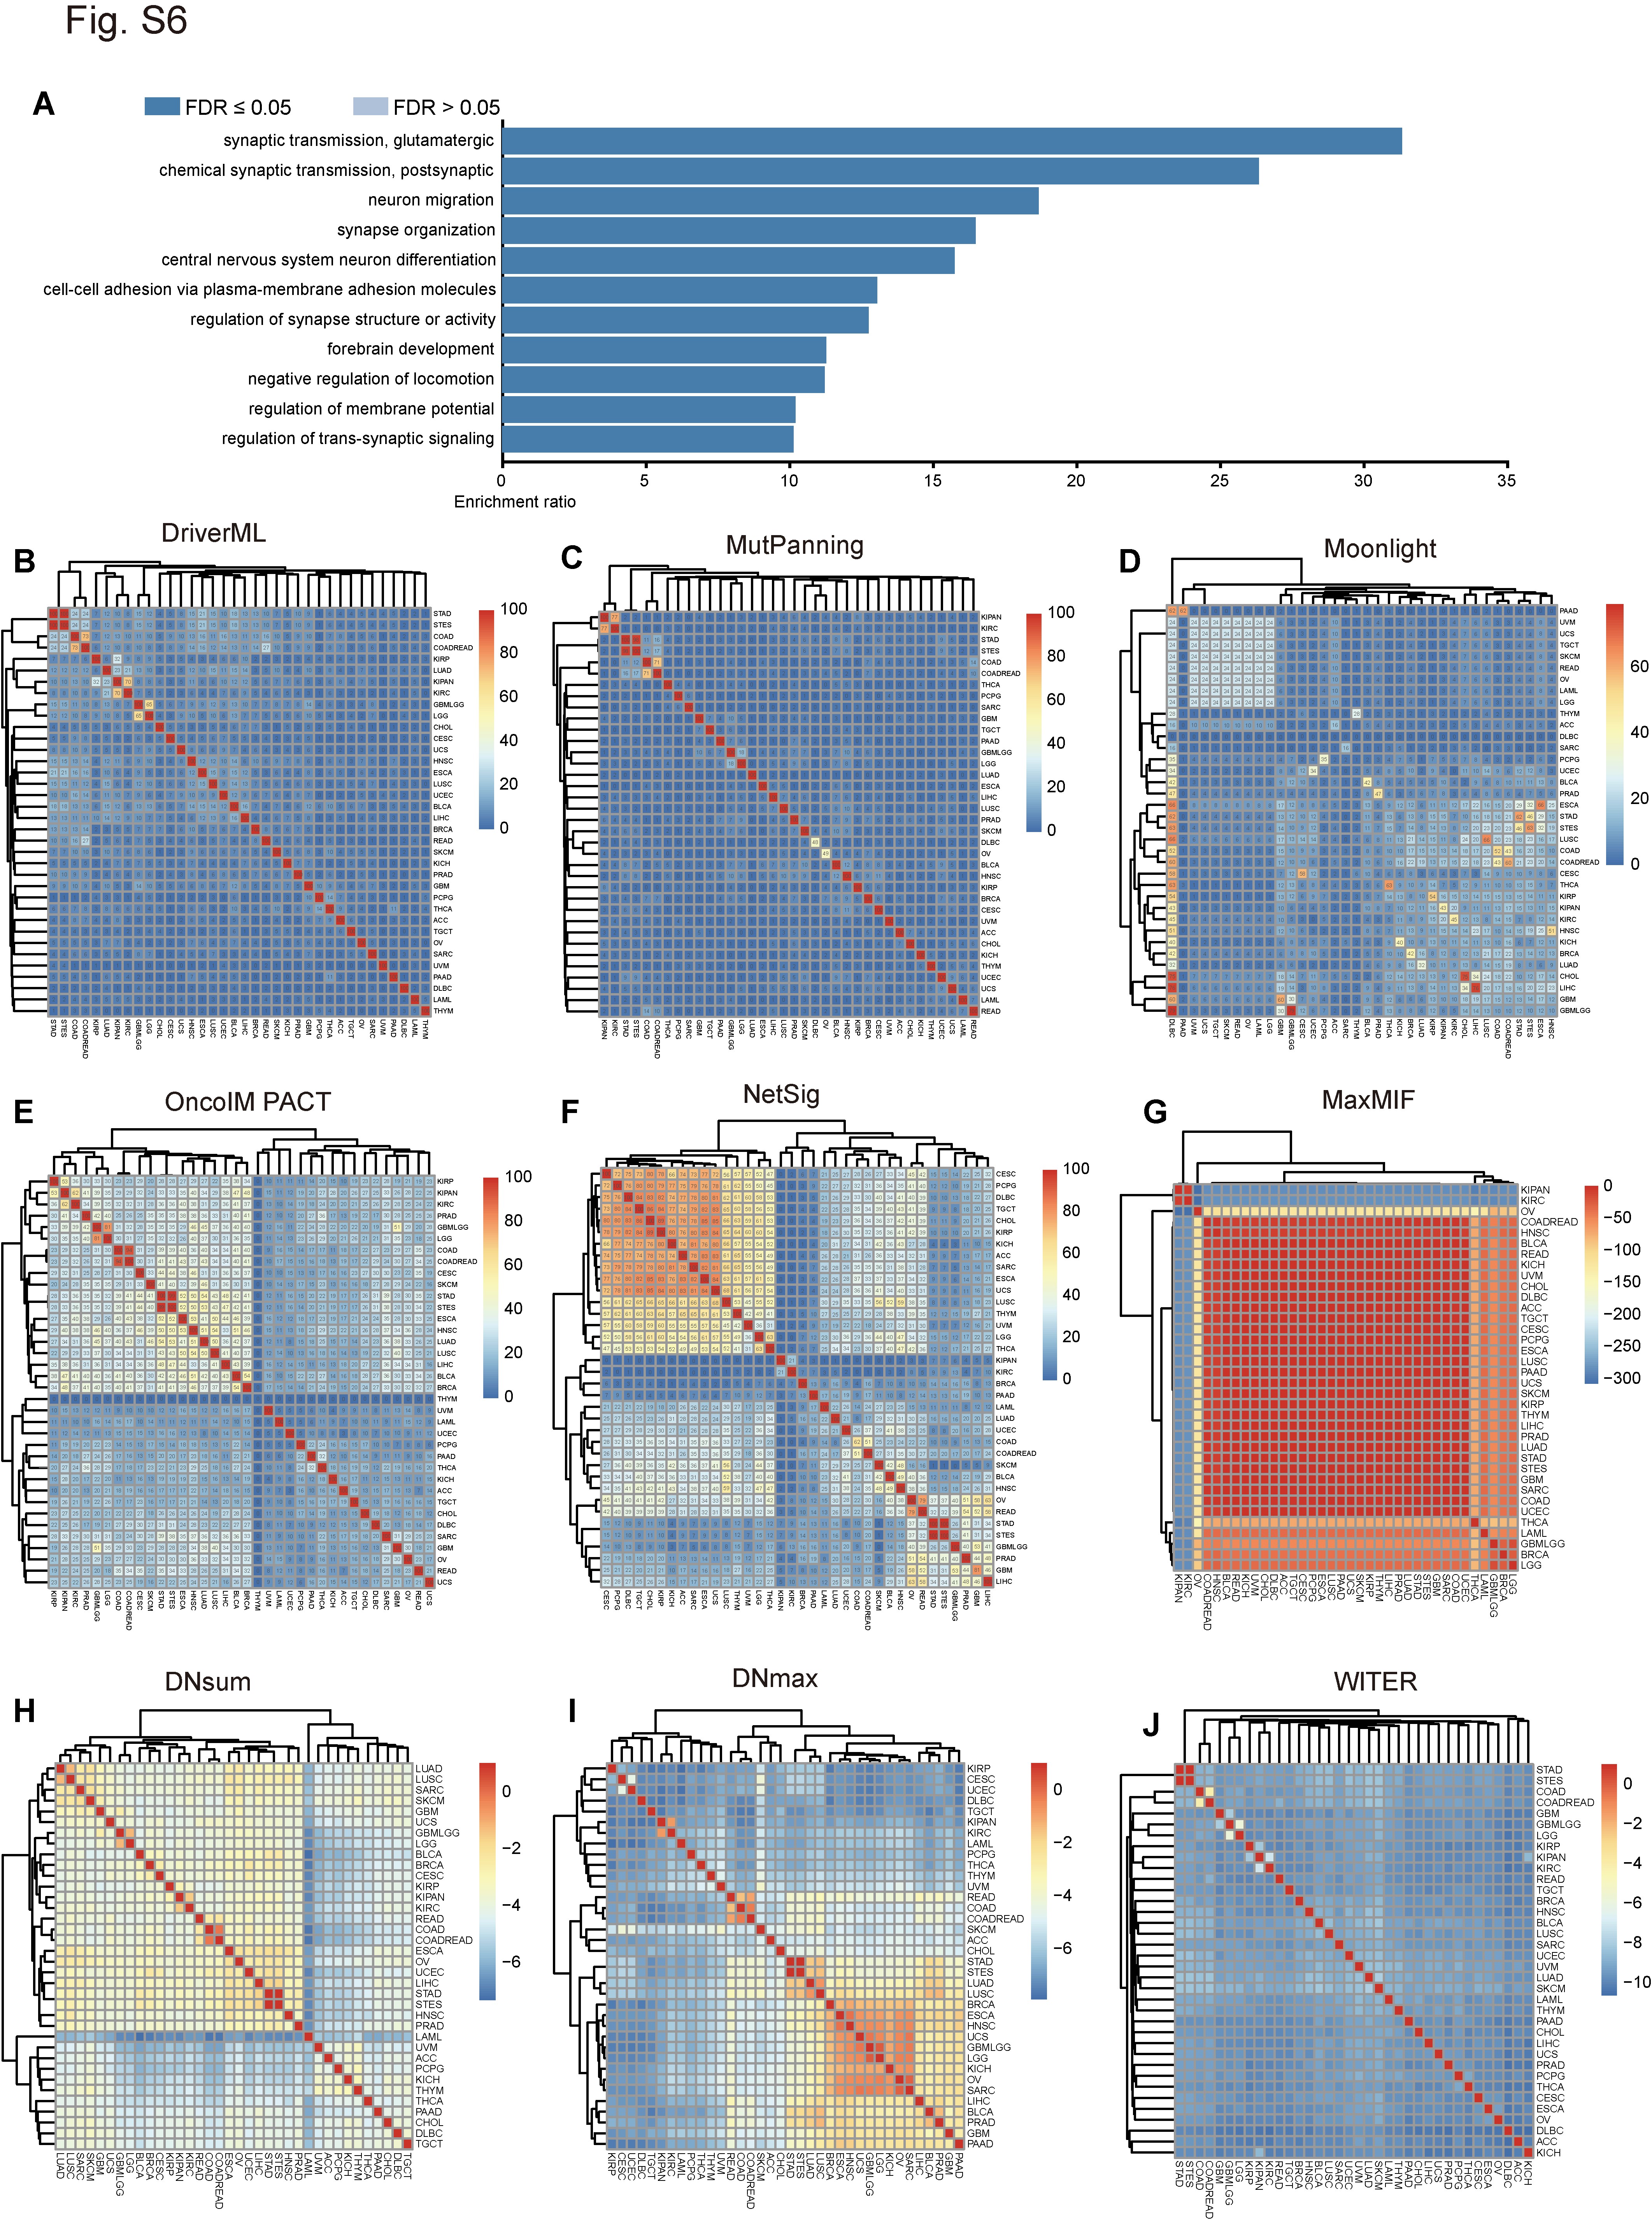
For the computational algorithm with score range 0–1 (MaxMIF, nCOP, HotNet2, DNsum, DNmax and WITER) (Figure 6C and D; Supplementary Figure S6G–J), the Euclidean distances of various cancer types were calculated with the ‘Phyloseq’ package in R [47]. In these cases, both the candidate driver genes and the gene scores were predicted by computational methods. The differences in cancer type increased with Euclidean distance. Thus, 1 minus distance was used to represent similarity among cancer types in the contributor driver genes. For algorithms with scores not in the 0–1 range (including DriverML, driverMAPS, MutPanning, Moonlight, OncoIMPACT and NetSig) (Figure 6B; Supplementary Figure S6B–F), pairwise intersections of predictor driver genes between two cancer types were analyzed. For the similarity analysis between cancer types, the top 100 potential driver genes from each cancer type and the mentha network dataset were applied in the network-based methods.
Figure 6.

Similarities among different computational methods and cancer types measured by candidate driver genes. Pairwise intersections of top 100 predictor driver genes among 11 computational methods based on pan-cancer analysis are shown in (A). Pairwise intersections of top 100 predictions using driverMAPS among 36 cancer types are shown in (B). The numbers in the grid represent the number of candidate driver genes shared by any two types of methods (A) or any two types of cancers (B). One minus Euclidean distance of top 100 predictions in HotNet2 (C) and nCOP (D) among 36 cancer types are shown in (C) and (D).
Results
Performance evaluations based on somatic mutations in the pan-cancer dataset
The importance of drivers in pan-cancer analysis has been empirically demonstrated [48]. Thus, we calculated AUC scores from the PCAWG pan-cancer dataset using various algorithms based on the foregoing eight reference gene sets (Supplementary Table S2). The mentha network data showed the best performance for 36 cancer types relative to different network datasets. To distinguish the differences in performance among the computational methods under ROC, we used mentha to analyze the network-based methods in the pan-cancer dataset. As moonlight only supported TCGA gene expression data for the subsequent analysis, it was not included in the pan-cancer analysis. The ROC curves and the AUC scores showed that the frequency-based driverMAPS method outperformed the other 10 algorithms under most reference datasets in the pan-cancer analysis including CGCpointMut (AUC = 0.9966), CTAT (AUC = 0.9966), HCD (AUC = 0.9966), 20/20 Rule (AUC = 0.9966), benchmark (AUC = 0.9966) and MouseMut (AUC = 0.8062) (Figure 2A–E and 2G). The driverMAPS method also exhibited better performance under the CGC benchmarks (second rank; AUC = 0.6841), whereas HotNet2 performed best only under CGC (AUC = 0.6986) (Figure 2F). However, most software programs showed lower AUC values under the OncoGene benchmark compared with the other seven reference datasets (Supplementary Table S2; Figure 2H). We also found that other tools had various performance levels under different benchmarks in the pan-cancer analysis. DNmax performed better under the CTAT, HCD and OncoGene benchmarks than the other tools (Supplementary Table S2).
Figure 2.

Performance evaluation results of different methods with mentha network dataset. The AUC of 11 algorithms are shown, based on somatic mutations of pan-cancer from PCAWG dataset with eight benchmark datasets (A-H). The AUC values for each computational method are shown in figures. Different colored curves in each figure represent the performance of different algorithms. 11 algorithms include OncoIMPACT, NetSig, MutPanning, WITER, MaxMIF, DNsum, nCOP, HotNet2, DriverML, driverMAPS and DNmax. Eight benchmark datasets include CGCpointMut, CTAT, HCD, 20/20 rule, benchmark, CGC, MouseMut and OncoGene.
Performance evaluations of different methods based on somatic mutations in 36 cancer types
To assess the ability of various algorithms at predicting cancer drivers in specific cancer types, we used somatic mutation data from each of the 36 cancer types based on six independently developed networks (http://159.226.67.237/sun/cancer_driver/resource/evaluation-scores.xlsx). The performance of these tools varied under different conditions. Hence, we summarized their overall performances under various network datasets and cancer types by calculating the medians and standard deviations (SD) under eight measurements (Figure 3A and B; Supplementary Figure S2A–F). Under the AUC measurement, the frequency-based method driverMAPS showed the highest median AUC value (range, 0.7083–1; mean, 0.9385) and performed best of all 12 algorithms. The performance of HotNet2 (range, 0.6081–0.9; mean, 0.8130) was second only to driverMAPS and HotNet2 was the best of all network-based methods. Compared with the function-based MutPanning method (range, 0.5248–0.7050; mean, 0.6244), all network-based methods showed superior performance at predicting cancer driver genes. Moreover, the performance of MutPanning was better than those of the other two frequency-based algorithms including WITER (range, 0.5112–0.5820; mean, 0.5462) and DriverML (range, 0.5138–0.5571; mean, 0.5431) (Figure 3A). However, network-based methods such as HotNet2, MaxMIF, NetSig, DNsum, DNmax and OncoIMPACT showed much higher sensitivity than driverMAPS and the other algorithms (Figure 3B). HotNet2 had the highest median sensitivity (range, 0.6013–0.8892; mean, 0.8026).
Figure 3.

Overall performance evaluation results of different methods and networks. The median of AUC and the median of sensitivity of 12 algorithms (A and B) and the median of AUC of six networks (C) are shown, based on somatic mutations of 36 cancer types from TCGA with eight benchmark datasets. 12 computational methods include DN_MAX, DN_SUM, driverMAPS, DriverML, HotNet2, MaxMIF, Moonlight, MutPanning, nCOP, NetSig, OncoIMPACT and WITER. Six network datasets include GeneMANIA, HumanNet, InBio_Map, mentha, STRINGv10 and WGCNA. The ‘NA’ in (C) represents the case where the non-network-based methods which do not use network data. The same group of ‘pillars’ represents the same algorithm (A and B) or network (C), and different colors in each group represent different benchmark sets for evaluating the algorithm (A and B) and networks (C). The error bars on each ‘pillars’ represent the standard deviation.
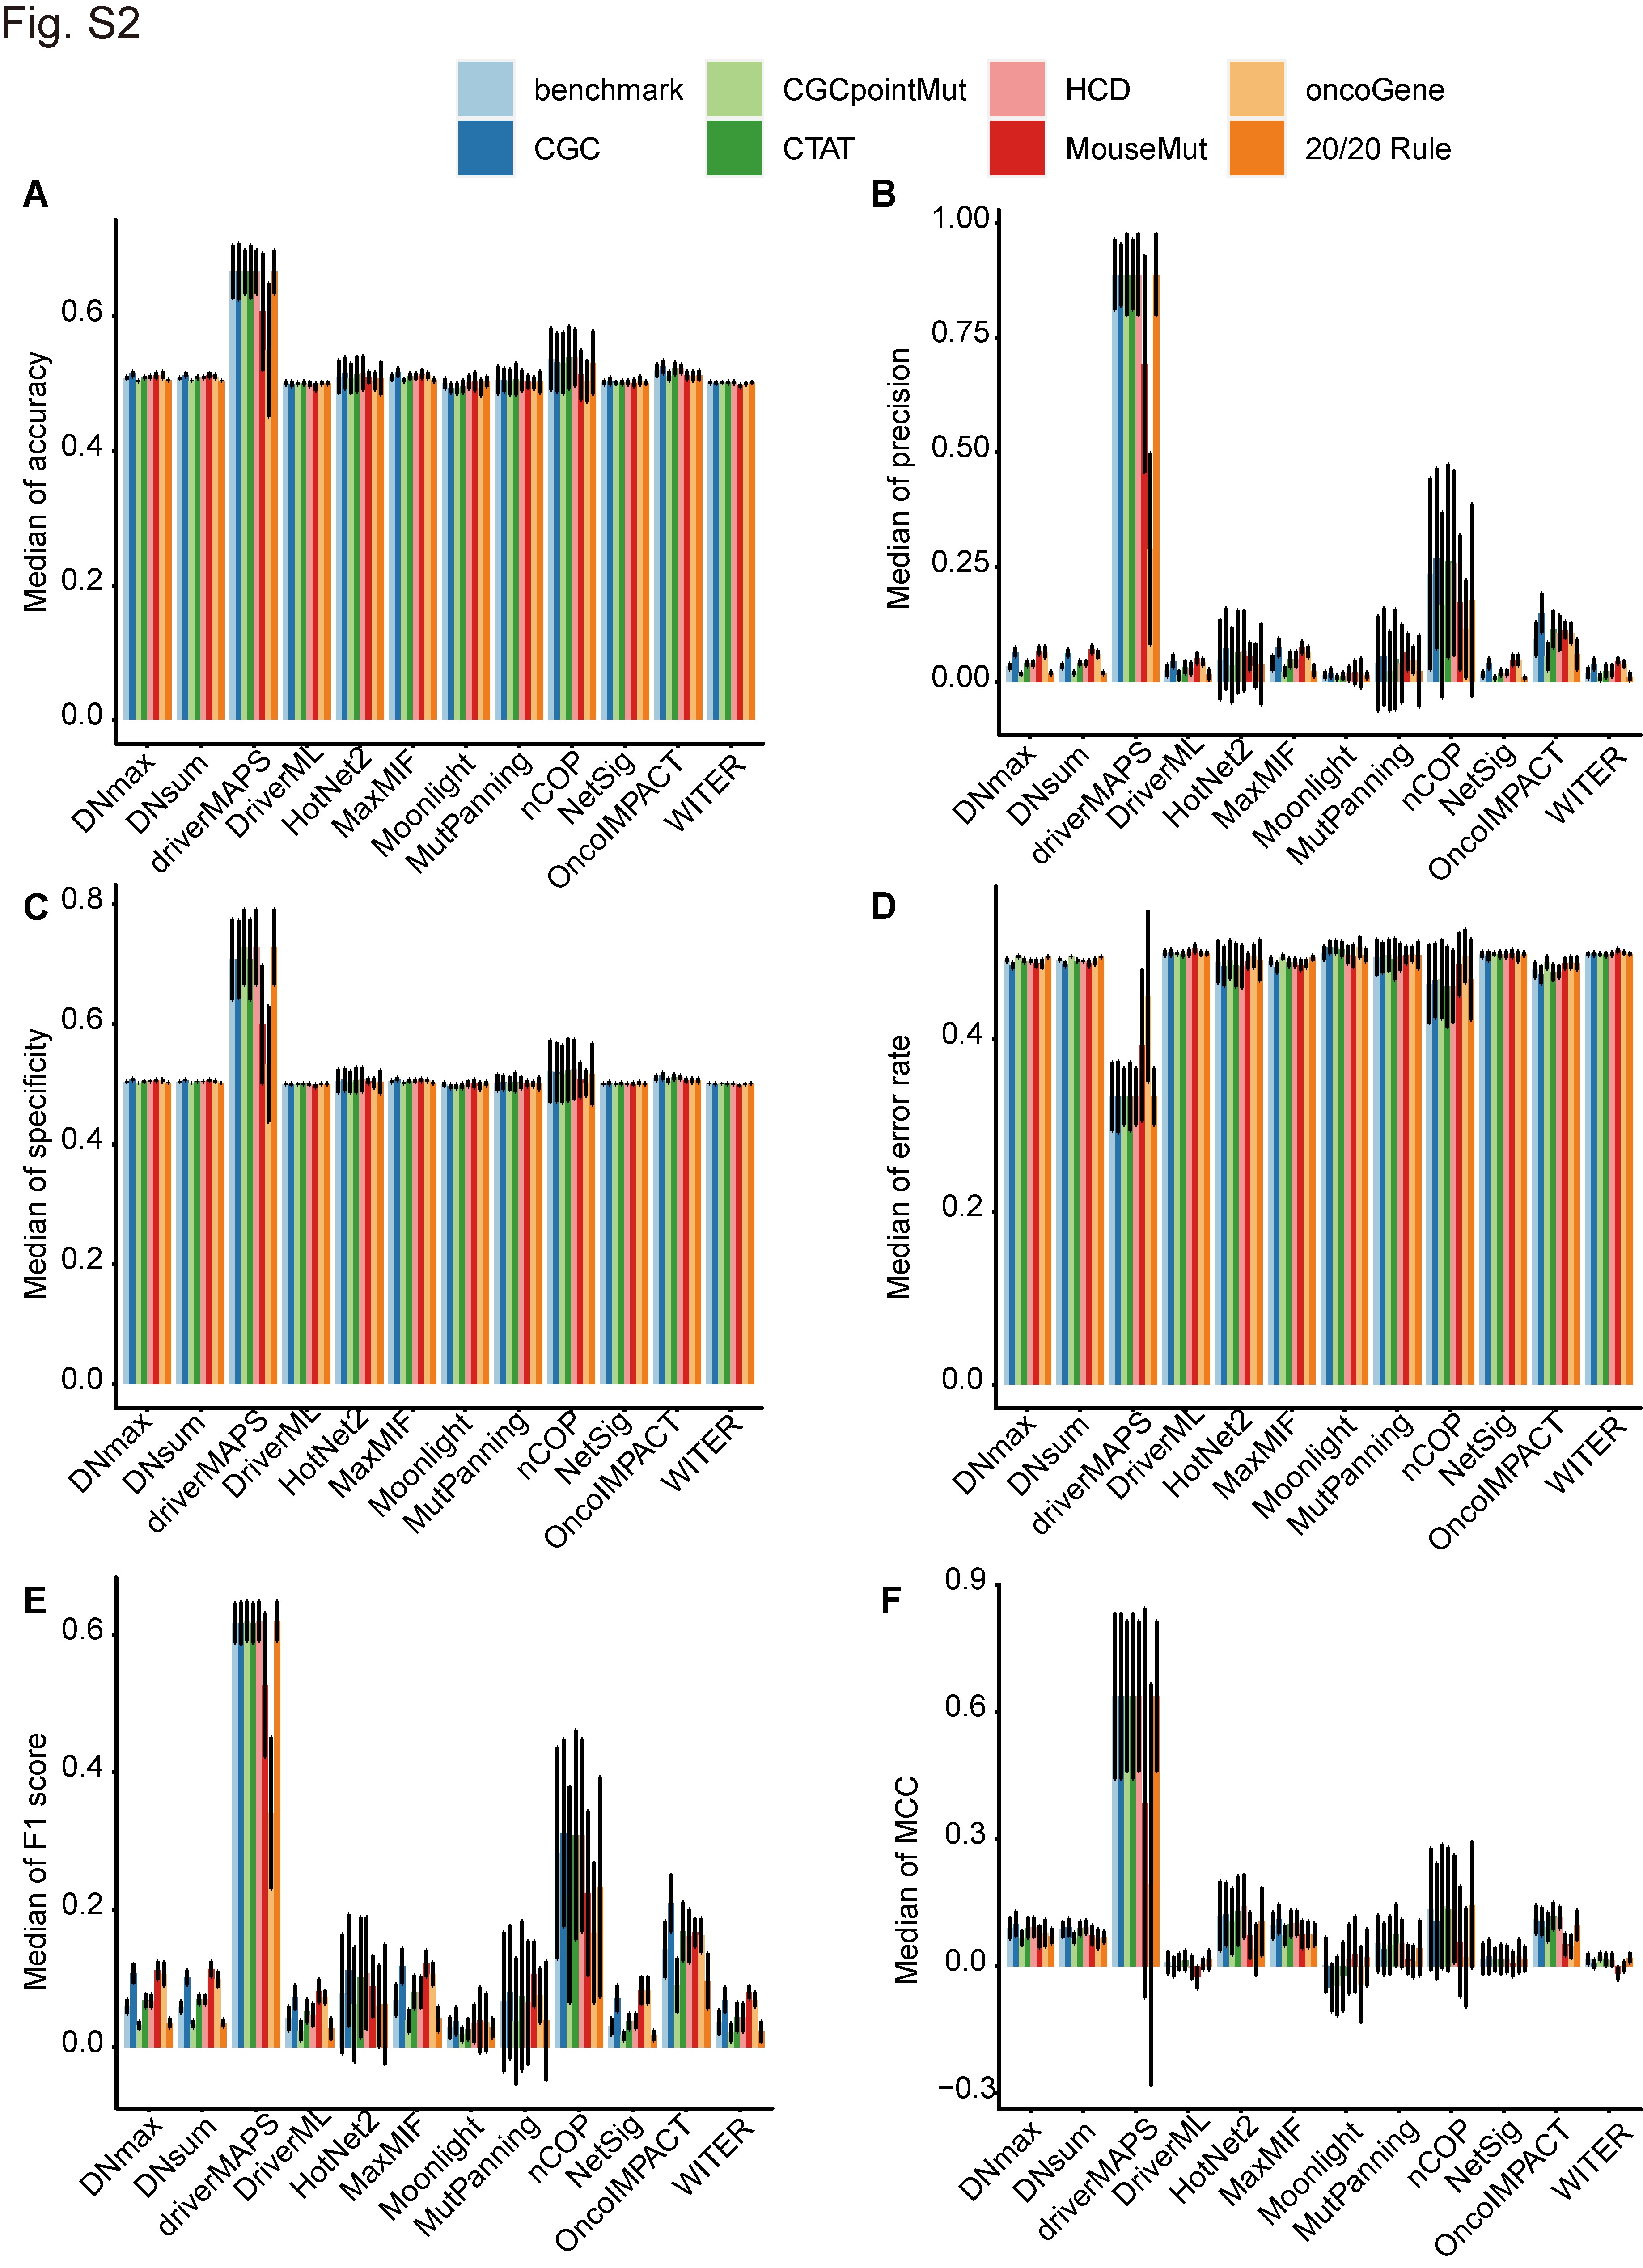
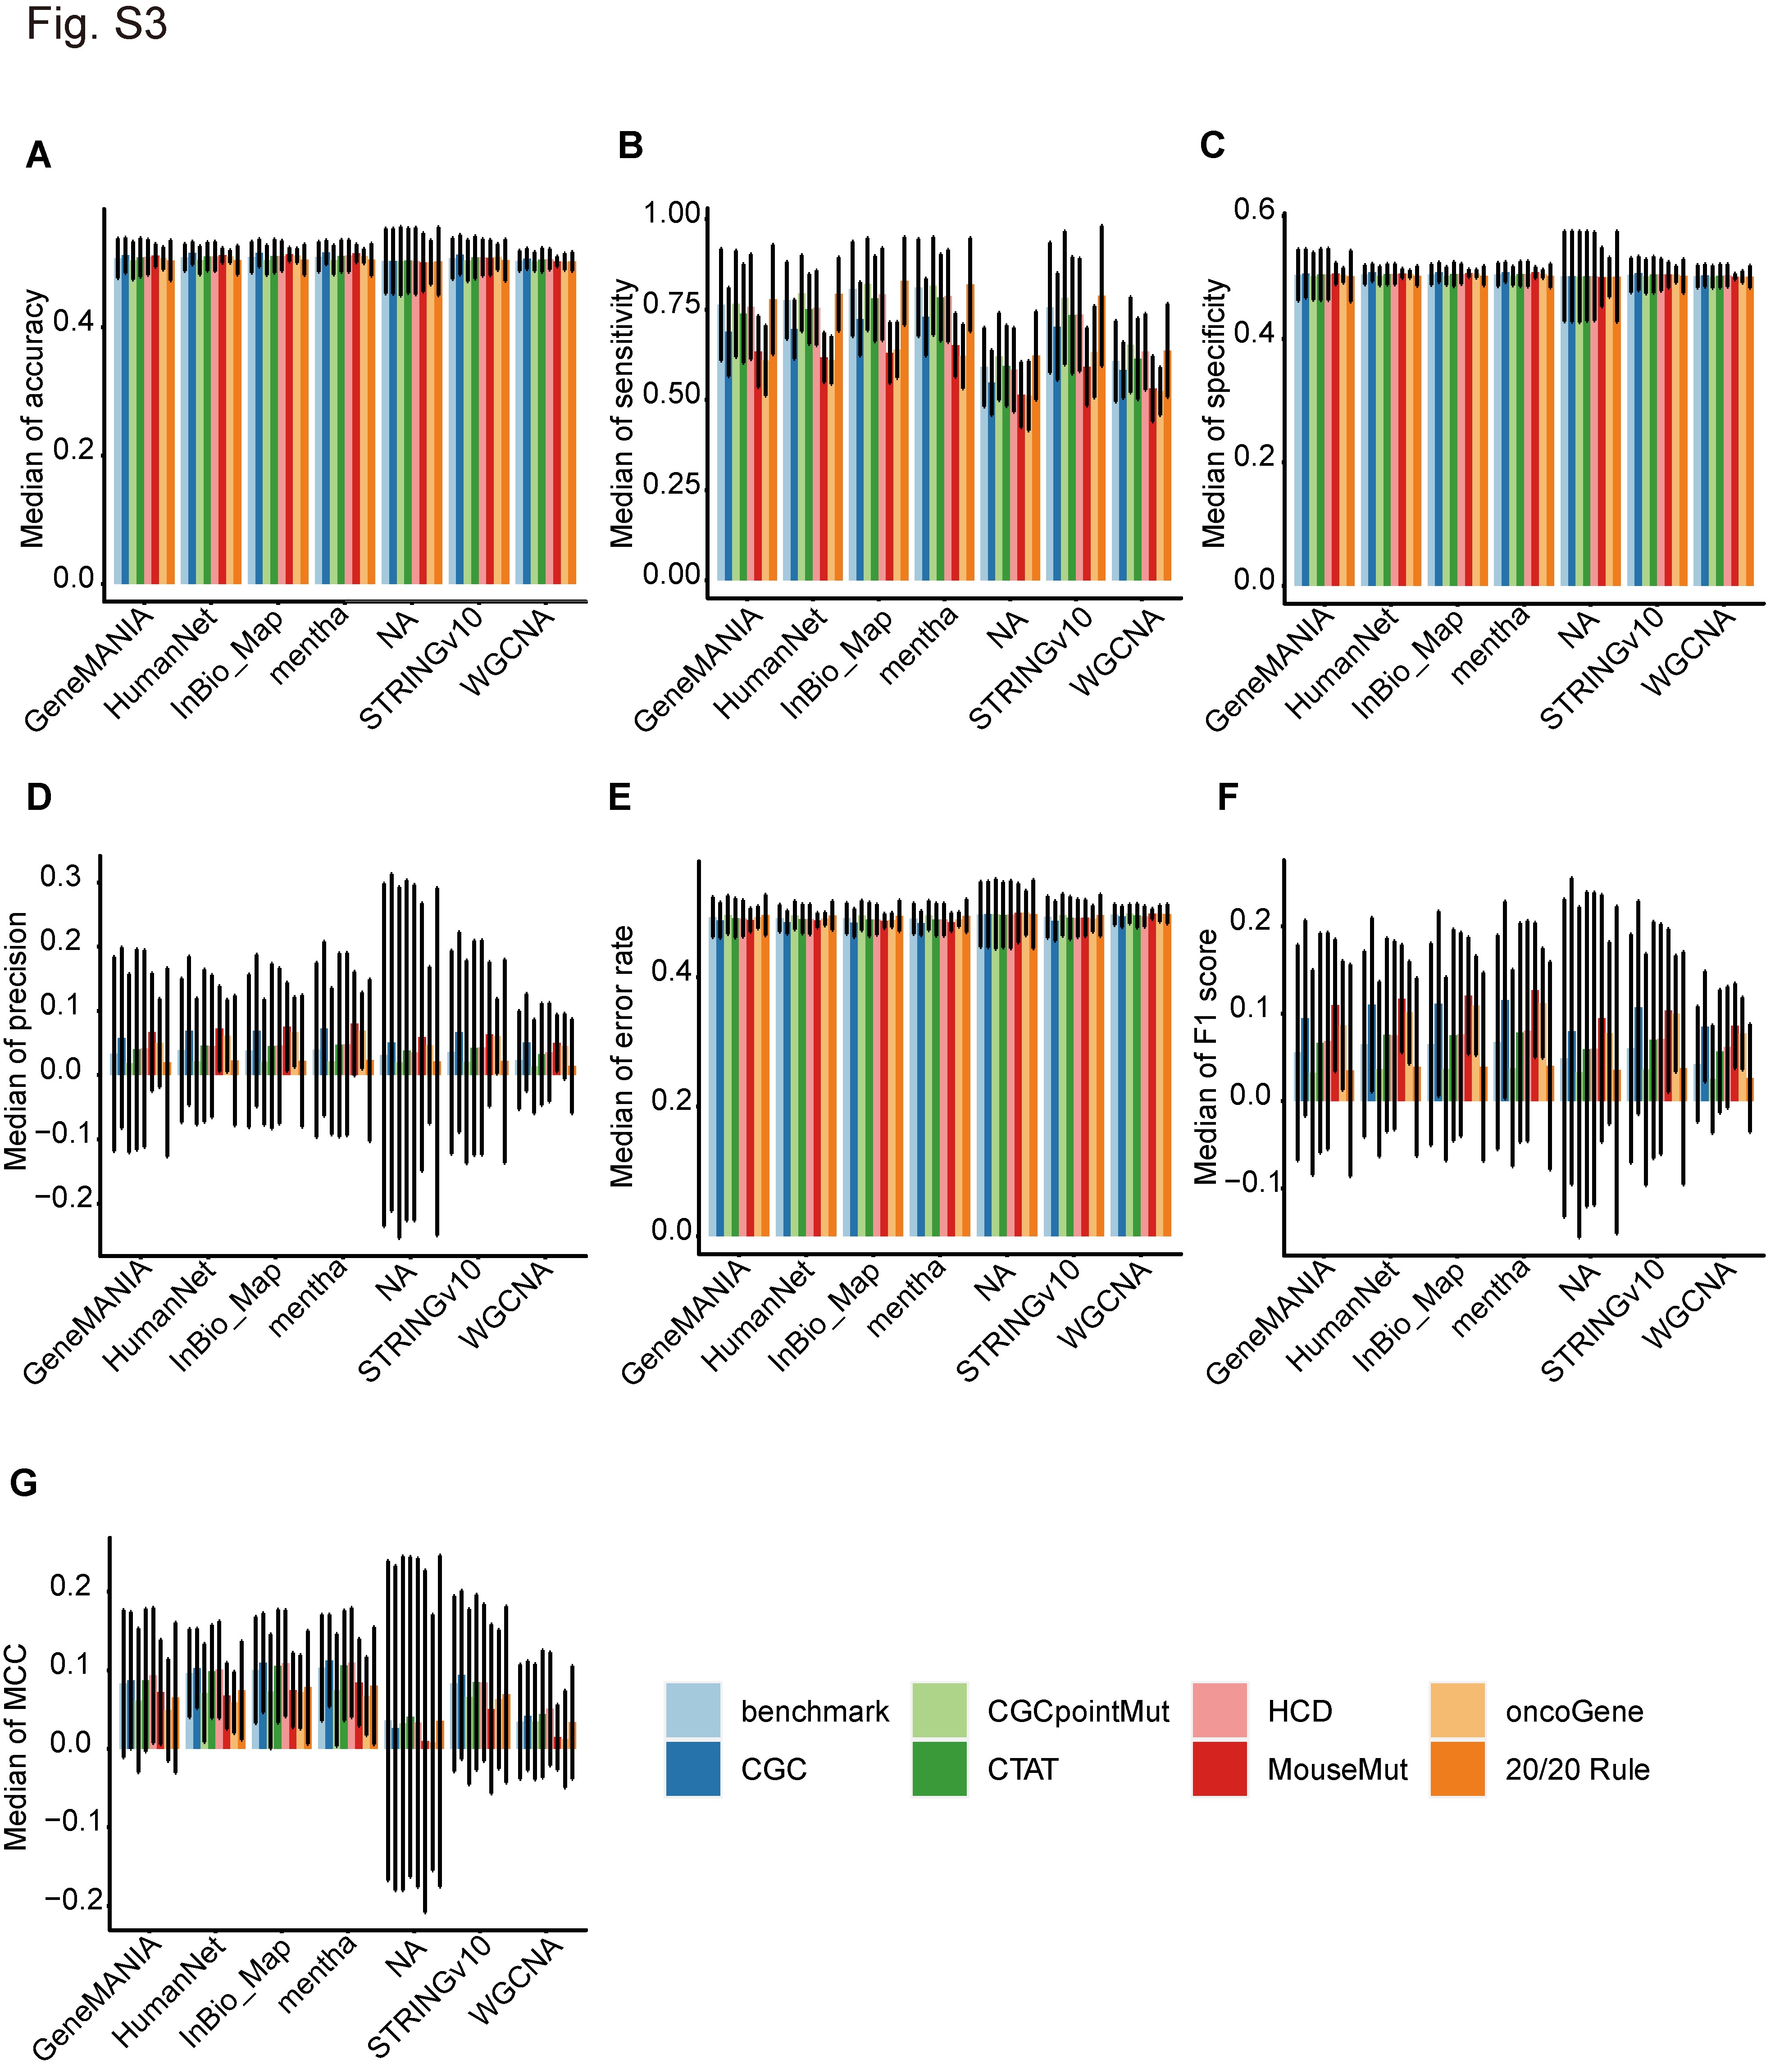
To verify the performances of the foregoing software programs, we assessed them in terms of their accuracy, specificity, precision, error rate, F1 score and MCC (Supplementary Figure S2A–F). The driverMAPS had the highest median accuracy (range, 0.55–0.6667; mean, 0.6446) (Supplementary Figure S2A), specificity (range, 0.5333–0.7292; mean, 0.6807) (Supplementary Figure S2C), precision (range, 0.2903–0.8875; mean, 0.7884) (Supplementary Figure S2B), F1 score (range, 0.3407–0.6193; mean, 0.5719) (Supplementary Figure S2E) and MCC (range, 0.1925–0.6369; mean, 0.5498) (Supplementary Figure S2F). For the other 11 algorithms, however, the medians of the foregoing parameters were barely satisfactory. Their accuracy values were in the range of 0.4931–0.5392 with a mean of 0.5087 (Supplementary Figure S2A) and their specificity values were in the range of 0.4965–0.5249 with a mean of 0.5047 (Supplementary Figure S2C). Their precision values were in the range of 0.0098–0.0296 with a mean of 0.0594 (Supplementary Figure S2B). Their F1 scores were in the range of 0.0190–0.3116 with a mean of 0.0892 (Supplementary Figure S2E). Their MCC values were in the range of −0.0504 to 0.1445 with a mean of 0.0605 (Supplementary Figure S2F). The nCOP, OncoIMPACT, HotNet2 and other algorithms ranked immediately after driverMAPS, whereas the Moonlight, WITER and DriverML algorithms ranked dead last in terms of performance. We obtained comparable results based on the error rates as well. Moreover, HotNet2 outperformed all other 11 software programs in terms of sensitivity.
For pan-cancer and 36 cancer types, in order to find the most suitable software for different cancer types to predict potential driver genes, we listed the software suitable for different cancer types by comprehensively calculating the optimal results of eight measurements (Supplementary Table S3).
Performance of various networks according to network-based methods for predicting driver genes
To compare the performance of the various network datasets used in the network-based methods, we calculated the scores of eight measurements for the different algorithms, networks and benchmarks across 36 cancer types (http://159.226.67.237/sun/cancer_driver/resource/evaluation-scores.xlsx). We found that the PPI network datasets outperformed the WGCNA network datasets despite the similarity of their performance in terms of AUC (Figure 3C). Briefly, the median AUC values of the PPI networks were in the range of 0.6300–0.8452 (mean, 0.7530), whereas those of the WGCNA network datasets were in the range of 0.5314–0.6685 (mean, 0.6149). Among the PPI network datasets, mentha had the highest mean AUC value (0.7787), and the AUC range was 0.6675–0.8452. The other leading datasets in terms of AUC were InBio_Map (mean, 0.7650), STRINGv10 (mean, 0.7427), HumanNet (mean, 0.7417) and GeneMANIA (mean, 0.7371) (Figure 3C). The performance of these network datasets showed similar ranking in terms of sensitivity (Supplementary Figure S3B) and MCC (Supplementary Figure S3G). Therefore, mentha and InBio_Map networks are the optimal network datasets for identifying potential cancer drivers via network-based methods. The six network datasets showed similar performance in terms of accuracy, specificity, precision, error rate and F1 score under the six network-based methods (Supplementary Figure S3A, S3C–F). However, they showed different performances in terms of AUC (Figure 3C), sensitivity (Supplementary Figure S3B) and MCC (Supplementary Figure S3G).
Effects of sample size on cancer driver gene identification
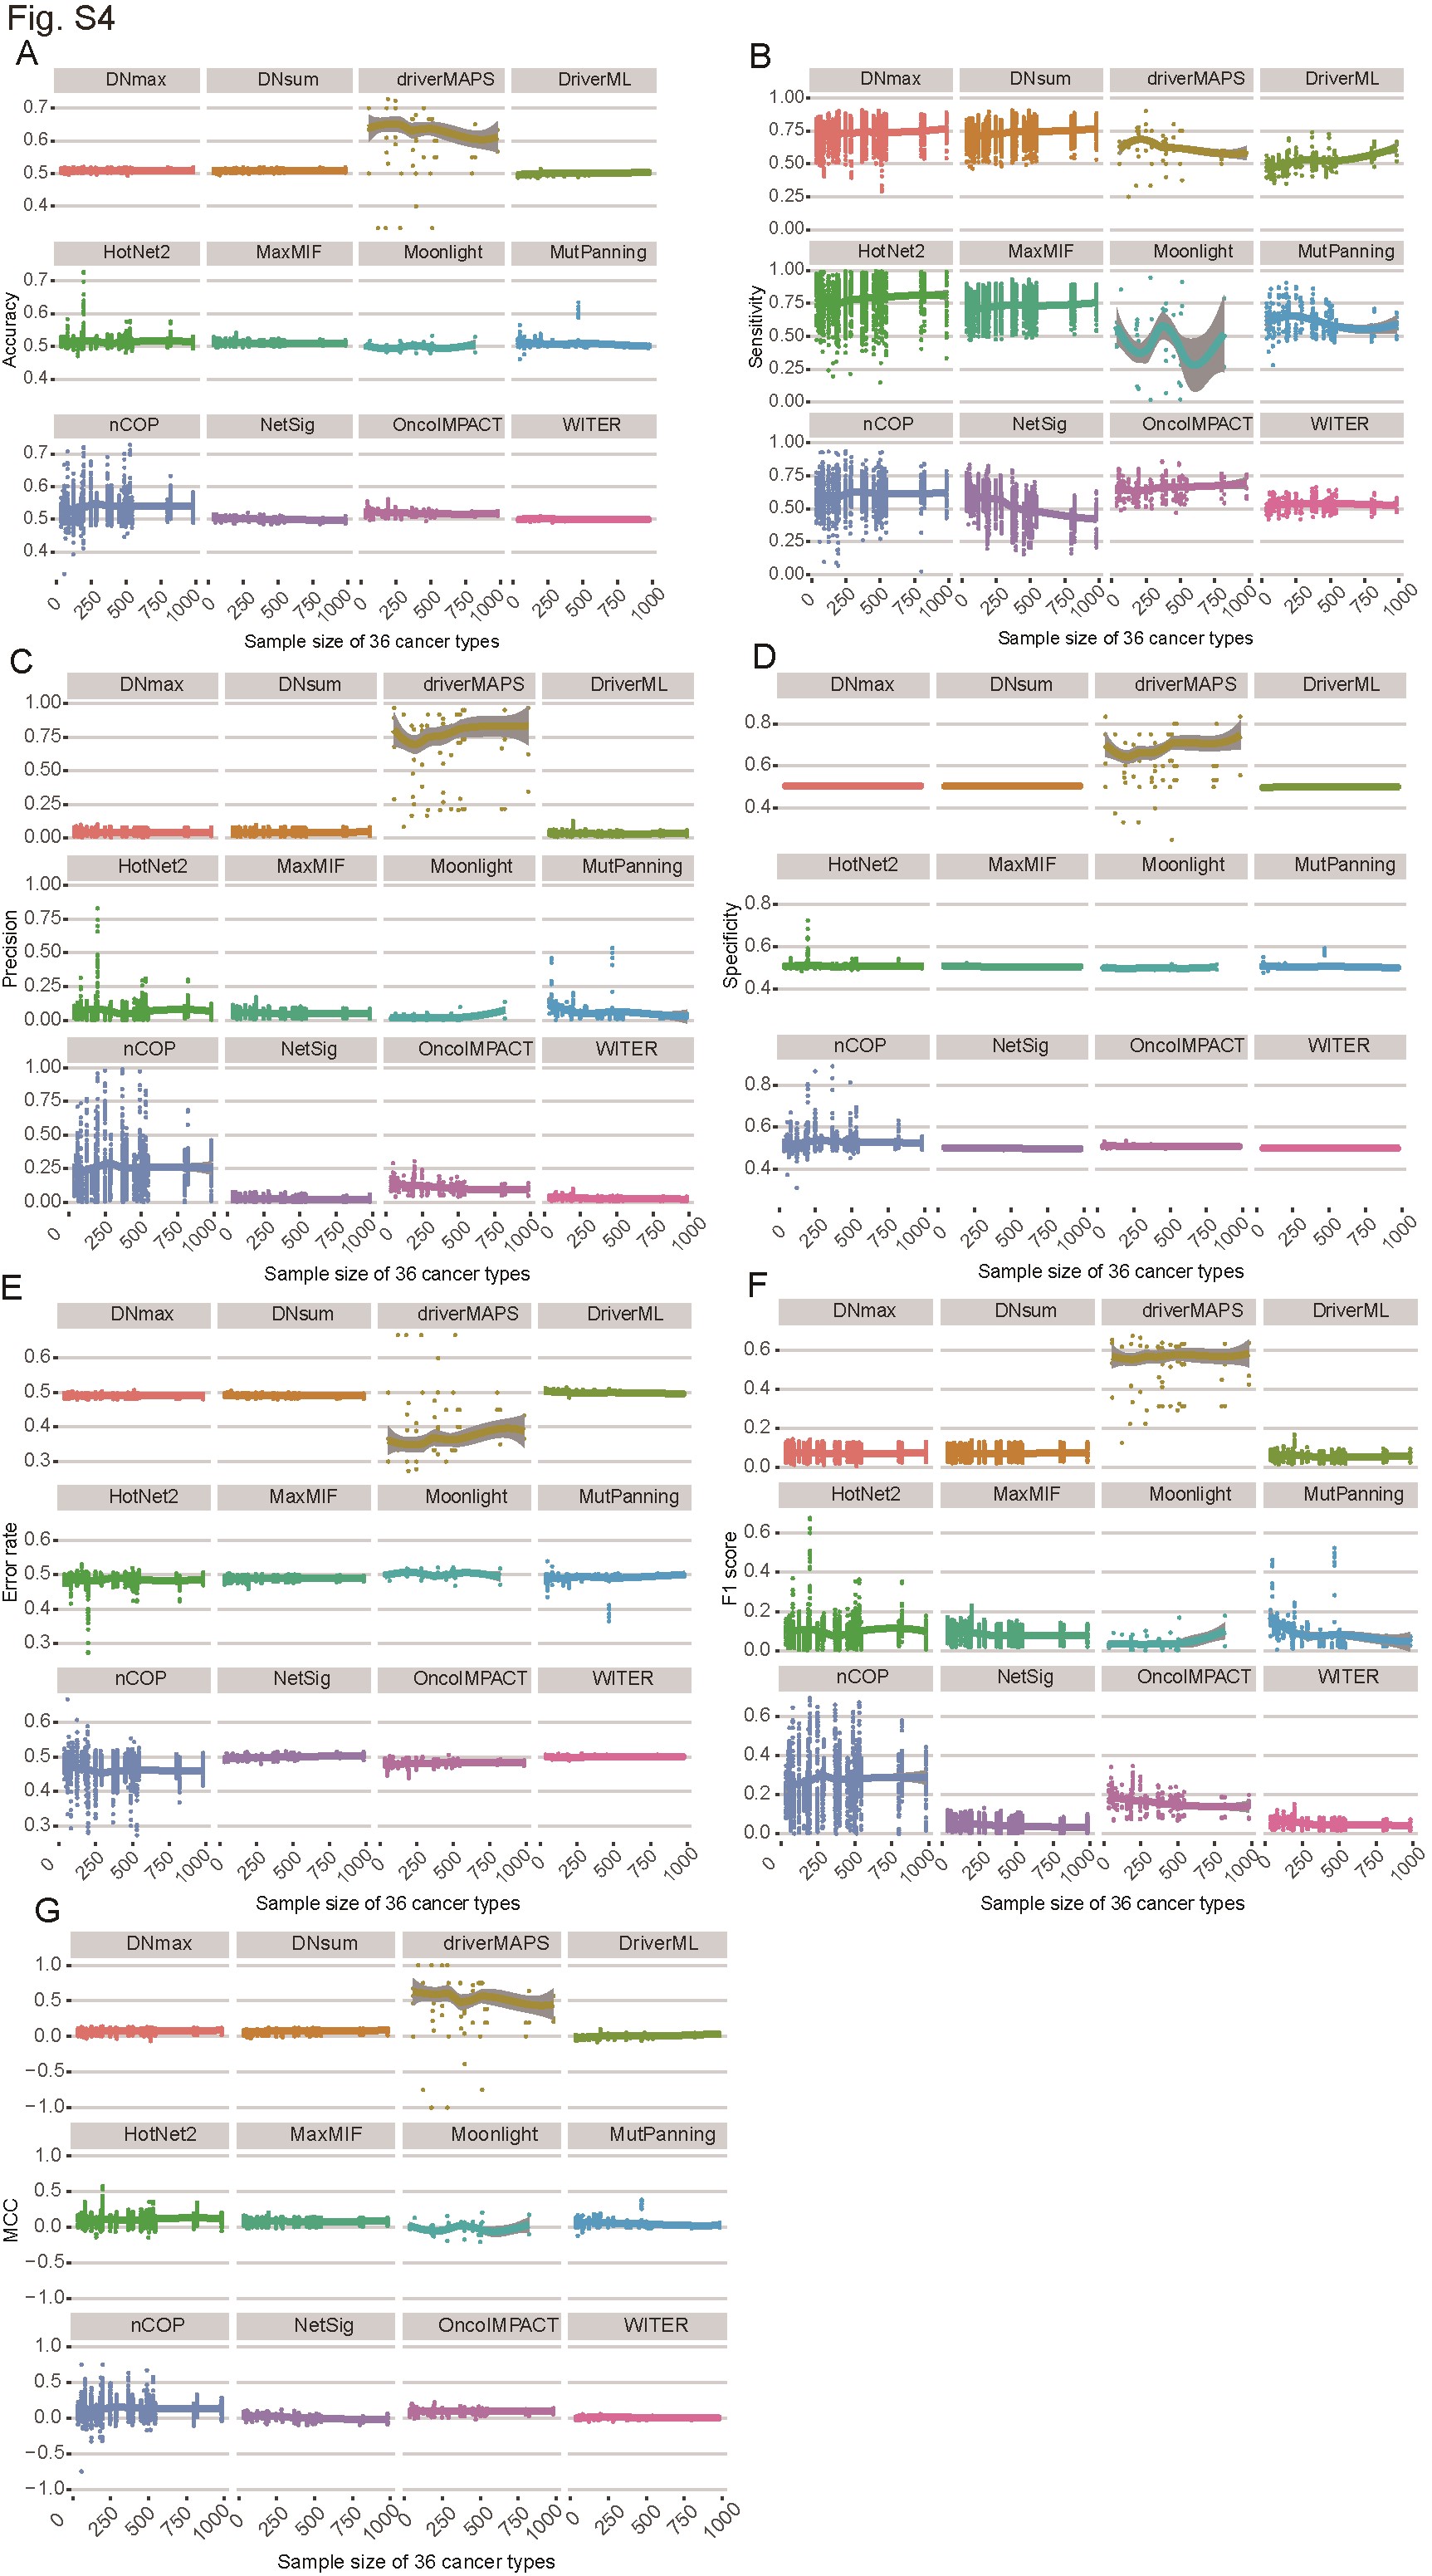
Sample size is an indispensable factor in calculating mutation frequency and may affect software performance stability [14, 49]. To determine the influence of sample size on the various methods used to distinguish cancer driver genes, we assessed the performance of different algorithms and network datasets using various sample sizes across the 36 cancer types (Figure 4A and B; Supplementary Figure S4A–G and S4A–G). All software programs showed similar performances in response to changes in sample size (Figure 4A and Supplementary Figure S4A–G). All methods except Moonlight did not significantly change with increasing sample size. Moonlight slightly improved as sample size increased (Figure 4A). According to the AUC values under different sample sizes, driverMAPS and HotNet2 had superior performance. They had locally weighted regression and their smoothing scatterplot (LOESS) curve values were all ≥0.8 (Figure 4A). According to the other criteria, these computational methods also showed stable performance in response to change in sample size (Supplementary Figure S4A–G).
Figure 4.
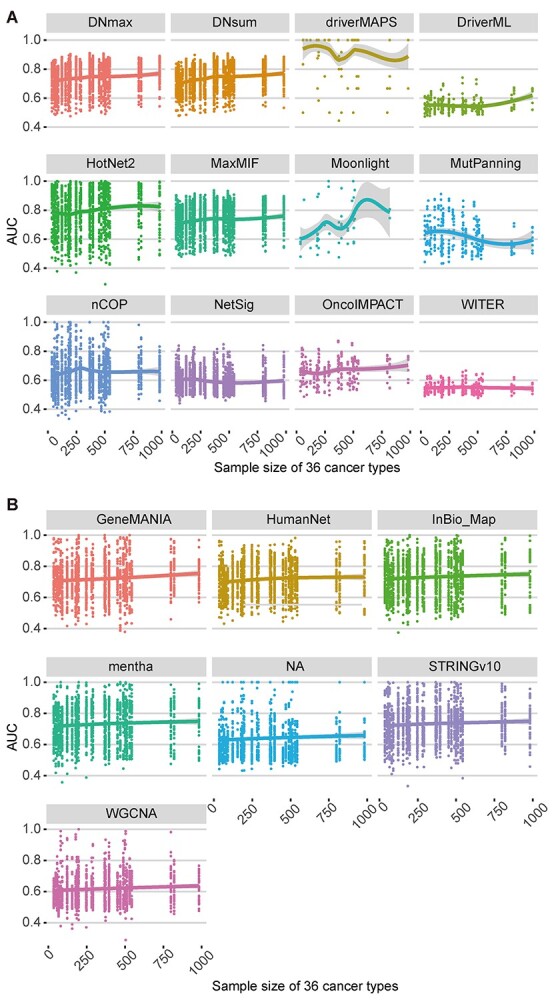
Effects of sample size on cancer driver gene identification for different computational methods and networks. The AUC of 12 algorithms (A) and 6 networks (B) based on somatic mutations of 36 cancer types from TCGA under different sample sizes with eight benchmark datasets are shown. Different algorithms (A) and networks (B) are displayed in different colors, and each point represents the AUC of corresponding algorithm (A) or network (B) under the corresponding sample size. Each dot plot has a smoothing scatterplot (LOESS) curve representing the performance trend. The ‘NA’ in (B) represents the case where the non-network-based methods which do not use network data.
The performance levels of two of the five PPI networks and one WGCNA network improved with increasing sample size according to the AUC (Figure 4B) and sensitivity (Supplementary Figure S5B) values. Based on the six other evaluation measurements, however, their performance levels remained virtually unchanged in response to increasing sample size (Supplementary Figure S5A and S5C–G).
Effects of gene length on candidate driver gene identification using different algorithms
Previous studies showed that driver gene identification was affected both by mutation frequency and the associated gene length [2]. Long genes are prone to somatic mutation. Computational methods identified the long gene TTN as a driver gene because it accumulated variants. However, it usually acts as a passenger in the cancer genome [50]. Therefore, the impact of gene length on the identification of driver genes is crucial. The pan-cancer dataset PCAWG has the largest sample size (n = 1950) compared with each of 36 cancer datasets from TCGA. Hence, we analyzed the length distribution of the top 100 candidate driver genes in PCAWG predicted by various computational methods. The lengths of the driver genes in the reliable reference datasets (CGC and our integrated benchmark) were included as baselines for comparison against different computational methods (Figure 5). Compared to the lengths of the cancer driver genes in CGC, DriverML identified even longer candidate driver genes (Kruskal–Wallis H test; P.adj = 0.004274). By contrast, there were no significant differences between the other algorithms in the PCAWG cohort and the two reference sets in terms of the lengths of their predicted cancer driver genes (Figure 5).
Figure 5.
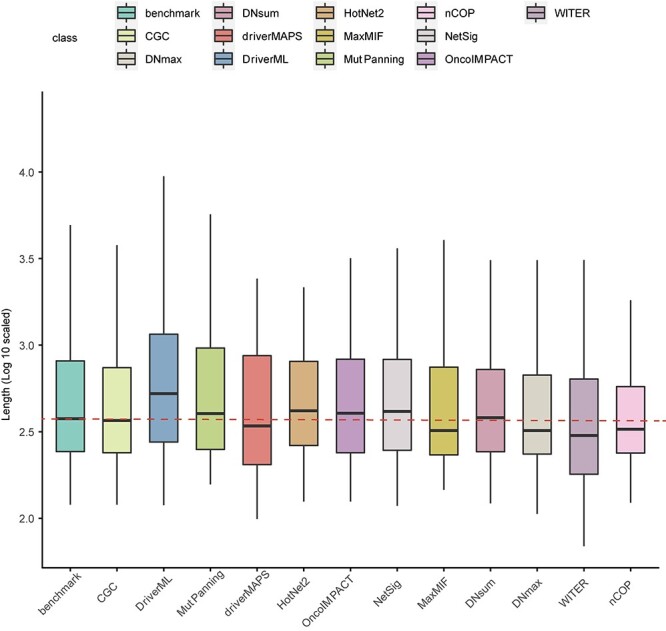
Effects of gene length on candidate driver gene identification for different computational methods. Log10 scaled length of candidate driver genes from 11 computational methods based on somatic mutations of pan-cancer from PCAWG dataset and driver genes from two reference sets of benchmark and CGC are shown. The length was taken as the sum of the non-redundant exon length of each gene and the value of log10 was calculated for normalization.
Similarities among different methods and cancer types measured by candidate driver genes
To clarify the similarities among candidate driver genes identified by the various computational methods, we compared the top 100 predictions obtained from the pan-cancer analysis. The mentha dataset served as the network data in the analysis of the network-based methods. The network-based methods were highly similar, whereas the methods in the other two categories differed (Figure 6A). We searched the functions of these common genes using our previously developed annotation tool called VarCards [51]. Of the 22 candidate driver genes identified by at least five software programs, only three were well-known cancer genes annotated by the OMIM database to cancer-related phenotypes (Supplementary Table S4) [52]. Thus, the remaining 19 shared genes may have been unverified drivers. DriverML, MaxMIF, NetSig, OncoIMPACT, WITER and driverMAPS predicted TP53 as a cancer driver. TP53 was annotated to choroid plexus papilloma, colorectal cancer, hepatocellular carcinoma, nasopharyngeal carcinoma, osteosarcoma, pancreatic cancer and adrenal cortical carcinoma-related phenotypes (Supplementary Table S4). At least five algorithms predicted that DCC and EGFR were driver genes annotated to colorectal cancer, esophageal carcinoma, non-small cell lung cancer and lung adenocarcinoma-related phenotypes, respectively (Supplementary Table S4). Functional enrichment analysis of the 22 candidate driver genes by the WebGestalt Over-Representation method [53] revealed that the 19 aforementioned unverified candidate driver genes were significantly enriched only in the synaptic transmission and glutamatergic biological processes (Supplementary Figure S6A). Evidence is lacking for their roles in cancer.
It has been reported that tumors from organs in the reproductive system and those in the gastrointestinal tract exhibited relatively similar somatic copy number (SCNA) patterns [54]. Our analysis revealed similar driver gene distribution patterns for cancers from related organs and in different subtypes of the same cancer type such as COAD versus COADREAD, STAD versus STES, GBMLGG versus LGG, KIPAN versus KIRC and LUAD versus LUSC (Figure 6B–D; Supplementary Figure S6B–J). However, other non-organ-related cancer types markedly differed in terms of their candidate driver genes.
Development of a website for searching cancer driver genes via different algorithms
To facilitate the process of querying the candidate driver genes identified by the foregoing 12 methods in pan-cancer and the 36 cancer types, we integrated the genes and their corresponding probability scores into a website named Cancer Driver Catalog (http://159.226.67.237/sun/cancer_driver/). Gene symbols, computational methods, cancer types, network data used in the network-based methods, gene ID, method scores and gene ranks were included in the website. The gene scores were predicted by the corresponding software and represented the probability of a cancer driver gene predicted by the corresponding tools. The likelihood of cancer driver status increased with gene score. The gene ranks were predicted by the corresponding software and represented the probability of a true cancer driver. The likelihood that a gene is a real cancer driver increased with gene rank.
Discussion
In precision cancer medicine, it is a central task to identify the driver genes in patients’ tumor cells. In this study, we used eight benchmark data sets to comprehensively evaluate the ability of 12 published algorithms to distinguish driver genes from passenger genes. The results show that driverMAPS had the overall best performance, especially under the MCC, F1 score and precision criteria. However, network-based methods showed much higher sensitivity than driverMAPS and the other algorithms. Therefore, network-based methods might more sensitively distinguish cancer driver and non-driver genes than function- and frequency-based methods. Taken together, the results show that driverMAPS and HotNet2 outperformed other network- and function-based algorithms. By contrast, the frequency-based methods WITER and DriverML were inferior in terms of prioritizing driver genes across 36 cancer types. We recommended the implementation of driverMAPS and HotNet2 rather than well-known methods such as MutSigCV for the prediction of driver genes. The overall medians of precision, F1 score and MCC (< 0.2) were much lower than those of AUC and sensitivity for all algorithms except driverMAPS. Our results suggest that certain genes identified as candidate drivers were, in fact, non-driver genes. Therefore, certain algorithms require rigorous cutoff values to be able to correctly distinguish driver and non-driver genes. In the evaluation of six network datasets, the PPI network outperformed the WGCNA network. Furthermore, the network-based method mentha showed the best performance at predicting driver genes. For eight benchmark datasets, the performance evaluations in the pan-cancer dataset showed that OncoGene was inconsistent with the other benchmark sets. Therefore, a gold standard, experimentally validated gene set is urgently needed. For the effects of sample size and gene length on cancer driver gene identification, our results demonstrate that most methods and the network datasets used in the network-based methods showed stable performance across various sample sizes. DriverML identifies longer cancer driver genes than the benchmark datasets, which suggests that gene length normalization is an important step in eliminating bias induced by calculating mutation frequency among genes of different lengths. Similarity analysis among different methods measured by candidate driver genes suggests that there was wide variation in the genes identified using different categories of computational methods. Furthermore, the application of only a single method to identify driver genes introduced bias. Candidate driver genes identified by at least five software programs should nonetheless be verified by functional experiments based on the gene enrichment results. Moreover, similarity analysis among different cancer types measured by candidate driver genes revealed physiological correlations in driver gene screening, but also heterogeneity among cancers. Finally, the integrated website of Cancer Driver Catalog will provide clinicians and researchers first-hand information about candidate driver genes predicted by various computational methods. The findings of the present work also provide important guidance for the selection of appropriate methods to identify candidate driver genes. Finally, our study improves our understanding of the role of cancer driver genes in early cancer detection, therapeutic intervention and patient prognosis.
We speculated that the optimal performance levels of driverMAPS and HotNet2 could be attributed to their identification principles. The driverMAPS combines frequency- and function-based principles. It could achieve true selection at the single-base level and under highly heterogeneous background mutation because it uses multiple external annotations and spatial mutation clustering to capture high mutation rates at functionally important sites. Network-based methods such as HotNet2 showed better overall performance than function- and frequency-based approaches. We speculated that the superior performance of network-based methods is attributed mainly to their network module screening process. In the network modules, most genes were enriched in important biological pathways. When the number of genes was limited in the pathways or modules, however, certain driver genes were overlooked. Thus, it remains to be established whether design principle is a critical factor determining the superior performance of the two tools.
Certain computational methods were previously evaluated [10, 14, 19–24]. Nevertheless, the results of these earlier studies markedly differed from those of the current study. Of the five assessments conducted in the previous studies to identify cancer driver genes, only one was performed independently and without using the methods newly developed by the researchers. Therefore, an independent and comprehensive comparison of the computational methods used in cancer driver identification was necessary. Several recently developed approaches such as Moonlight [25], nCOP [26], OncoIMPACT [27], MutPanning [12], WITER [9], DriverML, [10] and driverMAPS [8] were omitted from previous assessments. A gold standard, experimentally validated gene set is still lacking. Hence, we collected seven datasets and integrated them into a benchmark dataset including genes reported to be associated with cancer activity and progression. The integrated ‘benchmark’ dataset remove redundancy from curated reference datasets and avoided evaluation bias caused by uneven benchmark set quality. We systematically applied eight evaluation criteria to confirm the performance results. By contrast, most other software programs only used AUC and one or more of the other assessment criteria we used. We evaluated the effects of sample size and gene length on tool performance.
The observed high error rates indicate that these algorithms still return many false positives and false negatives. Our comprehensive performance evaluation provides meaningful directions for future algorithm development. First, integration of different principles in the ensemble algorithms may be more promising for more accurate identification of cancer driver genes, because such algorithms can effectively balance the limitations of pre-exist algorithms. For example, a function-based principle considers the functional impact at the nucleotide or even protein level, and a network-based method screens the genes that prefer to interact with other genes. Second, the high heterogeneity among different cancer types suggests that cancer context plays an important role in driver genes to determine the effect of mutation. Therefore, for the identification of cancer driver genes with the accumulation of sequencing and functional data, it is very important to develop new algorithms targeting specific cancers. Finally, few of these methods were experimentally validated and false positive data might have been included among the results. Future research should apply functional validations to improve the accuracy and accessibility of high-throughput methods.
Key Points
The frequency-based driverMAPS and network-based HotNet2 methods showed the best overall performance in predicting driver genes.
The performance levels of all approaches varied in terms of network, measurement and sample size under different conditions.
The present work also developed a novel online tool providing tentative guidance for cancer researchers and clinical oncologists seeking candidate cancer driver genes.
Supplementary Material
Acknowledgement
We thank the members of the Beijing Institute of Life Science, Chinese Academy of Sciences for their valuable discussions regarding this work. We thank Dr Kyoung-Jae Won, in Biotech Research and Innovation Centre (BRIC), University of Copenhagen for his help in suggesting about this project.
Xiaohui Shi is a PhD candidate in Beijing Institutes of Life Science, Chinese Academy of Sciences, University of Chinese Academy of Sciences. Her research interests include genomics and bioinformatics.
Huajing Teng is an associate professor in Department of Radiation Oncology, Key Laboratory of Carcinogenesis and Translational Research (Ministry of Education) at Peking University Cancer Hospital and Institute. His research is in the areas of bioinformatics and genomics.
Leisheng Shi is a PhD candidate in Key Laboratory of Genomic and Precision Medicine, Beijing Institute of Genomics, Chinese Academy of Sciences. His research interests include genomics and bioinformatics.
Wenjian Bi is an assistant professor in Department of Medical Genetics, School of Basic Medical Sciences, Peking University. His research interests include statistical genetics, biostatistics and genomics.
Wenqing Wei is a master student in Beijing Institutes of Life Science, Chinese Academy of Sciences. His research interests include genomics and bioinformatics.
Fengbiao Mao is an assistant professor in Institute of Medical Innovation and Research, Peking University Third Hospital. His research is in the areas of bioinformatics and genomics.
Zhongsheng Sun is a professor in Beijing Institutes of Life Science, Chinese Academy of Sciences, CAS Center for Excellence in Biotic Interactions and State Key Laboratory of Integrated Management of Pest Insects and Rodents, University of Chinese Academy of Sciences, Institute of Genomic Medicine, Wenzhou Medical University, IBMC-BGI Center, the Cancer Hospital of the University of Chinese Academy of Sciences (Zhejiang Cancer Hospital), Institute of Basic Medicine and Cancer (IBMC), Chinese Academy of Sciences. His research is in the areas of bioinformatics and genomics.
Contributor Information
Xiaohui Shi, Beijing Institutes of Life Science, Chinese Academy of Sciences, University of Chinese Academy of Sciences, Beijing 100080, China.
Huajing Teng, Department of Radiation Oncology, Key Laboratory of Carcinogenesis and Translational Research (Ministry of Education) at Peking University Cancer Hospital and Institute, Beijing 100080, China.
Leisheng Shi, Key Laboratory of Genomic and Precision Medicine, Beijing Institute of Genomics, Chinese Academy of Sciences, Beijing 100080, China.
Wenjian Bi, Department of Medical Genetics, School of Basic Medical Sciences, Peking University, Beijing 100080, China.
Wenqing Wei, Beijing Institutes of Life Science, Chinese Academy of Sciences, Beijing 100080, China.
Fengbiao Mao, Institute of Medical Innovation and Research, Peking University Third Hospital, Beijing 100080, China.
Zhongsheng Sun, Beijing Institutes of Life Science, Chinese Academy of Sciences, CAS Center for Excellence in Biotic Interactions and State Key Laboratory of Integrated Management of Pest Insects and Rodents, University of Chinese Academy of Sciences, Institute of Genomic Medicine, Wenzhou Medical University, IBMC-BGI Center, the Cancer Hospital of the University of Chinese Academy of Sciences (Zhejiang Cancer Hospital), Institute of Basic Medicine and Cancer (IBMC), Chinese Academy of Sciences, Beijing 100080, China.
Authors’ contributions statement
F. M. and Z. S. conceived and designed the study. X. S., H. T., F. M. and Z. S. wrote the manuscript. X. S., L. S., W. B. and W. W. analyzed the data. X. S. and F. M. collected data.
Data availability
All data relevant to the study are included in the article or uploaded as supplementary information.
Conflict of interests
The authors declare they have no conflicts of interest.
Funding
National Natural Science Foundation of China (32170650, 31911530148 and 32170656]; Guangzhou and Guangdong Key Project (202007030002 and 2018B030335001); Clinical Medicine Plus X - Young Scholars Project, Peking University; the Fundamental Research Funds for the Central Universities (PKU2021LCXQ015); Research start-up funding, Peking University Third Hospital (BYSYYZD2021001).
References
- 1. Stratton MR, Campbell PJ, Futreal PA. The cancer genome. Nature 2009;458:719–24. [DOI] [PMC free article] [PubMed] [Google Scholar]
- 2. Vogelstein B, Papadopoulos N, Velculescu VE, et al. Cancer genome landscapes. Science 2013;339:1546–58. [DOI] [PMC free article] [PubMed] [Google Scholar]
- 3. Papaemmanuil E, Gerstung M, Bullinger L, et al. Genomic Classification and Prognosis in Acute Myeloid Leukemia. N Engl J Med 2016;374:2209–21. [DOI] [PMC free article] [PubMed] [Google Scholar]
- 4. Chang K, Creighton CJ, Davis C, et al. The Cancer Genome Atlas Pan-Cancer analysis project. Chin J Lung Cancer 2015;45:1113–20. [Google Scholar]
- 5. Hudson TJ, Anderson W, Aretz A, et al. International network of cancer genome projects. Nature 2010;464:993–8. [DOI] [PMC free article] [PubMed] [Google Scholar]
- 6. TARGET N . Therapeutically Applicable Research to Generate Effective Treatments (TARGET) Project: Half of Pediatric Cancers Have Their Own ``Driver'' Genes. Pediatr Blood Cancer 2018;65:S45–5. [Google Scholar]
- 7. Tamborero D, Rubio-Perez C, Deu-Pons J, et al. Cancer Genome Interpreter annotates the biological and clinical relevance of tumor alterations. Genome Med 2018;10:25. [DOI] [PMC free article] [PubMed] [Google Scholar]
- 8. Zhao S, Liu J, Nanga P, et al. Detailed modeling of positive selection improves detection of cancer driver genes. Nat Commun 2019;10:3399. [DOI] [PMC free article] [PubMed] [Google Scholar]
- 9. Jiang L, Zheng JJ, Kwan JSH, et al. WITER: a powerful method for estimation of cancer-driver genes using a weighted iterative regression modelling background mutation counts. Nucleic Acids Res 2019;47:16. [DOI] [PMC free article] [PubMed] [Google Scholar]
- 10. Han Y, Yang J, Qian X, et al. DriverML: a machine learning algorithm for identifying driver genes in cancer sequencing studies. Nucleic Acids Res 2019;47:e45. [DOI] [PMC free article] [PubMed] [Google Scholar]
- 11. Lawrence MS, Stojanov P, Polak P, et al. Mutational heterogeneity in cancer and the search for new cancer-associated genes. Nature 2013;499:214–8. [DOI] [PMC free article] [PubMed] [Google Scholar]
- 12. Dietlein F, Weghorn D, Taylor-Weiner A, et al. Identification of cancer driver genes based on nucleotide context. Nat Genet 2020;52:208–18. [DOI] [PMC free article] [PubMed] [Google Scholar]
- 13. Leiserson MD, Vandin F, Wu HT, et al. Pan-cancer network analysis identifies combinations of rare somatic mutations across pathways and protein complexes. Nat Genet 2015;47:106–14. [DOI] [PMC free article] [PubMed] [Google Scholar]
- 14. Cho A, Shim JE, Kim E, et al. MUFFINN: cancer gene discovery via network analysis of somatic mutation data. Genome Biol 2016;17:129. [DOI] [PMC free article] [PubMed] [Google Scholar]
- 15. Horn H, Lawrence MS, Chouinard CR, et al. NetSig: network-based discovery from cancer genomes. Nat Methods 2018;15:61–6. [DOI] [PMC free article] [PubMed] [Google Scholar]
- 16. I-Fang C, Chen CY, Su SC, et al. DriverDBv2: a database for human cancer driver gene research. Nucleic Acids Res 2015;D975–9. [DOI] [PMC free article] [PubMed] [Google Scholar]
- 17. Wang H, Wang T, Zhao X, et al. AI-Driver: an ensemble method for identifying driver mutations in personal cancer genomes. NAR Genomics and Bioinformatics 2020;2:1. [DOI] [PMC free article] [PubMed] [Google Scholar]
- 18. Wang T, Ruan S, Zhao X, et al. OncoVar: an integrated database and analysis platform for oncogenic driver variants in cancers. Nucleic Acids Res 2020;1:1. [DOI] [PMC free article] [PubMed] [Google Scholar]
- 19. Kumar RD, Swamidass SJ, Bose R. Unsupervised detection of cancer driver mutations with parsimony-guided learning. Nat Genet 2016;48:1288–94. [DOI] [PMC free article] [PubMed] [Google Scholar]
- 20. Yingnan H, et al. MaxMIF: A New Method for Identifying Cancer Driver Genes through Effective Data Integration. Advanced Science 2018;5:1800640. [DOI] [PMC free article] [PubMed] [Google Scholar]
- 21. Gnad F, Baucom A, Mukhyala K, et al. Assessment of computational methods for redicting the effects of missense mutations in human cancers. BMC Genomics 2013;14:S7. [DOI] [PMC free article] [PubMed] [Google Scholar]
- 22. Li J, Zhao T, Zhang Y, et al. Performance evaluation of pathogenicity-computation methods for missense variants. Nucleic Acids Res 2018;46:7793–804. [DOI] [PMC free article] [PubMed] [Google Scholar]
- 23. Tokheim CJ, Papadopoulos N, Kinzler KW, et al. Evaluating the evaluation of cancer driver genes. Proc Natl Acad Sci U S A 2016;113:14330–5. [DOI] [PMC free article] [PubMed] [Google Scholar]
- 24. Hofree M, Carter H, Kreisberg JF, et al. Challenges in identifying cancer genes by analysis of exome sequencing data. Nat Commun 2016;7:12096. [DOI] [PMC free article] [PubMed] [Google Scholar]
- 25. Colaprico A, Olsen C, Bailey MH, et al. Interpreting pathways to discover cancer driver genes with Moonlight. Nat Commun 2020;11:69. [DOI] [PMC free article] [PubMed] [Google Scholar]
- 26. Hristov BH, Singh M. Network-Based Coverage of Mutational Profiles Reveals Cancer Genes. Cell Syst 2017;5(221–229):e224. [DOI] [PMC free article] [PubMed] [Google Scholar]
- 27. Denis B, Rei CK, Ghazi SF, et al. Patient-specific driver gene prediction and risk assessment through integrated network analysis of cancer omics profiles. Nucleic Acids Res 2015;7:e44. [DOI] [PMC free article] [PubMed] [Google Scholar]
- 28. Futreal PA, Coin L, Marshall M, et al. A census of human cancer genes. Nat Rev Cancer 2004;4:177–83. [DOI] [PMC free article] [PubMed] [Google Scholar]
- 29. Tamborero D, Gonzalez-Perez A, Perez-Llamas C, et al. Comprehensive identification of mutational cancer driver genes across 12 tumor types. Sci Rep 2013;3:2650. [DOI] [PMC free article] [PubMed] [Google Scholar]
- 30. Dees ND, Zhang Q, Kandoth C, et al. MuSiC: identifying mutational significance in cancer genomes. Genome Res 2012;22:1589–98. [DOI] [PMC free article] [PubMed] [Google Scholar]
- 31. Gonzalez-Perez A, NJNAR L-B. Functional impact bias reveals cancer drivers. Nucleic Acids Res 2012;40:e169. [DOI] [PMC free article] [PubMed] [Google Scholar]
- 32. Tamborero D, Gonzalez-Perez A, Lopez-Bigas N. OncodriveCLUST: exploiting the positional clustering of somatic mutations to identify cancer genes. Bioinformatics 2013;29:2238–44. [DOI] [PubMed] [Google Scholar]
- 33. Reimand J, Wagih O, Bader GD. The mutational landscape of phosphorylation signaling in cancer. Sci Rep 2013;3:2651. [DOI] [PMC free article] [PubMed] [Google Scholar]
- 34. March HN, Rust AG, Wright NA, et al. Insertional mutagenesis identifies multiple networks of cooperating genes driving intestinal tumorigenesis. Nat Genet 2011;43:1202–9. [DOI] [PMC free article] [PubMed] [Google Scholar]
- 35. Liu Y, Sun J, Zhao M. ONGene: A literature-based database for human oncogenes. J Genet Genomics 2017;44:119–21. [DOI] [PubMed] [Google Scholar]
- 36. Bailey MH, Tokheim C, Porta-Pardo E, et al. Comprehensive Characterization of Cancer Driver Genes and Mutations. Cell 2018;173(371–385):e318. [DOI] [PMC free article] [PubMed] [Google Scholar]
- 37. Li X, Shi L, Wang Y, et al. OncoBase: a platform for decoding regulatory somatic mutations in human cancers. Nucleic Acids Res 2019;47:D1044–55. [DOI] [PMC free article] [PubMed] [Google Scholar]
- 38. Mao F, Liu Q, Zhao X, et al. EpiDenovo: A platform for linking regulatory de novo mutations to developmental epigenetics and diseases. Nucleic Acids Res 2017;46:D92. [DOI] [PMC free article] [PubMed] [Google Scholar]
- 39. Pham M, Lichtarge O. Graph-based information diffusion method for prioritizing functionally related genes in protein-protein interaction networks. Pac Symp Biocomput 2020;25:439–50. [PMC free article] [PubMed] [Google Scholar]
- 40. Szklarczyk D, Franceschini A, Wyder S, et al. STRING v10: protein-protein interaction networks, integrated over the tree of life. Nucleic Acids Res 2015;43:D447–52. [DOI] [PMC free article] [PubMed] [Google Scholar]
- 41. Lee I, Blom UM, Wang PI, et al. Prioritizing candidate disease genes by network-based boosting of genome-wide association data. Genome Res 2011;21:1109. [DOI] [PMC free article] [PubMed] [Google Scholar]
- 42. Lage K, Karlberg EO, Storling ZM, et al. A human phenome-interactome network of protein complexes implicated in genetic disorders. Nat Biotechnol 2007;25:309–16. [DOI] [PubMed] [Google Scholar]
- 43. Montojo J, Zuberi K, Rodriguez H, et al. GeneMANIA: Fast gene network construction and function prediction for Cytoscape. F1000Res 2014;3:153. [DOI] [PMC free article] [PubMed] [Google Scholar]
- 44. Calderone A, Castagnoli L, Cesareni G. mentha: a resource for browsing integrated protein-interaction networks. Nat Methods 2013;10:690–1. [DOI] [PubMed] [Google Scholar]
- 45. Robin X, Turck N, Hainard A, et al. pROC: an open-source package for R and S+ to analyze and compare ROC curves. BMC Bioinformatics 2011;12:77. [DOI] [PMC free article] [PubMed] [Google Scholar]
- 46. Saito T, Rehmsmeier M. Precrec: fast and accurate precision-recall and ROC curve calculations in R. Bioinformatics 2017;33:145–7. [DOI] [PMC free article] [PubMed] [Google Scholar]
- 47. McMurdie PJ, Holmes S. Phyloseq: A Bioconductor Package for Handling and Analysis of High-Throughput Phylogenetic Sequence Data. Pac Symp Biocomput 2012;2012(17):235–46. [PMC free article] [PubMed] [Google Scholar]
- 48. Ma X, Liu Y, Liu Y, et al. Pan-cancer genome and transcriptome analyses of 1,699 paediatric leukaemias and solid tumours. Nature 2018;555:371–6. [DOI] [PMC free article] [PubMed] [Google Scholar]
- 49. Lawrence MS, Stojanov P, Mermel CH, et al. Discovery and saturation analysis of cancer genes across 21 tumour types. Nature 2014;505:495–501. [DOI] [PMC free article] [PubMed] [Google Scholar]
- 50. Jia P, Zhao Z. VarWalker: personalized mutation network analysis of putative cancer genes from next-generation sequencing data. PLoS Comput Biol 2014;10:e1003460. [DOI] [PMC free article] [PubMed] [Google Scholar]
- 51. Li J, Shi L, Zhang K, et al. VarCards: an integrated genetic and clinical database for coding variants in the human genome. Nucleic Acids Res 2017;46:D1039–48. [DOI] [PMC free article] [PubMed] [Google Scholar]
- 52. Amberger JS, Hamosh A. Searching Online Mendelian Inheritance in Man (OMIM): A Knowledgebase of Human Genes and Genetic Phenotypes. Curr Protoc Bioinformatics 2017;58:1.2.1–1.2.12. [DOI] [PMC free article] [PubMed] [Google Scholar]
- 53. Liao YX, Wang J, Jaehnig EJ, et al. WebGestalt 2019: gene set analysis toolkit with revamped UIs and APIs. Nucleic Acids Res 2019;47:W199–205. [DOI] [PMC free article] [PubMed] [Google Scholar]
- 54. Sack LM, Davoli T, Li MZ, et al. Profound Tissue Specificity in Proliferation Control Underlies Cancer Drivers and Aneuploidy Patterns. Cell 2018;173:499–514.e423. [DOI] [PMC free article] [PubMed] [Google Scholar]
Associated Data
This section collects any data citations, data availability statements, or supplementary materials included in this article.
Supplementary Materials
Data Availability Statement
All data relevant to the study are included in the article or uploaded as supplementary information.