

Abstract
Extreme learning machine (ELM) is a powerful classification method and is very competitive among existing classification methods. It is speedy at training. Nevertheless, it cannot perform face verification tasks properly because face verification tasks require the comparison of facial images of two individuals simultaneously and decide whether the two faces identify the same person. The ELM structure was not designed to feed two input data streams simultaneously. Thus, in 2-input scenarios, ELM methods are typically applied using concatenated inputs. However, this setup consumes two times more computational resources, and it is not optimized for recognition tasks where learning a separable distance metric is critical. For these reasons, we propose and develop a Siamese extreme learning machine (SELM). SELM was designed to be fed with two data streams in parallel simultaneously. It utilizes a dual-stream Siamese condition in the extra Siamese layer to transform the data before passing it to the hidden layer. Moreover, we propose a Gender-Ethnicity-dependent triplet feature exclusively trained on various specific demographic groups. This feature enables learning and extracting useful facial features of each group. Experiments were conducted to evaluate and compare the performances of SELM, ELM, and deep convolutional neural network (DCNN). The experimental results showed that the proposed feature could perform correct classification at accuracy and area under the curve (AUC). They also showed that using SELM in conjunction with the proposed feature provided accuracy and AUC. SELM outperformed the robust performances over the well-known DCNN and ELM methods.
Keywords: Siamese network, Extreme learning machine, Face recognition, Feature embedding
Introduction
In the period of the COVID-19 pandemic, a New Normal was introduced. People all around the world had to change their daily habits. They had to be constantly aware of their surroundings and had to keep everything around them clean of the virus all the time. The traveling history of every suspected COVID vector in an area had to be retraced when an infected person was detected in the area during that time, e.g., everyone arriving or leaving a building or community at the same time. Accurate personal identification is of utmost importance to retrace traveling history. At this time of writing, some communities required visitors to identify themselves correctly before they were permitted access into the communities. There are several ways to identify an individual, such as from their ID card, passport, fingerprint, iris, or DNA [14, 28], but one of the most convenient ways in many setups (like the discussed moving travelers due to COVID-19) is facial identification. At this time, numerous monitoring cameras have already been installed almost everywhere, such as in department stores, airports, border crossing facilities, cities, and transportation stations, as a security and surveillance measure. An accurate and reliable face identification algorithm is required to identify individuals by their facial features [23, 45]. Identification from facial features is a type of one-to-many mapping process, i.e., an unknown face is identified between multiple faces already registered in a database. The identification is assisted by taking into account demographic information—identity, age, gender, and ethnicity [19, 21, 54, 56]. On the other hand, a face verification task is a one-to-one mapping process. The task verifies whether the individual with the recognized face is the same person registered in a system [52]. This task is often used for authorizing a system, for example, for authorizing access to a mobile device or a laptop [43]. The advantage of this method over others like fingerprint recognition [2] is that it does not require anyone touching anything [17].
Face recognition techniques have been developed for decades [18], e.g., geometric-based approaches [49], local feature analysis [4], dictionary-based learning [8, 42], hand-crafted features [3, 29] and, recently, deep convolutional neural network (DCNN) [64]. Recently, many large-scale face datasets containing millions of images have been available [7, 30, 36] for training deep learning models. Nevertheless, the class distributions of some variates in those datasets were rather imbalanced, causing statistical bias [54]. This issue was associated with an imbalanced representation of classes in a dataset. An effect of the bias was reported in [44]. They reported that algorithms invented by Asian researchers could distinguish Asian subjects better than Caucasian subjects. Conversely, algorithms from the West performed better on Caucasian subjects. Along the same line, a study by [6] reported that a commercial face recognition system yielded better outcomes on male individuals and lighter individuals but worse outcomes on darker females. Therefore, bias in class proportion and demographic variates would strongly affect a biometric system performance [48]. This concern could be alleviated by utilizing datasets evenly distributed across demographics [31, 47]. Training a model on a specific group could reduce data diversity and allows the model to learn better characteristics of each class. Interestingly, the performance of a model that was intensely trained on a very specific group, like male and female or every different ethnic in an area, might be superior to the performance of a conventionally trained model [1].
Face representation is an essential part of the face verification task. Historically, different representation techniques have been used to extract facial information from face images. In the past, hand-crafted techniques were employed to transform face images into useful features. For example, geometry-based features utilized face shape and its landmarks to represent the appearance of the face and its components. At the time of writing, the most competitive face representations are obtained using DCNN optimized according to different loss functions [12, 34, 61]. Among the different loss functions, triplet loss (a triplet network) is a distance-metric approach designed as a type of Siamese network [25]. This triplet network has a hierarchy that starts learning from low-level features to high-level features, i.e., from pixels to classes. It could be fed with two inputs in parallel. A pair of faces can be fed into a triplet network to output a similarity/distance coefficient between the two input face images. The value of this coefficient is then usually compared against a threshold. An identity match is positive when it exceeds the threshold. Else, it was a mismatch. Fortunately, several machine learning algorithms could be employed to enhance the performance of the face verification task. They could learn the data pattern and distinguish them into classes instead of measuring the similarity/distance coefficient between two faces. Nevertheless, most of them could not deal with this task without some modification because their architecture was designed to be fed with one input at a time. Fortunately, this can be solved by linking two inputs into a concatenated input. However, certain unavoidable biases would be introduced, e.g., the exact order of concatenation of the two inputs might introduce a bias—a different order yields a different output. In this work, we restructured a well-known classification algorithm, extreme learning machine (ELM) [27], to accept twin inputs simultaneously and eliminate this kind of bias. The restructured algorithm was based on a single hidden layer feedforward neural network (SLFN).
The following are the main contributions of the present paper:
We propose a novel classification method for verification tasks called Siamese extreme learning machine (SELM). The proposed method adapts conventional ELM architecture to process parallel inputs in an efficient way.
We develop a demographic-dependent triplet model that improves the performance in face verification.
The proposed framework is demonstrated to distinguish gender, ethnicity, and face accurately.
We perform a performance comparison in face biometrics between biased and unbiased triplet models under different setups: subject-independent, gender-dependent, and gender-ethnicity-dependent.
We carry out a performance comparison between Siamese and non-Siamese algorithms.
Related works
Some of the key challenges in face recognition are the following: (1) inadequate quality of facial images deteriorates the performance of face detection and verification [23]; and (2) biases between cohorts of people, especially with respect to privileged ones, deteriorates the performance of face recognition in general and introduces undesired discrimination between population groups [46, 51]. There are many powerful and well-known techniques for face recognition [45]. In this section, we will first discuss the strengths and weaknesses of key techniques for face recognition with emphasis on the two challenges indicated above. Then, we will position our proposed machine learning methods in context.
Demographic variates in face recognition
Gender and race are two important demographic variates representing subject-specific characteristics of the human face. Other variates have also been proven useful for face recognition. For example, skin tone can help improve face recognition performance. Back to demographic variates, Cook et al. [9] examined the effects of demographic variates on face recognition through leading commercial face biometric systems. They investigated the effects with a dataset of 363 subjects in a controlled environment and found that many demographic covariates significantly affected the face recognition performance, including gender, age, eyewear, height, and especially skin reflectance. Lower skin reflectance (darker skin tone) was associated with lower efficiency (longer transaction time) and accuracy, in terms of mated similarity score. The study also revealed that skin reflectance was a significantly better predictor than self-identified race variates. Buolamwini and Gebru [6] reported a significant bias in well-known commercial gender classification systems, i.e., Microsoft [11], IBM [24], and Face++. They found that darker-skinned females were the most misclassified group with an error rate of , while the misclassified rate of lighter-skinned males was only . The largest difference in error rate between the best and the worst classified groups was . They concluded that these three classification systems yielded the best accuracy for lighter-skinned individuals and males but the worst accuracy for darker-skin females due to the mentioned bias. Several studies have reported that Caucasian and male individuals are easier to distinguish by face recognition algorithm [6, 9, 31]. Recently, Lu et al. [36] have investigated the effects of demographic groups on face recognition and found that the difficulty of unconstrained face verification varies significantly with different demographic variates. Males are easier to verify than females, and old subjects are recognized better than young individuals. On the other hand, light-pink skin tone is recognized with the best performance. Moreover, gender and skin tone variates are not significantly correlated.
On the other hand, some works have exploited the inherent differences between population groups for stronger and more fair recognition. Phillips et al. [44] and O’Toole et al. [40] showed the importance of demographic composition and modeling. They reported that recognition of face identities from a homogeneous population (same-race distribution) was easier than recognition from a heterogeneous population. Liu et al. [37] showed that the recognition performance using a training set that contained facial images of Caucasians and East Asians at a ratio of 3:1 was better at identifying East Asians in every case. Klare et al. [31] and Vera-Rodriguez et al. [57] improved face-matching accuracy by training exclusively on specific demographic cohorts of which demographic variates were evenly distributed. This solution could reduce face bias and increase accuracy across all demographic cohorts. Vera-Rodriguez et al. [57] proposed a gender-dependent training approach to improve face verification performance that reduced the effect of gender as a recognition covariate. The approach improved AUC performance from 94.0 to 95.2. Vera-Rodriguez et al. [57] and Serna et al. [46, 47] applied deep learning methods to train face recognition models and benchmarked the models over multiple privileged classes. Conventional methods (not exploiting data diversity) resulted in poor performance when demographic diversity was large. Their experimental results showed a big performance gap between the best class (Male-White) and the worst class (Female-Black) that reached up to . The above studies also demonstrated that training the models on specific demographic cohorts can be a possible solution to those large performance differences between cohorts. For example, useful features for distinguishing black individuals may differ from those for white individuals. Thus, training a model with specific groups of individuals may direct the model to learn the special characteristics of the groups better.
Many well-known large-scale face recognition datasets have been published, such as MS-Celeb-1M [36], Megaface [30], and VGGFace2 [7]. These datasets contain more than a million face images, but most of them are highly-biased datasets, composed mainly of Caucasian people (), while come from a Male-Caucasian cohort. Recently, Wang et al. [58, 59] have introduced diverse and discrimination-aware face databases with even-distributed populations: Asian, Black, Caucasian, and Indian. However, they did not balance the gender distribution. Along the same line, Morales et al. [39] introduced the DiveFace database with equal distribution for six demographic groups: Female-Asian, Male-Asian, Female-Black, Male-Black, Female-Caucasian, and Male-Caucasian. The dataset was designed to be unbiased in terms of Gender and Ethnicity, which is useful both for training fair recognizers and evaluating them in terms of fairness across population groups.
Machine learning architectures for face recognition
Machine learning classification techniques have been popular for face recognition tasks. Successful algorithms are, for example, random forests [35], support vector machines (SVM) [10], ELM [22], and DCNN [62], the last one now dominating the field. Goswami et al. [20] summarized the performances of features extracted by deep and shallow feature extractor approaches. The experimental results clearly showed the superiority of deep features. Other works such as Liu et al. [35], Bianco [5] and Wong et al. [63] have also shown the robustness and improved recognition of face biometrics based on features extracted from DCNNs. However, the typical classification architecture in those works was designed to be fed with one input image at a time. To compare two input faces (e.g., for authentication), there is a need to extend the basic DCNN architecture to process two inputs.
One popular approach to exploit a DCNN backbone for comparing two inputs is the Siamese architecture. The concept is to train a feature representation by comparing pairs of facial images. The conceptual diagram is shown in Fig. 1. In this work, we will adopt this architecture in combination with an ELM (cf. Sect. 3.1 for an introduction to this type of network.) ELMs have been shown to be quite successful in various tasks related to face biometrics, but so far, Siamese architectures have not been explored yet for enhancing basic ELM methods.
Fig. 1.

The Siamese network concept was designed to deal with particular classification problems, such as validation tasks. The architecture consists of three components, i.e., input image, feature extractor, and classifier method
As examples of ELMs for face biometrics, Laiadi et al. [33] predicted kinship relationships by comparing facial appearances. They used three different types of features: deep features using VGG-Face model, BSIF-Tensor, and LPQ-Tensor features using MSIDA. These three features of the two considered face images were measured by cosine similarity. Then the measured data were concatenated as a vector for computing a kinship score by ELM. The proposed approach was up to more accurate than a baseline ResNet-based method. Wong et al. [63] adopted ELM to tackle face verification. They added a top layer of DeepID [53] with ELM as the classification layer instead of a soft-max layer. This approach improved the accuracy by and , respectively, for a conventional DeepID and ELM.
In this paper, we develop and explore a novel Siamese classification algorithm for face verification with an ELM backbone. This concept was motivated to improve the architecture of machine learning methods to deal with verification tasks. In particular, the proposed method aims to reduce the gap between the performance of pre-trained deep feature extractors for different demographic groups. The proposed algorithm utilized trained feature representations from DCNN together with an improved version of ELM, which was redesigned as Siamese architecture, as a classifier. It compares pairs of facial images based on demographic attributes. The traits are used as factors for selecting feature extraction models and guide the learning process. The main aim of this work is to boost the performance of the algorithm by decreasing the verification errors on all the demographic groups. A secondary aim of this work is to investigate the dependency of the performance on demographic variates.
Methods
Extreme learning machine
ELMs were first introduced by Huang et al. [27]. They are based on an SLFN architecture of which the weights are obtained by the closed-form solution of an inverse problem, instead of the typical iterative back-propagation optimization. It has been demonstrated that this closed-form solution in ELMs yields a small classification error and extremely fast learning. Assuming that is an input sample, . The ELM architecture consists of m input neurons ( input dimensions). The input neurons are fully connected with l hidden neurons each one with weighted inputs according to , with , . The weights between the hidden layer and the output layer are defined as hidden layer output weights that are used to determine the prediction outputs . The model is expressed mathematically as (scalars in italics, column vectors in bold lowercase, matrices in bold uppercase, denotes transpose):
| 1 |
where b is a bias and n is the number of input samples.
The hidden layer output matrix is processed by an activation function with a linear combination of input and synaptic weights as well as bias b, where , input matrix , , a set of weights , . It should be noted that the set of and b are randomly generated once to speed up the training process. Therefore, the activity of the hidden node can be written as:
| 2 |
The prediction score is then expressed by:
| 3 |
ELM minimizes the mean square error between true target labels and predicted targets by using the following objective function:
| 4 |
The optimal solution of the hidden layer output weights is finally calculated by the Moore–Penrose pseudo-inverse:
| 5 |
Weighted similarity extreme learning machine (WELM)
The WELM architecture is shown in Fig. 2, where the conventional activation function , e.g., sigmoid or radial basis function, is replaced with a similarity-based activation function , e.g., cosine similarity or Euclidean distance. WELM can reduce training time because it does not need any tuning of the kernel parameters. It yields better performance, especially when dealing with similarity-based tasks [32, 41]. In WELM, the matrix in conventional activation is replaced by:
| 6 |
The set of weights are randomly selected from a training set , thus, .
Fig. 2.

The WELM architecture is an improved version of ELM which replaced conventional activation function with similarity-based function in order to measure similarity coefficient between input and weights to express hidden layer output weights
Siamese extreme learning machine (SELM)
This paper proposes a novel SELM architecture to handle verification tasks that require simultaneous comparison of two identities. SELM is developed on a WELM network backbone. Input vectors and from identity A and B, respectively, are fed into WELM after a Siamese input layer, turning the conventional WELM architecture into a SELM architecture capable of feeding two inputs simultaneously and in parallel into the network, as shown in Fig. 3.
Fig. 3.

The SELM architecture was designed to deal with validation tasks. The extra Siamese Layer is added between input and hidden layer in order to calculate new input by Siamese condition function between input from identity A and B
A Siamese condition function in the Siamese layer is the core of SELM. The function combines two input vectors using one of the following equations:
- Summation condition function:
7 - Distance condition function:
8 - Multiply (Hadamard product) condition function:
9 - Mean condition function:
10
Note that this Siamese layer can be also interpreted as an initial feature-level information fusion stage [15].
The pseudocodes of the training and prediction processes of SELM are shown in Algorithm 1. The train process consists of input matrix for training and class labels . Training samples then are paired and calculated Siamese condition to be in Siamese Layer. The weight samples are a subset of and are randomly selected with a normal distribution function from . The hidden layer measures the similarity between and and is utilized to calculate the hidden layer output weights in the next step. It should be noted that the SELM algorithm can converge with a small number of training data and less time consumption. Due to the use of the Moore–Penrose pseudo-inverse function in the hidden layer output , the solution is guaranteed to be the global minimum in a single step. However, SELM requires a large memory to train a model as it cannot feed data as a small batch, which differs from random forest or DCNN techniques.
The computational complexity of SELM consists of two main parts: (i) the calculation of Siamese condition is and (ii) the calculation of ELM algorithm, i.e., the calculation of the hidden layer output matrix having computational complexity equal to , the hidden layer output weights from (5) having computational complexity equal to . Therefore, the overall complexity of the algorithm is . When is large, the computational complexity of the overall algorithm is .

Triplet convolutional neural networks
The triplet network model was proposed for learning useful representations by distance comparisons [25] between three samples: anchor sample , positive sample , and negative sample . The triplet network structure is shown in Fig. 4. As can be seen, the network employs DCNNs as the backbone to optimize the model’s weights with back-propagation. These core networks are identical and share the same weights. The triplet network aims to minimize the distance between the anchor and the positive sample and to maximize the distance between the anchor and the negative sample. The positive sample and the anchor sample come from the same identity, while the negative sample comes from different identities. The Euclidean distance of and is expressed as,
| 11 |
| 12 |
The triplet loss is then calculated as a loss function of the network as follows:
| 13 |
where the parameter is a soft margin. The objective of the learning function is to satisfy . In this study, we trained a number of triplet networks with several demographic groups so that they could learn population-specific facial information.
Fig. 4.
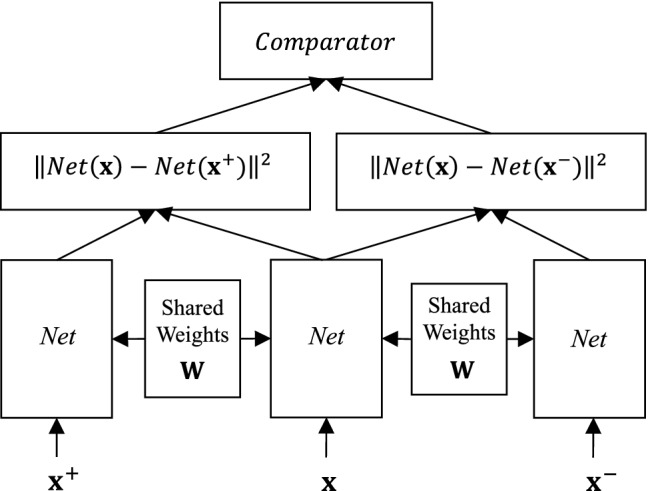
Triplet network structure is comprised of input vector from anchor , positive , and negative samples, feature extractor Net (it can be a DCNN), and comparator that is used to classify the identity
Proposed framework
The proposed framework is shown in Fig. 5. It consists of five stages. The framework was designed to verify the identity of two input facial images. The input images are first classified into gender and ethnicity to select gender- and ethnicity-dependent triplet models for each input. The details of each stage are explained below.
First stage (Input) input color facial images were first cropped and aligned properly [13] before being fed into the next stage. It should be noted that the two images passed in parallel through every process in the framework simultaneously. Black or white arrows show the input direction for Images A and B, respectively.
Second stage (Feature Extraction) ResNet-50 is a 50-layer-deep CNN with skip connections. It is one of the most robust methods for face recognition among existing deep architectures, such as VGG-16, Inception-3 and DenseNet-121 [46, 57, 60]. ResNet-50 was used as the feature extraction model. It was trained with a large-scale face dataset, VGGFace2 [7]. ResNet-50 required a color image size of pixels as input. The length of the output was 2, 048 features.
Third stage (Gender-Ethnicity Prediction) This stage consists of two classification tasks that are gender and ethnicity classification.
Fourth stage (Gender-Ethnicity-Dependent Triplet Model) the extracted facial features from the second stage are used by one of six models to extract the triplets. Each triplet model was specially trained only with data in its Gender-Ethnicity-dependent class because, for example, a Female-Black person may have distinctive features different from those in the other classes. Thus, letting the model learn only in a specific class would make it better in recognizing the distinctive characteristics of the data in that class. In this work, we used the DiveFace dataset for training the triplet models because it is a discrimination-aware face dataset that provides the same distribution from the six different demographic groups considered here. Details of DiveFace are described in Sect. 5.1.1.
Fifth stage (Identity Verification) there are two steps in this verification task. First, the pair of images A and B is classified as an impostor match if both images result in different Gender-Ethnicity classes in the third stage. Second, machine learning models are applied to verify if both images come from the same identity. In this work, we compare the proposed approach SELM to the performance of standard ELM and ResNet (which is now one of the most common DCNNs used for face recognition [33]). Incidentally, ResNet is also a core component of our proposed approach for training the triplet models.
Fig. 5.

The workflow of the proposed framework
Experimental protocol
Dataset
In this study, we used two datasets: DiveFace and Labeled Faces in the Wild. DiveFace is a diversity-aware face recognition dataset for training models such as Gender classification, Ethnicity classification, and Gender-Ethnicity-dependent triplet models. Labeled Faces in the Wild dataset is a well-known large-scale face dataset in the face recognition domain for performance evaluation.
DiveFace: a diversity-aware face recognition dataset
DiveFace was constructed to be an unbiased face recognition dataset. Each image was carefully selected from Megaface MF2 training dataset [30] that contained 4.7 million faces from 672K identities from Flickr Yahoo’s dataset [55]. There are 24,000 identities from six demographic groups, 4000 identities for each group, and three poses for each identity. Thus, each demographic group contained 12,000 faces for a total of 72,000 faces in the whole dataset. (see Table 1). The identities in the DiveFace database are equally distributed among six classes ( for each class) related to gender (Female-Male) and ethnicity. Three ethnicity categories are available, related to the physical characteristics of each ethnic group:
Group 1 people with ancestral origin in Japan, China, Korea, and other countries in that region.
Group 2 people with ancestral origins in Sub-Saharan Africa, India, Bangladesh, Bhutan, and others.
Group 3 people with ancestral origins in Europe, North-America, and Latin-America with European origin.
In this study, we denoted Groups 1, 2, and 3 as Asian, Black, and Caucasian, respectively. A t-distributed stochastic neighbor embedding (t-SNE) [38] of dimension 2 from ResNet-50 descriptors of the full DiveFace dataset is shown in Fig. 6. As can be seen, the six clusters separated from each other clearly. However, a few data points in the Male-Black category are also in the clusters of Male-Asian and Male-Caucasian.
Table 1.
Proportions of face images from different ethnics and genders in DiveFace dataset
| Ethnicity | Gender | Total | |
|---|---|---|---|
| Female | Male | ||
| Asian | 12,000 | 12,000 | 24,000 |
| Black | 12,000 | 12,000 | 24,000 |
| Caucasian | 12,000 | 12,000 | 24,000 |
| Total | 36,000 | 36,000 | 72,000 |
Fig. 6.

Data distribution of the DiveFace dataset generated by t-SNE
Labeled faces in the wild
Labeled Faces in the Wild (LFW) database was introduced to evaluate the performance of face verification algorithms with unconstrained parameters, such as position, pose, lighting, background, camera quality, and gender [26]. The database contains 13,233 faces collected from the web from 5,749 unique individuals.
LFW was published in 2007. It has been a very popular database in the face recognition field. LFW has already been appropriately split into standard training and test sets. In this work, we used the test set to evaluate our framework’s performance. It contains a balanced set of 1000 sample pairs (500 pairs of genuine facial images and 500 pairs of imposter images).
Experimental settings
This study divided the DiveFace dataset into training, validation, and test sets. The training set size was 60% of the whole dataset; the size of the validation set was 10%, and the size of the test set was 30%. The training set was used to train gender and ethnicity classifier models and the triplet models; the validation set was used to select optimal models; and the test set was used to evaluate the prediction performances of all tested models. On the other hand, the performance of our entire framework was evaluated with the LFW database. The average and standard deviation of the metrics of ten experimental runs, each with a different random split, are reported. For the image pairing, the set of positive samples was constructed by pairing all pose images in all possible ways within each identity. On the other hand, the set of negative samples was constructed by randomly pairing different identities.
The performance of the proposed SELM is evaluated in comparison with ResNet and ELM. ResNet is one of the most well-known DCNNs methods. We used a ResNet-50 architecture pre-trained for face recognition with VGGFace2 (millions of images) as a comparison baseline. The pre-trained ResNet-50 was then used to train our triplet models. These triplet models classify input image pairs into two classes (genuine or impostor match) based on Euclidean distance. The ELM and SELM methods have a similar architecture. The architecture is based on an SLFN that can be trained much faster than common artificial neural networks. On the other hand, SELM has one additional layer (the Siamese layer). Both ELM and SELM use a kernel trick together with a pseudoinverse technique to generate the weights of the model that provide the lowest error rate. Moreover, we evaluate the performance when using four different Siamese conditions to improve the classification outcome.
As for parameter settings, the parameters of the three methods are tuned to obtain the best result. False acceptance rate (FAR) and false rejection rate (FRR) were used to find an optimal threshold, which is considered to be at the Error Equal Rate (EER). For ELM, three parameters were tuned: regularizing C which was set to be , percentage of hidden nodes which was in the range of , and gamma in RBF kernel which was . For SELM, two parameters were tuned: regularizing C and percentage of hidden nodes. As for ResNet, we used the same Euclidean coefficients for calculating the loss function as the Euclidean coefficients that we used in the kernel trick in SELM. Hence, for the kernel trick, no parameters needed to be tuned.
Results and discussion
In this section, we report the experimental results on the following types of evaluation: evaluation of feature performance, evaluation of classifiers, evaluation of Siamese and non-Siamese architectures, and evaluation of the performance of the whole framework. Two evaluation metrics are employed: verification accuracy and area under the curve (AUC). The average and standard deviation of ten runs are reported for each experiment.
Evaluation of feature performance
The performances of all features used in the experiment are presented in this section. ResNet-50 was used to train three different feature-extraction models, which were trained differently as follows.
Subject-Independent (SI) feature model this model was trained by randomly pairing (no pattern) individuals as training samples, e.g., no pre-assigned values for proportions of gender and ethnicity classes. This kind of model training is conventional in face recognition.
Gender-Dependent (GD) feature model this model was trained independently for Males and Females.
Gender-Ethnicity-dependent (GED) feature model this model focused on the facial characteristics of each cohort; thus, the model was trained independently on each of the six considered cohorts. The number of training samples from every cohort was assigned to be the same.
The experimental results on the DiveFace dataset are shown in Table 2a and b. The best features among all types of features in every cohort are marked in bold.
Table 2.
Performance metrics (standard deviation as subscript) achieved by ResNet of each feature type on the DiveFace dataset
| FA | FB | FC | MA | MB | MC | Average | |
|---|---|---|---|---|---|---|---|
| (a) Accuracy | |||||||
| SI | |||||||
| GD | |||||||
| GED | |||||||
| (b) AUC | |||||||
| SI | |||||||
| GD | |||||||
| GED | |||||||
FA = Female-Asian, FB = Female-Black, FC = Female Caucasian, MA = Male-Asian, MB = Male-Black, and MC = Male Caucasian
As can be seen in Table 2, the values of accuracy and AUC reflect each other, the higher the accuracy, the higher the AUC, and vice versa. The feature performance of SI, the baseline, was the worst, but it still reached up to 93.65% and 97.87% in overall accuracy and AUC, respectively. Therefore, it was a challenge to improve on those metrics. Nevertheless, GED and GD yielded a better AUC performance: 99.45% and 99.04% AUC value, respectively. GED results to be the best among the tested methods, followed by GD. Furthermore, GED exhibits better metrics for every cohort compared to SI and GD. This result confirms our hypothesis that training samples with specific, distinctive groups could induce the model to learn more useful facial features. The reason that the performance of GD was higher than SI and that the performance of GED was higher than GD is that GD learned intensively and independently on gender group, and GED learned in the same way as GD but on both gender and ethnicity groups.
Nevertheless, GED performance was only better than that of GD. To check if that difference was significant or not, we used one-way ANOVA to test the null hypothesis (SI, GD, and GED have the same population mean, ) [50]. The statistical result, , indicates that the difference is statistically significant at a level of , hence the null hypothesis was rejected. GED is the best feature type among the three models tested in this work.
Evaluation of classifier performance
The performances of ResNet, ELM, and SELM embedded with four different types of Siamese conditions—summation, distance, multiply, and mean denoted as Sum, Dist, Mult, and Mean, respectively—are shown in Table 3a and b. We used the best feature, GED, obtained from the previous experiment, Sect. 6.1. Table 3 lists the performance metrics—accuracy and AUC—achieved by the proposed SELM in comparison with standard ELM and the ResNet baseline. The best metric achieved by the best classifier candidate for each identity cohort is marked in bold.
Table 3.
Performance metrics (standard deviation as subscript) on the DiveFace dataset achieved by the proposed SELM in comparison with standard ELM and the ResNet baseline using the most robust feature (GED)
| FA | FB | FC | MA | MB | MC | Average | |
|---|---|---|---|---|---|---|---|
| (a) Accuracy | |||||||
| ResNet | |||||||
| ELM | |||||||
| SELMSum | |||||||
| SELMDist | |||||||
| SELMMult | |||||||
| SELMMean | |||||||
| (b) AUC | |||||||
| ResNet | |||||||
| ELM | |||||||
| SELMSum | |||||||
| SELMDist | |||||||
| SELMMult | |||||||
| SELMMean | |||||||
FA = Female-Asian, FB = Female-Black, FC = Female Caucasian, MA = Male-Asian, MB = Male-Black, and MC = Male Caucasian
The experimental results in Table 3a show that SELMMean is the best classification method in terms of overall accuracy score, followed by SELMSum, SELMMult, SELMDist, ResNet, and ELM. SELMMean yields the highest accuracy for four out of the six demographic groups; SELMSum yields the highest accuracy for two out of the six demographic groups; and SELMMult yields the highest accuracy for one group. Nevertheless, the accuracy score achieved by the first and second best methods, SELMMean and SELMSum, differs only by . Furthermore, SELMSum achieves the highest AUC metric (99.72) for only one out of six groups, but SELMMean, (99.72) achieves the highest AUC for four out of the six groups. SELMDist, ELM, SELMMult and ResNet follow those two in this order. Figure 7 shows a comparison between the number of wins of SELMSum and SELMMean, in terms of both accuracy and AUC evaluation metrics. Since the graphs were data from ten experimental runs of six demographic cohorts, the ideal score should be . Figure 7 shows clearly that SELMSum is definitely better than SELMMean for 51 out of 60 cases in terms of accuracy and 45 out of 60 cases in terms of AUC. It can be seen that the performance of SELMSum and SELMMean were very competitive and almost identical results. This is because the Siamese condition of Sum and Mean are basically the same function. However, the Mean condition, which has a smaller scale, needs to divide by two to find the average values. Thus, it may lose some useful information, in a small digit, while optimizing the model. On the other hand, SELMSum does not have the constrain to limit its scale to retrieve better results.
Fig. 7.

Comparison of number of wins (number on top of the bars) accomplished by SELMSum and SELMMean in terms of accuracy and AUC evaluation metrics
In addition, we show the accumulated AUC score ranks across the ten experimental runs as a way to rank the methods in Fig. 8. The ideal summation would be first rank in all 60 experimental runs, i.e., 60 is the lowest summation possible (best method). At the other extreme, sixth, 360 would be the highest accumulated rank possible (worst method). We then used Kendall’s coefficient of concordance , a statistical technique, to calculate the degree of reliability of the ranked order:
| 14 |
where is the average ranked order assigned to the i-th candidate; N is the number of candidate methods (six); and the number of runs times the number of cohort groups k is 60. The value of was found to be 0.7526. The critical value in distribution was converted from by the following equation:
| 15 |
We acquired which indicates that the ranked order shown in Fig. 8 is reliable at a confidence level of 99.9%. The rank order is as follows:
Fig. 8.

Summation of ranked order in terms of AUC performance, reported as stacked bars in descending order of ten experiments
Evaluation of Siamese and non-Siamese architectures performance
In this section, we compare the performance of the most robust Siamese architecture (SELMSum) to that of WELM, an ELM with non-Siamese architecture. Their backbone architecture was identical except for the additional Siamese layer in SELM. Simultaneous dual inputs into WELM were concatenated for training the network, but these inputs were not concatenated by SELM; instead, they were passed through the Siamese layer. Any subsequent procedural steps of the two architectures are the same.
Figure 9 shows the accuracy and AUC performances of WELM and SELM while using an increasing number of hidden nodes to train a model (Fig. 9a and b, respectively). The performance values are obtained averaging across the six available demographic cohorts. It can be seen that WELM has to use a large number of hidden nodes up to of the training samples in order to compete with SELM, while SELM needs only less than in order to achieve excellent results. The optimal model of WELM achieves accuracy when the number of its hidden nodes is , while SELM achieves accuracy with a number of hidden nodes of only . It should also be noted that SELM achieved accuracy and AUC with a number of hidden nodes of only . We used two-sample t-test analysis to check the statistical significance between the mean scores from both methods at and found that the t-values for accuracy and AUC are and , respectively. Hence, we conclude that the proposed Siamese-ELM performs significantly better than the standard non-Siamese-ELM.
Fig. 9.

The performances of Siamese (SELM) VS non-Siamese extreme learning machines (WELM)
Evaluation of the whole system performance
We evaluated the proposed system, described in Sect. 4, in conjunction with the most robust feature, GED, described in Sect. 6.1, and the most robust classification method, SELMSum, described in Sect. 6.2. The whole system is termed . It should be noted that the proposed system first classifies individuals according to their respective Gender-Ethnicity class so that a proper feature-extraction model could be selected for that purpose, and the input image pairs that are not in the same Gender-Ethnicity class are classified as impostor comparisons. is similar to but without the initial Gender-Ethnicity classification. In Fig. 10, we show the performances of ResNet (baseline), , and tested on the standard test set of the LFW database.
Fig. 10.

System’s face verification accuracy and ranked order for each demographic group of the LFW database
The ranked order of each demographic is shown on the top of the bar representing that group in Fig. 10. It can be seen that is the best method producing the smallest sum of ranked order (9.5), followed by ResNet (10.5), and (16). The performances of both and for the Black demographic class are lower than the performance obtained for Asian and Caucasian classes. This is because the systems were trained on DiveFace, which contains data of individuals in the Black group whose origin is in the Sub-Saharan region, Africa, India, Bangladesh, and Bhutan, while the tested LFW dataset contains data of individuals of the Black group not well represented by those regions. Regarding the performance of , it works like a two-stage prediction system, and the accuracy of the final prediction in the second stage depends highly on the performance of the first stage, the Gender-Ethnicity prediction model. In this study, yielded very accurate outcomes when the first stage provided an ideal classification of Gender-Ethnicity group. Figure 11 shows bar graphs of two evaluation metrics—false acceptance rate (FAR) and false rejection rate (FRR)—produced by ResNet, , and . FAR was considered the most important metric for this kind of task. It represented the rate of which wrong persons were given access to the system. The performance results show that both and provided a very low FAR (), 12 times lower than that provided by ResNet (), indicating that they would execute with far less error in face recognition tasks.
Fig. 11.

False acceptance rate and false rejection rate of the proposed SELM systems for the LFW database
Conclusion
A framework for face verification is proposed. The framework employs a new classification method called Siamese extreme learning machine (SELM), an improved version of a powerful classification method called extreme learning machine that can accept two image inputs in parallel and process them concurrently. It utilized trained feature representation techniques together with Siamese architecture to accomplish the framework. In our performance evaluation, SELM was studied in conjunction with several features that were trained on unbiased demographic-dependent groups. With this training, the feature-extraction model in our proposed SELM was able to better recognize distinct features of individuals in demographic groups than a conventional feature-extraction model was able to. In an evaluation experiment, four different types of Siamese conditions embedded in the Siamese layer were compared. The SELM with summation and mean conditions provided the highest overall performance score. Furthermore, in another experiment, SELM with the ‘sum’ Siamese condition was demonstrated to be more robust than baseline methods ResNet and ELM. In particular, the proposed method was able to perform the verification task better, with accuracy and AUC, than the other methods. More importantly, provided a very low false acceptance rate, which was 12 times lower than that provided by ResNet (), a considerable improvement.
For future work, we aim to do the following: (i) train our own face recognition model from scratch to eliminate any bias from the beginning [54], (ii) explore other architectures for processing multiple inputs on top of ELM backbones beyond Siamese settings using recent advances from the information fusion field [16], and (iii) applying SELM to other types of image comparison tasks in addition to human face verification.
Funding Information
This work was supported by the Faculty of Information Technology, King Mongkut’s Institute of Technology Ladkrabang and projects BIBECA (RTI2018-101248-B-I00 MINECO/FEDER) and BBforTAI (PID2021-127641OB-I00 MICINN/FEDER).
Declarations
Conflict of interest
The authors declare that they have no competing interests.
Footnotes
Publisher's Note
Springer Nature remains neutral with regard to jurisdictional claims in published maps and institutional affiliations.
Contributor Information
Wasu Kudisthalert, Email: 60606001@kmitl.ac.th.
Kitsuchart Pasupa, Email: kitsuchart@it.kmitl.ac.th.
Aythami Morales, Email: aythami.morales@uam.es.
Julian Fierrez, Email: julian.fierrez@uam.es.
References
- 1.Acien A, Morales A, Vera-Rodriguez R, Bartolome I, Fierrez J (2018) Measuring the gender and ethnicity bias in deep models for face recognition. In: Proceedings of the Iberoamerican congress on pattern recognition, Lecture Notes in Computer Science, vol 11401, Springer, pp 584–593
- 2.Alonso-Fernandez F, Bigun J, Fierrez J, Fronthaler H, Kollreider K, Ortega-Garcia J (2009) Fingerprint Recognition, pp 51–88. Springer London, London
- 3.Antipov G, Berrani SA, Ruchaud N, Dugelay JL (2015) Learned vs. hand-crafted features for pedestrian gender recognition. In: Proceedings of the 23rd ACM international conference on multimedia, pp 1263–1266
- 4.Arca S, Campadelli P, Lanzarotti R (2003) A face recognition system based on local feature analysis. In: Proceedings of the international conference on audio and video-based biometric person authentication (AVBPA), Springer, pp 182–189
- 5.Bianco S. Large age-gap face verification by feature injection in deep networks. Pattern Recogn Lett. 2017;90:36–42. doi: 10.1016/j.patrec.2017.03.006. [DOI] [Google Scholar]
- 6.Buolamwini J, Gebru T (2018) Gender shades: Intersectional accuracy disparities in commercial gender classification. In: Conference on fairness, accountability and transparency, pp 77–91
- 7.Cao Q, Shen L, Xie W, Parkhi OM, Zisserman A (2018) VGGFace2: a dataset for recognising faces across pose and age. In: Proceedings of the 13th IEEE international conference on automatic face & gesture recognition (FG), IEEE, pp 67–74
- 8.Chen YC, Patel VM, Phillips PJ, Chellappa R (2012) Dictionary-based face recognition from video. In: Proceedings of the European conference on computer vision (ECCV), Springer, pp 766–779
- 9.Cook CM, Howard JJ, Sirotin YB, Tipton JL, Vemury AR. Demographic effects in facial recognition and their dependence on image acquisition: an evaluation of eleven commercial systems. IEEE Trans Biomet Behav Identity Sci. 2019;1(1):32–41. doi: 10.1109/TBIOM.2019.2897801. [DOI] [Google Scholar]
- 10.Dadi HS, Pillutla GM. Improved face recognition rate using hog features and svm classifier. J Electron Commun Eng. 2016;11(4):34–44. doi: 10.9790/2834-1104013444. [DOI] [Google Scholar]
- 11.Del Sole A (2018) Introducing microsoft cognitive services. In: Microsoft computer vision APIs distilled, pp 1–4. Springer
- 12.Deng J, Guo J, Niannan X, Zafeiriou S (2019) Arcface: additive angular margin loss for deep face recognition. In: Proceedings of the IEEE conference on computer vision and pattern recognition (CVPR) [DOI] [PubMed]
- 13.Deng J, Guo J, Ververas E, Kotsia I, Zafeiriou S (2020) Retinaface: single-shot multi-level face localisation in the wild. In: Proceedings of the IEEE/CVF conference on computer vision and pattern recognition (CVPR)
- 14.Fierrez J (2006) Adapted fusion schemes for multimodal biometric authentication. PhD Thesis, Universidad Politécnica de Madrid, Spain
- 15.Fierrez J, Morales A, Vera-Rodriguez R, Camacho D. Multiple classifiers in biometrics. part 1: fundamentals and review. Inform Fusion. 2018;44:57–64. doi: 10.1016/j.inffus.2017.12.003. [DOI] [Google Scholar]
- 16.Fierrez J, Morales A, Vera-Rodriguez R, Camacho D. Multiple classifiers in biometrics. part 2: trends and challenges. Inform Fusion. 2018;44:103–112. doi: 10.1016/j.inffus.2017.12.005. [DOI] [Google Scholar]
- 17.Fierrez J, Pozo A, Martinez-Diaz M, Galbally J, Morales A. Benchmarking touchscreen biometrics for mobile authentication. IEEE Trans Inf Forensics Secur. 2018;13(11):2720–2733. doi: 10.1109/TIFS.2018.2833042. [DOI] [Google Scholar]
- 18.Galbally J, Ferrara P, Haraksim R, Psyllos A, Beslay L (2019) Study on face identification technology for its implementation in the Schengen information system. Publications Office of the European Union
- 19.Gonzalez-Sosa E, Fierrez J, Vera-Rodriguez R, Alonso-Fernandez F. Facial soft biometrics for recognition in the wild: recent works, annotation and COTS evaluation. IEEE Trans Inf Forensics Secur. 2018;13(8):2001–2014. doi: 10.1109/TIFS.2018.2807791. [DOI] [Google Scholar]
- 20.Goswami G, Vatsa M, Singh R. Face verification via learned representation on feature-rich video frames. IEEE Trans Inf Forensics Secur. 2017;12(7):1686–1698. doi: 10.1109/TIFS.2017.2668221. [DOI] [Google Scholar]
- 21.Guo J, Zhu X, Zhao C, Cao D, Lei Z, Li SZ (2020) Learning meta face recognition in unseen domains. In: Proceedings of the IEEE/CVF conference on computer vision and pattern recognition (CVPR), pp 6163–6172
- 22.Gurpinar F, Kaya H, Dibeklioglu H, Salah A (2016) Kernel ELM and CNN based facial age estimation. In: Proceedings of the IEEE conference on computer vision and pattern recognition workshops, pp 80–86
- 23.Hernandez-Ortega J, Galbally J, Fierrez J, Beslay L (2021) Biometric quality: review and application to face recognition with FaceQnet. arXiv:2006.03298
- 24.High R (2012) The era of cognitive systems: an inside look at IBM watson and how it works. IBM Corporation, Redbooks, pp 1–16
- 25.Hoffer E, Ailon N (2015) Deep metric learning using triplet network. In: International workshop on similarity-based pattern recognition, Springer, pp 84–92
- 26.Huang G.B., Ramesh M, Berg T, Learned-Miller E (2007) Labeled faces in the wild: a database for studying face recognition in unconstrained environments. Tech Rep 07-49, University of Massachusetts, Amherst
- 27.Huang GB, Zhu QY, Siew CK (2004) Extreme learning machine: a new learning scheme of feedforward neural networks. In: Proceedings of the IEEE international joint conference on neural networks (IJCNN), vol 2, IEEE, pp 985–990
- 28.Jain AK, Nandakumar K, Ross A. 50 years of biometric research: accomplishments, challenges, and opportunities. Pattern Recogn Lett. 2016;79:80–105. doi: 10.1016/j.patrec.2015.12.013. [DOI] [Google Scholar]
- 29.Jin L, Gao S, Li Z, Tang J (2014) Hand-crafted features or machine learnt features? together they improve RGB-D object recognition. In: Proceedings of the IEEE international symposium on multimedia (ISM), IEEE, pp 311–319
- 30.Kemelmacher-Shlizerman I, Seitz S.M, Miller D, Brossard E (2016) The megaface benchmark: 1 million faces for recognition at scale. In: Proceedings of the IEEE conference on computer vision and pattern recognition (CVPR), pp 4873–4882
- 31.Klare BF, Burge MJ, Klontz JC, Bruegge RWV, Jain AK. Face recognition performance: role of demographic information. IEEE Trans Inf Forensics Secur. 2012;7(6):1789–1801. doi: 10.1109/TIFS.2012.2214212. [DOI] [Google Scholar]
- 32.Kudisthalert W, Pasupa K, Tongsima S. Counting and classification of malarial parasite from giemsa-stained thin film images. IEEE Access. 2020;8:78663–78682. doi: 10.1109/ACCESS.2020.2990497. [DOI] [Google Scholar]
- 33.Laiadi O, Ouamane A, Benakcha A, Taleb-Ahmed A, Hadid A (2019) Kinship verification based deep and tensor features through extreme learning machine. In: Proceedings of the 14th IEEE international conference on automatic face & gesture recognition (FG), IEEE, pp 1–4
- 34.Liu W, Wen Y, Yu Z, Li M, Raj B, Song L (2017) Sphereface: Deep hypersphere embedding for face recognition. In: Proceedings of the IEEE conference on computer vision and pattern recognition, pp 212–220
- 35.Liu Y, Yuan X, Gong X, Xie Z, Fang F, Luo Z. Conditional convolution neural network enhanced random forest for facial expression recognition. Pattern Recogn. 2018;84:251–261. doi: 10.1016/j.patcog.2018.07.016. [DOI] [Google Scholar]
- 36.Lu B, Chen J, Castillo CD, Chellappa R. An experimental evaluation of covariates effects on unconstrained face verification. IEEE Trans Biomet Behav Identity Sci. 2019;1(1):42–55. doi: 10.1109/TBIOM.2018.2890577. [DOI] [Google Scholar]
- 37.Lui YM, Bolme D, Draper BA, Beveridge JR, Givens G, Phillips PJ (2009) A meta-analysis of face recognition covariates. In: Proceedings of the 3rd IEEE international conference on biometrics: theory, applications, and systems (BTAS), IEEE, pp 1–8
- 38.Maaten LVD, Hinton G. Visualizing data using t-SNE. J Mach Learn Res. 2008;9:2579–2605. [Google Scholar]
- 39.Morales A, Fierrez J, Vera-Rodriguez R, Tolosana R. SensitiveNets: learning agnostic representations with application to face images. IEEE Trans Pattern Anal Mach Intell. 2021;43(6):2158–2164. doi: 10.1109/TPAMI.2020.3015420. [DOI] [PubMed] [Google Scholar]
- 40.O’Toole AJ, Phillips PJ, An X, Dunlop J. Demographic effects on estimates of automatic face recognition performance. Image Vis Comput. 2012;30(3):169–176. doi: 10.1016/j.imavis.2011.12.007. [DOI] [Google Scholar]
- 41.Pasupa K, Kudisthalert W. Virtual screening by a new clustering-based weighted similarity extreme learning machine approach. PLoS ONE. 2018;13(4):e0195478. doi: 10.1371/journal.pone.0195478. [DOI] [PMC free article] [PubMed] [Google Scholar]
- 42.Patel VM, Wu T, Biswas S, Phillips PJ, Chellappa R. Dictionary-based face recognition under variable lighting and pose. IEEE Trans Inf Forensics Secur. 2012;7(3):954–965. doi: 10.1109/TIFS.2012.2189205. [DOI] [Google Scholar]
- 43.Perera P, Fierrez J, Patel V (2020) Quickest intruder detection for multiple user active authentication. In: Proceedings of the IEEE international conference on image processing (ICIP)
- 44.Phillips PJ, Jiang F, Narvekar A, Ayyad J, O’Toole AJ. An other-race effect for face recognition algorithms. ACM Trans Appl Percept. 2011;8(2):1–11. doi: 10.1145/1870076.1870082. [DOI] [Google Scholar]
- 45.Ranjan R, Sankaranarayanan S, Bansal A, Bodla N, Chen JC, Patel VM, Castillo CD, Chellappa R. Deep learning for understanding faces: machines may be just as good, or better, than humans. IEEE Signal Process Mag. 2018;35(1):66–83. doi: 10.1109/MSP.2017.2764116. [DOI] [Google Scholar]
- 46.Serna I, Morales A, Fierrez J, Cebrian M, Obradovich N, Rahwan I (2020) Algorithmic discrimination: formulation and exploration in deep learning-based face biometrics. In: Proceedings of the AAAI workshop on artificial intelligence safety (SafeAI), pp 146–152
- 47.Serna I, Morales A, Fierrez J, Obradovich N. SensitiveLoss: improving accuracy and fairness of face representations with discrimination-aware deep learning. Artif Intell. 2022;305:103682. doi: 10.1016/j.artint.2022.103682. [DOI] [Google Scholar]
- 48.Serna I, Peña A, Morales A, Fierrez J (2021) InsideBias: measuring bias in deep networks and application to face gender biometrics. In: Proceedings of the international conference on pattern recognition (ICPR)
- 49.Shi J, Samal A, Marx D. How effective are landmarks and their geometry for face recognition. Comput Vis Image Underst. 2006;102(2):117–133. doi: 10.1016/j.cviu.2005.10.002. [DOI] [Google Scholar]
- 50.Siegel S (1956) Nonparametric statistics for the behavioral sciences. McGraw-Hill
- 51.Sixta T, Junior JCJ, Buch-Cardona P, Vazquez E, Escalera S (2020) Fairface challenge at ECCV 2020: analyzing bias in face recognition. In: Proceedings of the European conference on computer vision (ECCV), Springer, pp 463–481
- 52.Sun Y, Wang X, Tang X (2013) Hybrid deep learning for face verification. In: Proceedings of the IEEE international conference on computer vision (ICCV), pp 1489–1496
- 53.Sun Y, Wang X, Tang X (2014) Deep learning face representation from predicting 10,000 classes. In: Proceedings of the IEEE conference on computer vision and pattern recognition (CVPR), pp 1891–1898
- 54.Terhörst P, Kolf J.N., Huber M, Kirchbuchner F, Damer N, Morales A, Fierrez J, Kuijper A (2021) A comprehensive study on face recognition biases beyond demographics. arXiv:2103.01592
- 55.Thomee B, Shamma DA, Friedland G, Elizalde B, Ni K, Poland D, Borth D, Li LJ (2015) The new data and new challenges in multimedia research. arXiv preprint arXiv:1503.018171(8)
- 56.Tome P, Vera-Rodriguez R, Fierrez J, Ortega-Garcia J. Facial soft biometric features for forensic face recognition. Forensic Sci Int. 2015;257:171–284. doi: 10.1016/j.forsciint.2015.09.002. [DOI] [PubMed] [Google Scholar]
- 57.Vera-Rodriguez R, Blazquez M, Morales A, Gonzalez-Sosa E, Neves JC, Proença H (2019) FaceGenderID: exploiting gender information in DCNNs face recognition systems. In: Proceedings of the IEEE conference on computer vision and pattern recognition workshops
- 58.Wang M, Deng W (2020) Mitigating bias in face recognition using skewness-aware reinforcement learning. In: Proceedings of the IEEE/CVF conference on computer vision and pattern recognition (CVPR), pp 9322–9331
- 59.Wang M, Deng W, Hu J, Tao X, Huang Y (2019) Racial faces in the wild: reducing racial bias by information maximization adaptation network. In: Proceedings of the IEEE international conference on computer vision (ICCV), pp 692–702
- 60.Wang Q, Guo G. Benchmarking deep learning techniques for face recognition. J Vis Commun Image Represent. 2019;65:102663. doi: 10.1016/j.jvcir.2019.102663. [DOI] [Google Scholar]
- 61.Weinberger KQ, Saul LK. Distance metric learning for large margin nearest neighbor classification. J Mach Learn Res. 2009;10:207–244. [Google Scholar]
- 62.Wen Y, Zhang K, Li Z, Qiao Y (2016) A discriminative feature learning approach for deep face recognition. In: Proceedings of the European conference on computer vision (ECCV). Springer, pp 499–515
- 63.Wong SY, Yap KS, Zhai Q, Li X. Realization of a hybrid locally connected extreme learning machine with deepid for face verification. IEEE Access. 2019;7:70447–70460. doi: 10.1109/ACCESS.2019.2919806. [DOI] [Google Scholar]
- 64.Yuan L, Qu Z, Zhao Y, Zhang H, Nian Q (2017) A convolutional neural network based on tensorflow for face recognition. In: Proceedings of the IEEE 2nd advanced information technology, electronic and automation control conference (IAEAC), IEEE, pp 525–529