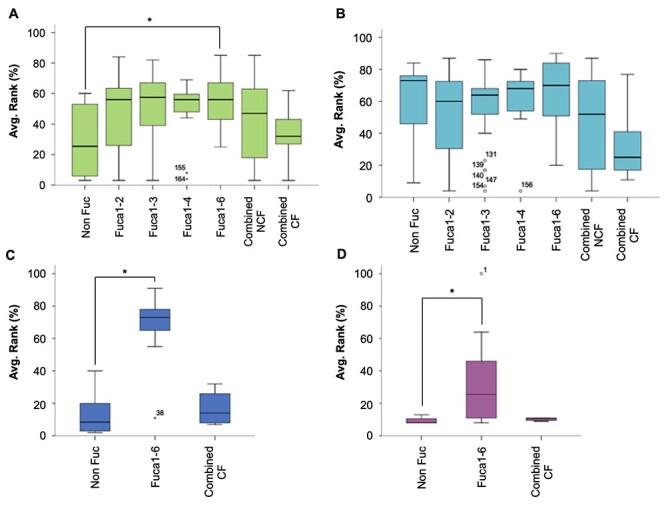
Fig. 3.

Box plot distribution of the relative average binding intensities depending on the fucose linkage in the fucosylated structures at the CFG glycan array v5.0 for (A) AOL (green), (B) AAL (cyan) and (C) LCA (blue) and v5.1 for (D) PhoSL (fuchsia). When two or more fucose residues were present, the structure was categorized either as combined NCF (noncore fucose) if there is no core fucose or combined CF (core fucose) if one of the fucose residues was linked in α(1,6) position. (*) means a statistically significant difference accordingly the U Mann–Whitney test (P < 0.05).
