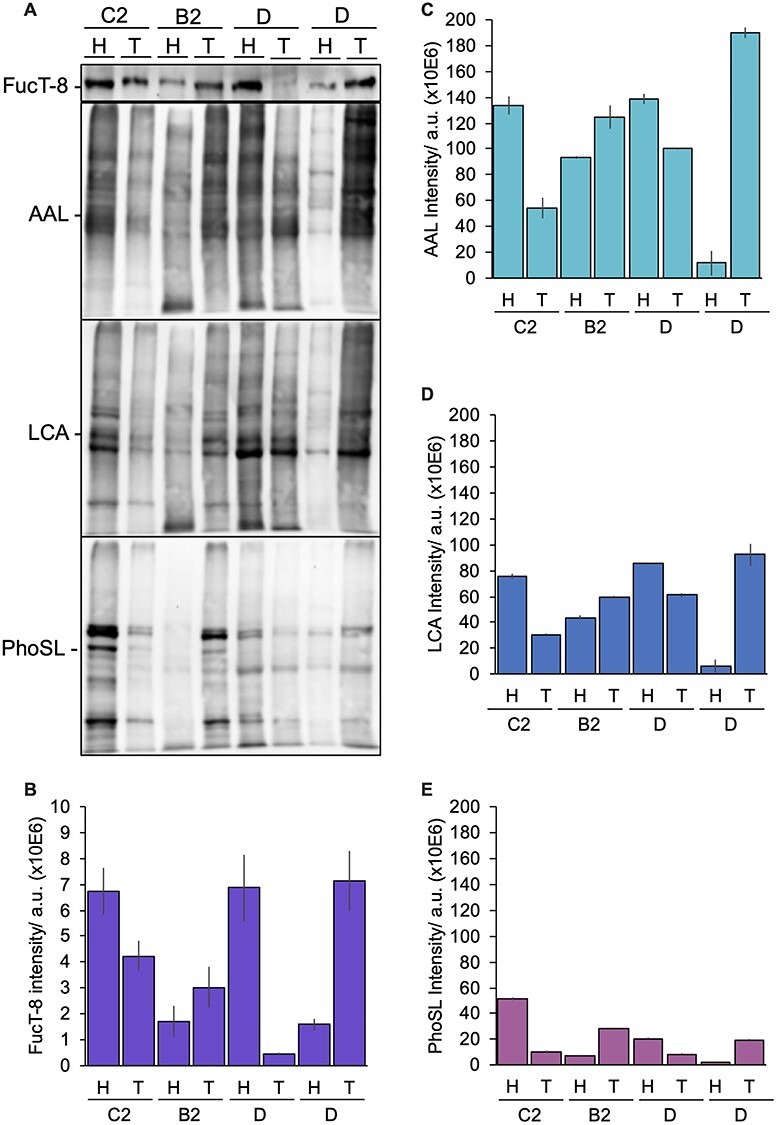
Fig. 7.

Expression of FucT-8 enzyme and lectin blot from CRC patients. (A) Four biopsies from different patients at different Dukes tumor stages (B2, C2 and D) were separated by SDS-PAGE, quantifying (B) FucT-8 protein expression (violet) and fucose content with (C) AAL (cyan), (D) LCA (blue) and (E) PhoSL (fuchsia) lectins. Plot bars represent the mean relative chemiluminiscence intensity (using the Coomassie R-250 dyer as protein loading control) ± standard deviation from two experiments.
