Abstract
To improve our understanding of longstanding disparities in incidence and mortality in lung cancer across ancestry, we per-formed a systematic comparative analysis of molecular features in tumors from African Americans (AAs) and European Americans (EAs). We find that lung squamous cell carcinoma tumors from AAs exhibit higher genomic instability—the pro-portion of non-diploid genome—aggressive molecular features such as chromothripsis and higher homologous recombination deficiency (HRD). In The Cancer Genome Atlas, we demonstrate that high genomic instability, HRD and chromothripsis among tumors from AAs is found across many cancer types. The prevalence of germline HRD (that is, the total number of pathogenic variants in homologous recombination genes) is higher in tumors from AAs, suggesting that the somatic differences observed have genetic ancestry origins. We also identify AA-specific copy-number-based arm-, focal- and gene-level recurrent features in lung cancer, including higher frequencies of PTEN deletion and KRAS amplification. These results highlight the importance of including under-represented populations in genomics research.
In the United States, African Americans (AAs) have the highest cancer incidence and lowest survival across multiple cancer types1. The reasons for these persistent trends are not clear. Our current understanding of the molecular mechanisms of tumorigenesis is primarily from analyses of tumors derived from European ancestry patients, including The Cancer Genome Atlas (TCGA) where only 8.5% of samples are from AAs. This raises a question about whether there are differences in tumor evolution and molecular features by genetic ancestry. Recently, Yuan et al.2 compared somatic copy-number alteration (SCNA)-based genomic instability (GI) across genetic ancestry in TCGA and found that invasive breast carcinoma (BRCA), head and neck squamous cell carcinoma (HNSC) and uterine corpus endometrial carcinoma tumors from AAs had significantly increased GI compared with tumors from European Americans (EAs). Furthermore, recent work showed that the African pan-genome contains numerous large insertions—whose total length comprises ~10% of the genome—that are not present in the current human reference genome (GRCh38)3, which was primarily derived from a small number of individuals, primarily of European descent4. Together, these data highlight the need for studies specifically investigating the molecular landscape of cancer in minority and under-represented populations.
Lung cancer—the second most common cancer in the United States and the leading cause of cancer-related death5—has persistent disparities in both incidence and mortality. AAs have the highest lung cancer incidence and mortality rates compared with other racial or ethnic groups1,6. These disparities persist even after considering tobacco smoking exposure—the strongest risk factor for lung cancer development6.
Population-specific molecular patterns in tumor biology and cancer genomics have been reported in recent years7–10 with limited power and coverage. Here, we systematically identified ancestry-specific genome-wide copy-number features in a racially balanced (EA and AA) cohort of 222 lung tumors. Our analysis reveals higher GI and homologous recombination deficiency (HRD) in lung squamous cell carcinoma (LUSC) tumors from AAs compared with EAs. This suggests an ancestry-associated disparity in deficiency of the homologous recombination pathway, which we confirmed by finding a higher prevalence of germline HRD in AA compared with EA patients in LUSC. In the TCGA cohort, we further found increased GI, HRD and chromothripsis (CHTP) among AAs across multiple cancer types and pan-cancer. Furthermore, we identify ancestry-specific arm-, focal- and gene-level features in lung adenocarcinoma (LUAD) and LUSC. Our results highlight the importance of including minority and under-represented populations in cancer genomics research and may have therapeutic implications.
Results
LUSC tumors from AAs have higher GI and HRD.
We generated genome-wide copy-number profiles of 222 non-small cell lung cancer tumor samples from the National Cancer Institute-Maryland (NCI-MD) study (105 LUAD (AA = 63; EA = 42) and 117 LUSC (AA = 63; EA = 54)) (Supplementary Table 1) using the OncoScan platform11, which provides comprehensive coverage of 50–100-kilobase copy-number resolution in cancer genes and 300-kilobase copy-number resolution across the rest of the genome. Sample characteristics for the patients in this study are shown in Supplementary Table 1.
Based on these copy-number alteration profiles, we first quantified GI—defined as the proportion of the genome with non-diploid copy number—for each sample. We found that LUSC tumors from AAs had significantly higher GI compared with EAs (Fig. 1a, top; Wilcoxon rank-sum test, P < 6 × 10⁻³). In contrast, we did not find significantly higher GI in LUAD in AAs (Fig. 1a, middle).
Fig. 1 |. Differences in GI, HRD and CHTP across AA and EA patients with lung cancer from the NCI-MD and TCGA cohorts.
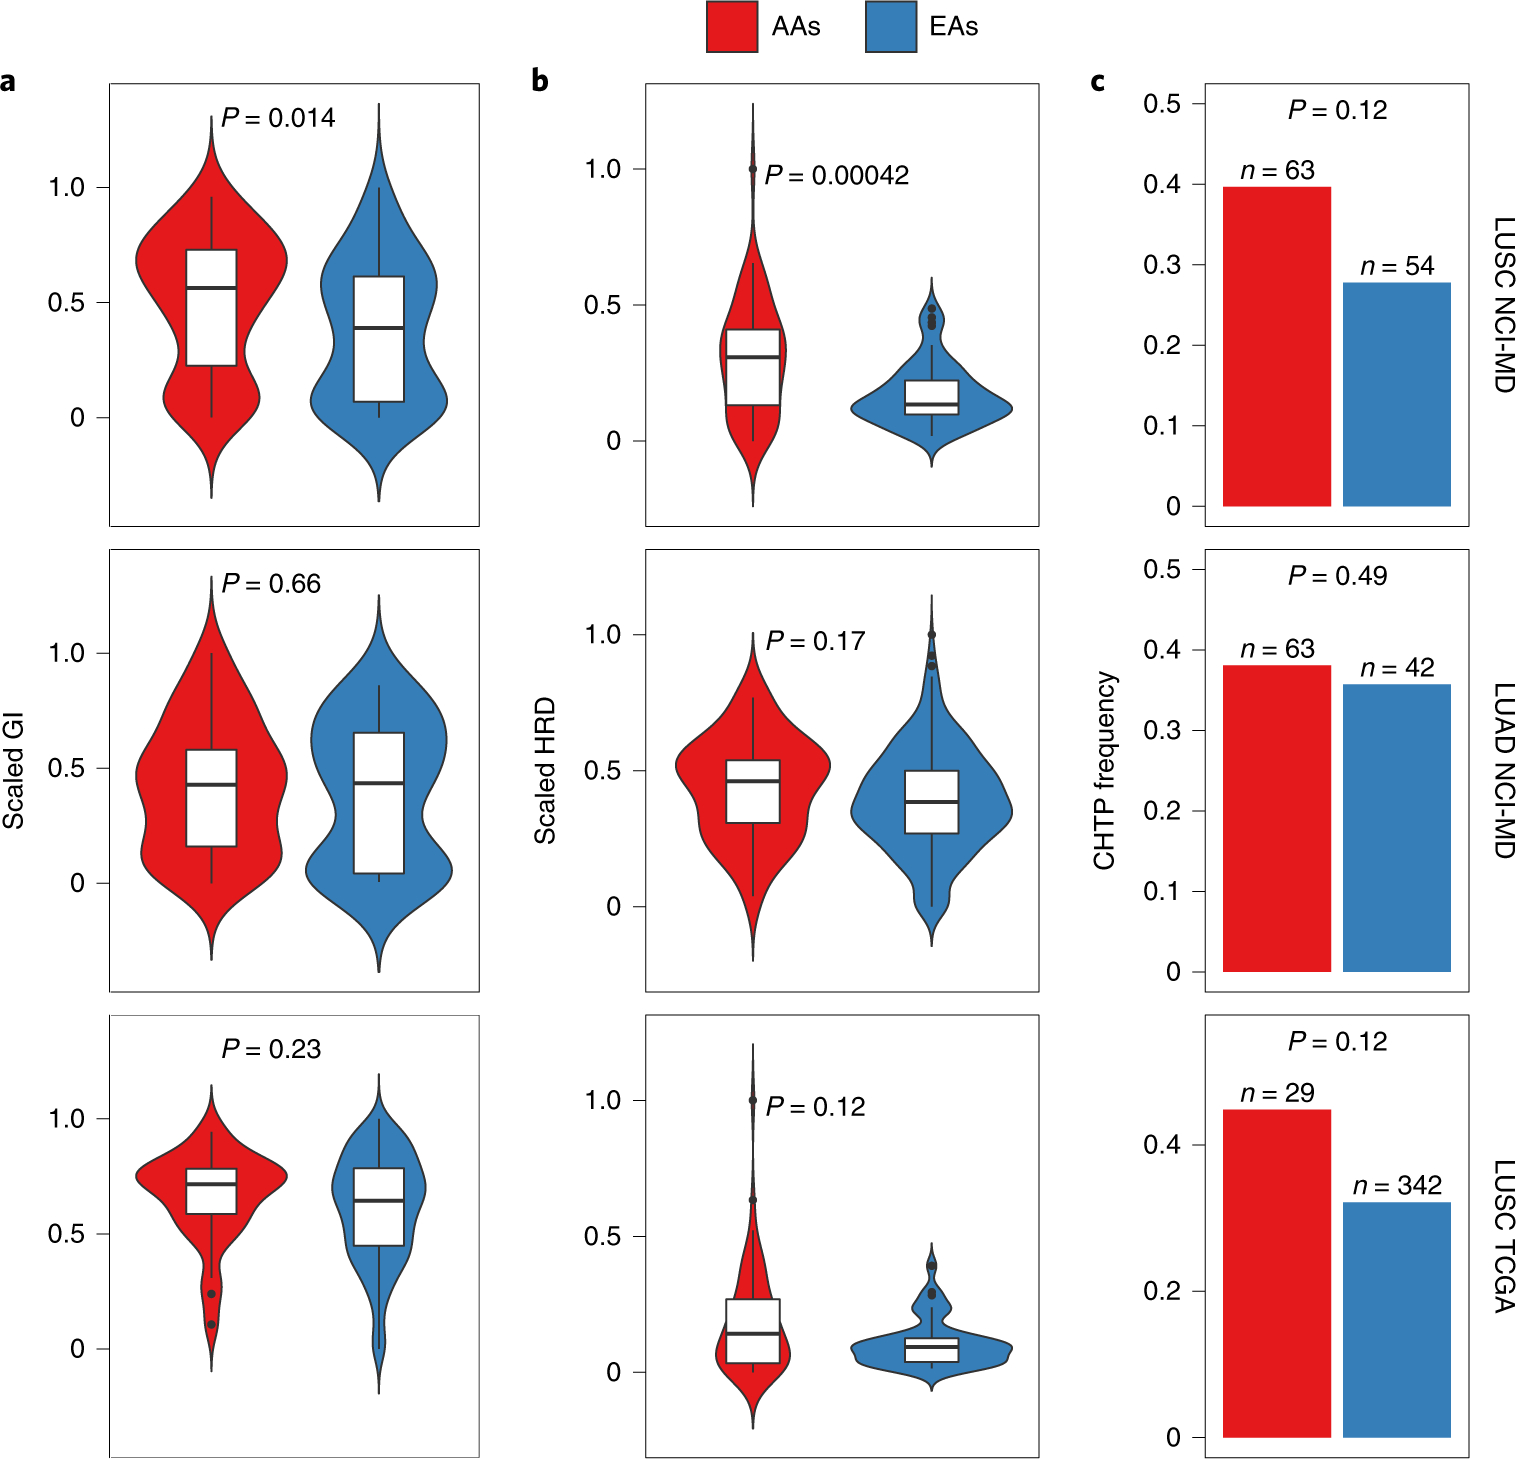
a–c, GI (a), HRD (b) and CHTP (c) are quantified and presented stratified by genetic ancestry for LUSC (top; n = 105 patients (AA = 63; EA = 42)) and LUAD (middle; n = 117 patients (AA = 63; EA = 54)) from the NCI-MD cohort, and LUSC from the TCGA cohort (bottom; n = 375 patients (AA = 29; EA = 346)). Significance for comparison of medians in a and b was calculated by one-sided Wilcoxon rank-sum test. Significance for comparison of frequency in c was calculated by one-sided Fisher’s exact test. The violin plots in a and b show the data distribution, where the center line denotes the median, the box edges show the interquartile range and the black line represents the rest of the distribution, except for points that were determined to be ‘outliers’, which is 1.5 times the interquartile range.
We tested the hypothesis that higher GI across tumors from AAs is due to a higher prevalence or extent of HRD, which was previously identified as a key contributor to GI in cancer12. We quantified HRD in tumors using four independent measures of HRD: (1) loss of heterozygosity (LOH), which is the number of LOH segments13,14; (2) telomere allelic imbalance (AIL), which is the number of regions of allelic imbalance that extend to one of the sub-telomeres but do not cross the centromere; (3) large-scale state transition (LST), which is the number of breakpoints between regions longer than 10 megabases (Mb) after filtering out regions shorter than 3 Mb13; and (4) the sum of these three features. All four scores are scaled within the range of 0–1. In the NCI-MD study, we observed a strong positive correlation between GI and HRD across the whole cohort for all four features (P < 2 × 10⁻¹⁶ for all; Spearman’s Rho = 0.64 for LOH, 0.31 for LST, 0.44 for AIL and 0.51 for the sum), where, in AA tumors, the observed correlation is stronger than in EA tumors (Spearman’s Rho for AA = 0.57 and for EA = 0.48; P < 2.2 × 10⁻¹⁶ for both) (Supplementary Table 2). Next, we observed significantly higher HRD in AAs with LUSC (false discovery rate (FDR)-corrected P < 2 × 10⁻⁴ for LOH (Fig. 1b, top), P < 2.0 × 10⁻² for LST, P < 3.9 × 10⁻² for AIL and P < 7.1 × 10⁻³ for the net sum), but not LUAD, which is consistent with our GI-based findings outlined above (Fig. 1b, middle). This suggests that HRD contributes to the ancestry-specific pattern of higher GI burden in LUSC among AAs.
To account for potential confounding factors, we performed multivariate linear regression to model separately GI and HRD in the NCI-MD cohort as a function of ancestry, adjusting for tumor stage, patient age, sex, smoking status, pack-years of cigarettes and tumor purity. Here, we found AA ancestry to be strongly positively associated with GI and HRD in LUSC, but not LUAD, consistent with our previous observations (LUSC: FDR < 3 × 10⁻² and FDR < 5.35 × 10⁻⁵, respectively; LUAD: FDR < 0.24 and FDR < 0.09, respectively; Supplementary Table 3).
We initially determined ancestry by self-report; however, it is possible that misreport could have confounded our results15. Therefore, we inferred ancestry in an unsupervised manner via principal component analysis (PCA) of ancestry-informative single-nucleotide polymorphisms (SNPs; Extended Data Fig. 1 and Methods) followed by classification of the first two principal components via support vector classification, which identified two classes of ancestry. We found that inferred ancestry class was concordant with self-reported ancestry for 98.6% of participants; four samples were potentially misclassified (Supplementary Table 3, column B). We removed these samples and repeated the analyses above and found consistent results with comparable significance (higher GI and LOH HRD in LUSC among AAs; Wilcoxon rank-sum test, P < 6 × 10⁻³ and P < 2 × 10⁻⁴, respectively).
To validate the relationship between GI and the extent of HRD that we found in the NCI-MD cohort, we quantified GI and HRD using the four signatures described above in the TCGA cohort. Both GI and HRD were higher in tumors from AAs compared with EAs in LUSC, but the differences did not reach statistical significance (Fig. 1a,b, bottom). This could be due to the limited number of tumor samples from AAs in TCGA (29 AAs compared with 346 EAs), which was supported by a power analysis of TCGA samples across ancestry (Methods).
Lung tumors from AAs have more frequent complex structural variants.
The observed deficiencies in DNA damage repair related to GI in LUSC prompted us to chart the landscape of complex structural variants recently reported to be related to HRD16. We studied CHTP, which was first described as a catastrophic event that leads to chromosome shattering and tens to hundreds of simultaneously acquired oscillatory copy-number aberrations on one chromosome17,18. Therefore, we represented CHTP as a binary variable indicating presence/absence. Using the classical definition (i.e., many oscillatory copy-number events clustered on a chromosome (Methods)19), tumor samples with CHTP had significantly higher HRD than samples without CHTP (Wilcoxon rank-sum test, P < 9 × 10⁻⁴) in the NCI-MD lung cancer cohort (Supplementary Table 2). Furthermore, we observed a higher frequency of CHTP in tumors from AAs compared with EAs in LUSC (Fig. 1c, top; P < 0.12; odds ratio (OR) = 1.24) and in LUAD, but to a weaker extent (Fig. 1c, middle; P < 0.49; OR = 1.15). These patterns are consistent when adjusted for age, sex, stage, smoking status and pack-years of cigarettes (multivariate regression P for ancestry < 2.8 × 10⁻³; Supplementary Table 3). The same result held qualitatively when an alternative quantification of CHTP—defined by the allowance for two oscillation states in the affected region—was used (Methods) (Supplementary Table 2, columns A and D). Next, we quantified CHTP in the TCGA LUSC cohort and observed a consistent pattern of higher frequency in tumors from AAs (Fig. 1c, bottom; P < 0.12; OR = 1.45). We further analyzed the chromosome frequency distribution of CHTP, which varied by histological subtype and ancestry (Extended Data Fig. 2).
Landscape of arm- and focal-level SCNAs in lung cancer in AAs and EAs.
To identify SCNA-based ancestry-specific features in detail, we examined population-specific SCNA profiles in lung cancer for chromosome arm- and focal-level (shorter than half a chromosome arm) events in the NCI-MD study where statistical power for both populations was available. Further support for key observations was demonstrated by analysis of TCGA cohort. Recurrent arm- and focal-level SCNA events were identified for both populations separately using GISTIC20 (Methods; FDR < 0.1) and used to map genome-wide SCNA across histology and ancestry (Fig. 2 and Supplementary Tables 4 and 5).
Fig. 2 |. Characterization of arm-level SCNA events across AA and EA patients in the NCI-MD cohort.
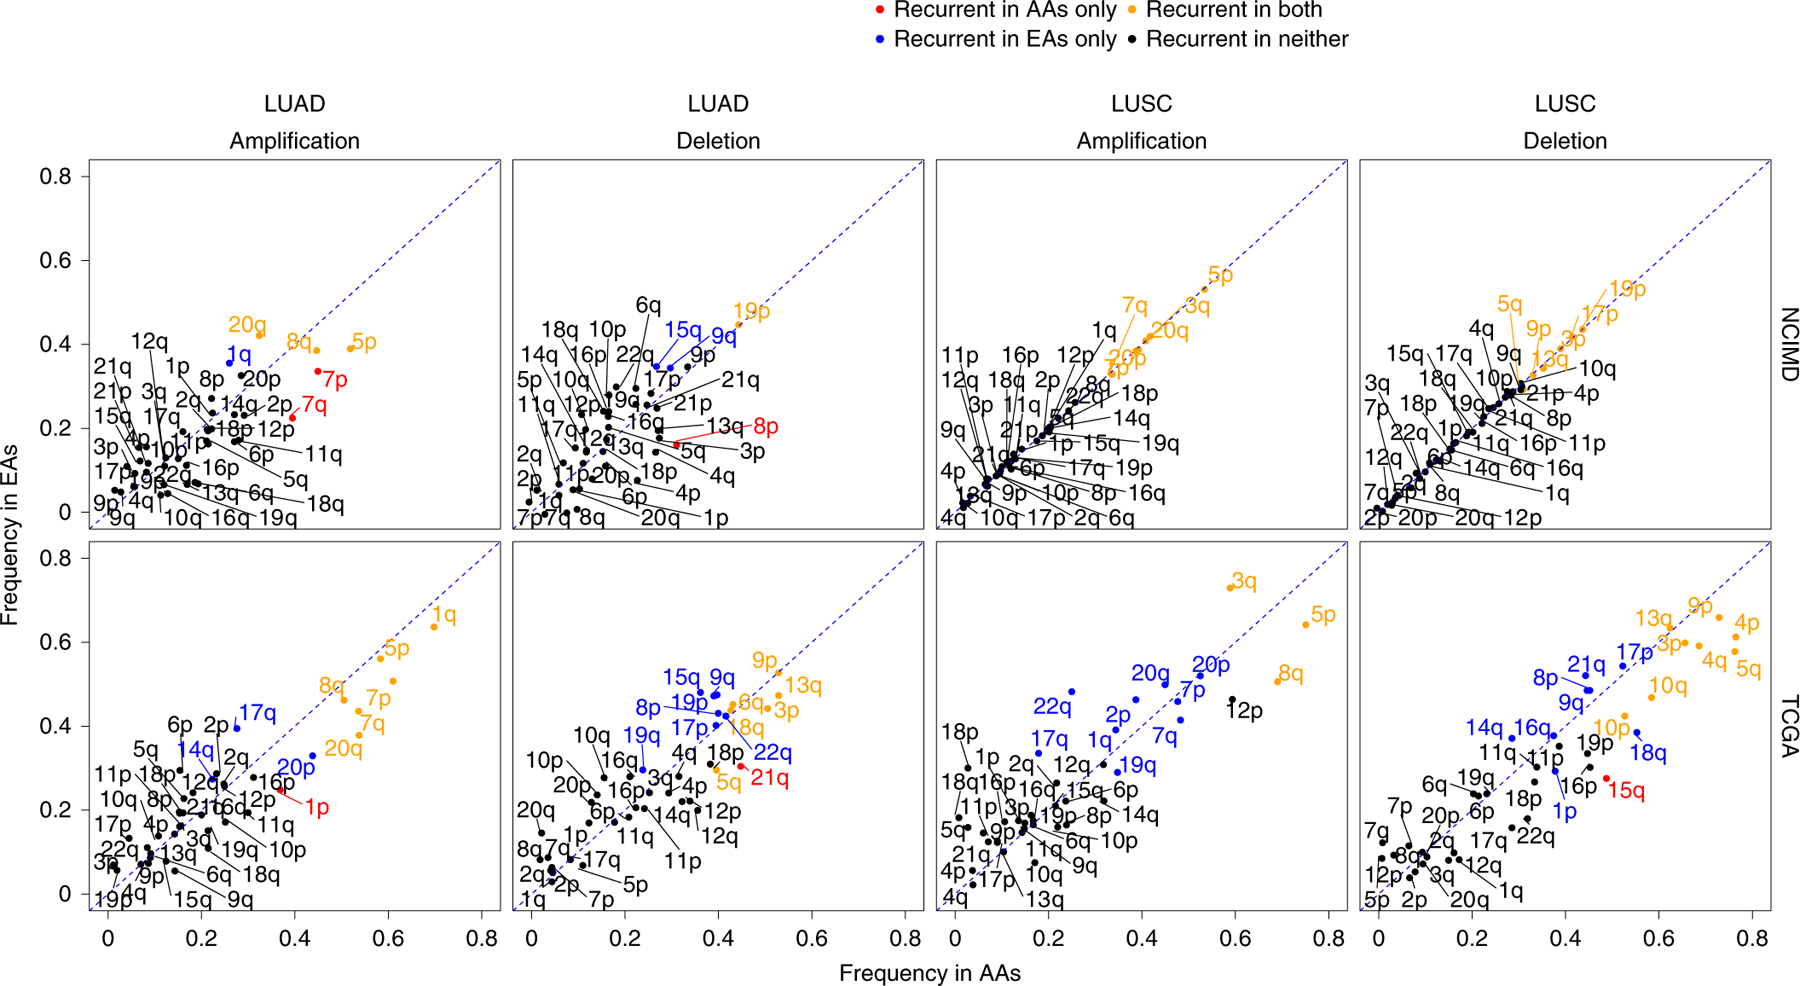
Frequency distribution of aberrant SCNA events on autosomal chromosome arms in LUAD and LUSC for the NCI-MD and TCGA cohorts (LUSC: n = 375 patients (AA = 29; EA = 346); LUAD: n = 432 patients (AA = 51; EA = 381)). The diagonal dashed lines represent equal AA and EA frequencies, with points falling away from this line indicating chromosome arms with alteration frequency differences between populations. A color code is provided to denote population-specific recurrent SCNA events with statistical significance. Statistical significance of recurrence was computed via GISTIC, which provides arm-level FDR-corrected significance with a threshold of 0.1.
For each chromosome arm, the alteration frequency and recurrence significance by ancestry for both amplifications and deletions were plotted for patients in the NCI-MD cohort (Fig. 2). We identified known cancer-specific arm-level SCNA events, including amplifications of 3q and 5p and deletion of 3p (ref. 21) in both populations (Supplementary Tables 4 and 5). Similarly, 19p deletion—a molecular signature of LUAD—was recurrent in EAs and AAs at similar frequencies of ~45% (Fig. 2 and Supplementary Table 5). Recurrent population-specific arm-level SCNA differences were observed, including 4p and 4q arm-level deletions in LUSC and 7p and 7q amplifications in LUAD, and both occurred at a higher frequency in AAs compared with EAs. These observations were replicated by TCGA (Fig. 2).
To visualize genome-wide focal-level SCNA events across populations, including co-occurrence and mutual exclusivity, we created an SCNA map showing genome-wide SCNA frequency distributions for both LUSC and LUAD in the NCI-MD cohort (Fig. 3, left). The overlaps in recurrent focal regions among EAs and AAs were 59 and 70% for LUAD and LUSC, respectively (Fig. 3, left). Furthermore, we observed population-specific patterns of co-occurring and mutually exclusive SCNA events (Fig. 3, left). To identify potential novel AA-specific copy-number-driven focal-level regions, we selected high-confidence recurrent focal-level regions from GISTIC that met the following criteria: (1) alteration frequency >5% in AAs; (2) frequency at least two times higher in AAs than EAs; (3) recurrent only in AAs; and (4) no recurrent peak of the same type (amplification or deletion) was present in EAs within the region or an extended additional 10% on both sides of the region length. We identified eight potential AA-specific potential driver regions. The top hit ranked by significance was a 22q11.23 deletion in LUSC (Fig. 3, right), with a frequency of 27% in AAs and 13% in EAs. Following a previous study22–24, we tested whether this deletion event is somatic or germline by profiling matched-control tissue samples with genome-wide copy number; we observed that two out of five control samples from AAs also had a deletion of 22q11.23, suggesting that this event could be germline (Supplementary Table 6). This 22q11.23 region deleted in LUSC is disjoint from the nearby region on 22q11.21 that is hemizygously deleted in DiGeorge syndrome23,24. The region with the second highest fold change in alteration frequency in LUSC, 12p12.1 (Fig. 3, right), is a short region including KRAS and is discussed in detail in the next section. Third, common to both LUAD and LUSC, the 20p12.1 region is deleted more than four times as often in AAs compared with EAs. This region includes the genes FLRT3 and MACROD2.
Fig. 3 |. Global SCNA map across AA and EA patients in the NCI-MD cohort.
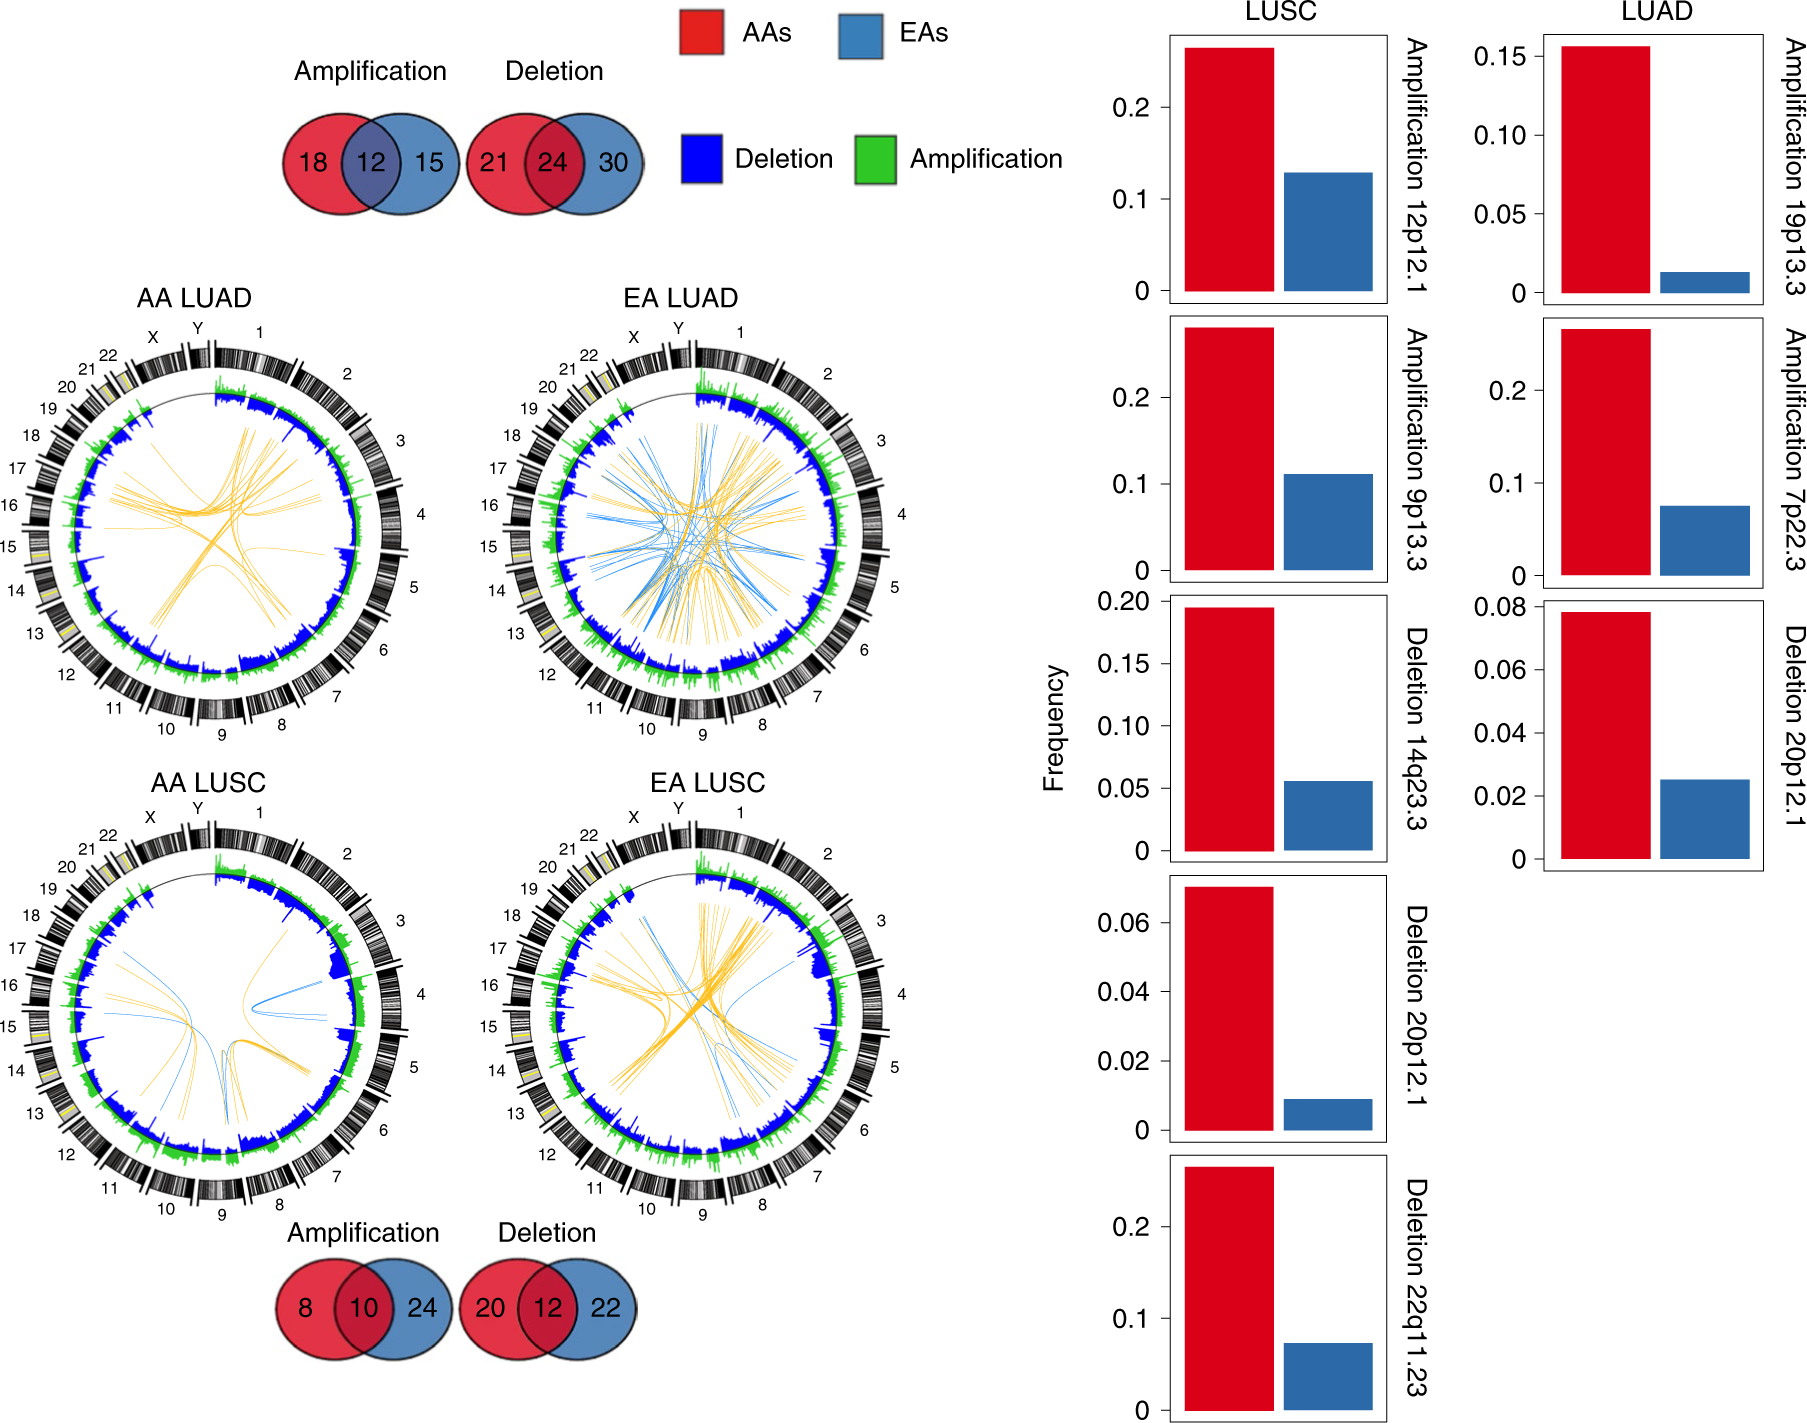
Segmental deletions and amplifications are shown In blue and green, respectively, in the Circos plots to the left. In these plots, the top 50 (Pearson’s Rho>0.50) highly positively (co-occurring) and negatively (mutually exclusive) correlated copy-number segment pairs are connected with yellow and blue arcs, respectively. The overlap and unique recurrent regions between AAs and EAs in LUSC and LUAD are shown as Venn diagrams at the top and bottom. Regions which are (1) AA-specific recurrent; (2) have a frequency in AAs≥2 × frequency in EAs; (3) have an AA frequency >5%; and (4) no recurrent peak of the same type (amplification or deletion) is present in EAs within the region or an extended additional 10% on both sides of the region length, are considered potential SCNA-driven AA-specific driver regions. For each of the regions that meet these criteria, a bar plot is provided to the right, showing the corresponding frequency in AAs (red) and EAs (blue) for LUSC (left) and LUAD (right). The recurrence significance for each focal region was computed via GISTIC in AAs and EAs separately, with an FDR-corrected significance threshold of 0.1.
We also identified several SCNA events previously linked to AA ancestry in cancer, and assessed the relationship between copy number and gene expression (Supplementary Tables 7–10). We observed an AA-specific amplification of the oncogene KAT6A in LUAD, which was previously observed in ref. 24. We also identified a recurrent deletion of 4q35.2 extending to the telomere in LUSC that includes FBXW7, which was previously shown to be deleted in colorectal cancer and triple-negative breast cancer among AAs25,26 (Supplementary Table 7). In LUAD, 8q24 was significantly recurrently amplified in AAs only (frequency=33% and 18% in AAs and EAs, respectively). Within a subregion, 8q24.21, the PVT1 copy-number profile was significantly associated with expression (P < 7 × 10⁻³), while in 8q24.3, HSF1, DgAT1 and BOP1 copy-number profiles were also significantly associated with gene expression (P < 7 × 10⁻³) (Supplementary Tables 8 and 10).
Landscape of driver-gene SCNAs in lung cancer in AAs and EAs.
We analyzed the recurrence and alteration frequency of known lung cancer driver genes mined from the cancer gene census of the Catalogue of Somatic Mutations in Cancer (Fig. 4a). We identified population-specific SCNA patterns of drivers (Fig. 4a) significantly correlated with gene expression (Fig. 4b and Extended Data Figs. 3 and 4). In LUSC, one of the key cancer driver genes, KRAS, is amplified in both populations but is significantly recurrent (FDR < 0.1; Methods) and has a higher frequency in AAs (KRAS amplification frequency=23% in EAs compared with 51% in AAs; Fig. 4). Similarly, PTEN deletion is significantly recurrent and more frequent in AAs (PTEN deletion frequency=32% in EAs compared with 53% in AAs; Fig. 4). Another key driver, CDKN2A, was recurrently deleted in both populations, but the frequency was 35% in AAs compared with 64% in EAs (Fig. 4a). These three population-specific patterns in frequency were also observed in TCGA (Extended Data Figs. 3 and 4).
Fig. 4 |. Landscape of SCNA of lung cancer drivers AA and EA patients in the NCI-MD cohort.
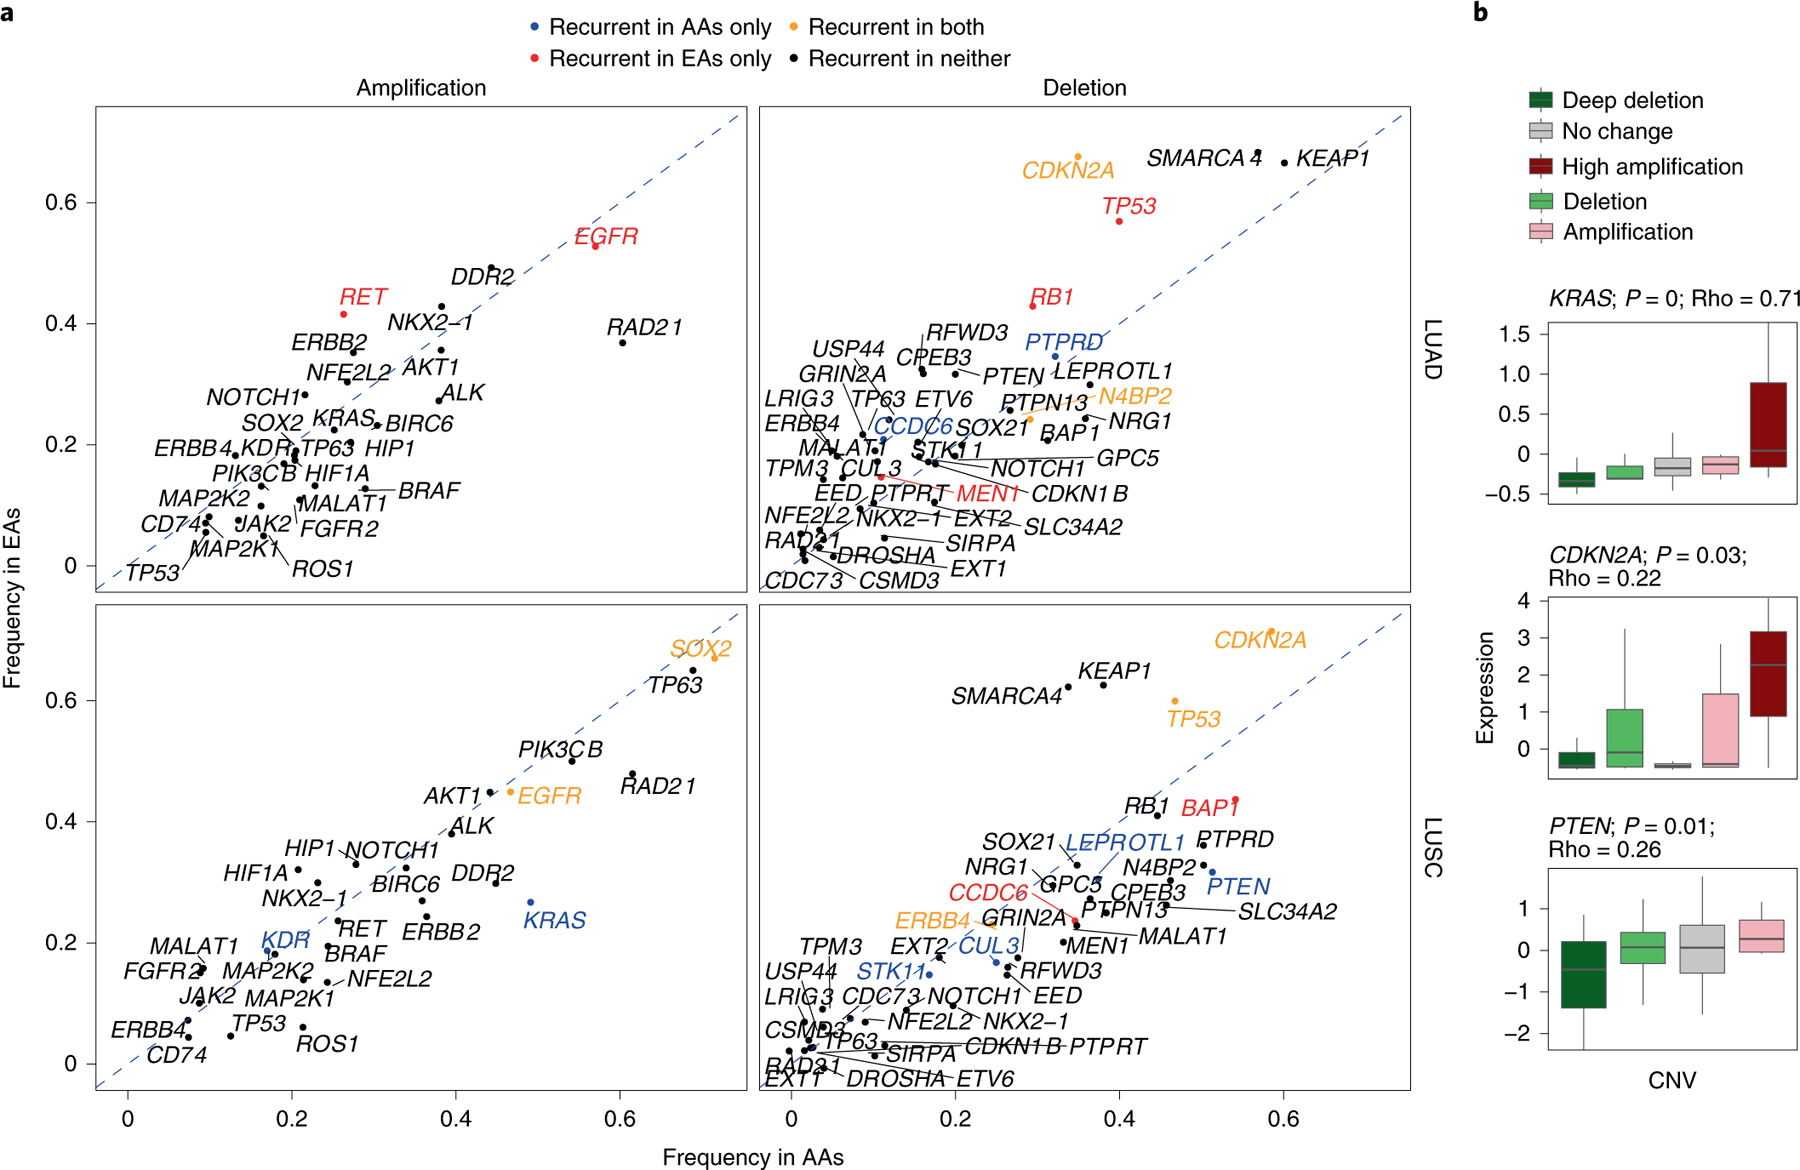
a, Amplification and deletion frequencies of lung cancer driver genes across population and histology. The recurrence significance for each gene was computed via GISTIC in AAs and EAs separately, with an FDR-corrected significance threshold of 0.1. The diagonal dashed lines denote the null lines, with points falling away from this line indicating chromosome arms with alteration frequency differences across populations. A color code is provided to denote gene-level population-specific statistically significant recurrent SCNA events, where a gene name in black implies no statistically significant SCNA recurrence in either population. b, Effect of copy-number changes on the expression profiles (n = 91 patients) of driver genes with population-specific patterns. Only genes whose SCNA profile is significantly correlated with their corresponding expression profile are plotted (P <0.01 and Spearman’s Rho>0.2). Here, the center line denotes the median, the box edges show the interquartile range and the black line represents the rest of the distribution, except for points that were determined to be ‘outliers’, 1.5 times the interquartile range.
A pan-cancer survey of GI, HRD and CHTP in tumors from AAs versus EAs.
To determine whether the higher prevalence of aggressive molecular features, including GI, HRD and CHTP, extends to other cancer types, we mined TCGA SCNA profiles of 6,492 tumor samples, originating from 23 tumor types, with available self-reported ancestry from AAs and EAs (Supplementary Tables 11 and 12). Consistent with previous observations3, we initially observed an overall significantly higher GI burden in tumors from AAs (pan-cancer Wilcoxon rank-sum test, P < 6.9 × 10⁻⁷; Fig. 5a). These differences were most significant in BRCA, HNSC, stomach adenocarcinoma, cervical squamous cell carcinoma and endocervical adenocarcinoma, with a general trend towards higher GI burden in 17 out of the 23 cancer types (Extended Data Fig. 5). We repeated this analysis separately for SCNA loss- and gain-based GI and observed a consistent pattern (Extended Data Fig. 6 and Methods).
Fig. 5 |. Landscape of GI, HRD and CHTP across AA and EA patients with lung cancer in the TCGA cohort.

a-c, GI (a), HRD (b) and CHTP (c) are quantified and provided across genetic ancestry for pan-cancer TCGA samples (n = 6,256 patients (AA = 692; EA = 5,563)). Significance for comparison of the medians in a and b was calculated via one-sided Wilcoxon rank-sum test. Significance for comparison of frequency in c was calculated via one-sided Fisher’s exact test. The violin plot shows the data distribution, where the center line denotes the median, the box edges indicate the interquartile range and the black line represents the rest of the distribution, except for points that were determined to be ‘outliers’ using a method that is a function of the interquartile range, as in box plots.
We quantified HRD using the four measures previously used (that is, LOH, AIL, LST and a normalized sum of the three) and observed a strong correlation between GI and HRD in pan-cancer (P < 2 × 10⁻¹⁶ for all; Spearman’s Rho = 0.56 for LOH, 0.47 for LST, 0.60 for AIL and 0.58 for the sum) and cancer type-specific analyses (Supplementary Table 13), where, in tumors from AAs, the correlation observed was stronger than in tumors from EAs for both pan-cancer (LOH-based measure: Rho for AA = 0.57 and Rho for EA = 0.48; P < 2.2 × 10⁻¹⁶ for both; AIL-based measure: Rho for AA = 0.66 and Rho for EA = 0.60; P < 2.2 × 10⁻¹⁶ for both; LST-based measure: Rho for AA = 0.51 and Rho for EA = 0.47; P < 2.2 × 10⁻¹⁶ for both) and cancer type-specific analyses (Supplementary Table 13). Moreover, HRD was significantly higher in AAs in pan-cancer for all four measures (Extended Data Fig. 7a–d; Wilcoxon rank-sum test, P < 1.5 × 10⁻² for LOH; P < 7.7 × 10⁻² for LST; P < 2.2 × 10⁻² for AIL; P < 1.9 × 10⁻² for the sum). This further suggests that HRD contributes to the ancestry-specific pattern of higher GI burden in AAs across cancer types.
When analyzed by specific cancer type, we found that BRCA and HNSC have significantly higher HRD across all four measures in AAs compared with EAs (Supplementary Table 12). A trend towards increased HRD among AAs was observed in 11 out of 17 cancer types where increased GI was also observed (Extended Data Fig. 8). The remaining six cancer types had an inverse trend, including kidney renal papillary cell carcinoma and kidney renal clear cell carcinoma, which have significantly lower GI and HRD. We confirmed these results by quantifying HRD using a somatic mutation profile-based signature27 (that is, mutational signature 3). This signature is typified by a C > G/A transversion and is strongly associated with HRD27–29. We leveraged the mSignatureDB database where mutation signatures are profiled27 on 7,042 tumors from 30 different cancer types and found the mutational signature 3 contribution to be higher in tumors from AAs compared with EAs in pan-cancer (Wilcoxon rank-sum test, P < 1 × 10⁻³; Extended Data Fig. 7e). Testing each cancer type specifically for a higher mutational signature 3 in AAs, we found that BRCA and HNSC have a higher prevalence of this HRD-related signature, which is consistent with the SCNA hallmarks-based quantification of HRD described above (Wilcoxon rank-sum test, P < 0.01 and P < 0.10, respectively; Extended Data Fig. 8e). Additionally, we performed multivariate regression, modeling GI and HRD in pan-cancer as a function of ancestry, adjusting for stage, sex, age and smoking status in TCGA samples, and found AA ancestry to be strongly positively associated with these genomic features (that is, higher GI (FDR < 2.2 × 10⁻⁷) and HRD (FDR < 4.5 × 10⁻⁶ for LOH, <7.8 × 10⁻⁷ for AIL, <3.8 × 10⁻⁵ for LST and <2 × 10⁻¹ for mutational signature 3) (Supplementary Table 3)).
Similar to the NCI-MD cohort, we tested here for possible confounding by mislabeled self-reported race. We accessed the genotype information of 906,600 SNPs in matched peripheral blood mononuclear cells (PBMCs) that were downloaded from the controlled-access part of TCGA (Methods) and inferred unsupervised ancestry (Methods). The overall concordance of our computed inferred ancestry with self-reported ancestry was high (94.7%). Using this inferred ancestry, we removed the possibly misclassified samples and repeated the above analysis, with consistent significant results (Extended Data Fig. 9).
Next, we quantified CHTP in TCGA samples and observed that tumor samples with CHTP have significantly higher HRD than samples without CHTP (Wilcoxon rank-sum test, P < 3.2 × 10⁻¹⁰ for all five HRD markers) in both pan-cancer and cancer type specifically. Consistently, we observed a higher frequency of CHTP in tumors from AAs compared with EAs in pan-cancer samples (Fig. 5c; Fisher’s one-sided test, P < 0.028; OR = 1.25) and in LUSC samples from TCGA (Fig. 5c; P < 0.11; OR = 1.4). These patterns were consistent when adjusted for age, sex and stage (multivariate regression P for ancestry < 2.8 × 10⁻³), as well as when another CHTP definition was used (Methods). Similar to the NCI-MD cohort, we observed enrichment of CHTP on chromosome 12 among AAs in LUSC (Extended Data Fig. 2).
Tumors from AAs have a higher germline prevalence of HRD.
Given the higher prevalence of HRD in tumors from AAs across LUSC and pan-cancer, we asked whether the increase of HRD in tumors could be driven by germline factors. We accessed the TCGA database of germline pathogenic variants across 10,389 adult tumors30. This study30 performed whole-exome sequencing on PBMCs and then cataloged pathogenic variants (Methods). Using this dataset, we first counted the total number of pathogenic variants in homologous recombination genes (Supplementary Table 14) in each patient and defined it as germline HRD. Next, we asked whether AA patients have a higher extent of germline HRD than EA patients. In TCGA pan-cancer and LUSC, but not LUAD, we found that AAs had significantly higher germline HRD than EAs (Fig. 6, left (OR = 1.2; P < 0.02 for pan-cancer), Fig. 6, right (OR = 6; P < 8 × 10⁻⁴ for LUSC) and Extended Data Fig. 10 (P < 0.23 for LUAD)). Repeating this analysis in LUSC patients for individual genes of the homologous recombination pathway, we found predicted pathogenic variants in the canonical homologous recombination pathway genes BRCA1, BRCA2 and POLD1 to be enriched in AAs (Supplementary Table 14) (hypergeometric P < 0.15, 0.01 and 0.08, respectively). Similarly, in pan-cancer, we found predicted pathogenic variants of BARD1, FANCM, BRIP1, PALB2, POLD1 and BRCA2 to be more enriched in AA patients (P < 0.06, 0.12, 0.12, 0.19, 0.20 and 0.25, respectively). Since some of these genes are mutated in hereditary predisposition syndromes, it is possible that AAs in TCGA have a higher incidence of such syndromes. However, the known syndromes do not necessarily match the observed LUSC cancer type. BRCA2 mutations most commonly predispose to breast and ovarian cancers, although there is some evidence of association with lung cancer31. Mutations in POLD1 have been associated with colorectal cancer32, but not lung cancer, to our knowledge. We also found BLM and RECQL predicted pathogenic variants to be more enriched in EA patients (P < 0.06 and 0.22).
Fig. 6 |. Landscape of germline HRD across AA and EA patients in the pan-cancer and LuSC TCGA cohort.
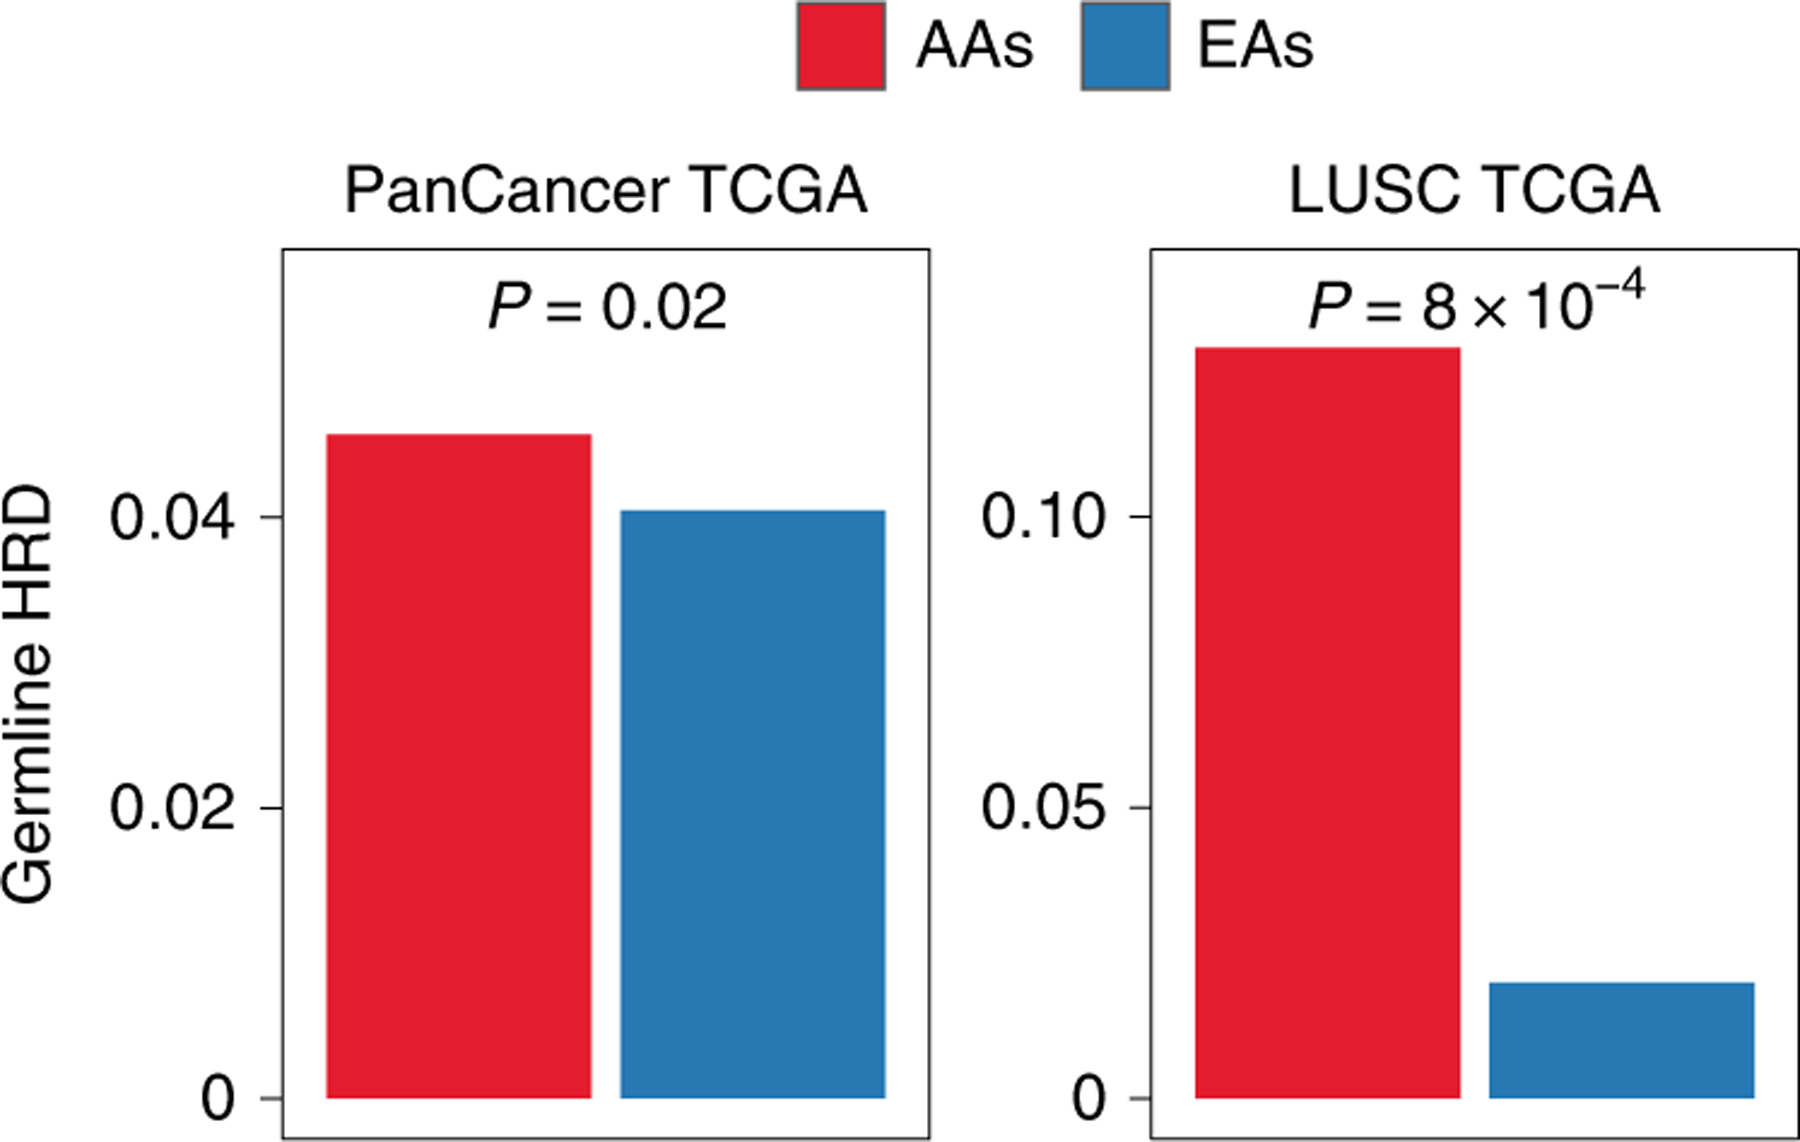
Prevalence of germline HRD in AAs and EAs, calculated using the total frequency of germline pathogenic variants in homologous recombination pathway genes in pan-cancer (left; n = 8,920 patients (AA = 919; EA = 8,001)) and LUSC (right; n = 382 patients (AA = 31; EA = 351)). Significance for the comparison of frequency of germline HRD was calculated via one-sided Fisher’s exact test. Exact P values are provided at the top of each plot.
Discussion
Here, we mapped molecular features of tumors from EAs and AAs across many cancer types, with greater depth and power in lung cancer. We observed that, consistent with previous reports2, GI is higher in AAs across multiple cancer types. This higher GI is unlikely to be related to the recently identified unmapped 10% of the genome that is found in populations of African ancestry3, as we found both copy-number gain- and copy-number loss-based GI to be higher in AAs. We hypothesized and confirmed that this higher GI is probably due to a higher prevalence of HRD in tumors from AAs. We also identified a significantly higher prevalence of mutational signature 3—closely associated with HRD27–29—among a wide range of tumors from AAs (Extended Data Fig. 8). We further show that tumors from AAs have a higher frequency of aggressive molecular features, including structural variants. HRD was not uniformly higher among AAs in some cancers, including kidney renal papillary cell carcinoma and kidney renal clear cell carcinoma, where HRD was significantly lower.
Higher SCNA-based GI and HRD in tumors from AAs raises the question of whether underlying defective DNA repair mechanisms could drive this observation. While HRD has been linked with germline and somatic mutations in BRCA1/2 (ref. 33), no striking differences in the somatic mutation frequencies of these genes have been demonstrated in cancer between EAs and AAs2,34. To investigate whether the increased HRD could be driven by a germline event, we analyzed germline pathogenic variants30 and identified a higher proportion of HRD-related pathogenic variants among AAs compared with EAs, suggesting that GI/HRD events and tumor evolution could be shaped by these features. The observation that several cancer types occur at an earlier age among AAs35, and evidence that germline pathogenic events are associated with early-onset disease30, are consistent with these data.
Higher HRD in LUSC and many other cancer types suggests that these tumors could respond to poly (ADP-ribose) polymerase inhibitors, and that perhaps AAs may be more likely to respond. Most trials do not report and/or are not powered to compare differences in response by ancestry group. Poly (ADP-ribose) polymerase inhibitors are not commonly used in lung cancer treatment, although in combination with chemotherapy they have shown promising efficacy in both cell lines36 and a clinical trial37. In the clinical trial, benefit from the combination treatment was primarily restricted to LUSC tumors. Furthermore, a recent retrospective analysis of clinical trial data found that response to platinum compounds and survival were significantly better in patients with hallmarks of HRD38. Thus, future preclinical and clinical studies could include biomarkers of HRD either in the study design or as a covariate in the data analysis.
Next, we identified multiple ancestry-specific chromosome alterations with unknown relevance, including chromosome 7p and 7q (with the AA frequency twice that of EAs). We also observed ancestry-specific patterns of co-occurrence and mutually exclusive events, and recurrent focal-region alterations. Furthermore, only one out of eight potential AA-specific driver regions identified in this study has a previously known driver gene (that is, KRAS). We also found AA-specific recurrent alterations previously linked with ancestry disparities in other cancer types39–41, including focal deletion of 4q35.2 comprising FBXW7, and amplification of oncogene KAT6A42 (18% in AAs versus 0% in EAs).
In summary, we have identified population differences in molecular features, including GI, HRD and CHTP. As these features are related to therapy response13,43,44, our findings could have therapeutic implications. We also find higher GI and HRD in LUSC among AAs and highlight some granular differences at the SCNA level in canonical lung cancer genes, such as CDKN2A, KRAS and PTEN. As our study used the same platform to compare SCNA events across EAs and AAs, it largely removes the possibility that technical artifacts could confound our observations. Defining these differences in both genome-wide and more focal regions highlights distinct differences in lung tumor biology between AAs and EAs and supports recent work showing that inherited variants, and thereby genetic ancestry, can shape tumor evolution at a molecular level and influence the somatic nature of a tumor45. Finally, our work highlights the importance of including under-represented populations in balanced genomic studies of molecular patterns and cancer evolution.
Methods
Statistics and reproducibility.
While generating genome-wide copy-number profiles of NCI-MD via OncoScan, two aliquots from the same sample were used to test the reproducibility of the assay for three samples by the company (available on reasonable request). In the NCI-MD study design, no statistical method was used to predetermine the sample size. In the additional cohort, TCGA, we mined the copy-number profiles of samples publicly available and excluded cancer types with fewer than five tumor samples of AA ancestry, to provide minimum statistical power. The experiments were not randomized. The investigators were not blinded to allocation during the experiments and outcome assessment, although samples were run on the OncoScan assay in a blinded manner.
The processed tables containing the data and R code used to produce our figures and conclusions are provided (see ‘Data availability’). In this work, we used non-parametric tests using R, including Wilcoxon rank-sum tests to compare the difference in medians, Fisher’s tests to compare frequency, and Spearman’s correlation, with an FDR-corrected P threshold of <0.1 indicating statistical significance. Wherever GISTIC was used, the FDR-corrected significance threshold of <0.1 was applied to identify significantly recurrent regions. While identifying CHTP, the distance between events on a chromosome was compared with the overall distance between events in the samples to identify clustered events using an FDR-corrected P threshold of <0.1.
Sample characteristics.
Patients living in the Baltimore metropolitan area with histologically confirmed cases of LUAD and LUSC were recruited prospectively to the ongoing NCI-MD Case-Control Study46. Institutional review boards at seven participating Baltimore hospitals and the NCI approved the study with written informed consent obtained from all patients. All samples were collected from an NCI Institutional Review Board-approved study. We conducted a retrospective study of eligible participants who self-reported as AA or EA, with non-Hispanic ethnicity. Additional clinical and sociodemographic data for each patient were obtained from medical records and pathology reports. Macro-dissected primary lung tumor tissues were obtained from patients directly after surgical removal. Samples were placed in collection tubes, flash frozen and stored at −80 °C until the OncoScan analyses were performed. Sample characteristics for the patients from whom tumor DNA was extracted can be found in Supplementary Table 1 (n = 142 for AA and 108 for EA).
DNA extraction.
DNA was extracted from fresh, frozen micro-dissected primary lung tumor tissues using the Qiagen DNeasy Blood and Tissue kit spin column procedure, according to the manufacturer’s protocol (Qiagen). Isolated primary lung tumor DNA was initially quantified using a DS-11 spectrophotometer (DeNovix). Subsequent Qubit fluorometer analyses were performed to assess DNA integrity and ensure the presence of intact double-stranded DNA in all samples (Invitrogen). DNA with an A260-to-A280 ratio between 1.8 and 2.0, a minimum concentration of 12 ng μl−1 and a total concentration of 80 ng was used for further analysis.
Genome-wide copy-number analysis and data quality control.
DNA samples were sent for genome-wide copy-number analysis using the Affymetrix OncoScan copy-number array and run according to protocols suggested by the manufacturer. The OncoScan array is based on molecular inversion probe technology and provides comprehensive high-resolution copy-number detection across the genome and at pan-cancer driver genes. OncoScan fluorescence array intensity (CEL) files were converted to OSCHP files using the hg19 reference (OncoScan_CNV.Ref103.na33.r1.REF_MODEL reference file included with the Affymetrix OncoScan Console software; version 1.3). Manual re-centering of samples was performed by adjusting the TuScan log2[R] using the OncoScan Console. Clonality analysis was performed with the Affymetrix OncoClone Composition tool.
Segmentation of NCI-MD and TCGA intensity files.
For these samples, Chromosome Suite Analysis was used for segmentation of intensity files at the default hyperparameters for output of segments with their copy number, log2[R] and B allele frequency information. For TCGA samples, level 3 segmented files were retrieved from the firehose pipeline where a consistent version of reference hg19 was used.
Quantification of GI.
Taking the output of segmentation results from the above method for every sample in NCI-MD where we had copy-number information for each segment, GI was defined by the ratio of the total length of regions with a copy number other than 2 to a constant of 3.3 × 10⁹, based on previous studies47,48. We repeated this calculation for TCGA samples where we only selected cancer types with at least five AA samples.
Quantification of HRD.
We identified five independent signatures to define somatic-level HRD (somatic HRD) across tumor samples; four used copy-number profiles and one used the mutation profile of the tumor. We also used one signature to identify germline-level HRD (germline HRD), using germline variants in blood samples of the patients (detailed methods below). Below, we describe each of them in detail.
Somatic HRD quantification.
Based on LOH regions.
Using the output of allele-specific segmentation, we identified and calculated a total sum of the number of LOH events (segments with only one allele) in each sample. Then, we normalized the value to be in the range 0–1 and termed it LOH HRD13,14.
Based on AIL regions.
Again using the output of segmentation, we identified and counted the sum of regions with allelic imbalance, an unequal allele copy number and extension to a sub-telomere without crossing the centromere. Again, we normalized the sum to be in the range 0–1 and termed the normalized sum AIL HRD.
Based on LST regions.
Here, also using the output of allele-specific segmentation, we identified and counted the total number of breakpoints between regions longer than 10 Mb after filtering out regions shorter than 3 Mb13. Again, we normalized the breakpoint counts to be in the range 0–1 and termed it LST HRD.
We defined the fourth method as (LOH HRD + AIL HRD + LST HRD)/3, scaled to 0–1, for each sample. The division by 3 puts the value in the range 0–1. These four signatures were quantified and used in both NCI-MD and TCGA samples.
Based on Mutation Signature.
Exposures for each sample (that is, the proportion of mutations assigned to mutation signature 3) were mined from mSignatureDB49—a database of mutation signatures for more than 15,000 tumor samples from more than 73 projects, where only TCGA samples are considered for calculations.
Germline HRD quantification.
Using the predicted pathogenic germline variant information in patients from TCGA30, we calculated the total number of pathogenic variants in HRD genes in each sample (Supplementary Table 14) and performed a Fisher’s exact test to identify whether AAs, compared with EAs, have a significantly higher frequency of pathogenic variants. We repeated this analysis for each HRD gene as well.
Purity and ploidy calculation.
Using the OncoClone tool provided by Affymetrix, which uses the algorithm ASCAT50, we computed the purity and ploidy of samples from the NCI-MD cohort (Supplementary Table 2). Furthermore, intratumor heterogeneity was calculated using the TuScan algorithm—a further extension of OncoClone.
Accessing variant calls of TCGA patients’ blood samples from the database of Genotypes and Phenotypes (dbGAP).
TCGA collection included non-tumor biospecimens (blood samples were preferred if available; otherwise, adjacent non-tumor samples were collected) from 10,224 patients. Informed consent for whole-genome sequencing was obtained under the authorization of local institutional review boards30. We requested permission for these data from dbGaP and, after it was received, downloaded the variants from the controlled-access part of the TCGA portal.
Quantification of CHTP.
With the aim of identifying whether an autosomal chromosome had undergone CHTP using SCNA profile data, we used four copy-number-based hallmark traits of regions that underwent CHTP. Some of these hallmarks of CHTP have evolved since the first description; hence, we used two partially overlapping hallmarks to identify CHTP, based on the conventional method20 and an alternative, more recent51,52 description. Chromosomes that had all four hallmark properties were considered to have undergone CHTP.
We modeled the four hallmarks of CHTP via two tests for each sample. First, we filtered for chromosomes with significantly more events than the sample’s background, derived from all other autosomes. Specifically, a chromosome had to have a higher number of copy-number events than the median number of copy-number events per chromosome in the sample. Second, for every chromosome that passed the first test, the distance between the event breakpoints on the chromosomes had to be significantly lower than the background distribution of copy-number event breakpoints within the rest of the chromosomes. To this end, we tested whether the distances between the breakpoints of events of a given chromosome were lower than the background distribution of distances between the breakpoints of events on the rest of the chromosomes. If not, we removed the terminal event with higher breakpoint distance from the penultimate and repeated the above step.
The above iteration was repeated for a chromosome until we found a region with greater than five events with significantly lower breakpoint distance (clustered, FDR-corrected P < 0.1) and the region comprised only one type of copy-number event (oscillatory copy-number state). We repeated the above steps with a single modification to model and detect CHTP based on the recent definition, where in a CHTP region two oscillatory copy-number states or two types of copy-number event can be present.
Association of copy-number change with expression.
For this study, total RNA sequencing was performed for 56 out of 222 samples with SCNA profiles (31 LUAD and 25 LUSC). The association of copy number with expression was calculated via a one-tailed Wilcoxon rank-sum test, where samples were divided into two categories by thresholding on the median gene copy number to test, in a genome-wide fashion for each gene, whether samples with a copy number higher than the gene median copy number in the cohort had expression significantly higher than the rest of the samples.
Focal and arm events by GISTIC.
Generating a copy-number map with focal- and arm-level events via GISTIC.
The GISTIC algorithm was used to find recurrent regions of amplification, deletion or LOH from the segmented file generated from Chromosome Suite Analysis. We used the following hyperparameter configuration throughout the study to find recurrent regions ‘--genegistic 1 --smallmem 1 --broad 1 --brlen 0.5 --conf 0.90 --armpeel 1 --savegene 1. Based on this configuration, a gene GISTIC algorithm was used where arm-level events were defined as aberrant regions with at least the length of half an arm, and regions below this threshold were defined as focal. The confidence level used to calculate the region was 0.90 and the q value was the default of 0.25.
Unsupervised ancestry inference via PCA for the NCI-MD cohort.
Genotypes for 217,611 SNPs were generated from the OncoScan OSCHP file via apt-tools for the samples from the NCI-MD cohort. We identified 46,217 SNVs likely to be associated with ancestry and not somatically acquired that were found to be present in at least 25% of the AAs or EAs in our cohort. In this matrix, where each row represents a patient and each column represents a SNP, we performed a PCA with rank two, constraining the number of principal components to two (Extended Data Fig. 1). Next, we performed a classification using the two principal components, using support vector classification with a linear kernel to identify two classes. The predominant self-reported race in the class was assigned to be its identity. These two classes were then tested for concordance with self-reported ancestry.
Unsupervised ancestry inference via PCA for the TCGA cohort.
Genotype information of 906,601 SNPs from the SNP6 array performed on matched PBMC samples of TCGA patients called using BirdSeed (a SNP genotyping algorithm) were downloaded. We requested permission for these data from dbGaP and, after receiving it, downloaded the variants from the controlled-access part of the TCGA portal. To infer ancestry, methods similar to those used by NCI-MD were employed, where after removing low-variance SNPs, we inferred 300,000 SNPs likely to be associated with ancestry that were found to be present in at least 25% of the AAs or EAs in our cohort. Following the methods described above for NCI-MD, we identified two classes of ancestry.
Statistical power analysis of TCGA samples from various populations.
We observed a negative correlation between the FDR-corrected significance for AAs having higher GI and the proportion of samples from AAs included per cancer type, which was higher than expected when permuted one million times (Spearman’s Rho = −0.34; P < 0.15; empirical P < 1 × 10⁻⁴), suggesting that under-representation of samples from AAs is a limiting factor in terms of statistical power when comparing these two populations in certain tumor types in TCGA.
Gain-and loss-based GI analysis.
For TCGA pan-cancer.
We calculated SCNA gain- and SCNA loss-based GI and consistently observed both GI measures to be higher in AAs (Wilcoxon rank-sum test, P < 5.2 × 10⁻⁶ and P < 1.5 × 10⁻⁶, respectively). Furthermore, the trend of higher GI was observed in 16 out of 23 cancer types for both SCNA gain- and SCNA loss-based GI (Extended Fig. 2a,b).
For NCI-MD LUSC.
SCNA gain- and SCNA loss-based GI was calculated for LUSC from the NCI-MD cohort. We observed only SCNA loss (Wilcoxon rank-sum test, P < 4.5 × 10⁻⁶) and not SCNA gain (Wilcoxon rank-sum test, P < 0.34) to be significantly higher in AAs (P < 4.5 × 10⁻⁶ and P < 0.34, respectively).
Qualitative characterization of NCI-MD cohort tumor samples.
Purity—the percentage of the tumor cell fraction within a sample—was successfully resolved in 194 out of 222 samples (Supplementary Table 2), for which the mean purity was 34%. LUSC tumor samples (38.5% mean purity) had a significantly higher (Wilcoxon rank-sum test, P < 0.009) purity than LUAD (30.5%), consistent with the purity differences observed for TCGA. The overall mean ploidy was 2.22.
Arm-level aberration frequency negatively correlated with the number of genes present on the chromosome arm (NCI-MD).
Broad-level events across chromosome arms were quantified and plotted against the number of proteins expressing genes. We observed a general trend of negative correlation between the frequency of an aberration on a chromosome arm and the number of genes present on the same arm (median Spearman’s Rho = 0.41).
Extended Data
Extended Data Fig. 1 |. Unsupervised inference of genetic ancestry of lung adenocarcinoma (LuAD) and lung squamous carcinoma (LuSC) tumor samples from the NCI-MD cohort (n=222 patients).
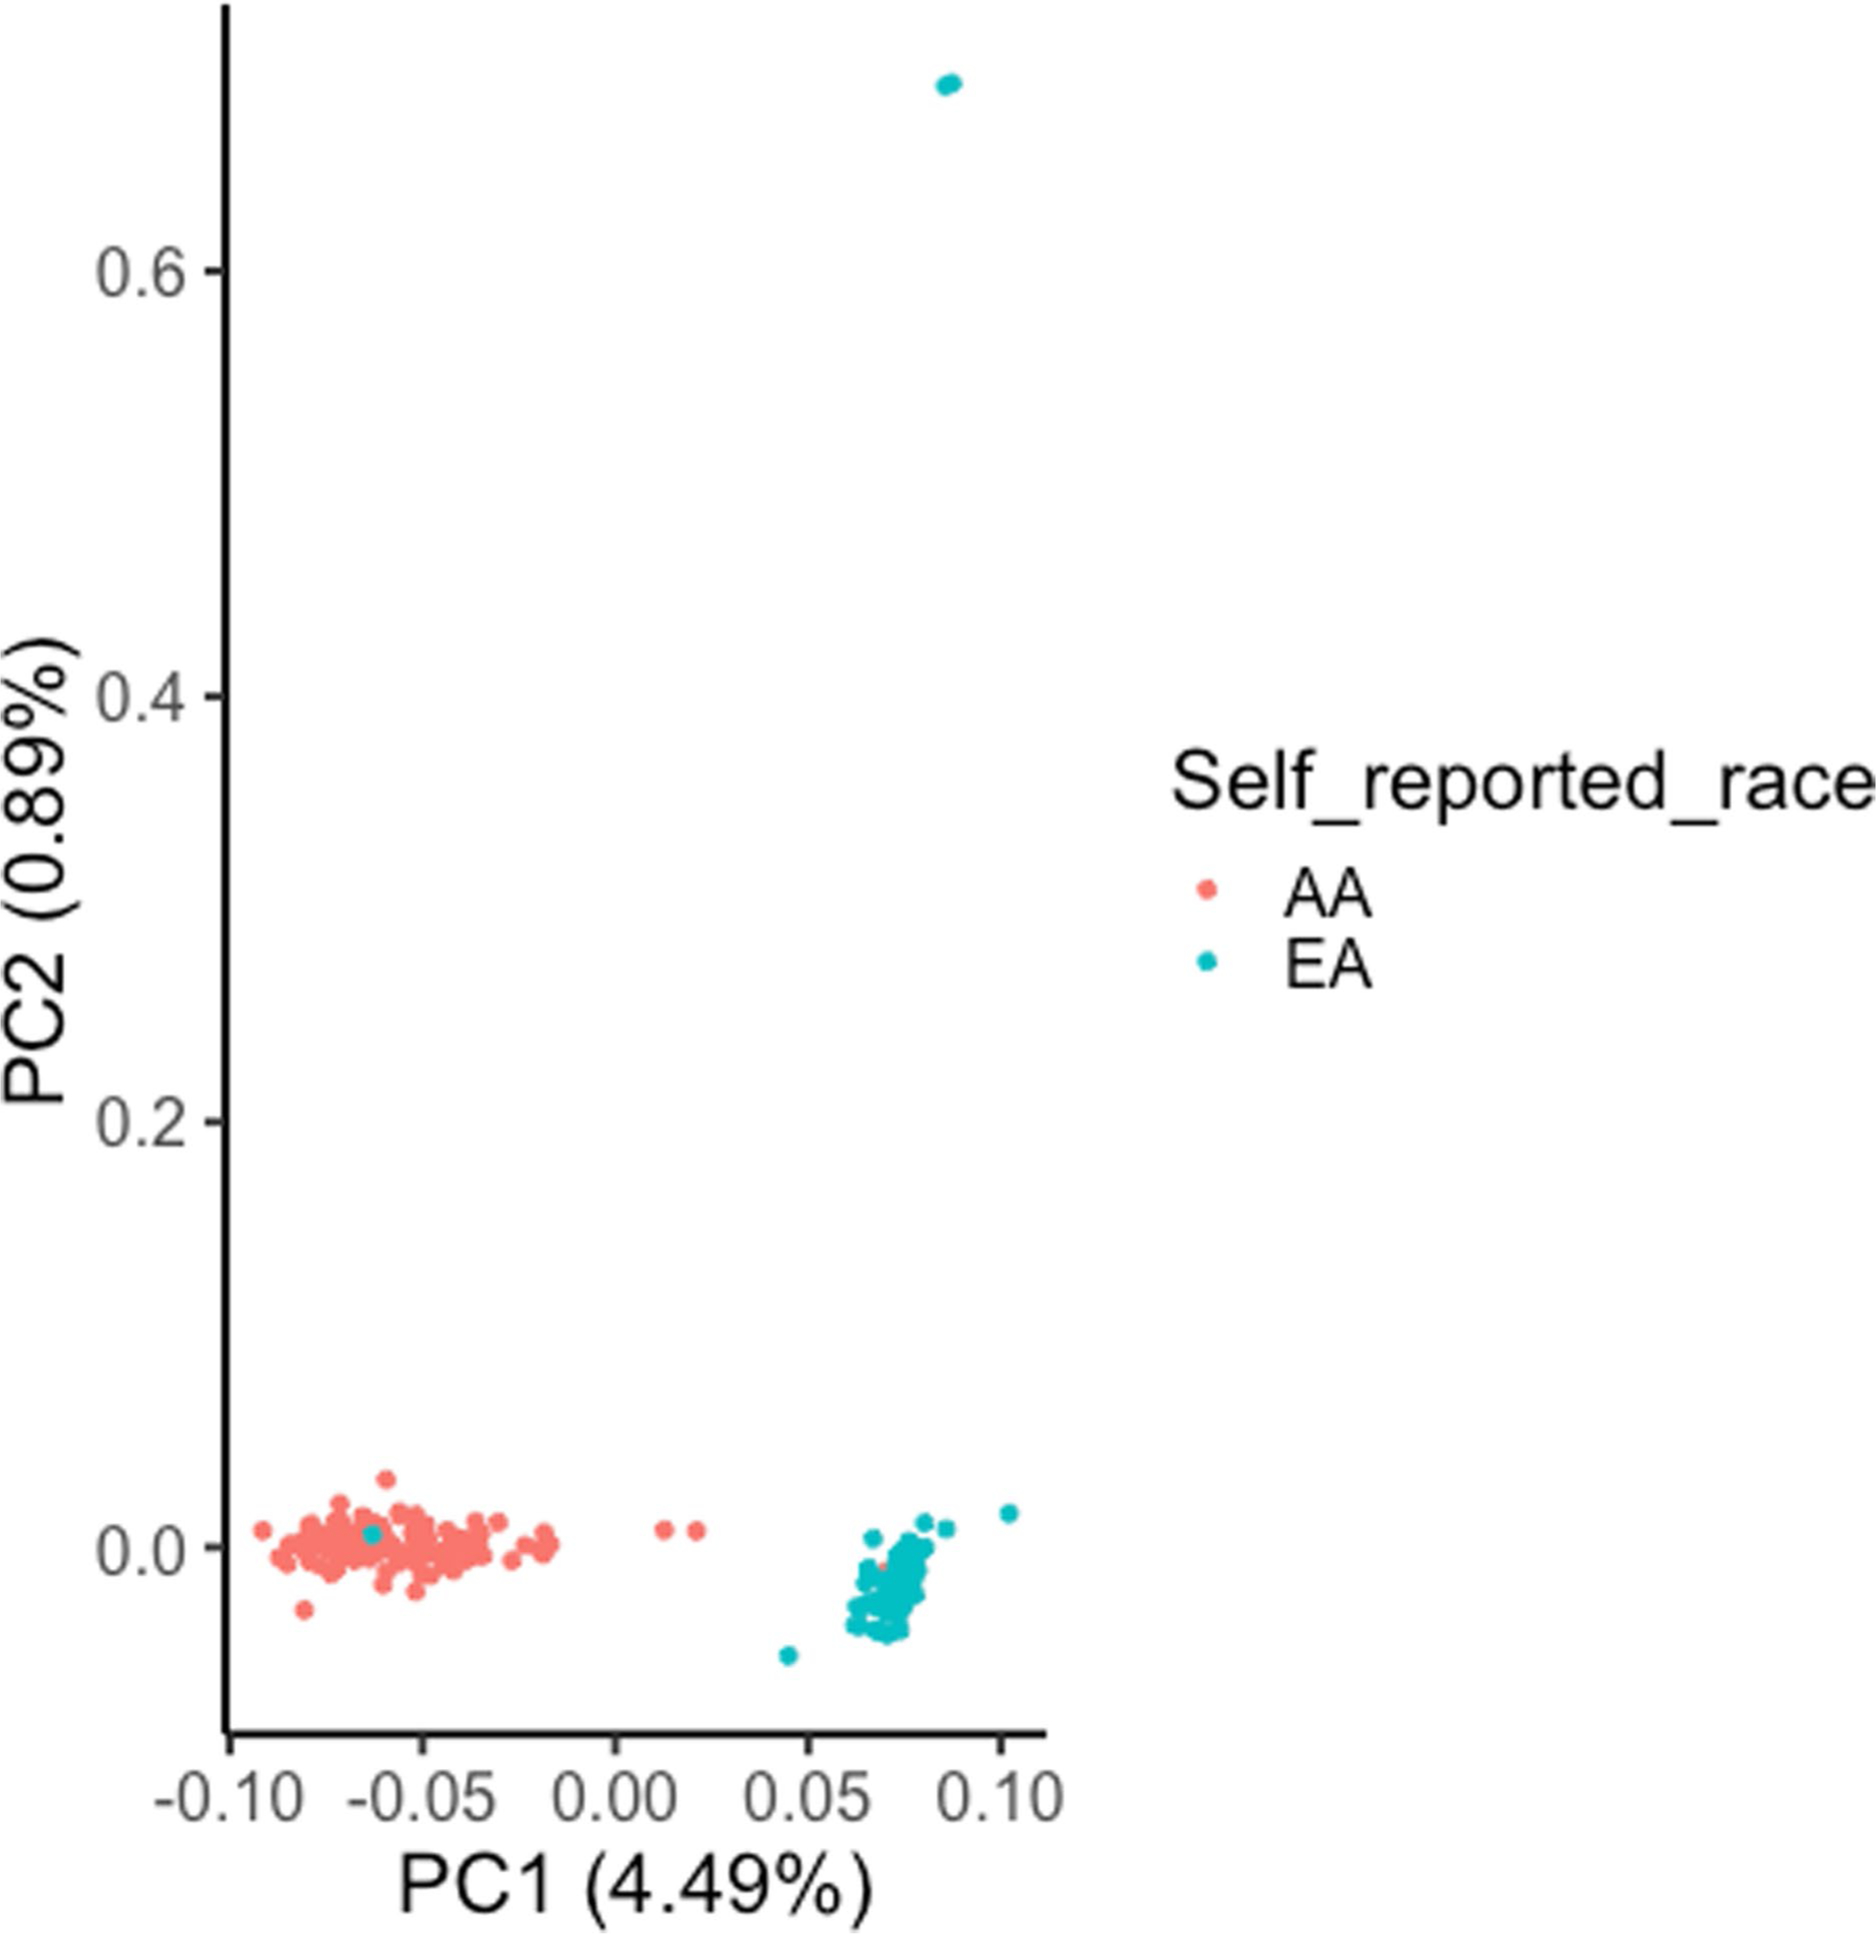
A principal component analysis (PCA) of ancestry-associated single nucleotide polymorphisms (SNPs) (46,217) was performed with rank=2 and the two PCs are shown here. These PCs were used in unsupervised clustering via support vector clustering (SVC) to identify two distinguishable clusters. For each cluster, the respective predominant self-reported race observed in the cluster was considered as the cluster ancestry identity, termed as inferred ancestry. This inferred ancestry is concordant with self-reported for 98.6% cases, where two AAs (African Americans) were potentially misclassified as EA (European American) and one EA as AA.
Extended Data Fig. 2 |. Chromothripsis (CHTP) in European Americans (EAs) and African Americans (AAs) and chromosome distribution in The Cancer Genome Atlas (TCGA) and NCI-MD cohorts.
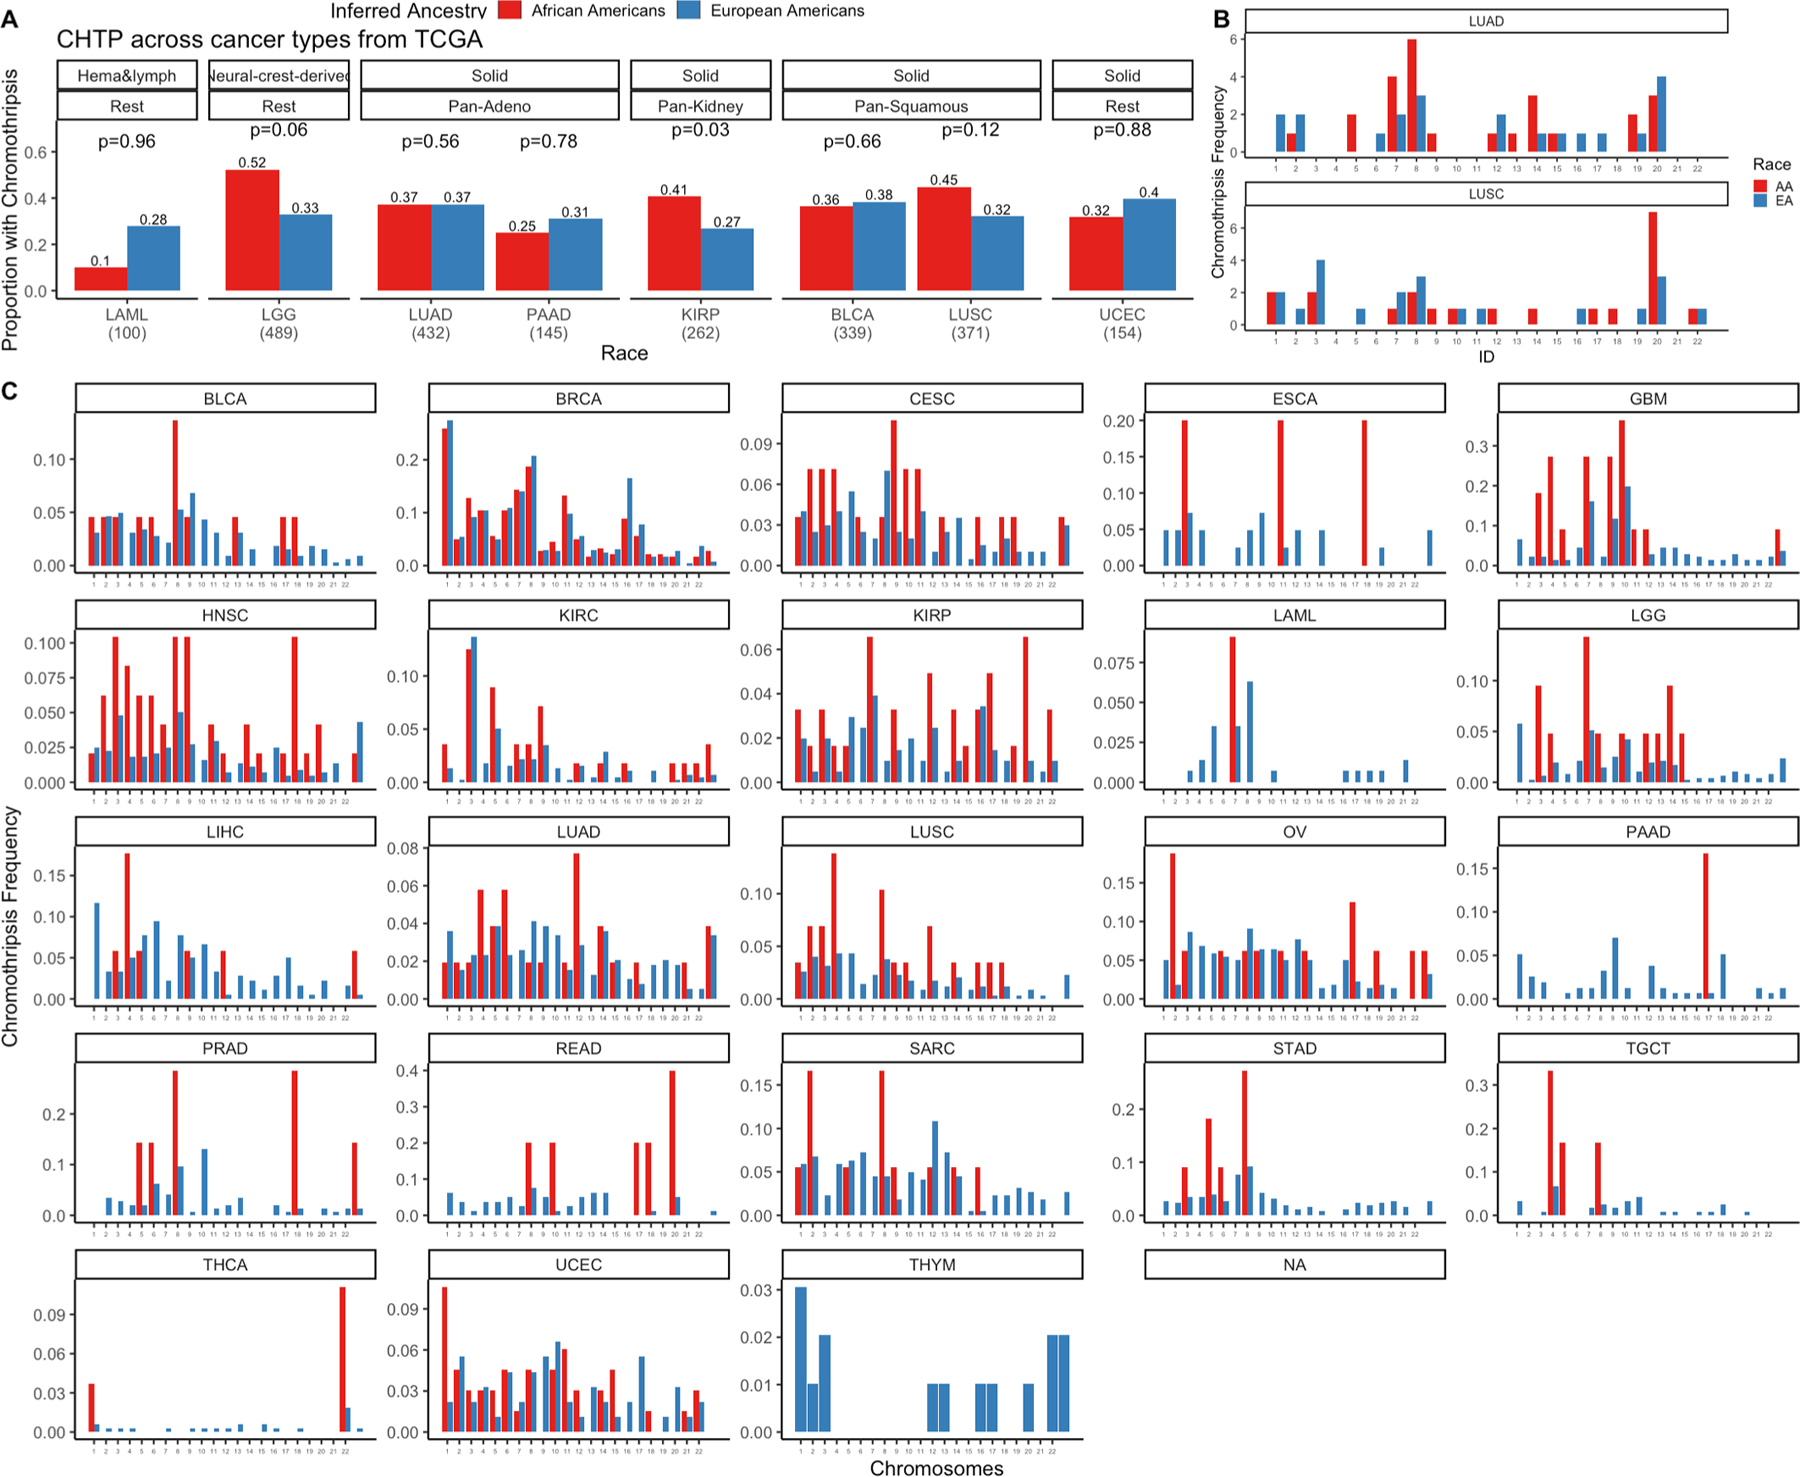
A) CHTP frequency distribution in AAs and EAs in various cancer types across TCGA. B) CHTP frequency across chromosomes for NCI-MD cohort in LUSC (lung squamous Carcinoma) and LUAD (lung adenocarcinoma). C) CHTP frequency across chromosomes for various cancer types in the TCGA cohort. In Panel A, a one-sided Fisher test has been performed to test whether chromothripsis frequency is higher in AAs or not.
Extended Data Fig. 3 |. Landscape of somatic copy number alterations frequencies of lung cancer driver genes in lung squamous carcinoma (LuSC) and lung adenocarcinoma (LuAD) from European Americans (EAs) and African Americans (AAs) in The Cancer Genome Atlas (TCGA).
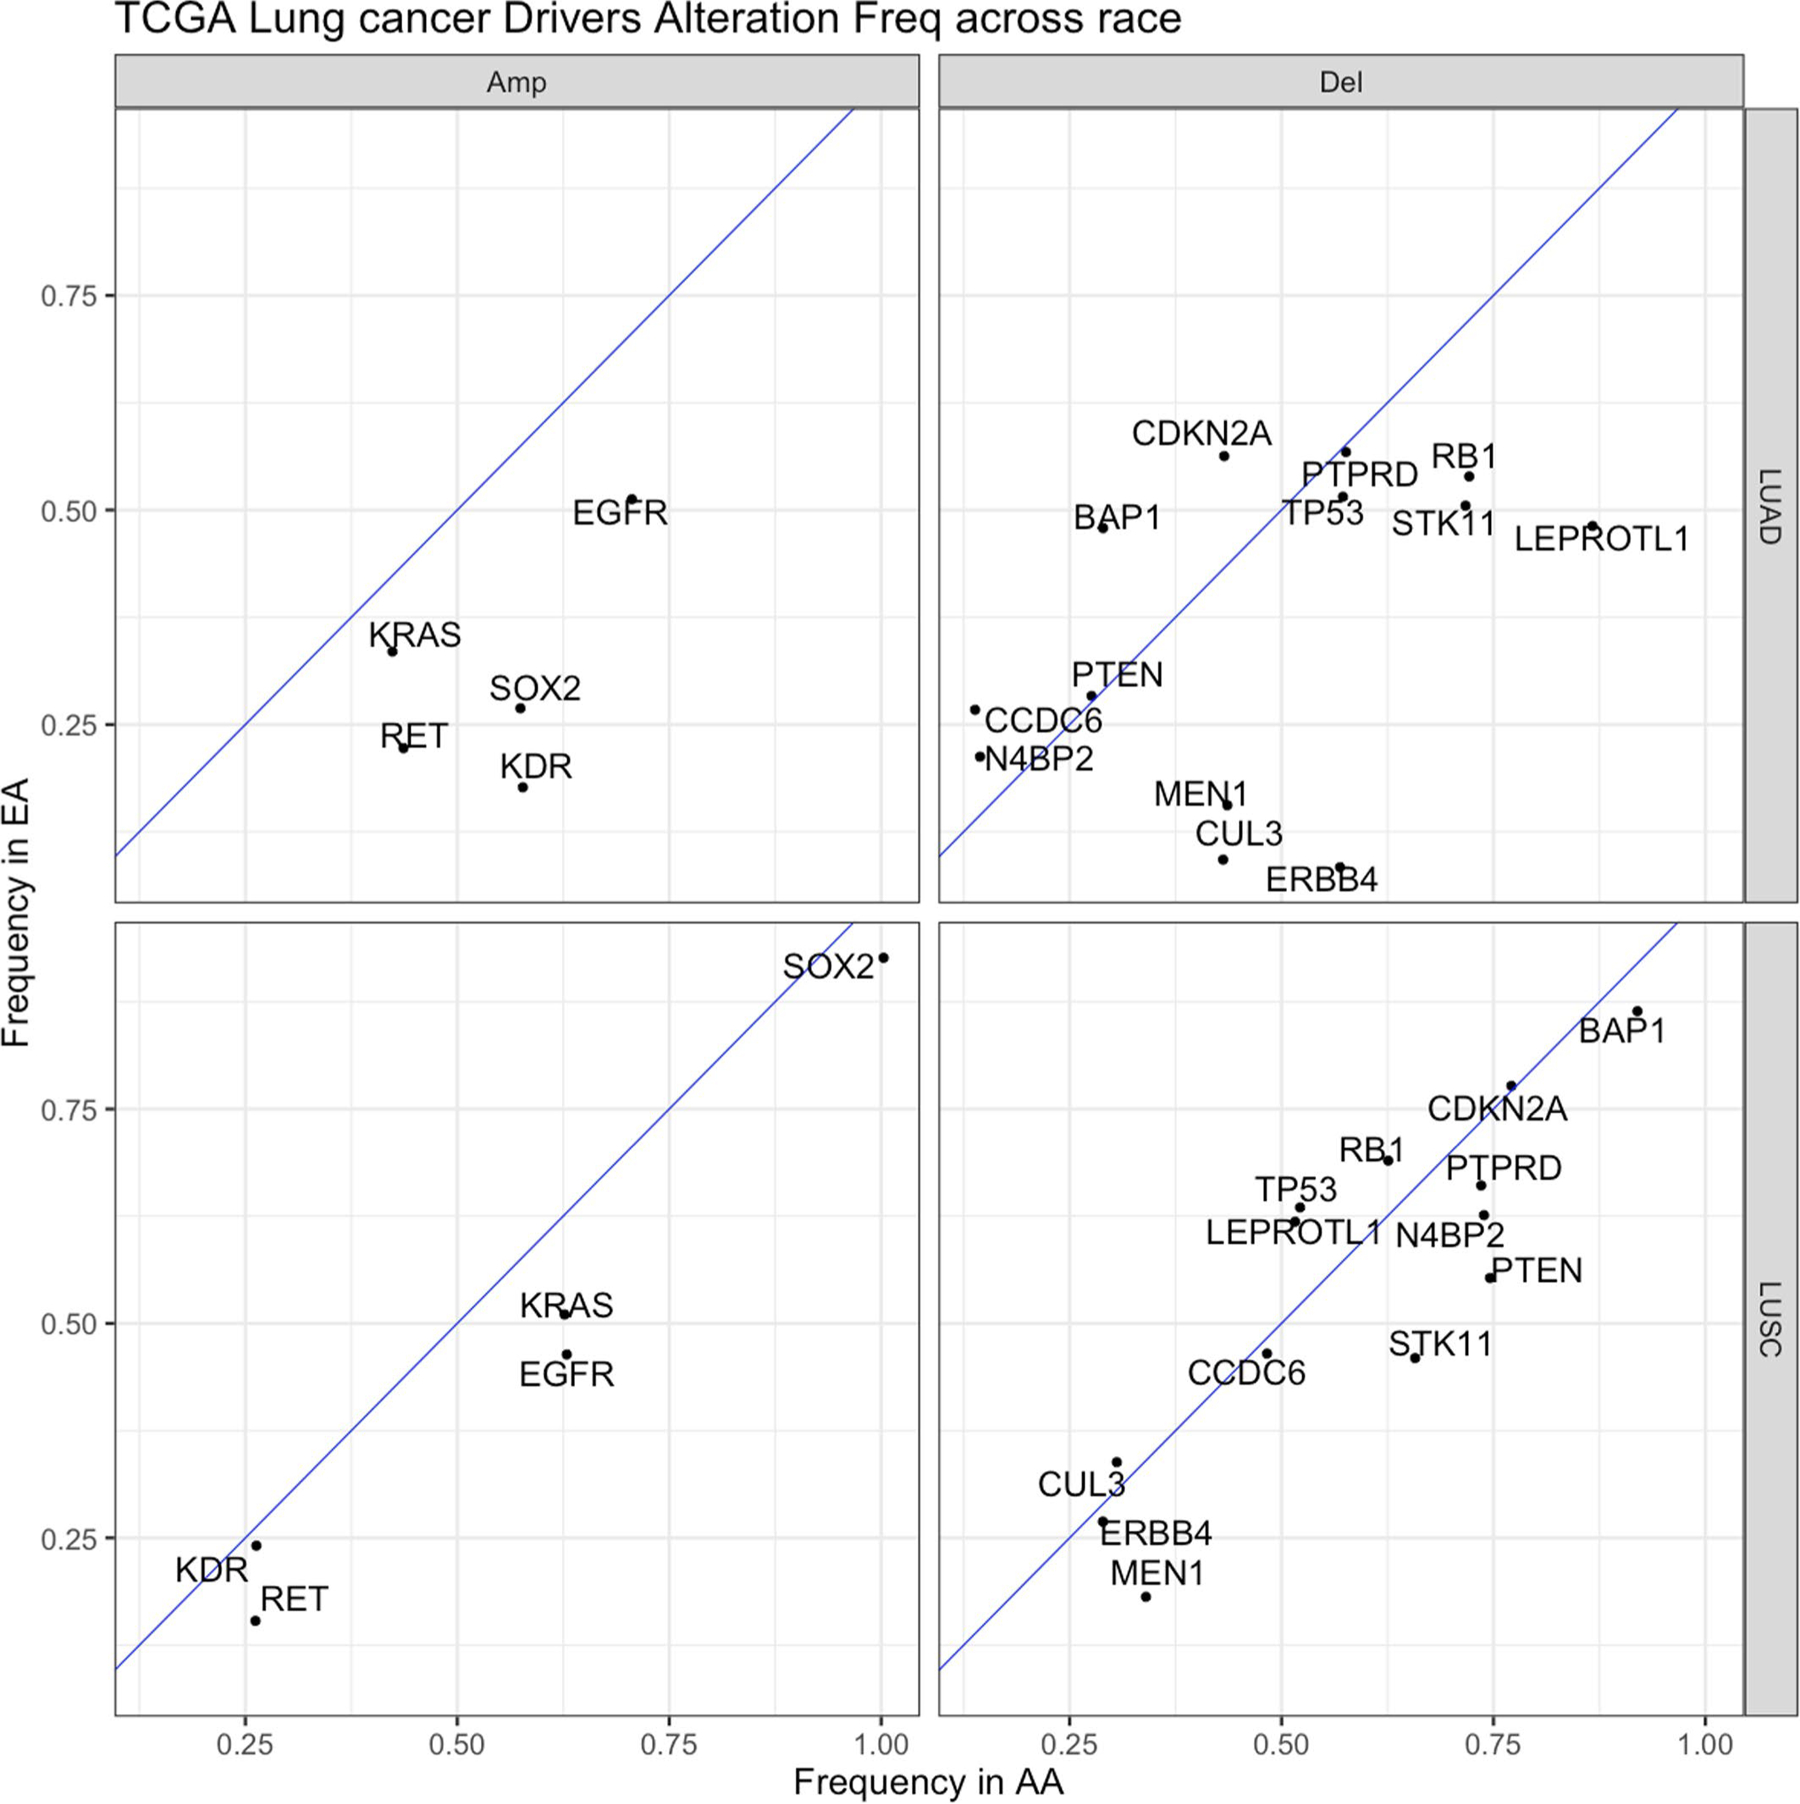
Frequencies in tumors from EAs and AAs with LUAD and LUSC from TCGA were plotted with the blue diagonal line as a null axis (no alteration frequency difference). The diagonal dashed line denotes the null line with points falling away from this line indicating chromosome arms with alteration frequency differences across populations. Del=deletion, Amp=amplification.
Extended Data Fig. 4 |. Effect of somatic copy number alteration (SCNA) on expression for cancer driver genes in the NCI-MD cohort (n=91 patients).
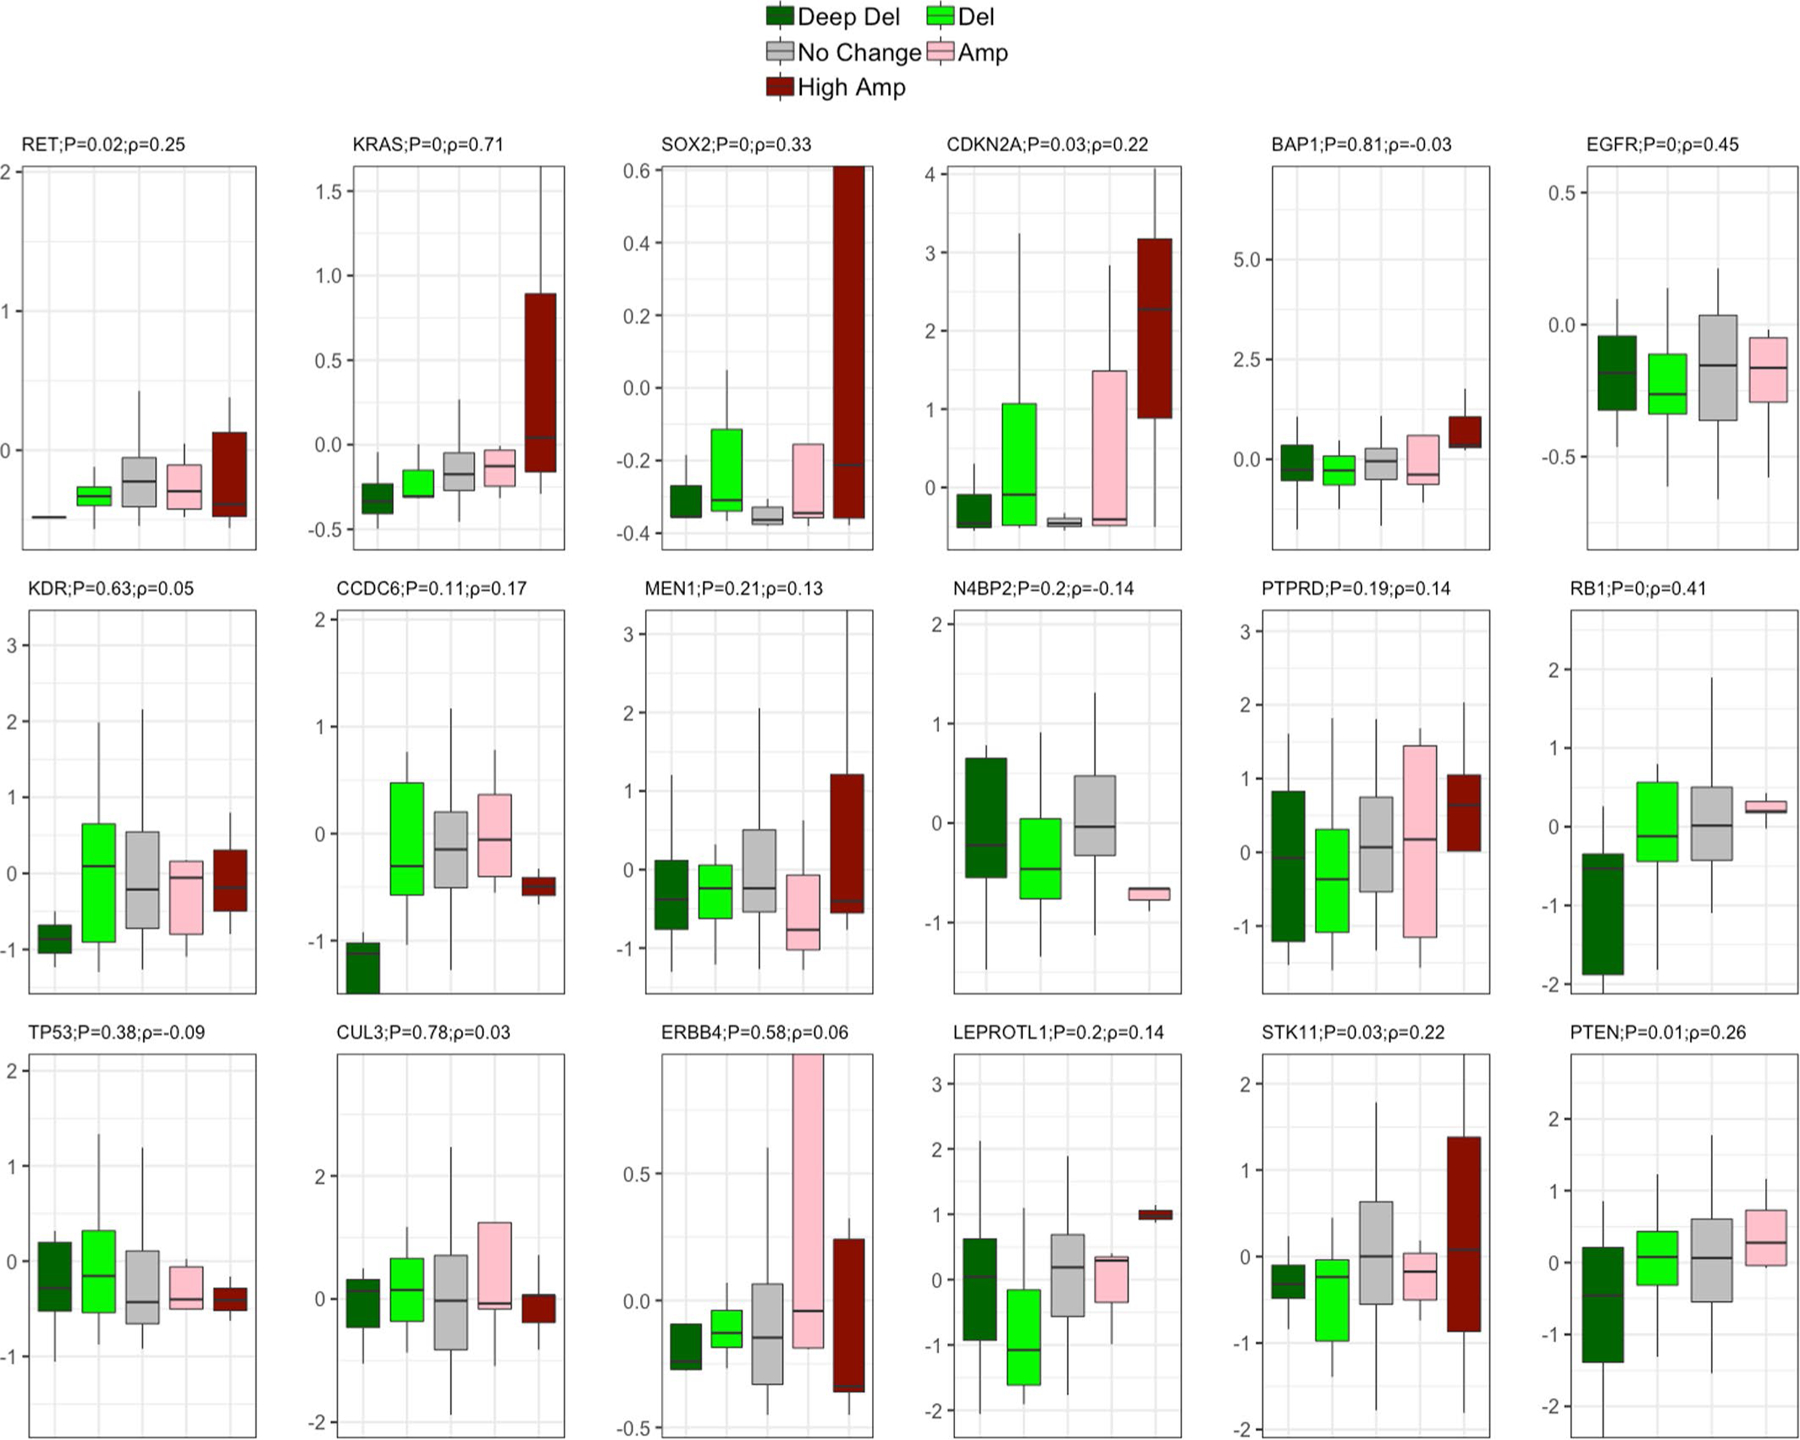
Effect of SCNA on expression for driver genes is plotted for lung cancer driver genes whose somatic copy number alteration frequency across populations are significantly different. Two-sided Spearman correlation significance with Rho is provided with the corresponding gene name before multiple testing correction. Here, in the box plot, the center line denotes the median, the box indicates the interquartile range and the black line represents the rest of the distribution, except for points that are determined to be “outliers”, 1.5 times the interquartile range.
Extended Data Fig. 5 |. Landscape of genomic instability (GI) in African Americans (AAs) and European Americans (EAs) in 23 cancer types from The Cancer Genome Atlas (TCGA) cohort.
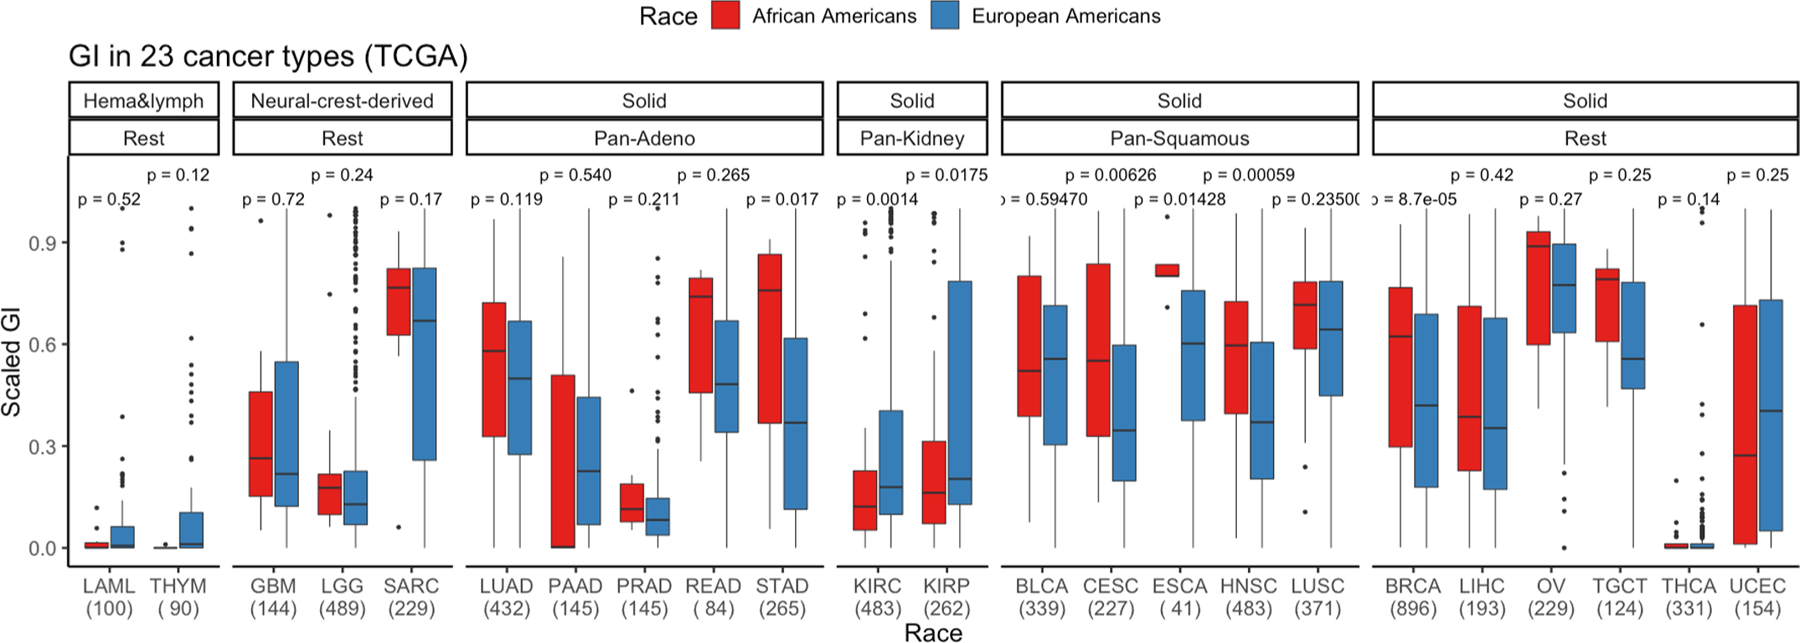
Here, GI is quantified and presented stratified by genetic ancestry for 23 cancer types where the sample size for each cancer type is provided on the x-axis. First, cancer types are categorized by cell type or tissue of origin, if possible, where defined groups are pan-squamous (squamous cell derived tumors), pan-adeno (glandular structures in epithelial tissue derived tumors), pan-kidney (tumors originating in the kidney), and rest (referring to cancer types that cannot be categorized and includes LAML, THYM, GBM, LGG, SARC, BRCA, LIHC, OV, TCGT, THCA and UCEC; Refer here for reference to each cancer type: https://gdc.cancer.gov/resources-tcga-users/tcga-code-tables/tcga-study-abbreviations). Second, additional categorization was performed based on tissue type (where solid is derived from solid tumors and neural-crest and Hema & Lymph—hematologic and lymphatic tumors). A two-sided Wilcoxon Rank-sum test has been performed within each cancer type and significance before multiple testing correction is provided. Here, in the box plot, the center line denotes the median, the box indicating the interquartile range and the black line represents the rest of the distribution, except for points that are determined to be “outliers”, 1.5 times the interquartile range.
Extended Data Fig. 6 |. Gain and loss genomic instability (GI) burden in European Americans (AAs) and European Americans (EAs) in 23 cancer types from The Cancer Genome Atlas (TCGA).
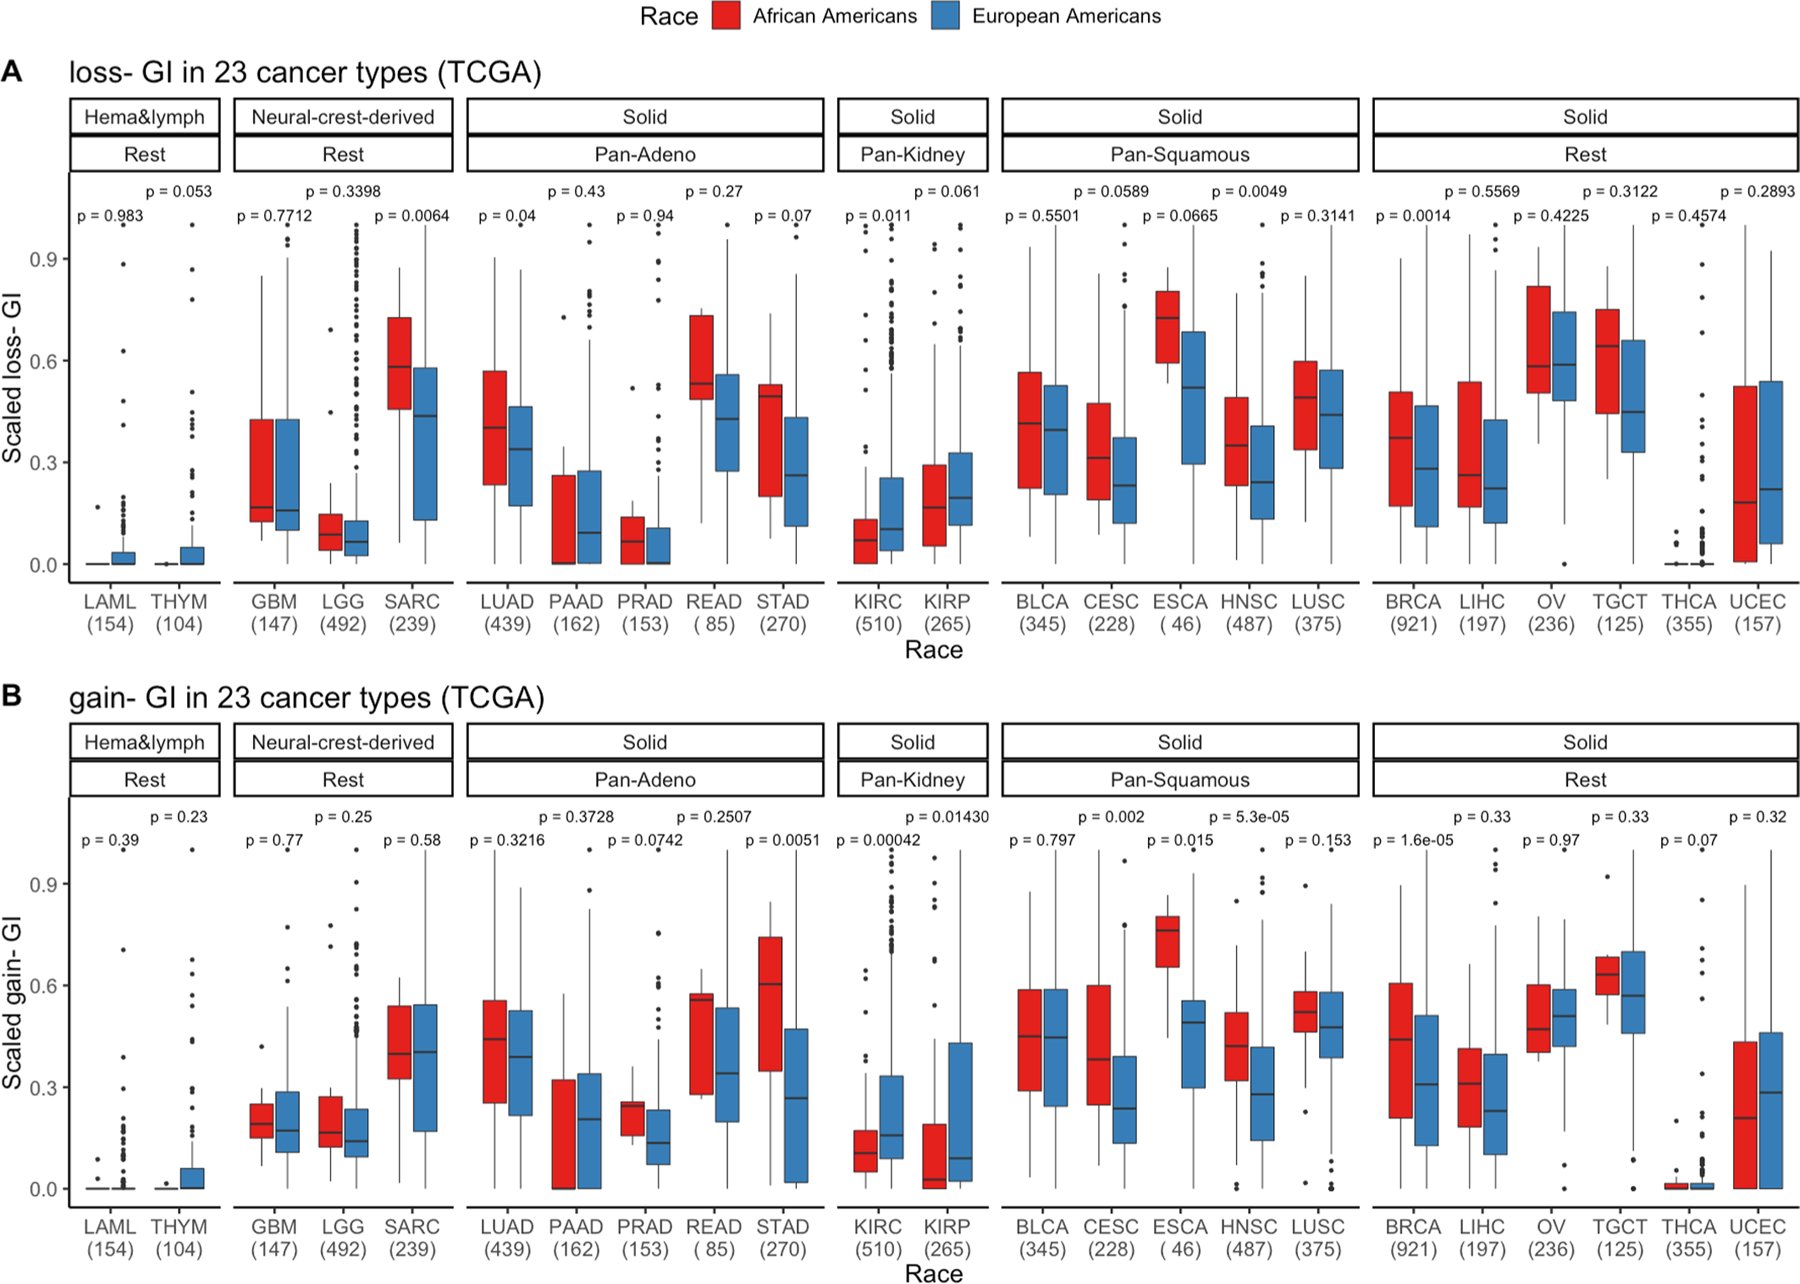
a, Somatic copy number alteration (SCNA)-gain and b SCNA-loss based GI are quantified and presented stratified by genetic ancestry for 23 cancer types in TCGA where sample size for each cancer type is provided on the x-axis. First, cancer types are categorized by cell type or tissue of origin, if possible, where defined groups are pan-squamous (squamous cell derived tumors), pan-adeno (glandular structures in epithelial tissue derived tumors), pan-kidney (tumors originating in the kidney), and rest (referring to cancer types that cannot be categorized and includes LAML, THYM, GBM, LGG, SARC, BRCA, LIHC, OV, TCGT, THCA and UCEC; Refer here for reference to cancer types: https/gdc.cancer.gov/resources-tcga-users/tcga-code-tables/tcga-study-abbreviations). Second, additional categorization was performed based on tissue type (where solid is derived from solid tumors and neural-crest and Hema & Lymph—hematologic and lymphatic tumors). A two-sided Wilcox Rank-sum test has been performed within each cancer type and significance before multiple testing correction is provided. Here, in the box plot, the center line denotes the median, the box indicates the interquartile range and the black line represents the rest of the distribution, except for points that are determined to be “outliers”, 1.5 times the interquartile range.
Extended Data Fig. 7 |. Various measures of homologous recombination deficiency (HRD) in pan-cancer in European Americans (EAs) and African Americans (AAs) from The Cancer Genome Atlas (TCGA) (total N=6,966 patients; [AA=770, EA=6,196]).
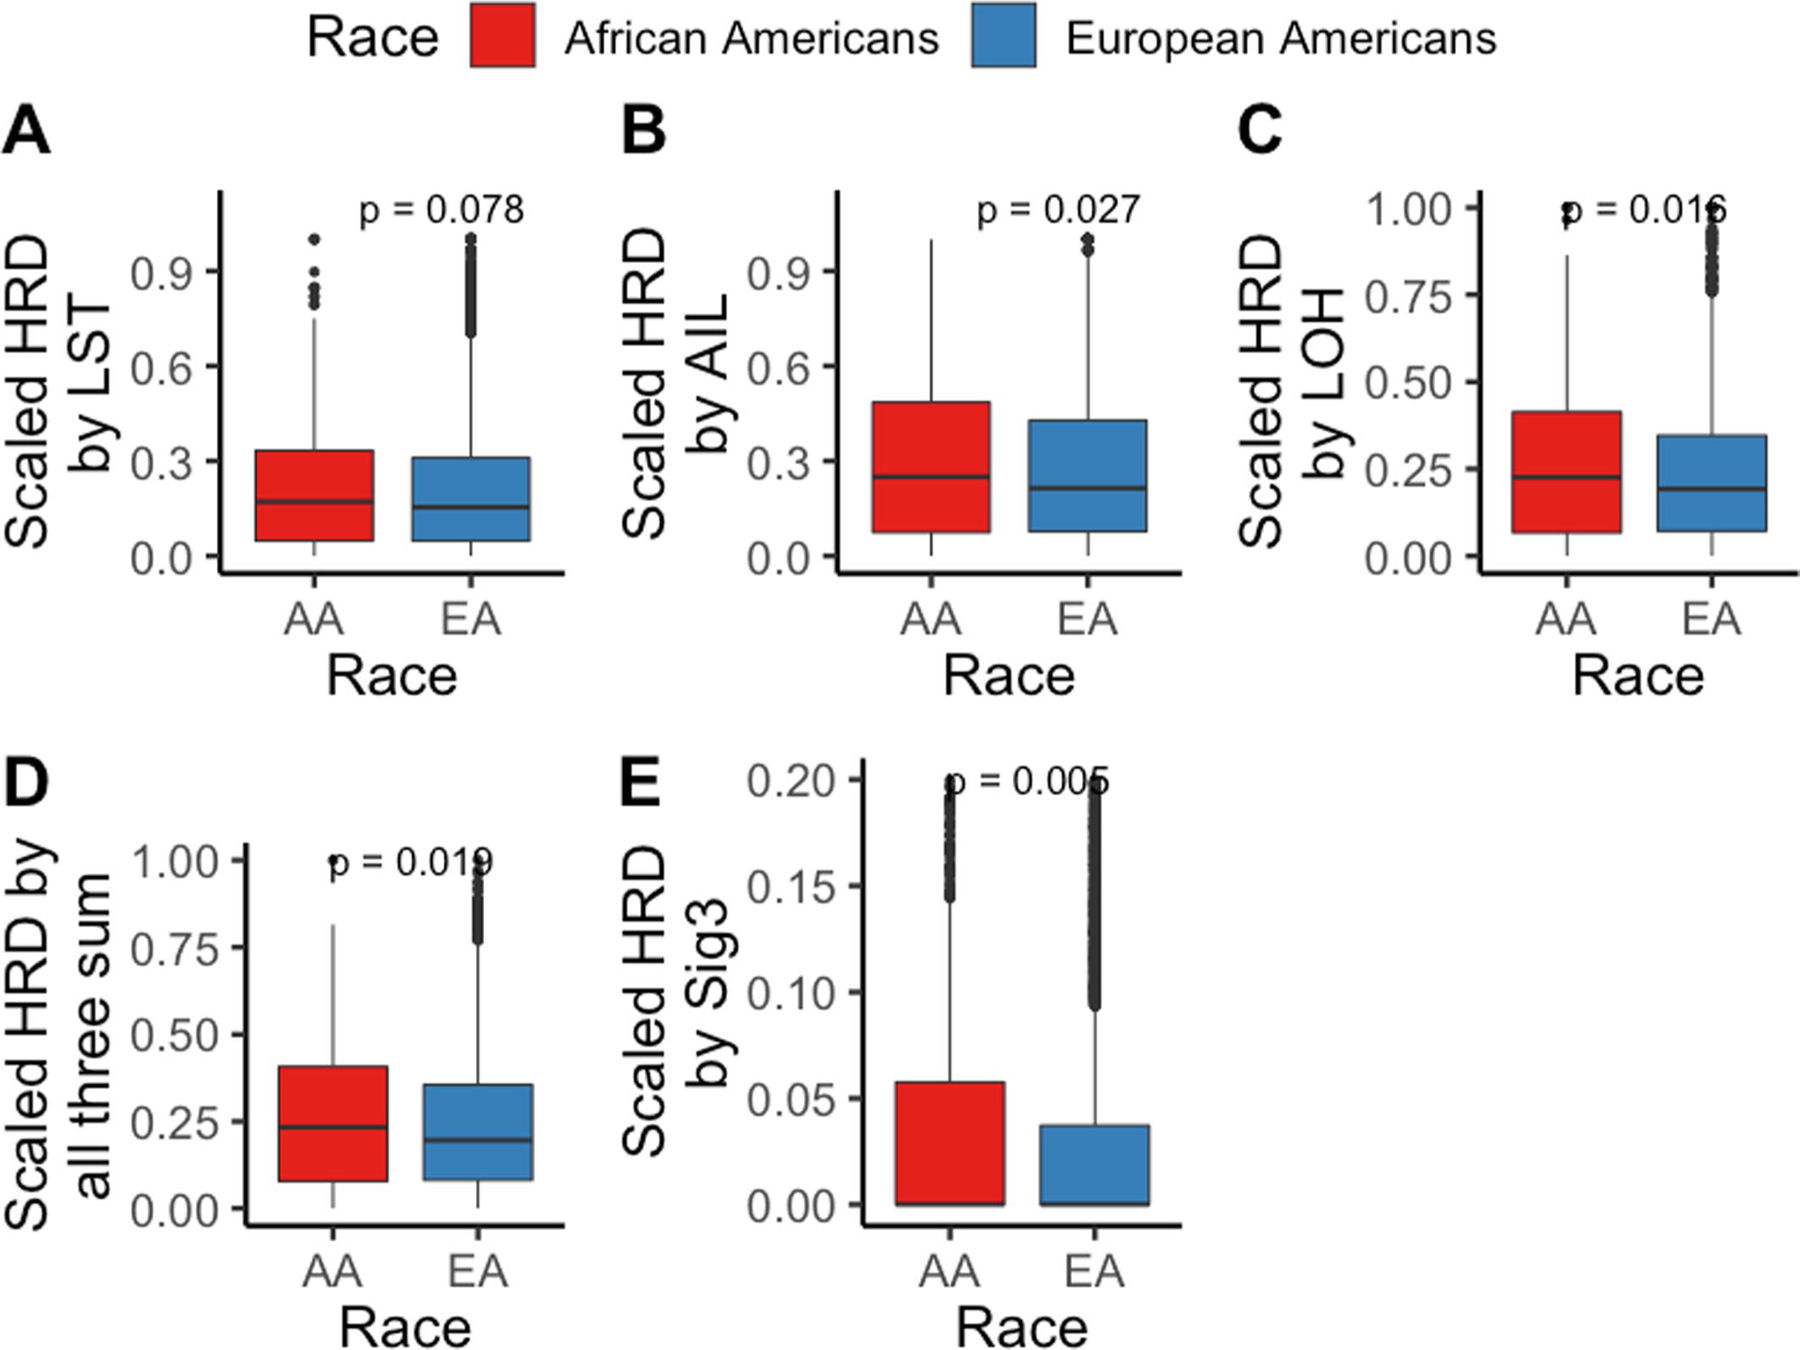
HRD is quantified and presented via score based on (a) number of Loss of heterozygosity (LOH) events, (b) telomere allelic imbalance (AIL), (c) large-scale state transitions (LST), (d) sum of previous three defined as “genomic scar” and (e) mutation signature 3 contribution. A one-sided Wilcoxon Rank-sum test has been performed to test whether HRD in tumors from AAs is higher than in EAs. Here, in the box plot, the center line denotes the median, the box indicates the interquartile range and the black line represents the rest of the distribution, except for points that are determined to be “outliers”, 1.5 times the interquartile range.
Extended Data Fig. 8 |. Various measures of homologous recombination deficiency (HRD) across 23 cancer types in European Americans (EAs) and African Americans (AAs) from The Cancer Genome Atlas (TCGA).
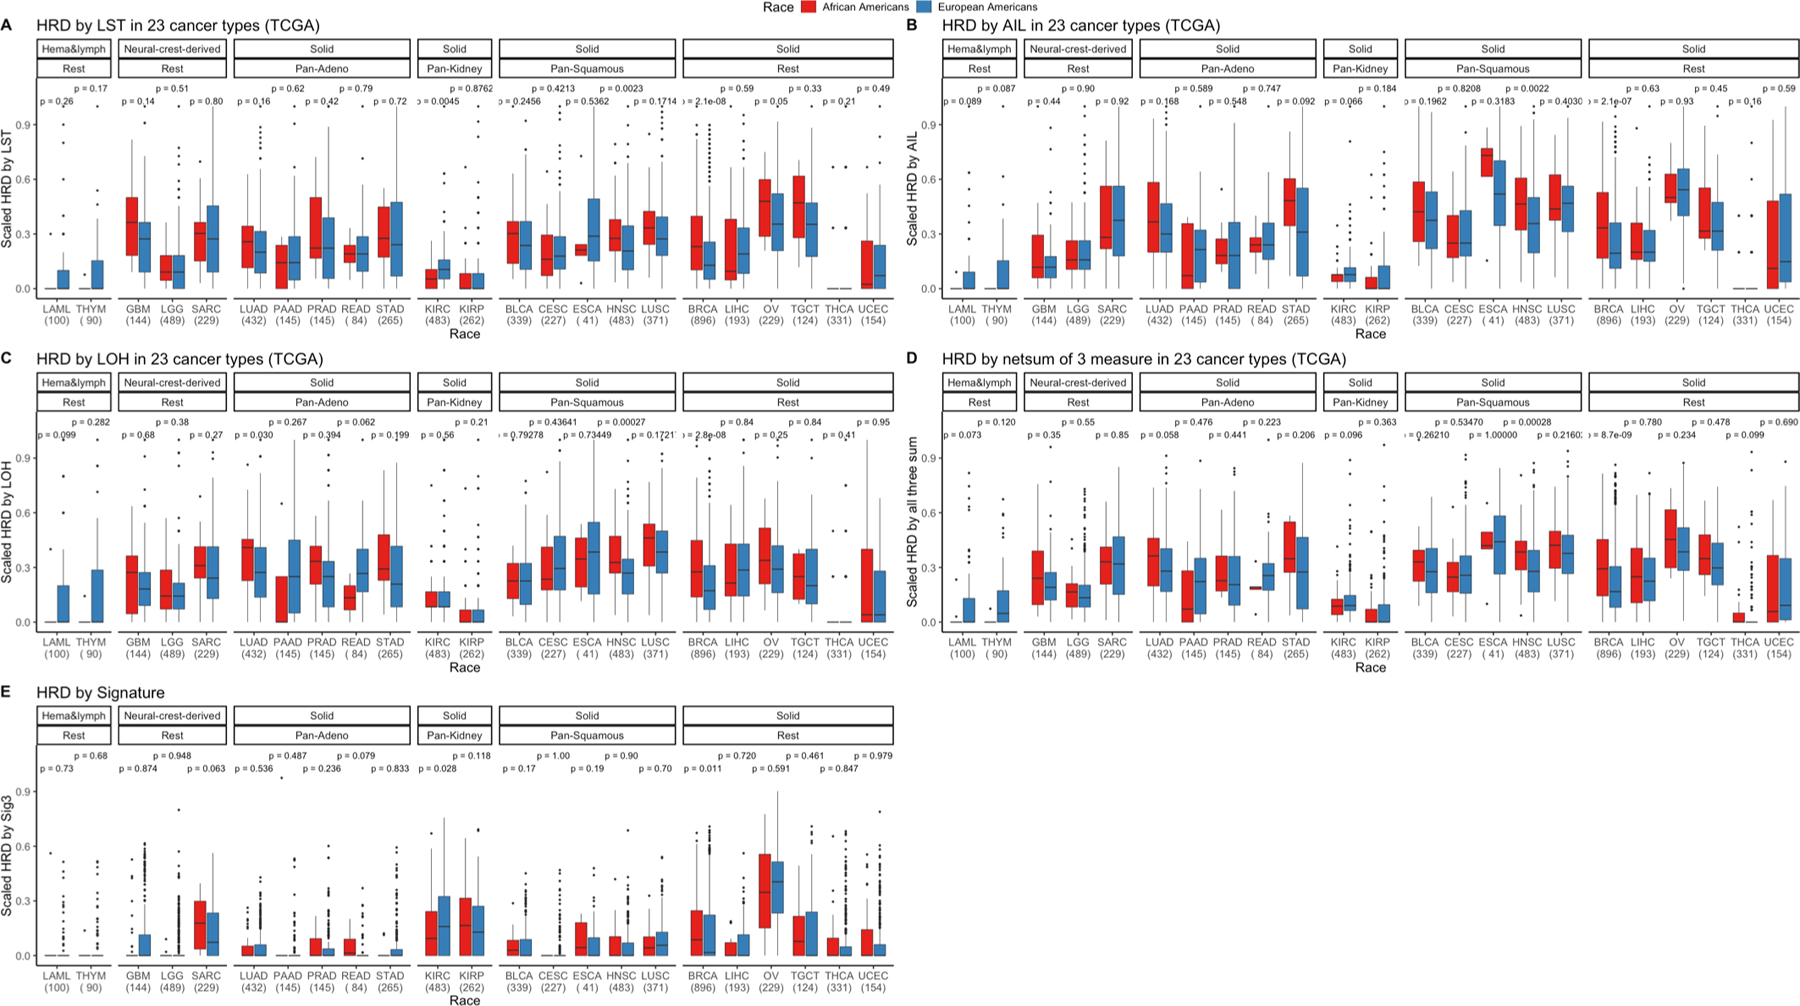
HRD is quantified and presented via various scores. a, Number of (loss of heterozygosity) LOH events, (b) telomere allelic imbalance (AIL), (c) large-scale state transitions (LST), (d) scaled net sum of previous three defined as “genomic scar” and (e) mutation signature 3 contribution in AAs and EAs in various cancer types in TCGA where sample size for each cancer type is provided on the x-axis. First, cancer types are categorized by cell type or tissue of origin, if possible, where defined groups are pan-squamous (squamous cell derived tumors), pan-adeno (glandular structures in epithelial tissue derived tumors), pan-kidney (tumors originating in the kidney), and rest (referring to cancer types that cannot be categorized and includes LAML, THYM, GBM, LGG, SARC, BRCA, LIHC, OV, TCGT, THCA and UCEC; Refer here for reference to cancer types: https://gdc.cancer.gov/resources-tcga-users/tcga-code-tables/tcga-study-abbreviations). Second, additional categorization was performed based on tissue type (where solid is derived from solid tumors and neural-crest and Hema & Lymph—hematologic and lymphatic tumors). One-sided Wilcox Rank-sum test has been performed within each cancer type to test whether HRD is higher in AA than EA and significance before multiple testing correction is provided. Here, in the box plot, the center line denotes the median, the box indicates the interquartile range and the black line represents the rest of the distribution, except for points that are determined to be “outliers”, 1.5 times the interquartile range.
Extended Data Fig. 9 |. Genomic instability (GI), homologous recombination deficiency (HRD) and Chromothripsis (CHTP) across the cancer Genome Atlas (TCGA) with race classified by inferred ancestry.
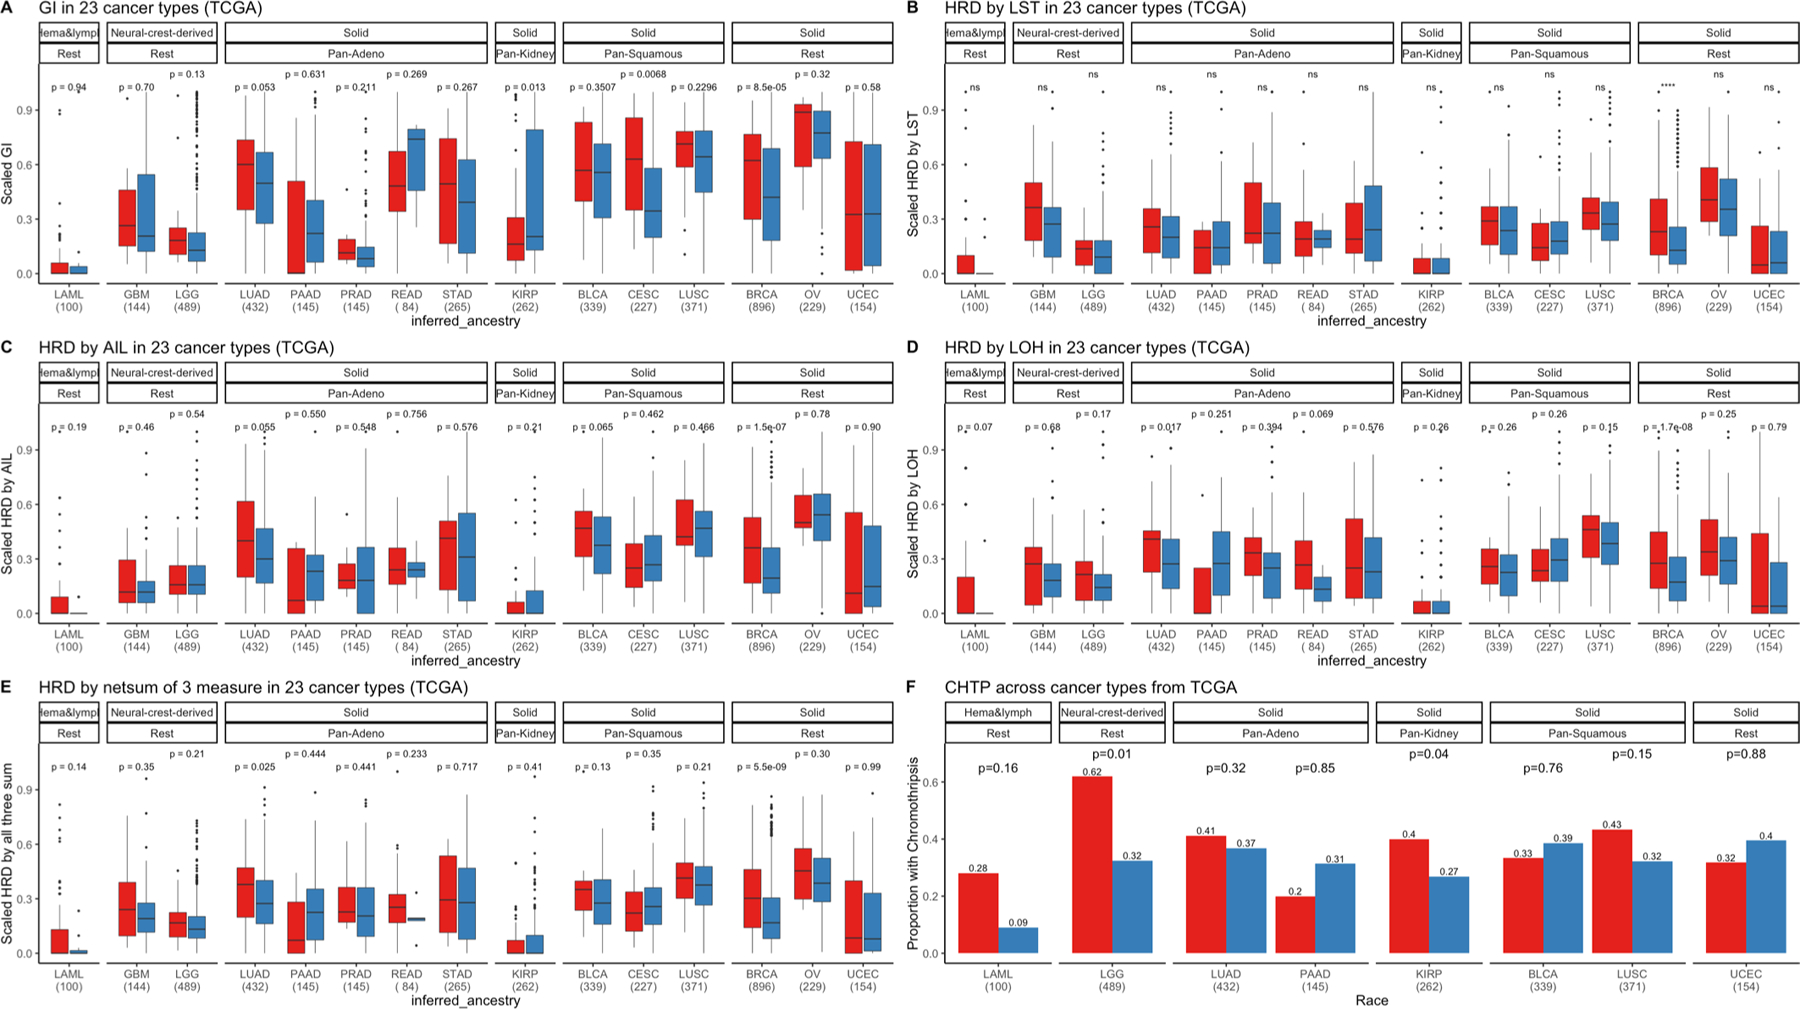
a, HRD based on number large-scale state transitions (LST) (b), telomere allelic Imbalance (AIL) (c), number of LOH events (d) and scaled net sum of previous three defined as “genomic scar” (e), and CHTP (f) Is quantified and presented In European Americans (EAs) and African Americans (AAs) in various cancer types in TCGA where sample size for each cancer type is provided on the x-axis. First, cancer types are categorized by cell type or tissue of origin, if possible, where defined groups are pan-squamous (squamous cell derived tumors), panadeno (glandular structures in epithelial tissue derived tumors), pan-kidney (tumors originating in the kidney), and rest (referring to cancer types that cannot be categorized and includes LAML, GBM, LGG, BRCA, OV, and UCEC). Refer here for reference to cancer types for reference: https://gdc.cancer.gov/resources-tcga-users/tcga-code-tables/tcga-study-abbreviations). Second, additional categorization was performed based on tissue type (where solid is derived from solid tumors and neural-crest and Hema & Lymph—hematologic and lymphatic tumors). Across, panels a-e, two-sided Wilcoxon Rank-sum test has been performed for each cancer type and significance before multiple testing correction is provided. In the corresponding panels, the box plot, the center line denotes the median, the box indicates the interquartile range and the black line represents the rest of the distribution, except for points that are determined to be “outliers”, 1.5 times the interquartile range. In panel f, one-sided Fisher test has been performed to test whether chromothripsis frequency is higher in AA or not.
Extended Data Fig. 10 |. Prevalence of germline homologous recombination deficiency (HRD) proportion in European Americans (EAs) and African Americans (AAs) patients from the cancer Genome Atlas (TCGA) cohort.
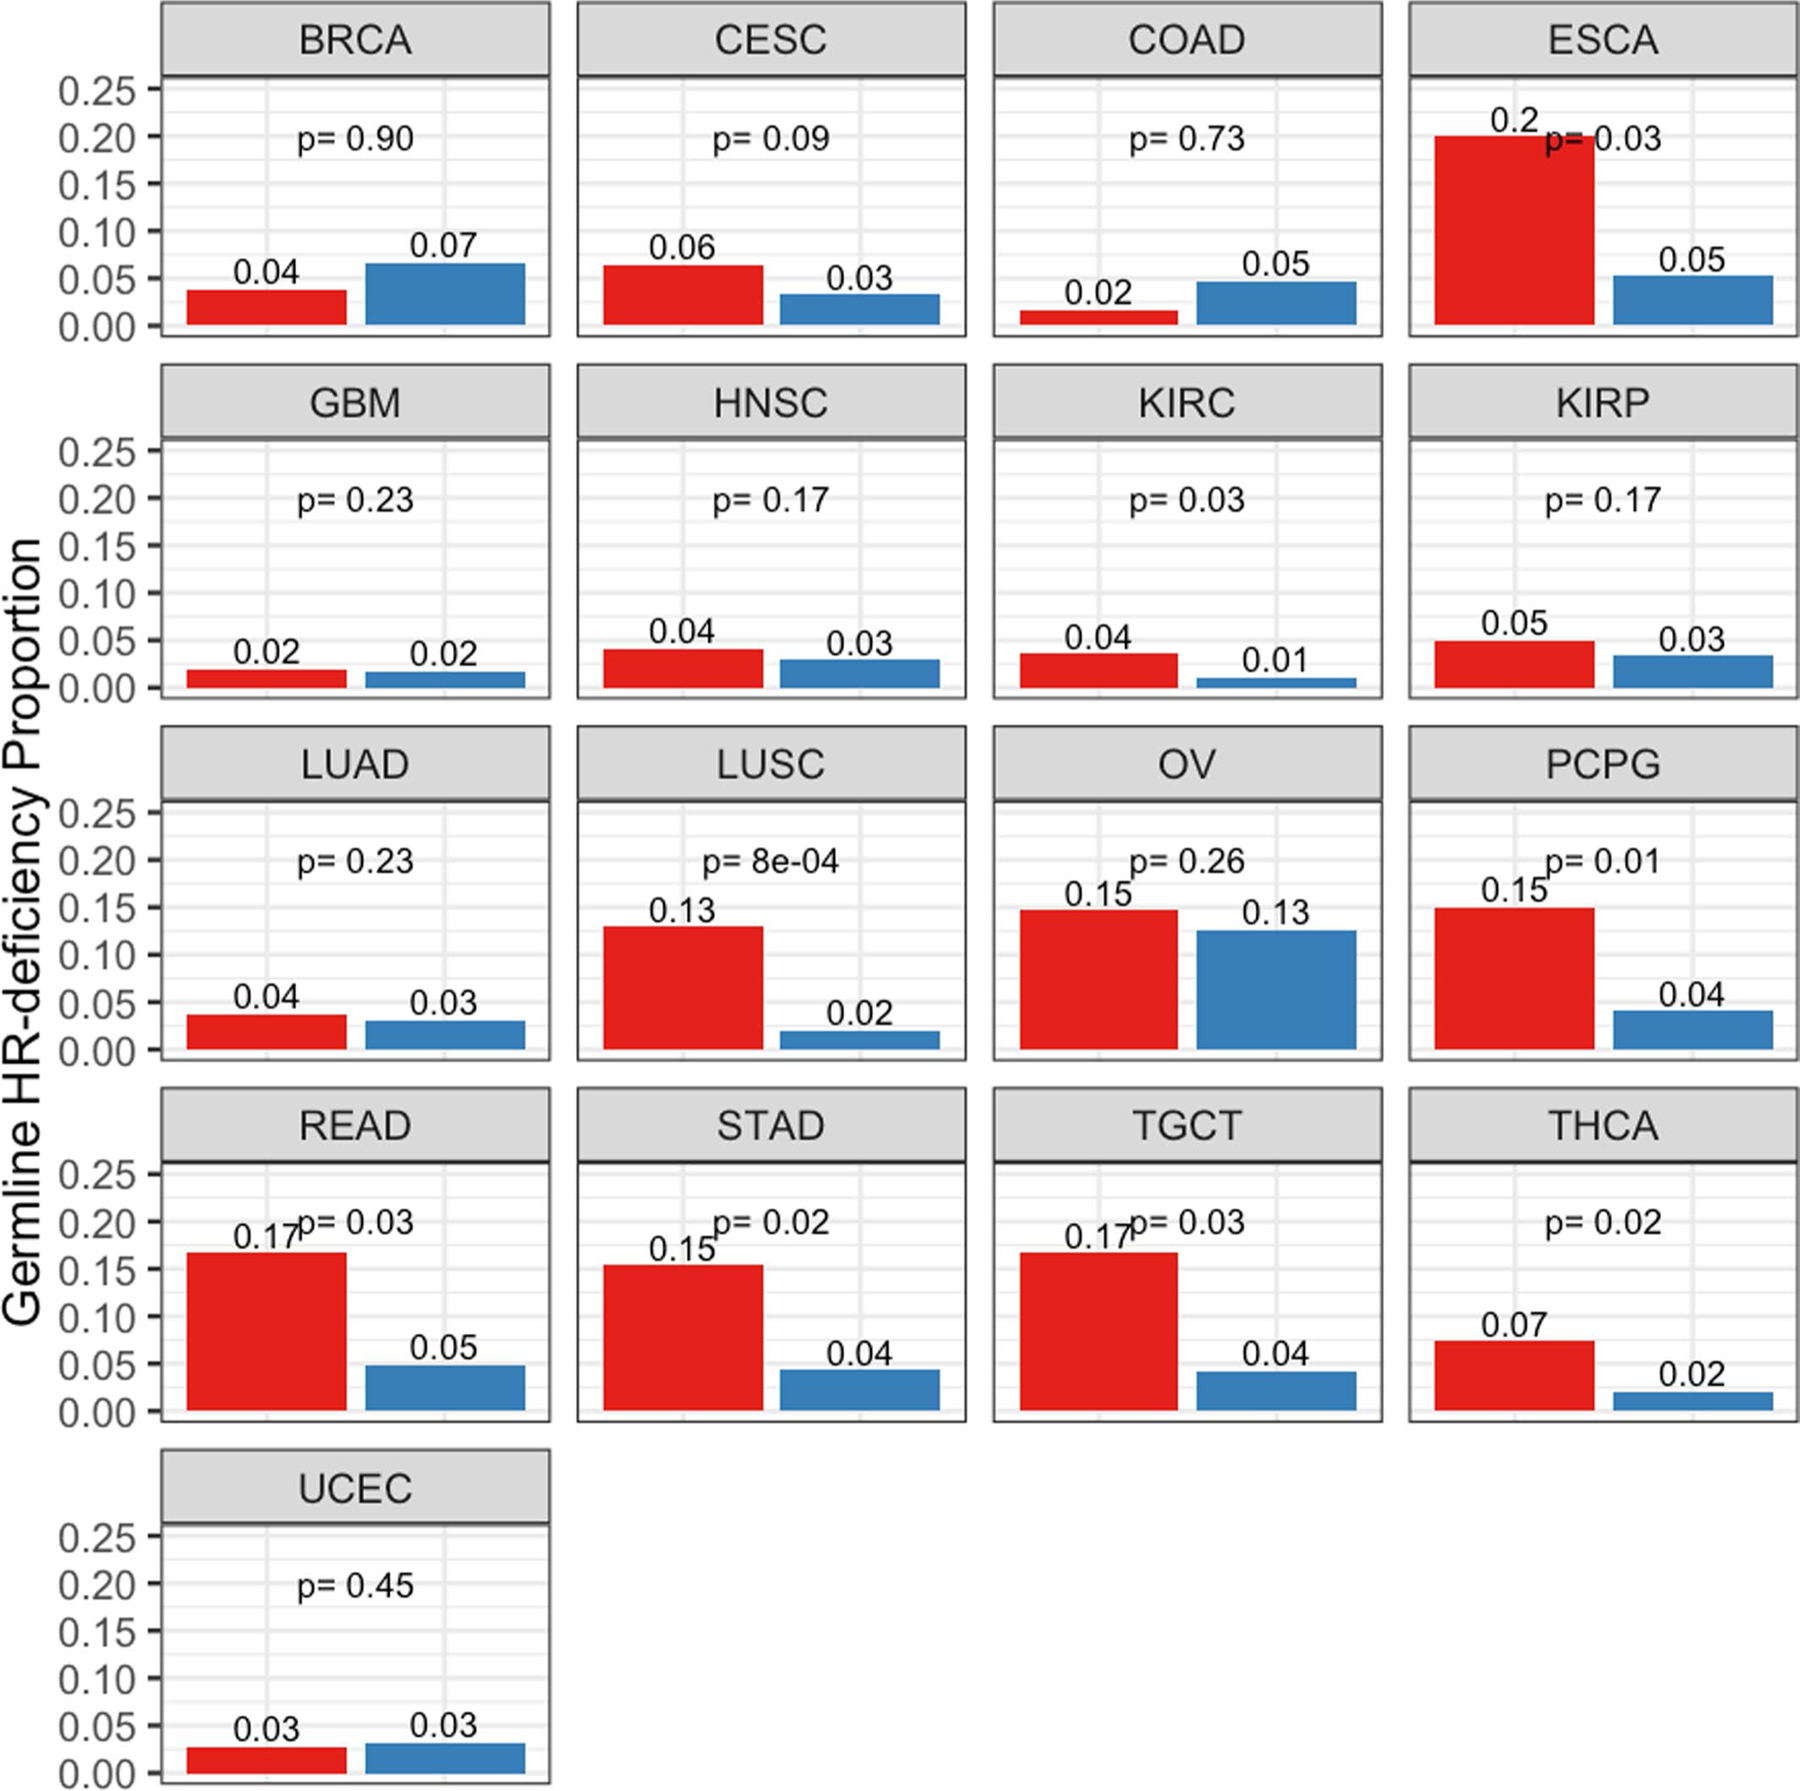
Germline HRD (see methods) is quantified and presented in AAs and EAs for 17 cancer types with at least 30 AA samples in TCGA, where HRD is defined by 88 hallmark genes provided in Table S14, with the respective AA and EA patients included in each group. Refer here for reference to cancer types: https://gdc.cancer.gov/resources-tcga-users/tcga-code-tables/tcga-study-abbreviations). Further, the number of samples in each group is provided in Table S12. AAs are shown in red and EAs in blue. A one-sided Fisher test was performed to test whether AA have higher germline HR-Deficiency than EA within each cancer types and the p-value is provided.
Supplementary Material
Acknowledgements
We thank C. Harris for many insightful discussions. S.S. acknowledges the support of the NCI-UMD Cancer Research Training Fellowship. This research was supported by the Intramural Research Program of the National Institutes of Health, National Cancer Institute.
Footnotes
Reporting summary.
Further information on research design is available in the Nature Research Reporting Summary linked to this article.
Code availability
We used open-source R version 3.6 to generate the figures. Wherever required, commercially available Adobe Illustrator 23.0.3 (2019) was used to create the figure grids. All of the scripts for analysis and figure production were built in-house and are provided on GitHub at https://github.com/sanjusinha7/Scripts_MolCharAAvsEA.
Competing interests
The authors declare no competing interests.
Additional information
Extended data is available for this paper at https://doi.org/10.1038/s43018-019-0009-7.
Supplementary information is available for this paper at https://doi.org/10.1038/s43018-019-0009-7.
Reprints and permissions information is available at www.nature.com/reprints
Data availability
Human TCGA cohort mutation data were derived from the publicly available mSignatureDB database (http://tardis.cgu.edu.tw/msignaturedb/). For the corresponding samples and copy-number profiles, level 3 segmented files were retrieved from the firehose pipeline (https://gdac.broadinstitute.org/) where a consistent version of reference hg19 was used. The NCI-MD data were derived from patients enrolled in the ongoing NCI-MD Case-Control Study. All relevant data in this work are available upon reasonable request, except for the TCGA pathogenic variant calls that required dbGaP controlled access and any sequence information that would make it possible to identify study participants. Anonymized level 3 segmented files for each sample, in addition to the raw files for copy-number profiles of the NCI-MD patients and their corresponding expression profiles, are deposited in dbGAP with the accession number phs001895.
References
- 1.DeSantis CE, Miller KD, Goding Sauer A, Jemal A & Siegel RL Cancer statistics for African Americans, 2019. CA Cancer J. Clin. 69, 211–233 (2019). [DOI] [PubMed] [Google Scholar]
- 2.Yuan J et al. Integrated analysis of genetic ancestry and genomic alterations across cancers. Cancer Cell 34, 549–560.e9 (2018). [DOI] [PMC free article] [PubMed] [Google Scholar]
- 3.Sherman RM et al. Assembly of a pan-genome from deep sequencing of 910 humans of African descent. Nat. Genet. 51, 30–35 (2018). [DOI] [PMC free article] [PubMed] [Google Scholar]
- 4.Green RE et al. A draft sequence of the Neandertal genome. Science 328, 710–722 (2010). [DOI] [PMC free article] [PubMed] [Google Scholar]
- 5.Siegel RL, Miller KD & Jemal A Cancer statistics, 2019. CA Cancer J. Clin. 69, 7–34 (2019). [DOI] [PubMed] [Google Scholar]
- 6.Ryan BM Lung cancer health disparities. Carcinogenesis 39, 741–751 (2018). [DOI] [PMC free article] [PubMed] [Google Scholar]
- 7.Mitchell KA, Zingone A, Toulabi L, Boeckelman J & Ryan BM Comparative transcriptome profiling reveals coding and noncoding RNA differences in NSCLC from African Americans and European Americans. Clin. Cancer Res. 23, 7412–7425 (2017). [DOI] [PMC free article] [PubMed] [Google Scholar]
- 8.Wallace TA et al. Tumor immunobiological differences in prostate cancer between African-American and European-American men. Cancer Res. 68, 927–936 (2008). [DOI] [PubMed] [Google Scholar]
- 9.Guda K et al. Novel recurrently mutated genes in African American colon cancers. Proc. Natl Acad. Sci. USA 112, 1149–1154 (2015). [DOI] [PMC free article] [PubMed] [Google Scholar]
- 10.Chaisaingmongkol J et al. Common molecular subtypes among Asian hepatocellular carcinoma and cholangiocarcinoma. Cancer Cell 32, 57–70.e3 (2017). [DOI] [PMC free article] [PubMed] [Google Scholar]
- 11.Foster JM et al. Cross-laboratory validation of the OncoScan® FFPE Assay, a multiplex tool for whole genome tumour profiling. BMC Med. Genom. 8, 5 (2015). [DOI] [PMC free article] [PubMed] [Google Scholar]
- 12.Knijnenburg TA et al. Genomic and molecular landscape of DNA damage repair deficiency across the cancer genome Atlas. Cell Rep. 23, 239–254.e6 (2018). [DOI] [PMC free article] [PubMed] [Google Scholar]
- 13.Telli ML et al. Homologous recombination deficiency (HRD) score predicts response to platinum-containing neoadjuvant chemotherapy in patients with triple-negative breast cancer. Clin. Cancer Res. 22, 3764–3773 (2016). [DOI] [PMC free article] [PubMed] [Google Scholar]
- 14.Swisher EM et al. Rucaparib in relapsed, platinum-sensitive high-grade ovarian carcinoma (ARIEL2 Part 1): an international, multicentre, open-label, phase 2 trial. Lancet Oncol. 18, 75–87 (2017). [DOI] [PubMed] [Google Scholar]
- 15.Jin Y, Schaffer AA, Feolo M, Holmes JB & Kattman BL GRAF-pop: a fast distance-based method to infer subject ancestry from multiple genotype datasets without principal components analysis. G3 (Bethesda) 9, 2447–2461 (2019). [DOI] [PMC free article] [PubMed] [Google Scholar]
- 16.Ratnaparkhe M et al. Defective DNA damage repair leads to frequent catastrophic genomic events in murine and human tumors. Nat. Commun. 9, 4760 (2018). [DOI] [PMC free article] [PubMed] [Google Scholar]
- 17.Zhang CZ et al. Chromothripsis from DNA damage in micronuclei. Nature 522, 179–184 (2015). [DOI] [PMC free article] [PubMed] [Google Scholar]
- 18.Zhang CZ, Leibowitz ML & Pellman D Chromothripsis and beyond: rapid genome evolution from complex chromosomal rearrangements. Gene Dev. 27, 2513–2530 (2013). [DOI] [PMC free article] [PubMed] [Google Scholar]
- 19.Stephens PJ et al. Massive genomic rearrangement acquired in a single catastrophic event during cancer development. Cell 144, 27–40 (2011). [DOI] [PMC free article] [PubMed] [Google Scholar]
- 20.Mermel CH et al. GISTIC2.0 facilitates sensitive and confident localization of the targets of focal somatic copy-number alteration in human cancers. Genome Biol. 12, R41 (2011). [DOI] [PMC free article] [PubMed] [Google Scholar]
- 21.Taylor AM et al. Genomic and functional approaches to understanding cancer aneuploidy. Cancer Cell 33, 676–689.e3 (2018). [DOI] [PMC free article] [PubMed] [Google Scholar]
- 22.Polimanti R et al. Haplotype differences for copy number variants in the 22q11.23 region among human populations: a pigmentation-based model for selective pressure. Eur. J. Hum. Genet. 23, 116–123 (2015). [DOI] [PMC free article] [PubMed] [Google Scholar]
- 23.Burnside RD 22q11.21 deletion syndromes: a review of proximal, central, and distal deletions and their associated features. Cytogenet. Genome Res. 146, 89–99 (2015). [DOI] [PubMed] [Google Scholar]
- 24.Baell JB et al. Inhibitors of histone acetyltransferases KAT6A/B induce senescence and arrest tumour growth. Nature 560, 253–257 (2018). [DOI] [PubMed] [Google Scholar]
- 25.Brim H et al. Genomic aberrations in an African American colorectal cancer cohort reveals a MSI-specific profile and chromosome X amplification in male patients. PLoS ONE 7, e40392 (2012). [DOI] [PMC free article] [PubMed] [Google Scholar]
- 26.Craig DW et al. Genome and transcriptome sequencing in prospective metastatic triple-negative breast cancer uncovers therapeutic vulnerabilities. Mol. Cancer Ther. 12, 104–116 (2013). [DOI] [PubMed] [Google Scholar]
- 27.Alexandrov LB et al. Signatures of mutational processes in human cancer. Nature 500, 415–421 (2013). [DOI] [PMC free article] [PubMed] [Google Scholar]
- 28.Nik-Zainal S et al. Landscape of somatic mutations in 560 breast cancer whole-genome sequences. Nature 534, 47–54 (2016). [DOI] [PMC free article] [PubMed] [Google Scholar]
- 29.Ma J, Setton J, Lee NY, Riaz N & Powell SN The therapeutic significance of mutational signatures from DNA repair deficiency in cancer. Nat. Commun. 9, 3292 (2018). [DOI] [PMC free article] [PubMed] [Google Scholar]
- 30.Huang KL et al. Pathogenic germline variants in 10,389 adult cancers. Cell 173, 355–370.e14 (2018). [DOI] [PMC free article] [PubMed] [Google Scholar]
- 31.Wang Y et al. Rare variants of large effect in BRCA2 and CHEK2 affect risk of lung cancer. Nat. Genet. 46, 736–741 (2014). [DOI] [PMC free article] [PubMed] [Google Scholar]
- 32.Palles C et al. Germline mutations affecting the proofreading domains of POLE and POLD1 predispose to colorectal adenomas and carcinomas. Nat. Genet. 45, 136–144 (2013). [DOI] [PMC free article] [PubMed] [Google Scholar]
- 33.Timms KM et al. Association of BRCA1/2 defects with genomic scores predictive of DNA damage repair deficiency among breast cancer subtypes. Breast Cancer Res. 16, 475 (2014). [DOI] [PMC free article] [PubMed] [Google Scholar]
- 34.Campbell JD et al. Comparison of prevalence and types of mutations in lung cancers among black and white populations. JAMA Oncol. 3, 801–809 (2017). [DOI] [PMC free article] [PubMed] [Google Scholar]
- 35.Robbins HA, Engels EA, Pfeiffer RM & Shiels MS Age at cancer diagnosis for blacks compared with whites in the United States. J. Natl Cancer Inst. 107, dju489 (2015). [DOI] [PMC free article] [PubMed] [Google Scholar]
- 36.Jiang Y et al. PARP inhibitors synergize with gemcitabine by potentiating DNA damage in non-small-cell lung cancer. Int. J. Cancer 144, 1092–1103 (2019). [DOI] [PMC free article] [PubMed] [Google Scholar]
- 37.Ramalingam SS et al. Randomized, placebo-controlled, phase II study of veliparib in combination with carboplatin and paclitaxel for advanced/metastatic non-small cell lung cancer. Clin. Cancer Res. 23, 1937–1944 (2017). [DOI] [PubMed] [Google Scholar]
- 38.Kadouri L et al. Homologous recombination in lung cancer, germline and somatic mutations, clinical and phenotype characterization. Lung Cancer 137, 48–51 (2019). [DOI] [PubMed] [Google Scholar]
- 39.Yeh CH, Bellon M & Nicot C FBXW7: a critical tumor suppressor of human cancers. Mol. Cancer 17, 115 (2018). [DOI] [PMC free article] [PubMed] [Google Scholar]
- 40.Zhang Q et al. FBXW7 facilitates nonhomologous end-joining via K63-linked polyubiquitylation of XRCC4. Mol. Cell 61, 419–433 (2016). [DOI] [PMC free article] [PubMed] [Google Scholar]
- 41.Yumimoto K et al. F-box protein FBXW7 inhibits cancer metastasis in a non-cell-autonomous manner. J. Clin. Invest. 125, 621–635 (2015). [DOI] [PMC free article] [PubMed] [Google Scholar]
- 42.Kytola V et al. Mutational landscapes of smoking-related cancers in Caucasians and African Americans: precision oncology perspectives at Wake Forest Baptist Comprehensive Cancer Center. Theranostics 7, 2914–2923 (2017). [DOI] [PMC free article] [PubMed] [Google Scholar]
- 43.Farmer H et al. Targeting the DNA repair defect in BRCA mutant cells as a therapeutic strategy. Nature 434, 917–921 (2005). [DOI] [PubMed] [Google Scholar]
- 44.McCabe N et al. Deficiency in the repair of DNA damage by homologous recombination and sensitivity to poly(ADP-ribose) polymerase inhibition. Cancer Res. 66, 8109–8115 (2006). [DOI] [PubMed] [Google Scholar]
- 45.Carter H et al. Interaction landscape of inherited polymorphisms with somatic events in cancer. Cancer Discov. 7, 410–423 (2017). [DOI] [PMC free article] [PubMed] [Google Scholar]
- 46.Enewold L et al. Serum concentrations of cytokines and lung cancer survival in African Americans and Caucasians. Cancer Epidemiol. Biomarkers Prev. 18, 215–222 (2009). [DOI] [PMC free article] [PubMed] [Google Scholar]
- 47.Jamal-Hanjani M et al. Tracking the evolution of non-small-cell lung cancer. N. Engl J. Med. 376, 2109–2121 (2017). [DOI] [PubMed] [Google Scholar]
- 48.Andor N et al. Pan-cancer analysis of the extent and consequences of intratumor heterogeneity. Nat. Med. 22, 105–113 (2016). [DOI] [PMC free article] [PubMed] [Google Scholar]
- 49.Huang PJ et al. mSignatureDB: a database for deciphering mutational signatures in human cancers. Nucleic Acids Res. 46, D964–D970 (2018). [DOI] [PMC free article] [PubMed] [Google Scholar]
- 50.Van Loo P et al. Allele-specific copy number analysis of tumors. Proc. Natl Acad. Sci. USA 107, 16910–16915 (2010). [DOI] [PMC free article] [PubMed] [Google Scholar]
- 51.Yi K & Ju YS Patterns and mechanisms of structural variations in human cancer. Exp. Mol. Med. 50, 98 (2018). [DOI] [PMC free article] [PubMed] [Google Scholar]
- 52.Maciejowski J, Li Y, Bosco N, Campbell PJ & de Lange T Chromothripsis and kataegis induced by telomere crisis. Cell 163, 1641–1654 (2015). [DOI] [PMC free article] [PubMed] [Google Scholar]
Associated Data
This section collects any data citations, data availability statements, or supplementary materials included in this article.
Supplementary Materials
Data Availability Statement
Human TCGA cohort mutation data were derived from the publicly available mSignatureDB database (http://tardis.cgu.edu.tw/msignaturedb/). For the corresponding samples and copy-number profiles, level 3 segmented files were retrieved from the firehose pipeline (https://gdac.broadinstitute.org/) where a consistent version of reference hg19 was used. The NCI-MD data were derived from patients enrolled in the ongoing NCI-MD Case-Control Study. All relevant data in this work are available upon reasonable request, except for the TCGA pathogenic variant calls that required dbGaP controlled access and any sequence information that would make it possible to identify study participants. Anonymized level 3 segmented files for each sample, in addition to the raw files for copy-number profiles of the NCI-MD patients and their corresponding expression profiles, are deposited in dbGAP with the accession number phs001895.


