

Abstract
Objectives
To study the diagnostic performance of the enhanced liver fibrosis score (ELF) for detecting different stages of fibrosis and its usefulness in detecting histologic response to vitamin E or metformin in children with nonalcoholic fatty liver disease who participated in the Vitamin E or Metformin for the Treatment Of NAFLD In Children (TONIC) trial.
Study design
ELF was measured at baseline and weeks 24, 48, and 96 on sera from 166 TONIC participants. Associations between ELF with baseline and end of trial (EOT) fibrosis stages and other histologic features were assessed using χ2 tests and logistic regression models.
Results
ELF was significantly associated with severity of fibrosis at baseline and EOT. ELF areas under the curve for discriminating patients with clinically significant and advanced fibrosis were 0.70 (95% CI, 0.60–0.80) and 0.79 (95% CI, 0.69–0.89), respectively. A 1-unit decrease in ELF at EOT was associated with overall histologic improvement (OR, 1.86; 95% CI, 1.11–3.14; P = .02), resolution of steatohepatitis (OR, 1.88; 95% CI, 1.09–3.25; P = .02), improvement in steatosis grade (OR, 1.76; 95% CI, 1.06–2.82; P = .03), and hepatocellular ballooning (OR, 1.79; 95% CI, 1.06–3.00; P = .03), but not with improvement in fibrosis stage (OR, 1.26; 95% CI, 0.78–2.03; P = .34).
Conclusions
ELF was associated with fibrosis stage in children who participated in TONIC. Although not associated with improvement in fibrosis, a decrease in ELF at EOT was associated with Nonalcoholic Steatohepatitis resolution and improvement in nonalcoholic fatty liver disease histology. ELF may be a useful noninvasive test to monitor treatment response in children with nonalcoholic fatty liver disease.
Nonalcoholic fatty liver disease (NAFLD) incidence and prevalence have been steadily increasing in the US along with the increasing rates of obesity.1–5 Although there is a paucity of data on the natural history of NAFLD in children, it is clear that some children experience NASH progression to cirrhosis and end stage liver disease even requiring liver transplantation during childhood.6,7 The progression of NAFLD is driven by propagation of hepatic fibrosis.8–10
Although liver biopsy is considered the gold standard for the diagnosis and staging of NAFLD, the risks, costs, sampling errors, and variability in interpretation are problematic and decrease enthusiasm for widespread use for NAFLD staging and monitoring response to therapy.5,11 There is an unmet need for noninvasive methods to assess severity and progression of fibrosis and monitor response to interventions in children with NAFLD.12
The enhanced liver fibrosis score (ELF) was developed and validated as a serum-based biomarker for fibrosis in adult patients with NAFLD.13,14 It is generated from an algorithm that incorporates measurements of tissue inhibitor of metalloproteinases-1, amino-terminal propeptide of type III procollagen (PIIINP), and hyaluronic acid. In 2 prior studies from the same Italian center, ELF showed excellent area under the receiver operating characteristic curve (AUROC) (>90%) for discriminating any stage of fibrosis, or clinically significant or advanced fibrosis in children and adolescents with NAFLD and elevated liver enzymes.15,16 There are no available multicenter data on ELF performance in discriminating different stages of fibrosis in US children with NAFLD or as a tool to monitor their response to therapy.
The Vitamin E or Metformin for the Treatment Of NAFLD In Children (TONIC) trial was a multicenter, randomized controlled trial that compared the efficacy and safety of vitamin E and metformin in children with biopsy-proven NAFLD (NCT00063635). These patients had per-protocol liver biopsies at both baseline and end of trial (EOT) (after 96 weeks). In this study, we aimed to assess the association of ELF with stages of fibrosis in children enrolled in the TONIC trial, its diagnostic performance for detecting the different stages of fibrosis, and its usefulness in monitoring histologic response to therapy in the TONIC trial. Because PIIINP has previously been shown to be a biomarker of inflammation in adults with NASH, we investigated its performance here in children with biopsy-proven NAFLD as a secondary objective of this study.17,18
Methods
The TONIC trial was conducted by the NASH Clinical Research Network (NASH CRN). The design, methods, and results of this trial were published previously.19,20 This randomized, double-blind, placebo-controlled trial was conducted at 10 university clinical research centers and included 173 children with biopsy-confirmed NAFLD. Participants were randomized to receive vitamin E (800 IU daily, 58 patients), metformin (1000 mg/day, 57 patients), or placebo (58 patients) for 96 weeks. Eligibility criteria included persistently elevated alanine aminotransferase (ALT), defined as of ALT of more than 60 U/L for 1–6 months before randomization, and evidence of NAFLD on liver biopsy. Biopsies were interpreted by site pathologists to determine eligibility and later read centrally by NASH CRN pathologists masked to treatment assignment. The central read was performed by the NASH CRN Pathology Committee according to the NASH CRN scoring system and was used in the analysis.21 Clinically significant fibrosis was defined as fibrosis stage 2 or higher and advanced fibrosis was defined as fibrosis stage 3 or higher.
For our study, outcome measures were assessed using change from baseline to week 96 of treatment for the following: NASH and borderline NASH improving to not NASH (resolution of NASH), NAFLD activity score (NAS) improvement of 2 or more points and no worsening of fibrosis (histologic improvement), improvement of 1 or more points in NAS, and in individual histologic scores including hepatocellular ballooning, fibrosis, steatosis, and lobular inflammation.
The use of archived biosamples stored at the National Institute of Diabetes and Digestive and Kidney Diseases Biorepository was permitted under the original informed consent participants and their parents or guardians provided before enrollment in TONIC. The serum samples used in our study were obtained from blood drawn from fasting participants, which was collected into serum separator tubes, allowed to clot for at least 30 minutes at room temperature, and centrifuged at 1800×g for 15 minutes at 4 °C. Aliquots of 0.5 mL of serum were immediately frozen at −80 °C. Processing was completed within 2 hours, and samples were free of hemolysis.
Of 173 pediatric patients with NAFLD who participated in TONIC, 166 had serum samples available from baseline, week 24, week 48, and week 96 for the current study. ELF (Siemens Healthcare Diagnostics Inc) and the individual components of ELF were measured on an Advia Centaur XP (Siemens Healthcare Diagnostics Inc) according to manufacturer instructions.22
Statistical Analyses
The cross-sectional distribution of the continuous raw ELF score at baseline, 24, 48, and 96 weeks, change from baseline in ELF and NAS at 96 weeks, and ELF scores within levels of NAS, were graphically assessed using histograms overlaid with normal and/or kernel-based distributional curves. ELF and PIIINP scores by histologic features at baseline and EOT were tabulated for the overall cohort along with their corresponding means and SDs. The univariate differences in ELF and PIIINP scores within histologic features at baseline and EOT were assessed using nonparametric Kruskal-Wallis tests. The distribution of ELF score across baseline stages of fibrosis was assessed graphically using boxplots and analytically using linear regression models.
Associations and unadjusted discriminatory performance of baseline biomarkers with fibrosis stages were assessed within a logistic regression framework and ORs and AUROC reported along with their corresponding 95% CIs per unit SD change.
Histologic improvement over 96 weeks per unit decrease in the ELF score was assessed using a logistic regression model and predictive performance was again assessed using AUROC from participants with available paired histology measures, adjusted for treatment group. Fibrosis improvement per unit decrease in ELF components and their predictive performance was assessed as discussed elsewhere in this article and adjusted for baseline biomarker level and treatment group.
ELF changes over time were visualized graphically and assessed within a linear mixed model framework to account for correlation between successive patient measurements. P values reported are nominal. Measures of variability including SD and 95% CIs were reported. All analyses were performed using SAS software version 9.4 (SAS Institute Inc) at a 5% significance level.
Results
TONIC Trial
The results of the TONIC trial were published previously.20 Participants were mostly White (74%), male (81%), of Hispanic ethnicity (61%) with a mean age of 13.1 ± 2.4 years, a body mass index (BMI) of 34 ± 6 kg/m2, ALT of 123 ± 65 U/L, triglycerides of 153 ± 100 mg/dL, and Homeostatic Model Assessment for Insulin Resistance of 9.2 ± 11.6. The majority of patients (83%) had NASH at baseline biopsy (borderline or suspicious in 42%, definite in 41%) (Table I).
Table I.
Distribution of ELF by histologic features at baseline and EOT
| Variable labels | Overall, baseline (n = 166) | ELF score at baseline | P value* | Overall EOT (n = 141) | Elf score at EOT | P value* |
|---|---|---|---|---|---|---|
| Fibrosis stage | <.0001 | .003 | ||||
| None | 40 (24.2) | 8.51 ± 0.57 | 55 (39.6) | 8.36 ± 0.55 | ||
| Mild | 72 (43.6) | 8.49 ± 0.63 | 42 (30.2) | 8.61 ± 0.79 | ||
| Moderate | 29 (17.6) | 8.77 ± 0.76 | 22 (15.8) | 8.67 ± 0.78 | ||
| Bridging | 24 (14.5) | 9.28 ± 0.69 | 20 (14.4) | 9.13 ± 0.77 | ||
| Steatosis grade | .024 | <.001 | ||||
| ≤33% | 44 (26.5) | 8.51 ± 0.74 | 68 (48.2) | 8.36 ± 0.61 | ||
| 34%−66% | 52 (31.3) | 8.55 ± 0.54 | 37 (26.2) | 8.79 ± 0.80 | ||
| ≥66 | 70 (42.2) | 8.84 ± 0.74 | 36 (25.5) | 8.29 ± 0.76 | ||
| Lobular inflammation | .044 | <.001 | ||||
| <2 foci | 75 (45.2) | 8.51 ± 0.59 | 95 (67.4) | 8.46 ± 0.73 | ||
| ≥2 foci | 91 (54.8) | 8.78 ± 0.76 | 46 (32.6) | 8.86 ± 0.67 | ||
| Hepatocellular ballooning | .004 | .01 | ||||
| None | 69 (41.6) | 8.47 ± 0.62 | 83 (59.7) | 8.47 ± 0.71 | ||
| Few | 57 (34.3) | 8.70 ± 0.68 | 33 (23.7) | 8.59 ± 0.67 | ||
| Many | 40 (24.1) | 8.92 ± 0.77 | 23 (16.5) | 9.06 ± 0.76 | ||
| Portal inflammation | .352 | .04 | ||||
| None | 13 (7.8) | 8.43 ± 0.50 | 20 (14.4) | 8.41 ± 0.63 | ||
| Mild | 136 (81.9) | 8.67 ± 0.73 | 101 (72.7) | 8.56 ± 0.72 | ||
| More than mild | 17 (10.2) | 8.76 ± 0.59 | 18 (12.9) | 9.01 ± 0.81 | ||
| Mallory-Denk bodies | .005 | <.001 | ||||
| Absent/rare | 160 (96.4) | 8.62 ± 0.67 | 130 (93.5) | 8.53 ± 0.70 | ||
| Many | 6 (3.6) | 9.65 ± 0.85 | 9 (6.5) | 9.56 ± 0.62 | ||
| Steatohepatitis diagnosis | .005 | .02 | ||||
| NAFLD, not NASH | 29 (17.5) | 8.26 ± 0.63 | 62 (44.0) | 8.39 ± 0.60 | ||
| Borderline, suspicious | 69 (41.6) | 8.67 ± 0.60 | 42 (29.8) | 8.63 ± 0.78 | ||
| Definite NASH | 68 (41.0) | 8.82 ± 0.76 | 37 (26.2) | 8.88 ± 0.78 |
Values are number (%) or mean ± SD. Baseline and EOT.
P values for continuous variables are based on nonparametric Kruskal Wallis tests.
The proportion of TONIC participants treated with vitamin E or metformin with a sustained decrease in ALT was not different compared with placebo. Resolution of NASH, when present, was more frequent in the vitamin E group. Some histologic features like hepatocellular ballooning or NAS improved more in the vitamin E group, and ballooning improved more in the metformin group.20
Cross-sectional Association Between ELF, Fibrosis Stage, and Other Histologic Subphenotypes
Fibrosis of any stage was detected in 76% and 60% of the participants at baseline and EOT liver biopsy, respectively (Table I). ELF at baseline and EOT (96 weeks) was significantly associated with fibrosis stage (P < .05). At baseline, the ELF (mean ± SD) was 8.51 ± 0.57 in participants without fibrosis (F0), 8.49 ± 0.63 in those with mild fibrosis (F1), 8.77 ± 0.76 in those with moderate fibrosis (F2), and 9.28 ± 0.69 in those with bridging fibrosis (F3) (P < .0001) (Table I and Figure 1 [available at www.jpeds.com]). Histograms of ELF score by study visit are shown in (Figure 2, A–D; available at www.jpeds.com).
Figure 1.
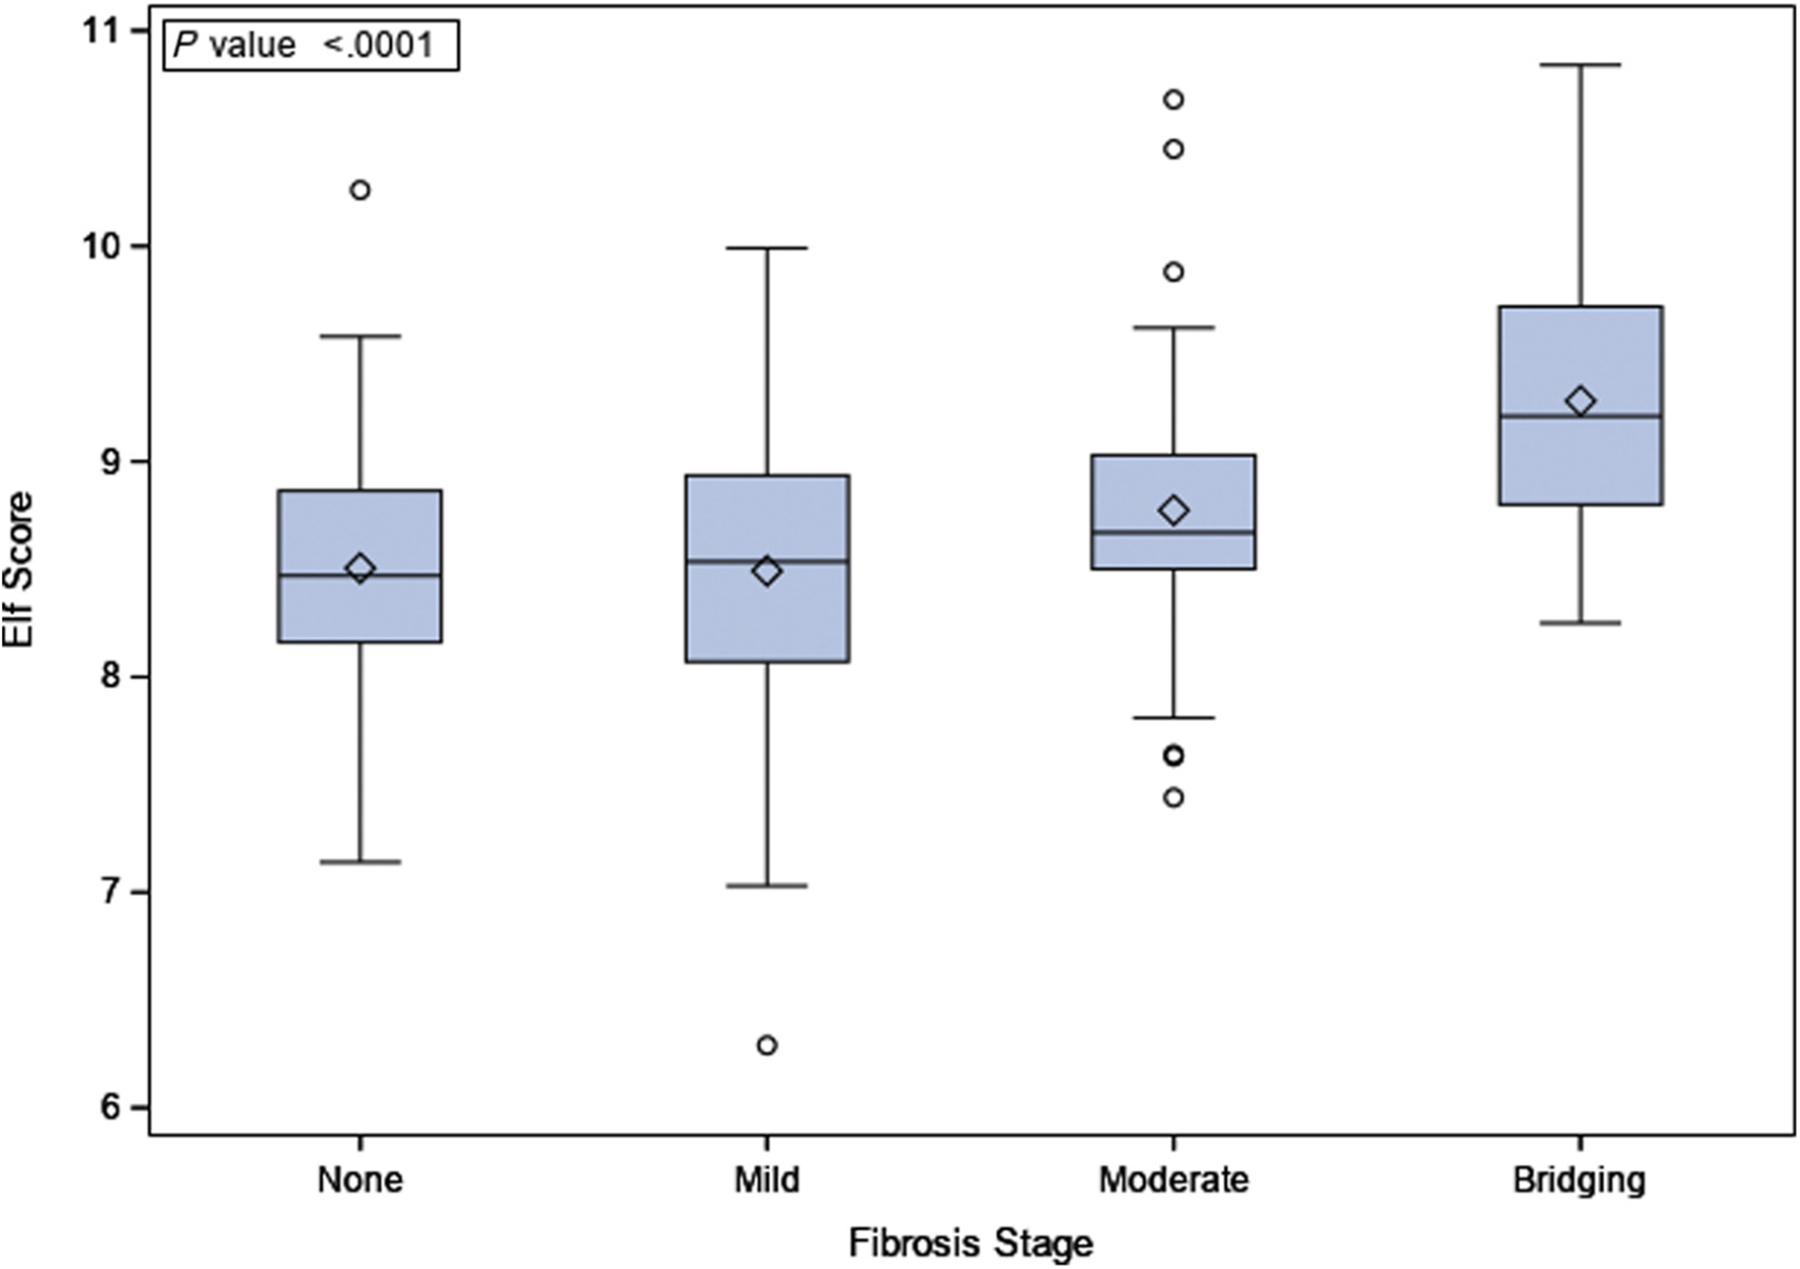
ELF score and baseline fibrosis stages.
Figure 2.
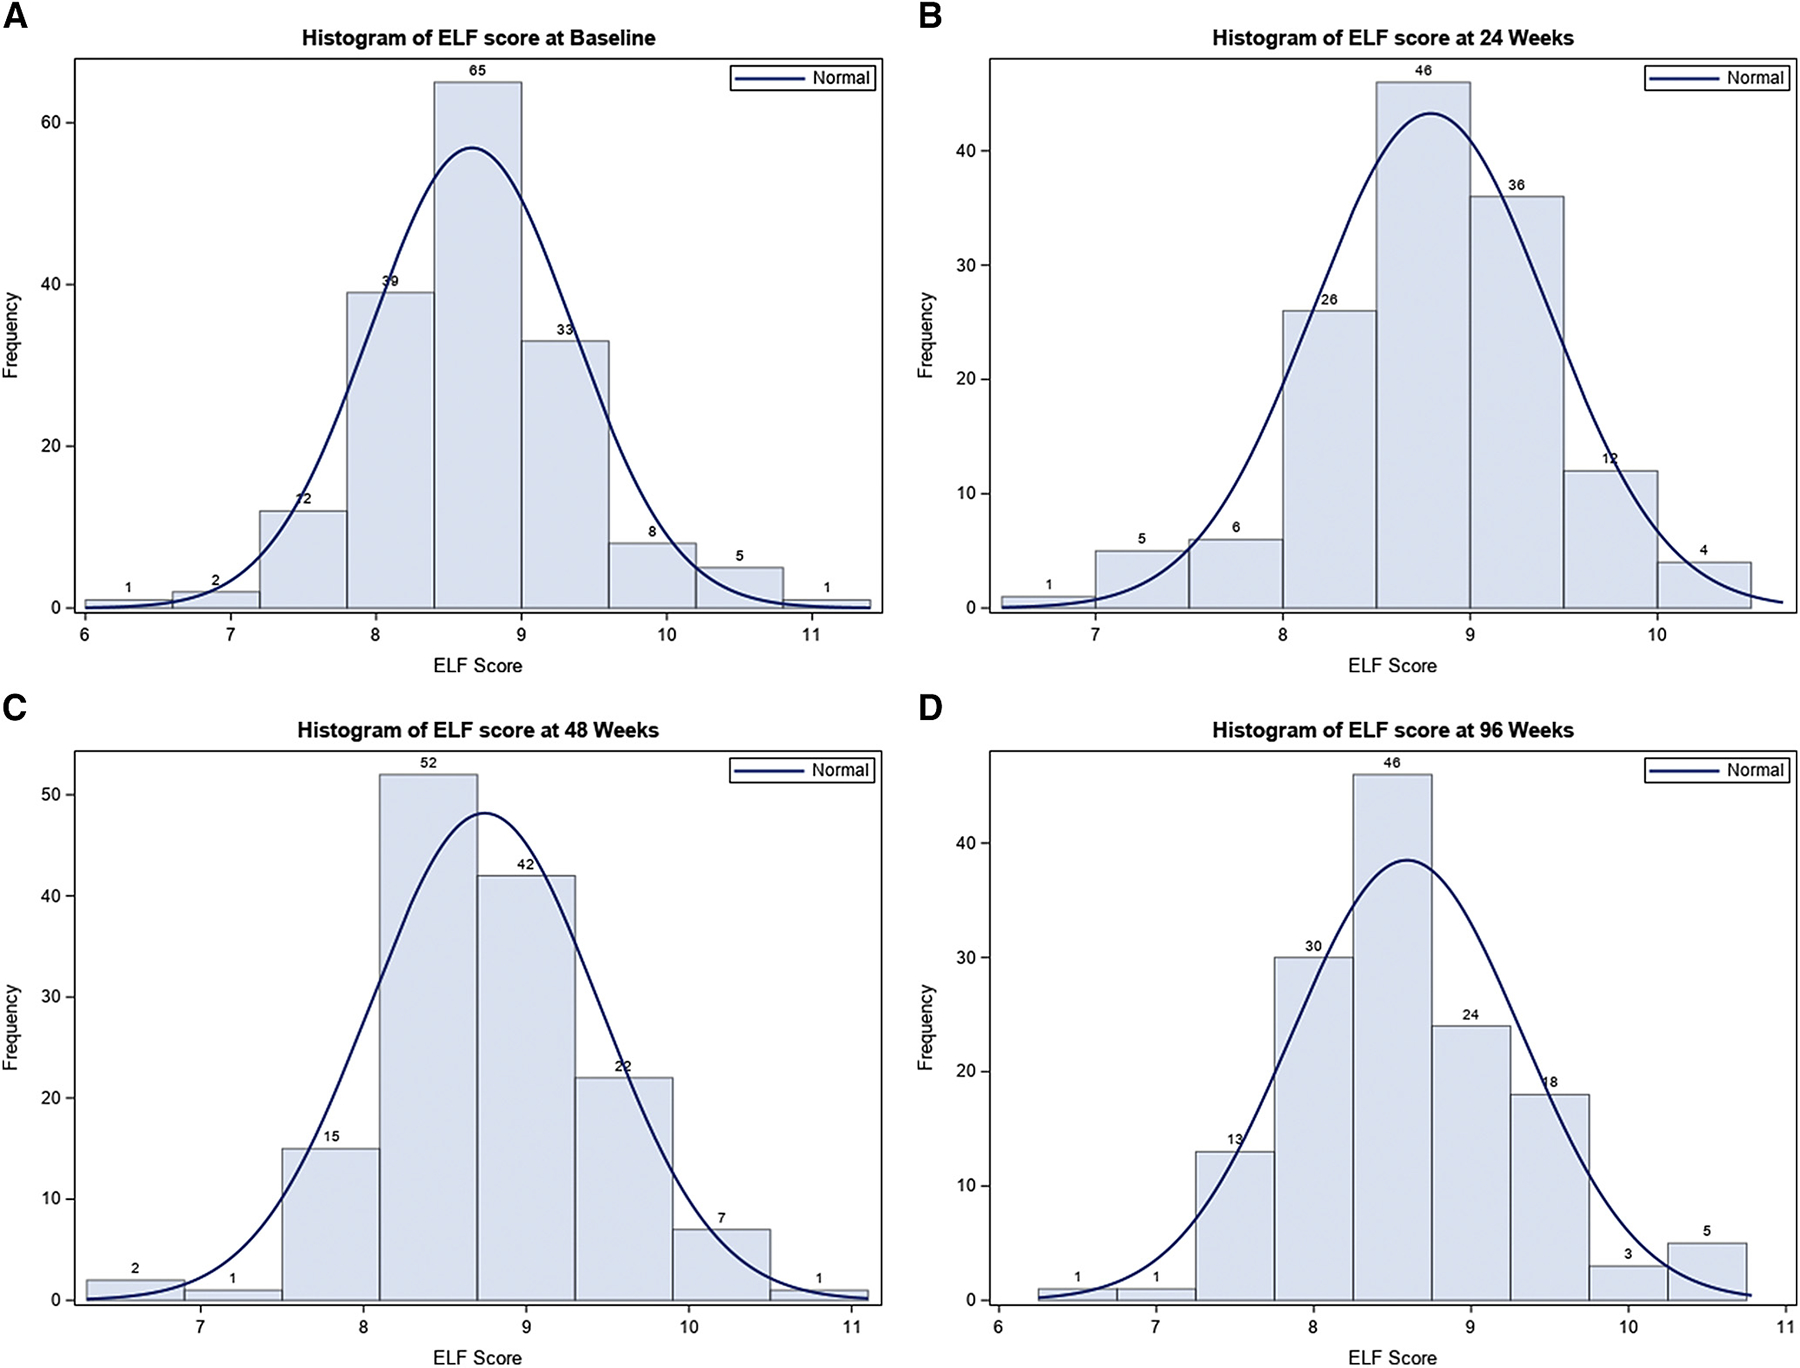
Histograms of ELF score by study visit. A, Histogram of ELF score at baseline. B, Histogram of ELF score at 24 weeks. C, Histogram of ELF score at 48 weeks. D, Histogram of ELF score at 96 weeks.
ELF was also significantly associated with steatosis grade, lobular inflammation, hepatocyte ballooning, Mallory-Denk bodies, and a diagnosis of steatohepatitis at baseline and EOT (Table I). ELF was associated with portal inflammation grade only at EOT (Table I).
Performance of ELF and Its Individual Components for Discrimination of Different Fibrosis Stages at Baseline
Only tissue inhibitor of metalloproteinases-1 (OR, 1.63; 95% CI 1.08–2.45; P = .02) significantly discriminated patients who had any stage of fibrosis (AUROC, 0.63; 95% CI 0.54–0.72) (Table II). ELF, hyaluronic acid, and PIIINP had AUROC 0.63–0.70 for discriminating patients with clinically significant fibrosis. ELF, hyaluronic acid, and tissue inhibitor of metalloproteinases-1 had AUROC 0.76–0.79 for discriminating patients with advanced fibrosis. PIIINP did not significantly discriminate participants with advanced fibrosis (OR, 1.45; 95% CI 0.98–2.14; P = .06). Overall, the ELF score had a higher AUROC than any of its individual components for detection of significant and advanced fibrosis (Table II).
Table II.
Comparison of the baseline values of serum hyaluronic acid, PIIINP, TIMP-1, and ELF for discrimination of fibrosis stages
| Biomarker performances by baseline fibrosis* | OR (95% CI)† | P value† | AUROC (95% CI)‡ |
|---|---|---|---|
| Any fibrosis | |||
| HA (per SD ng/mL) | 1.26 (0.80–1.99) | .32 | 0.57 (0.47–0.67) |
| PIIINP (per SD ng/mL) | 1.32 (0.88–1.97) | .18 | 0.55 (0.45–0.65) |
| TIMP-1 (per SD ng/mL) | 1.63 (1.08–2.45) | .02 | 0.63 (0.54–0.72) |
| ELF (per SD score) | 1.36 (0.93–1.97) | .11 | 0.60 (0.50–0.70) |
| Clinically significant fibrosis | |||
| HA (per SD ng/mL) | 2.15 (1.34–3.46) | .002 | 0.64 (0.54–0.74) |
| PIIINP (per SD ng/mL) | 1.81 (1.26–2.60) | .002 | 0.66 (0.57–0.75) |
| TIMP-1 (per SD ng/mL) | 1.57 (1.12–2.21) | .01 | 0.63 (0.53–0.72) |
| ELF (per SD score) | 2.28 (1.53–3.39) | <.0001 | 0.70 (0.60–0.80) |
| Advanced fibrosis | |||
| HA (per SD ng/mL) | 1.98 (1.31–3.01) | .001 | 0.77 (0.66–0.88) |
| PIIINP (per SD ng/mL) | 1.45 (0.98–2.14) | .06 | 0.65 (0.53–0.76) |
| TIMP-1 (per SD ng/mL) | 2.86 (1.74–4.72) | <.0001 | 0.76 (0.64–0.88) |
| ELF (per SD score) | 3.03 (1.82–5.05) | <.0001 | 0.79 (0.69–0.89) |
HA, hyaluronic acid; TIMP-1, tissue inhibitor of metalloproteinases-1.
Fibrosis categories defined as: Any fibrosis = F1, F2, F3, F4 vs F0; clinically significant fibrosis = F2, F3, F4 vs F0, F1; advanced fibrosis = F3, F4 vs F0, F1, F2.
ORs and associated 95% CIs were determined from a logistic regression model of fibrosis on specified biomarker. The ORs shown in this table are standardized and represent the odds of fibrosis categories per SD change in the biomarker. P values (2-sided) were determined from a Wald test.
AUROC to assess the discriminatory power of distinguishing between fibrosis stages.
Association of Changes in ELF with Histologic Response at EOT
Changes in ELF in response to therapy received in each study arm were evaluated. There were no significant changes in mean ELF at the 24-, 48-, or 96-week specific time points from baseline with vitamin E or metformin vs placebo (Figure 3, A). ELF did not significantly decrease over the study period in participants who achieved fibrosis improvement (Figure 3, B). However, ELF showed significant improvement over the study period in participants who achieved NAS-based histologic improvement and NASH resolution (Figure 3, C–D).
Figure 3.
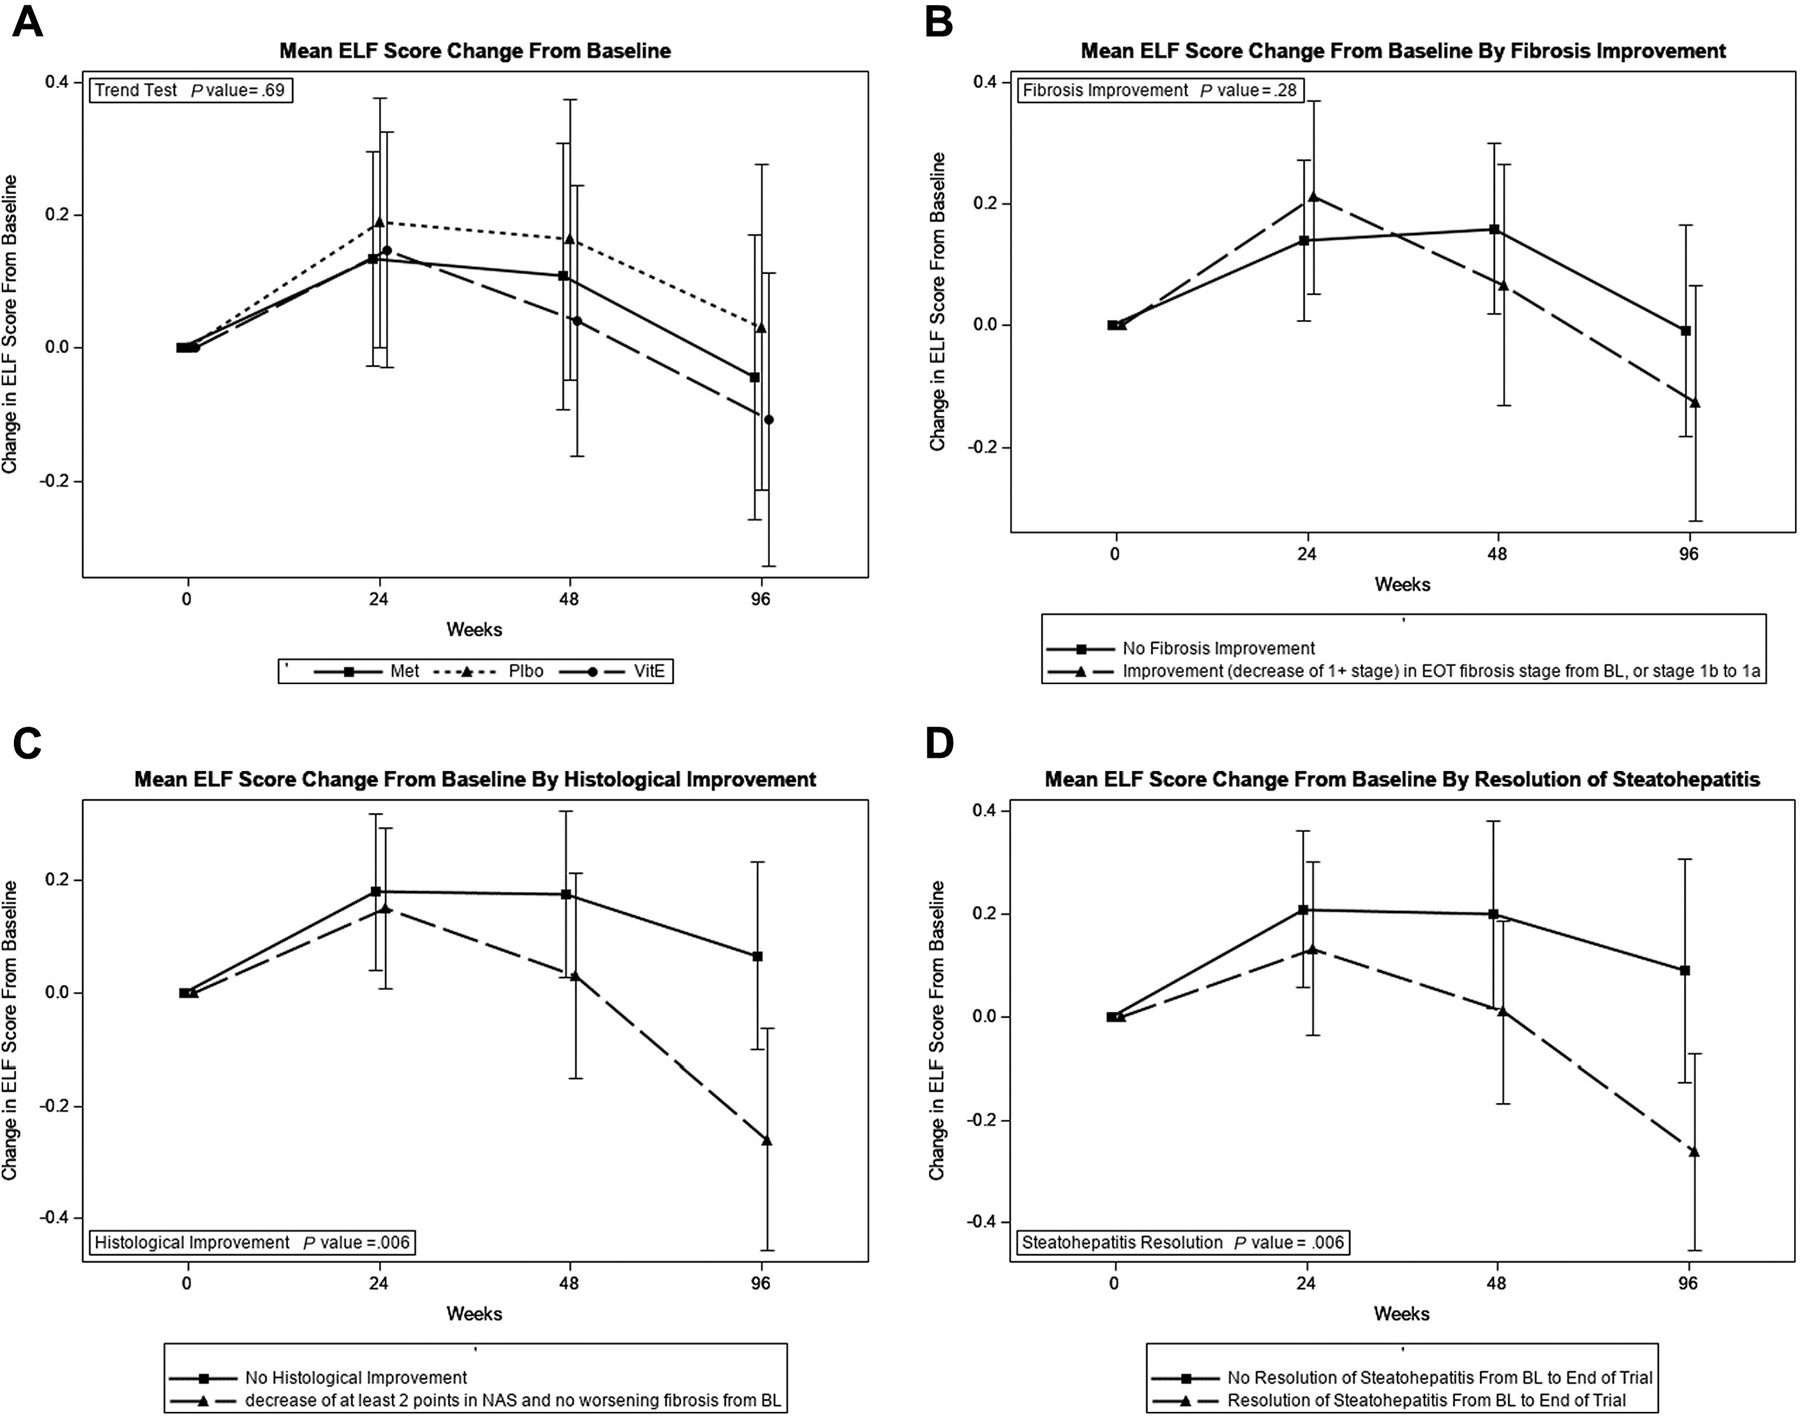
Changes in ELF score in the TONIC trial. A, Mean ELF score change from baseline. B, Mean ELF score change from baseline by fibrosis improvement. C, Mean ELF score change from baseline by histologic improvement. D, Mean ELF score change from baseline by resolution of steatohepatitis.
A model predicting improvement in histology per unit decrease in ELF after 96 weeks showed that one unit decrease was significantly associated with overall histologic improvement (OR, 1.86; 95% CI, 1.11, 3.14; P = .02), resolution of steatohepatitis (OR, 1.88; 95% CI, 1.09–3.25; P = .02), improvement in steatosis grade (OR, 1.76; 95% CI, 1.06–2.82; P = .03), improvement in hepatocellular ballooning (OR, 1.79; 95% CI, 1.06–3.00; P = .03), and improvement in NAS (OR, 1.97; 95% CI, 1.16–3.36; P = .01), but not with improvement in fibrosis stage or lobular inflammation (Table III). None of the individual components of ELF significantly predicted improvement in fibrosis (Table IV; available at www.jpeds.com). Figure 4 (available at www.jpeds.com) shows histograms of ELF and NAS changes, as well as ELF changes per NAS changes at EOT.
Table III.
Relative odds of improved histology per unit decrease in ELF over 96 weeks
| Histologic changes over 96 weeks | Relative odds (95% CI) of improved histology per unit decrease in ELF over 96 weeks (n = 133)* | P value† | AUROC (95% CI)‡ |
|---|---|---|---|
| Overall histologic improvement§ | 1.86 (1.11–3.14) | .02 | 0.62 (0.52–0.71) |
| Resolution of steatohepatitis¶ | 1.88 (1.09–3.25) | .02 | 0.63 (0.52–0.73) |
| Improvement of ≥1 point | |||
| Fibrosis stage** | 1.26 (0.78–2.03) | .34 | 0.54 (0.44–0.64) |
| Steatosis grade | 1.76 (1.06–2.82) | .03 | 0.60 (0.51–0.70) |
| Lobular inflammation | 1.55 (0.96–2.50) | .07 | 0.60 (0.50–0.69) |
| Hepatocellular ballooning | 1.79 (1.06–3.00) | .03 | 0.62 (0.52–0.72) |
| NAS | 1.97 (1.16–3.36) | .01 | 0.64 (0.54–0.74) |
Participants with paired ELF scores (baseline and 96 weeks) and paired histology were included in analyses.
P value determined from logistic regression of change in histologic feature on change in ELF and assigned treatment group.
The AUROC is the predictive power for the performance of ELF change at 96 weeks.
Overall histologic improvement response defined as a decrease in the NAS score by ≥2 points and no worsening of fibrosis.
Resolution of steatohepatitis was defined as a diagnosis of borderline or definite steatohepatitis at baseline and a diagnosis of not NAFLD or NAFLD only at 96 weeks; n = 77 with borderline/definite steatohepatitis at baseline; n = 51 with resolution of steatohepatitis.
Fibrosis improvement defined as a decrease by one or more stage, with change from stage 1b to 1a also considered improvement.
Table IV.
Relative odds of fibrosis improvement per unit decrease in ELF components over 96 weeks
| ELF components | Relative odds (95% CI) of fibrosis improvement per SD decrease in biomarker over 96 weeks (n = 133)* | P value† | AUROC (95% CI) |
|---|---|---|---|
| HA (ng/mL) | 1.23 (0.78–1.95) | .38 | 0.58 (0.48–0.68) |
| PIIINP (ng/mL) | 1.13 (0.78–1.63) | .51 | 0.53 (0.43–0.63) |
| TIMP-1 (ng/mL) | 1.43 (0.93–2.19) | .10 | 0.58 (0.48–0.68) |
HA, hyaluronic acid; TIMP-1, tissue inhibitor of metalloproteinases-1.
Participants with paired ELF scores (baseline and 96 weeks) and paired histology were included in analyses.
Adjusted for baseline biomarker and treatment group.
Figure 4.
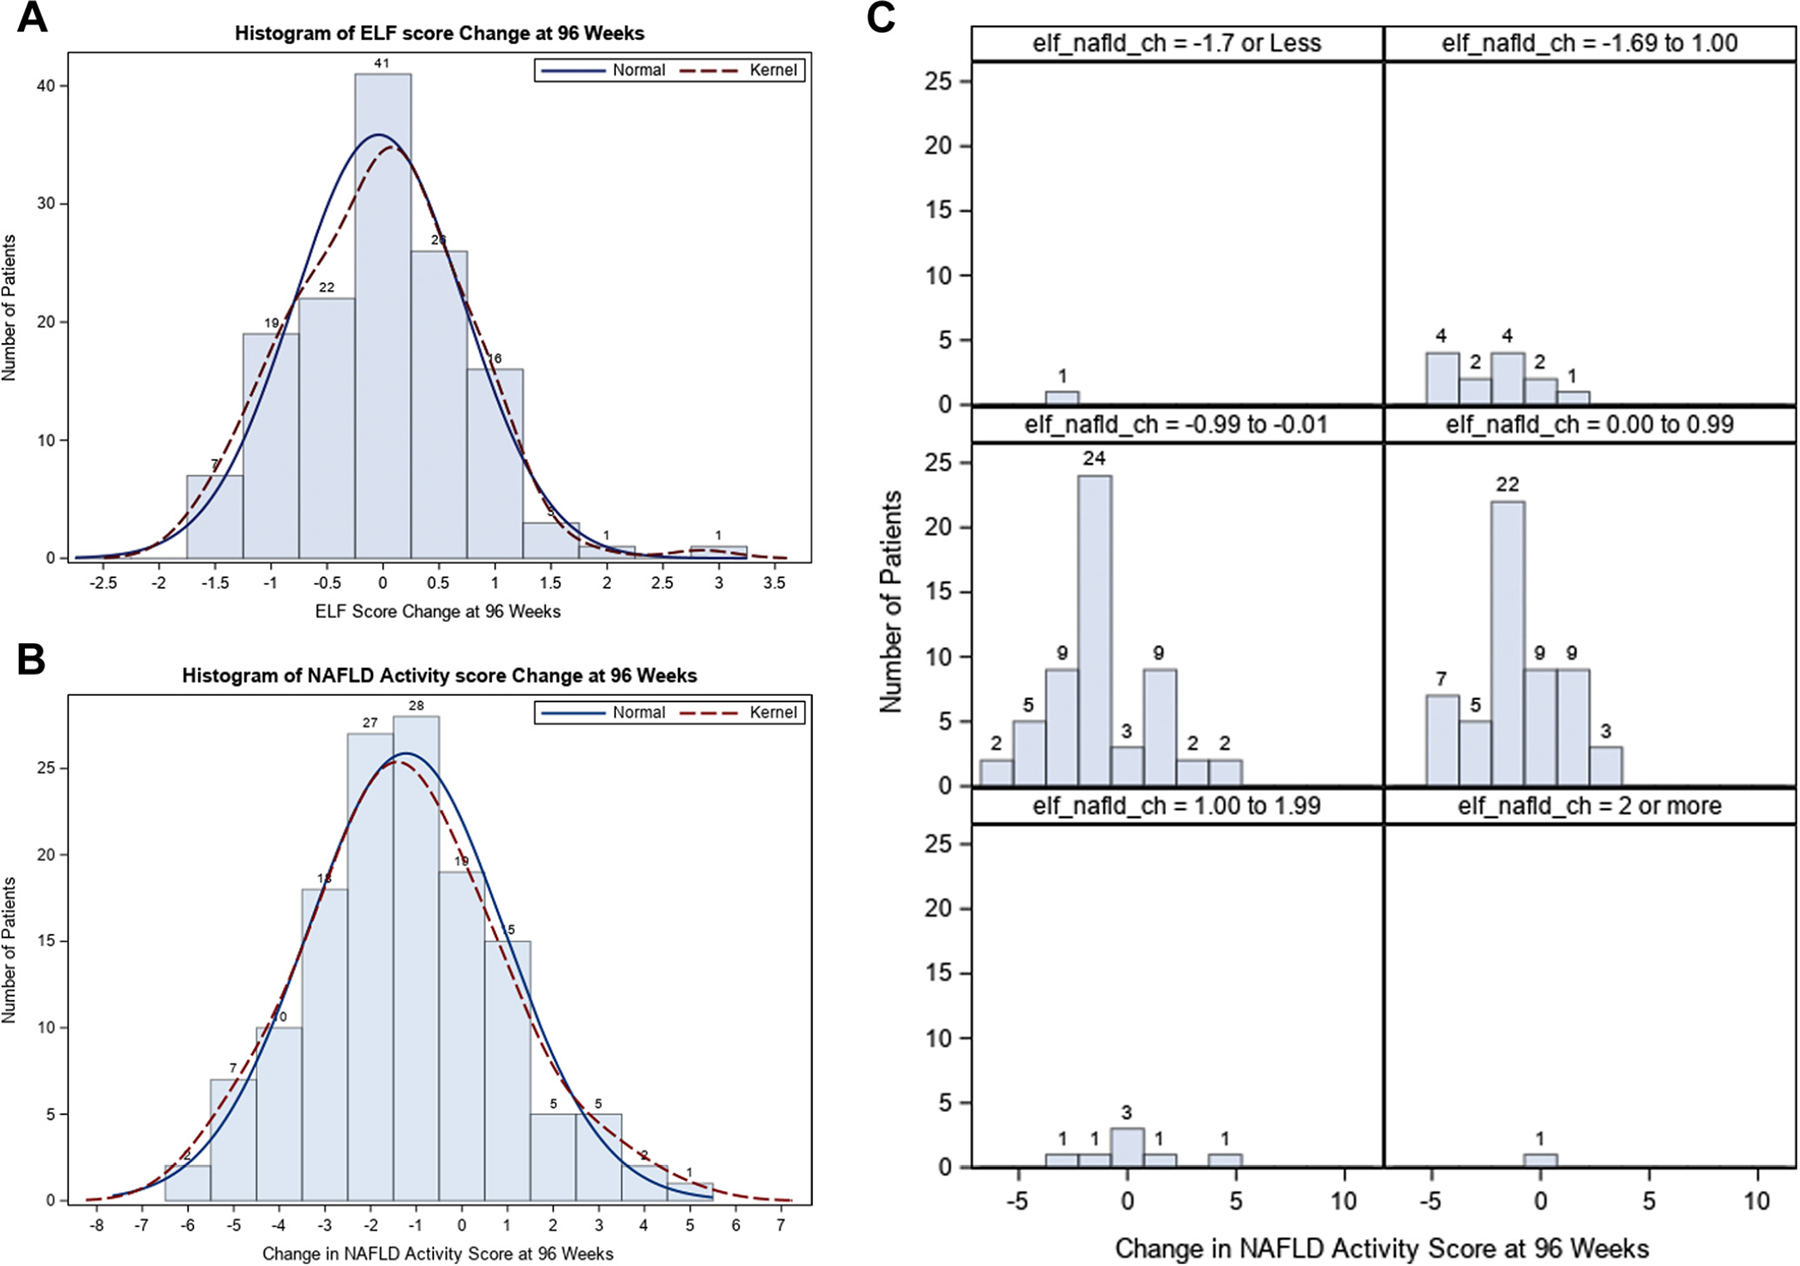
Change in ELF and NAS at 96 weeks. A, Histogram of ELF score change at 96 weeks. B, Change in NAS at 96 weeks. C, ELF changes per changes in NAS.
Association of PIIINP with Baseline Histology and EOT Histologic Response
At baseline, the PIIINP level was significantly associated with fibrosis stage and Mallory-Denk bodies but no other NAFLD histologic features (Table V; available at www.jpeds.com). PIIINP level (mean ± SD) was 16.01 ± 6.74 ng/mL in participants with F0, 16.01 ± 6.74 ng/mL in those with F1, 20.35 ± 10.18 ng/mL in those with F2, and 20.11 ± 6.76 ng/mL in those with F3 (P = .01). At EOT, PIIINP was significantly associated with portal inflammation grade but not with fibrosis or other NAFLD histologic features (Table V). Change in PIIINP during the study did not correlate with any of the major histologic end points (Figure 5; available at www.jpeds.com).
Table V.
Distribution of PIIINP by histologic feature at baseline and end of study
| Baseline | EOT | |||
|---|---|---|---|---|
| Histologic features | Mean (SD)* | P value† | Mean (SD)* | P value† |
| Fibrosis stage | .01 | .82 | ||
| None | 16.01 (6.74) | 16.68 (7.39) | ||
| Mild | 16.01 (6.74) | 18.00 (9.40) | ||
| Moderate | 20.35 (10.18) | 16.75 (6.94) | ||
| Bridging | 20.11 (6.76) | 18.11 (7.09) | ||
| Steatosis grade | .09 | .32 | ||
| ≤33% | 15.92 (7.08) | 15.99 (7.18) | ||
| 34%−66% | 16.50 (5.94) | 19.02 (8.66) | ||
| >66% | 18.83 (8.45) | 17.73 (8.03) | ||
| Lobular inflammation | .06 | .53 | ||
| <2 foci | 16.05 (6.39) | 17.11 (8.46) | ||
| ≥2 foci | 18.38 (8.11) | 17.48 (6.53) | ||
| Hepatocellular ballooning | .09 | .17 | ||
| None | 15.59 (5.81) | 17.94 (8.27) | ||
| Few | 18.41 (7.46) | 15.59 (8.08) | ||
| Many | 18.79 (9.32) | 17.41 (5.91) | ||
| Portal inflammation | .88 | .01 | ||
| None | 16.02 (6.11) | 16.79 (8.49) | ||
| Mild | 17.49 (7.84) | 16.50 (7.54) | ||
| More than mild | 17.06 (4.97) | 22.29 (7.78) | ||
| Mallory-Denk bodies | .03 | .76 | ||
| Absent/rare | 17.14 (7.47) | 17.28 (8.04) | ||
| Many | 22.26 (5.23) | 17.47 (5.62) | ||
| Steatohepatitis diagnosis | .12 | .30 | ||
| NAFLD, not NASH | 15.01 (6.80) | 17.87 (7.72) | ||
| Borderline, suspicious | 16.81 (5.83) | 16.29 (9.12) | ||
| Definite NASH | 18.84 (8.84) | 17.22 (6.53) | ||
P values obtained using the nonparametric Kruskal-Wallis test.
Units are nanograms per milliliter.
Figure 5.
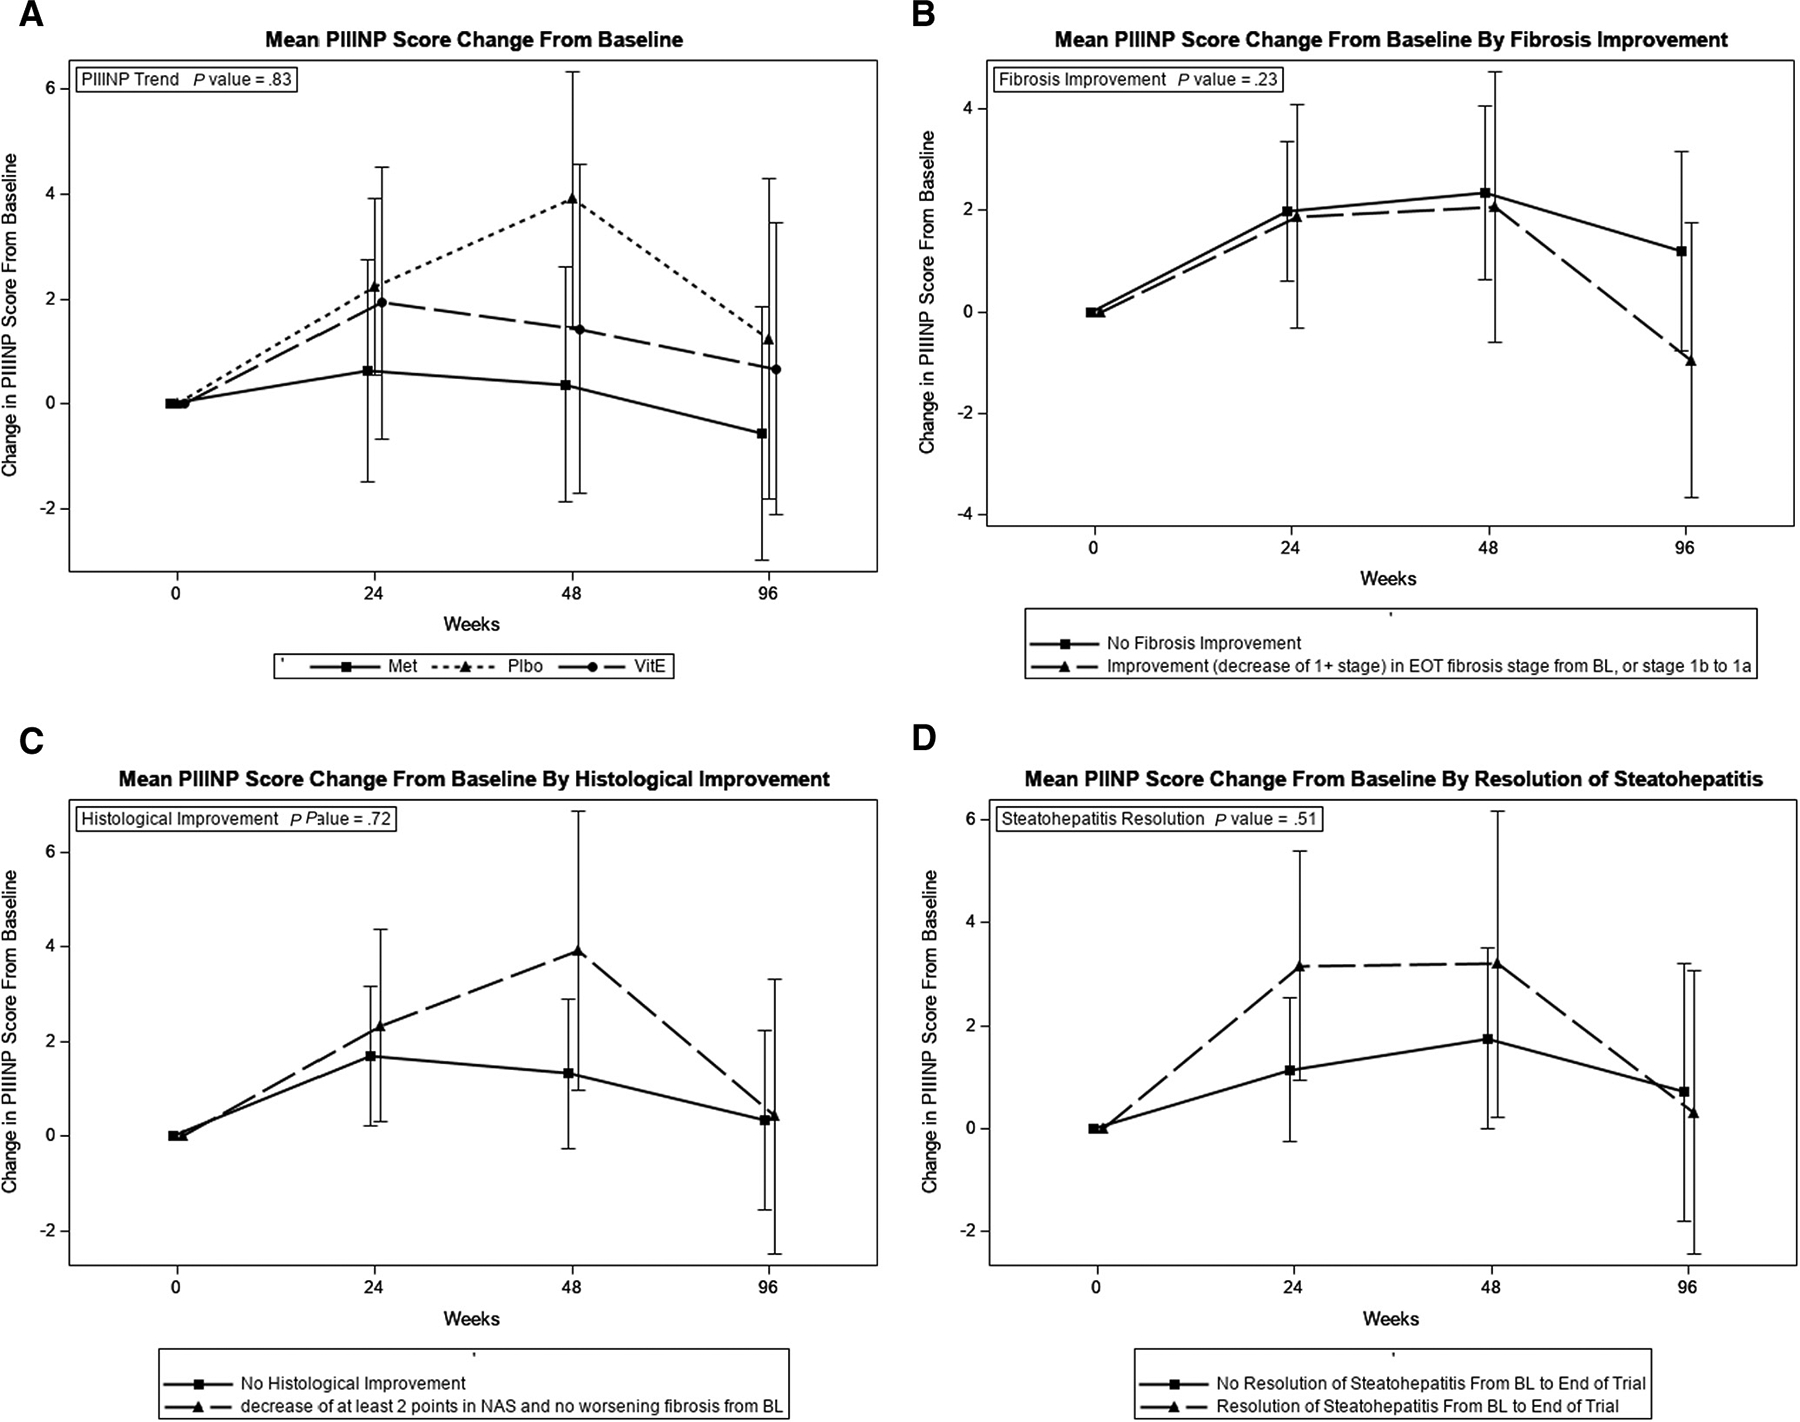
Changes in PIIINP and histologic end points in the TONIC trial. A, Mean PIIINP score change from baseline. B, Mean PIIINP score change from baseline by fibrosis improvement. C, Mean PIIINP score change from baseline by histologic improvement. D, Mean PIIINP score change from baseline by resolution of steatohepatitis.
Discussion
In this well-characterized pediatric cohort with biopsy-proven NAFLD, ELF was significantly associated with fibrosis stage and other NAFLD histologic features at baseline and EOT. ELF showed a significant decrease over the study period in patients who experienced important histologic outcomes, NASH resolution and NAS-based histologic improvement. In accordance with the histologic analysis findings at EOT of the TONIC trial, where neither vitamin E nor metformin resulted in significant improvement in fibrosis, ELF did not show a significant decrease with fibrosis improvement.
In contrast with multiple studies in the adult population, there are no data currently available on the usefulness of ELF for monitoring response to drugs used to treat NAFLD or NASH in children.13,14,23–25 A prior study of 39 obese children with suspected NAFLD reported a median decrease of −0.39 ELF units with lifestyle intervention resulting in minimal weight loss.26
Accurate noninvasive tests are needed to assess disease activity and fibrosis in children with this common chronic liver disease. In contrast with the extensive development of noninvasive markers of fibrosis in adults with NAFLD, this research remains considerably more limited in pediatric NAFLD.12,16,27–31 There are few data on the use of ELF as a noninvasive marker for fibrosis in this population.12,15,16 In an analysis of 400 healthy volunteers including 32 individuals under 20 years of age, the mean ELF score was 7.95 in males and 7.80 in females; 9.80 was proposed as a general cutoff for moderate fibrosis and 11.3 for advanced fibrosis.32 In contrast, the present study of children with NAFLD ages 8–18 years, ELF was 8.51 in participants without fibrosis (F0), 8.77 in those with moderate fibrosis (F2), and 9.28 in those with bridging fibrosis (F3). Given the paucity of data in children and the variability of ELF cutoffs used in different studies, more studies are needed to establish the optimal ELF cutoffs for discriminating different stages of hepatic fibrosis in children with NAFLD. Although ELF outperformed its individual components for discrimination of clinically significant and advanced fibrosis at baseline, it demonstrated only fair performance in this cohort. The AUROCs for ELF for discriminating different stages of fibrosis in children and adolescents with NAFLD in our study were lower than previously reported in the 2 prior studies from an Italian center.15,16 Population differences may have influenced performance of ELF in these different studies. Although the Italian studies included mostly male children (56%−66%) with NASH (67%−69%), the mean BMI for those participants (approximately 25 kg/m2) and the prevalence of clinically significant or advanced fibrosis (≥F2. 13%−15%) were markedly lower than in the TONIC study (mean BMI of 34 kg/m2 and ≥F2 32%, respectively). In addition, most patients in our study (61%) were of Hispanic ethnicity and recruited from multiple centers in the US. This study demonstrated that the excellent performance of ELF for discriminating fibrosis stages in the Italian studies may not apply to typical pediatric NAFLD patients in the US.
A lack of significant improvement in ELF in this cohort was in line with lack of significant improvement in histologic fibrosis with either vitamin E or metformin. These findings are similar to the findings of our post hoc analysis of the adult PIVENS trial, in which neither vitamin E nor pioglitazone resulted in significant improvement in fibrosis in adults with NASH.18,33 ELF did not correlate with fibrosis improvement in PIVENS, but did correlate significantly with the NAS-based histologic improvement.18 A possible explanation is that the histologic staging of fibrosis is too insensitive to pick up subtle changes in fibrosis that are detectable using ELF. This notion is plausible, given that ELF generates a score that is a continuous variable with a coefficient of variation of 3%−8% and histologic staging generates a categorical variable score with well-documented variation in excess of 20%.11,32,34
In adult patients with NASH in the PIVENS trial, PIIINP showed much more dynamic changes in relation to changes in fibrosis and other histologic end points.18 In this analysis of TONIC participants, PIIINP showed a significant association only with fibrosis stage at baseline, but did not correlate with histologic improvement, NASH resolution, or other histologic end points. ELF was better than its individual components in discriminating children with clinically significant and advanced fibrosis and showed more dynamic changes with improvement in different histologic end points (except for fibrosis) than PIIINP. The differences in ELF performance between children and adults with NAFLD studies are likely related to factors influencing ELF performance such as sex and age.32
Because the TONIC trial included patients with NAFLD with a persistent elevation in ALT who did not have diabetes or cirrhosis, our findings on ELF performance may not be generalizable to NAFLD patients with normal ALT, diabetes, or cirrhosis. The relatively poor performance of ELF in discriminating children with no or mild fibrosis (AUROC of 0.60 and 0.70, respectively) may be a limiting factor for ELF use in general pediatric practice, where most children have less severe NAFLD compared with children enrolled in this NASH CRN study performed at tertiary care centers. Although TONIC was completed and published in 2011, ELF was measured on serum samples in 2012 and 2013, even though this current post hoc data analysis was done later. This study has several strengths. The population was enriched in children with a higher BMI and clinically significant fibrosis, adding value to the analysis. The pathology assessment was centrally performed by the NASH CRN Pathology Committee. The most unique feature of this study was that changes in ELF were assessed longitudinally in relation to histology and in response to therapeutic interventions.
In summary, ELF was significantly associated with fibrosis and other NAFLD histologic features in children who participated in the TONIC clinical trial. Although not associated with improvement in fibrosis, a decrease in ELF was associated with NASH resolution and improvement in other NAFLD histologic lesions. ELF may be a useful noninvasive marker to monitor response to treatment in children with NAFLD.
Funding and Conflicts of Interest Disclosure
This study was approved by the National Institute of Diabetes and Digestive and Kidney Diseases funded Nonalcoholic Steatohepatitis Clinical Research Network as an Ancillary Study (NASH CRN AS #063). The Nonalcoholic Steatohepatitis Clinical Research Network (NASH CRN) is supported by the National Institute of Diabetes and Digestive and Kidney Diseases (U01DK061713, U01DK061718, U01DK061728, U01DK061731, U01DK061732, U01DK061734, U01DK 061737, U01DK061738, U01DK061730, and U24DK 061730). Biosamples and phenotype and histologic data were provided by the NASH CRN. ELF measurements were conducted in a blinded fashion by Siemens. Siemens or its designees had no role in data analysis or article preparation. The final manuscript was provided to Siemens before its submission for their comments. The TONIC trial was conducted by the NASH CRN and supported in part by the Intramural Research Program of the National Cancer Institute and the Eunice Kennedy Shriver National Institute of Child Health and Human Development. The vitamin E and matching placebo were provided by Pharmavite through a Clinical Trial Agreement with the National Institutes of Health. S.G. serves as a consultant for TransMedics and Pfizer; and receives research grant support from Cirius, Galmed, Viking, and Zydus. O.C. reports a service contract with Novo-Nordisk. W.R. serves as a consultant for Siemens Healthineers, Gilead Sciences, and GSK. N.G. reports ongoing research support from Eli Lilly, Galectin Therapeutics, Intercept, and Exact Sciences and has received consulting fees from Abbvie, Madrigal, Nusirt, Allergan, Siemens, Genentech, Zydus, La Jolla, Axcella, Foresite Labs, and Galectin Therapeutics. J.M. reports ongoing research support from Albireo, Abbvie, Gillead, Mirum, and the CF Foundation. The other authors declare no conflicts of interest.
Funding and disclosure information is available at www.jpeds.com.
Glossary
- ALT
Alanine aminotransferase
- AUROC
Area under the receiver operating characteristic curve
- BMI
Body mass index
- ELF
Enhanced liver fibrosis score
- EOT
End of trial
- NAFLD
Nonalcoholic fatty liver disease
- NAS
NAFLD activity score
- NASH
Nonalcoholic Steatohepatitis
- NASH CRN
Nonalcoholic Steatohepatitis Clinical Research Network
- PIIINP
Amino-terminal propeptide of type III procollagen
- TONIC
Vitamin E or Metformin for the Treatment Of NAFLD In Children
References
- 1.Schwimmer JB, Deutsch R, Kahen T, Lavine JE, Stanley C, Behling C. Prevalence of fatty liver in children and adolescents. Pediatrics 2006;118:1388–93. [DOI] [PubMed] [Google Scholar]
- 2.Sahota AK, Shapiro WL, Newton KP, Kim ST, Chung J, Schwimmer JB. Incidence of nonalcoholic fatty liver disease in children: 2009–2018. Pediatrics 2020;146(6). [DOI] [PMC free article] [PubMed] [Google Scholar]
- 3.Welsh JA, Karpen S, Vos MB. Increasing prevalence of nonalcoholic fatty liver disease among United States adolescents, 1988–1994 to 2007–2010. J Pediatr 2013;162:496–500.e1. [DOI] [PMC free article] [PubMed] [Google Scholar]
- 4.Yu EL, Golshan S, Harlow KE, Angeles JE, Durelle J, Goyal NP, et al. Prevalence of nonalcoholic fatty liver disease in children with obesity. J Pediatr 2019;207:64–70. [DOI] [PMC free article] [PubMed] [Google Scholar]
- 5.Chalasani N, Younossi Z, Lavine JE, Charlton M, Cusi K, Rinella M, et al. The diagnosis and management of nonalcoholic fatty liver disease: practice guidance from the American Association for the Study of Liver Diseases. Hepatology 2018;67:328–57. [DOI] [PubMed] [Google Scholar]
- 6.Molleston JP, White F, Teckman J, Fitzgerald JF. Obese children with steatohepatitis can develop cirrhosis in childhood. Am J Gastroenterol 2002;97:2460–2. [DOI] [PubMed] [Google Scholar]
- 7.Alkhouri N, Hanouneh IA, Zein NN, Lopez R, Kelly D, Eghtesad B, et al. Liver transplantation for nonalcoholic steatohepatitis in young patients. Transpl Int 2016;29:418–24. [DOI] [PubMed] [Google Scholar]
- 8.Angulo P, Kleiner DE, Dam-Larsen S, Adams LA, Bjornsson ES, Charatcharoenwitthaya P, et al. Liver fibrosis, but no other histologic features, is associated with long-term outcomes of patients with nonalcoholic fatty liver disease. Gastroenterology 2015;149:389–397 e10. [DOI] [PMC free article] [PubMed] [Google Scholar]
- 9.Vilar-Gomez E, Calzadilla-Bertot L, Wai-Sun Wong V, Castellanos M, Aller-de la Fuente R, Metwally M, et al. Fibrosis severity as a determinant of cause-specific mortality in patients with advanced nonalcoholic fatty liver disease: a multi-national cohort study. Gastroenterology 2018;155: 443–457 e17. [DOI] [PubMed] [Google Scholar]
- 10.Dulai PS, Singh S, Patel J, Soni M, Prokop LJ, Younossi Z, et al. Increased risk of mortality by fibrosis stage in nonalcoholic fatty liver disease: systematic review and meta-analysis. Hepatology 2017;65:1557–65. [DOI] [PMC free article] [PubMed] [Google Scholar]
- 11.Gawrieh S, Knoedler DM, Saeian K, Wallace JR, Komorowski RA. Effects of interventions on intra- and interobserver agreement on interpretation of nonalcoholic fatty liver disease histology. Ann Diagn Pathol 2011;15: 19–24. [DOI] [PubMed] [Google Scholar]
- 12.Alkhouri N Putting it all together: noninvasive diagnosis of fibrosis in nonalcoholic fatty liver disease in adults and children. Clin Liver Dis 2017;9:134–7. [DOI] [PMC free article] [PubMed] [Google Scholar]
- 13.Rosenberg WM, Voelker M, Thiel R, Becka M, Burt A, Schuppan D, et al. Serum markers detect the presence of liver fibrosis: a cohort study. Gastroenterology 2004;127:1704–13. [DOI] [PubMed] [Google Scholar]
- 14.Guha IN, Parkes J, Roderick P, Chattopadhyay D, Cross R, Harris S, et al. Noninvasive markers of fibrosis in nonalcoholic fatty liver disease: Validating the European Liver Fibrosis Panel and exploring simple markers. Hepatology 2008;47:455–60. [DOI] [PubMed] [Google Scholar]
- 15.Nobili V, Parkes J, Bottazzo G, Marcellini M, Cross R, Newman D, et al. Performance of ELF serum markers in predicting fibrosis stage in pediatric non-alcoholic fatty liver disease. Gastroenterology 2009;136:160–7. [DOI] [PubMed] [Google Scholar]
- 16.Alkhouri N, Carter-Kent C, Lopez R, Rosenberg WM, Pinzani M, Bedogni G, et al. A combination of the pediatric NAFLD fibrosis index and enhanced liver fibrosis test identifies children with fibrosis. Clin Gastroenterol Hepatol 2011;9:150–5. [DOI] [PubMed] [Google Scholar]
- 17.Tanwar S, Trembling PM, Guha IN, Parkes J, Kaye P, Burt AD, et al. Validation of terminal peptide of procollagen III for the detection and assessment of nonalcoholic steatohepatitis in patients with nonalcoholic fatty liver disease. Hepatology 2013;57:103–11. [DOI] [PubMed] [Google Scholar]
- 18.Gawrieh S, Wilson LA, Yates KP, Cummings OW, Vilar-Gomez E, Ajmera V, et al. Relationship of ELF and PIIINP with liver histology and response to vitamin E or pioglitazone in the PIVENS Trial. Hepatol Commun 2021;5:786–97. [DOI] [PMC free article] [PubMed] [Google Scholar]
- 19.Lavine JE, Schwimmer JB, Molleston JP, Scheimann AO, Murray KF, Abrams SH, et al. Treatment of nonalcoholic fatty liver disease in children: TONIC trial design. Contemp Clin Trials 2010;31:62–70. [DOI] [PMC free article] [PubMed] [Google Scholar]
- 20.Lavine JE, Schwimmer JB, Van Natta ML, Molleston JP, Murray KF, Rosenthal P, et al. Effect of vitamin E or metformin for treatment of nonalcoholic fatty liver disease in children and adolescents: the TONIC randomized controlled trial. JAMA 2011;305:1659–68. [DOI] [PMC free article] [PubMed] [Google Scholar]
- 21.Kleiner DE, Brunt EM, Van Natta M, Behling C, Contos MJ, Cummings OW, et al. Design and validation of a histological scoring system for nonalcoholic fatty liver disease. Hepatology 2005;41:1313–21. [DOI] [PubMed] [Google Scholar]
- 22.Enhanced Liver Fibrosis (ELF) Test Specifications. Tarrytown, NY: ADVIA Centaur; 2011. [Google Scholar]
- 23.Parkes J, Roderick P, Harris S, Day C, Mutimer D, Collier J, et al. Enhanced liver fibrosis test can predict clinical outcomes in patients with chronic liver disease. Gut 2010;59:1245–51. [DOI] [PubMed] [Google Scholar]
- 24.Anstee QM, Lawitz EJ, Alkhouri N, Wong VW, Romero-Gomez M, Okanoue T, et al. Noninvasive tests accurately identify advanced fibrosis due to NASH: baseline data from the STELLAR trials. Hepatology 2019;70:1521–30. [DOI] [PubMed] [Google Scholar]
- 25.Sanyal AJ, Harrison SA, Ratziu V, Abdelmalek MF, Diehl AM, Caldwell S, et al. The natural history of advanced fibrosis due to nonalcoholic steatohepatitis: data from the simtuzumab trials. Hepatology 2019;70:1913–27. [DOI] [PubMed] [Google Scholar]
- 26.Goldschmidt I, Di Nanni A, Streckenbach C, Schnell K, Danne T, Baumann U. Improvement of BMI after lifestyle intervention is associated with normalisation of elevated ELF score and liver stiffness in obese children. BioMed Res Int 2015;2015:457473. [DOI] [PMC free article] [PubMed] [Google Scholar]
- 27.Mandelia C, Collyer E, Mansoor S, Lopez R, Lappe S, Nobili V, et al. Plasma cytokeratin-18 level as a novel biomarker for liver fibrosis in children with nonalcoholic fatty liver disease. J Pediatr Gastroenterol Nutr 2016;63:181–7. [DOI] [PubMed] [Google Scholar]
- 28.Feldstein AE, Alkhouri N, De Vito R, Alisi A, Lopez R, Nobili V. Serum cytokeratin-18 fragment levels are useful biomarkers for nonalcoholic steatohepatitis in children. Am J Gastroenterol 2013;108: 1526–31. [DOI] [PubMed] [Google Scholar]
- 29.Alkhouri N, Mansoor S, Giammaria P, Liccardo D, Lopez R, Nobili V. The development of the pediatric NAFLD fibrosis score (PNFS) to predict the presence of advanced fibrosis in children with nonalcoholic fatty liver disease. PloS One 2014;9:e104558. [DOI] [PMC free article] [PubMed] [Google Scholar]
- 30.Fitzpatrick E, Mitry RR, Quaglia A, Hussain MJ, DeBruyne R, Dhawan A. Serum levels of CK18 M30 and leptin are useful predictors of steatohepatitis and fibrosis in paediatric NAFLD. J Pediatr Gastroenterol Nutr 2010;51:500–6. [DOI] [PubMed] [Google Scholar]
- 31.Mansoor S, Yerian L, Kohli R, Xanthakos S, Angulo P, Ling S, et al. The evaluation of hepatic fibrosis scores in children with nonalcoholic fatty liver disease. Dig Dis Sci 2015;60:1440–7. [DOI] [PubMed] [Google Scholar]
- 32.Lichtinghagen R, Pietsch D, Bantel H, Manns MP, Brand K, Bahr MJ. The Enhanced Liver Fibrosis (ELF) score: normal values, influence factors and proposed cut-off values. J Hepatol 2013;59:236–42. [DOI] [PubMed] [Google Scholar]
- 33.Sanyal AJ, Chalasani N, Kowdley KV, McCullough A, Diehl AM, Bass NM, et al. Pioglitazone, vitamin E, or placebo for nonalcoholic steatohepatitis. N Engl J Med 2010;362:1675–85. [DOI] [PMC free article] [PubMed] [Google Scholar]
- 34.Davison BA, Harrison SA, Cotter G, Alkhouri N, Sanyal A, Edwards C, et al. Suboptimal reliability of liver biopsy evaluation has implications for randomized clinical trials. J Hepatol 2020;73: 1322–32. [DOI] [PubMed] [Google Scholar]