Abstract
The feasibility of detecting mild exercise-related muscle fatigue via stimulated echo (STE) and q-space imaging (qsi) was evaluated. The right calves of seven healthy volunteers were subjected to mild exercise loading, and qsi was generated using spin echo (Δ: 45.6 ms) and three different STE (Δ: 114, 214, and 414 ms) acquisitions. We concluded that qsi with an increased STE diffusion time can detect mild fatigue in the gastrocnemius muscle.
Keywords: diffusion-weighted imaging, stimulated echo, muscle fatigue, q-space imaging
Introduction
Diffusion-weighted imaging (DWI) and diffusion tensor imaging are widely used to measure various quantitative parameters. The apparent diffusion coefficient and fractional anisotropy (FA) are evaluated under the assumption that the distribution of water molecules is Gaussian. Conversely, q-space imaging (qsi) is a type of diffusion-weighted MRI in which Gaussian distribution is not assumed.1 In qsi, which uses more data than standard DWI, the restricted space is examined indirectly from the distribution of the measured water molecule displacement.2–4 This approach enables the determination of subtle structural changes and the generation of information distinct from the apparent diffusion coefficient and FA.
The diffusion time is an important parameter in DWI, and the sufficient prolongation of this parameter can enable a distinction between cases in which water molecules are restricted within the time available and those involving a spatial obstacle to movement.5 In the brain, the neurons comprise limited microscopic structures that can only be described by a diffusion time at least as short as the diffusion time provided by spin echo (SE). However, skeletal muscle cells are relatively much larger than brain neurons, and SE cannot generate a diffusion time sufficient for obtaining information about the structure of skeletal muscle cells. Notably, stimulated echo (STE) can be used to prolong the diffusion time by adjusting the mixing time (TM) rather than prolonging the TE. Therefore, STE may be better suited than SE to describe the subtle changes caused by light exercise and other factors in skeletal muscle.
During the process of recovery from muscle contraction, lactic acid accumulation in the muscle tissue results in intramyocytic acidification, and the breakdown of adenosine triphosphate results in inorganic phosphate accumulation. Taken together, these processes result in exercise-related muscle fatigue, a condition involving a rapid physiological decrease in muscle tone at the time of muscle contraction. Currently, magnetic resonance spectroscopy and MRI as well as specific techniques such as 31P-magnetic resonance spectroscopy and T2 mapping are being used in related research. The chemical shifts in creatine phosphate and inorganic phosphate can be measured by magnetic resonance spectroscopy, and fatigue due to lactic acid accumulation can be evaluated based on the intramyocytic pH. Particularly, T2-weighted imaging (T2WI) can detect fatigue after skeletal muscle activity.6 Water present in bodily tissues can be classified broadly as bound, which is attached to proteins and other biological macromolecules, or free, which moves freely within the body. Increases in T2-weighted signals are thought to be due to temporary increases in the amount of free water inside muscle tissue. Therefore, T2WI does not reflect subtle changes in the muscle cells themselves.
Strong exercise stimulation leads to an increase in water molecules in the muscle tissue, whereas weak exercise produces only subtle, rather than active, changes in water molecule localization. Hypothetically, qsi can determine fine structural changes in skeletal muscles even after low-intensity muscular activity. Although only a few reports have described the use of STE for qsi, the existing information suggests that a prolonged diffusion time would facilitate an accurate determination of the migration distances of water molecules and would thus improve the quantitative values. Considering that the diameter of skeletal muscle cells is relatively large (> 50 µm),7 a long diffusion time of ≥ 150 ms is required to measure the cell size from the mean square displacement of water molecule movement. In addition, long diffusion times can be fully achieved by using STE.8 Therefore, it may also be possible to detect more subtle changes in the muscle tissue by using STE, instead of the conventional SE, to extend the diffusion time. In a previous study, we showed that qsi could be used to depict muscle microstructural features, such as the cell size.9 In this study, we aimed to verify the usefulness of STE with qsi for targeting the lower-limb skeletal muscles and to verify whether this approach could detect subtle structural changes after low-intensity muscular activity.
Materials and Methods
Study population
This study was approved by the Ethics Committee at the participating university hospital (No. 20170024). All subjects provided informed consent to participate. Seven Japanese healthy volunteers (three males and four females) with a mean age (standard deviation: SD) of 27.1 [2.1] years were recruited. Volunteers with a previous history of trauma to the lower leg were excluded. The participants were asked not to exercise for 1 week. On the test day, they were ordered to perform one set (100 repetitions) of heel-up exercises while standing on one leg (right side) immediately before undergoing MRI. We designated the left and right lower limbs as the control group (CG) and stress group (SG), respectively.
To evaluate the quantification and reproducibility of exercise stress in our previous study, we adopted a rebound jumping exercise involving a unilateral leg as the stretch-shortening cycle exercise.6 However, this exercise would reflect not only muscle fatigue but also centrifugal muscle contractions.10 Moreover, we were able to confirm the effects of this exercise on the muscles using T1-weighted imaging (T1WI), T2WI, and DWI over several days. Therefore, for this study, we adopted the heel-up exercise that is considered a less stressful exercise and is less likely to affect the T1 and T2 values.
MRI protocol
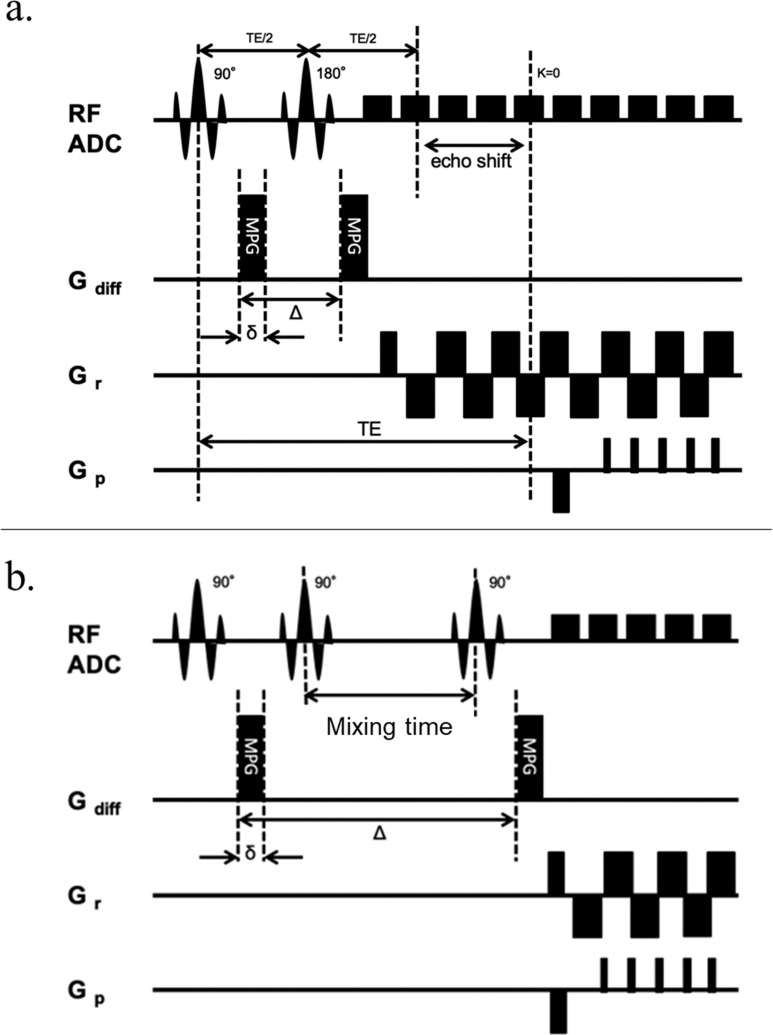
All subjects underwent imaging of both lower legs using a 3T MRI scanner (MAGNETOM Skyra Fit; Siemens Healthcare, Erlangen, Germany) with a 60-channel Body Coil (Siemens Healthineers). Axial T2WI was used to determine the placement of the greatest leg circumference and diameter. One slice each of the DWI and T2 mapping MRI sequences were also selected around the identified point where the leg circumference and diameter were the highest. As a result, three slices of DWI and T2 mapping MRI were produced per participant. DWI was performed using a SE and STE echo planar imaging prototype sequence, which was provided by Siemens Healthcare as a work-in-progress program. Details of these protocols are listed in Table 1. T2 mapping MRI data were acquired using a multispin-echo sequence with different TEs. The schematic timing diagrams of the SE and STE diffusion encoding schemes were based on the Stejskal–Tanner diffusion preparation,11 as shown in Fig. 1.
Table 1.
Summary of the magnetic resonance imaging protocol
| Contrast | q-space imaging | T2-weighted imaging | T2 map |
|---|---|---|---|
| Sequence | SE/STE | Rapid acquisition with relaxation enhancement | Carr–Parcell–Meiboom–Gill |
| Slice thickness (mm) | 8 | 4 | 8 |
| No. of slices | 3 | 3 | 3 |
| FOV read (mm) | 400 × 275 | 400 × 275 | 400 × 275 |
| Resolution | 128 × 96 | 512 × 352 | 256 × 176 |
| Average | 2 | 2 | 1 |
| Fat suppression | Short TI inversion recovery/(TI: 240 ms) | - | - |
| TR (ms) | 4000 | 6310 | 3000 |
| TE (ms) | SE: 93, STE: 82 | 101 | 8.1, 16.2, 24.3, 32.4, 40.5, 48.6, 56.7, 64.8 |
| δ (ms) | SE: 27.9, STE: 20 | - | |
| Δ (ms) | SE: 45.6, STE: 114 (TM100), 214 (TM200), 414 (TM400) | ||
| Diffusion direction | 6 | ||
| q-value (cm−1) | 0, 39.8, 79.6, 119.4, 159.2, 198.9, 238.7, 275.6, 315.8, 355.9 | ||
| Input b-value (s/mm2) | 0, 50, 200, 450, 800, 1250, 1800, 2400, 3150, 4000 | ||
δ, diffusion gradient duration; Δ, diffusion gradient separation (time between the two leading edges of the diffusion gradients), SE, spin echo; STE, stimulated echo; TI, tau inversion; TM, mixing time.
Fig. 1.
Schematic diagram of the timing of the spin echo and stimulated diffusion encoding schemes. (a) SE: the diffusion time is extended by adjusting the TE. (b) STE: the STE with three 90° is used for imaging. The diffusion time is extended by adjusting the mixing time. δ, gradient length; E the time between the two leading edges of the diffusion gradient; ADC, apparent diffusion coefficient; Gdiff, gradient (diffusion encoding); Gp, gradient (phase encoding); Gr, gradient (readout encoding); MPG, motion-probing gradient; SE, spin echo; STE, stimulated echo.
The estimated SNRs were calculated for the DWI at each q-value and in each ROI of muscles in the unloaded side (left side) according to the following formula:
| (1) |
where Ms is the average signal intensity and Mb is the background noise intensity.
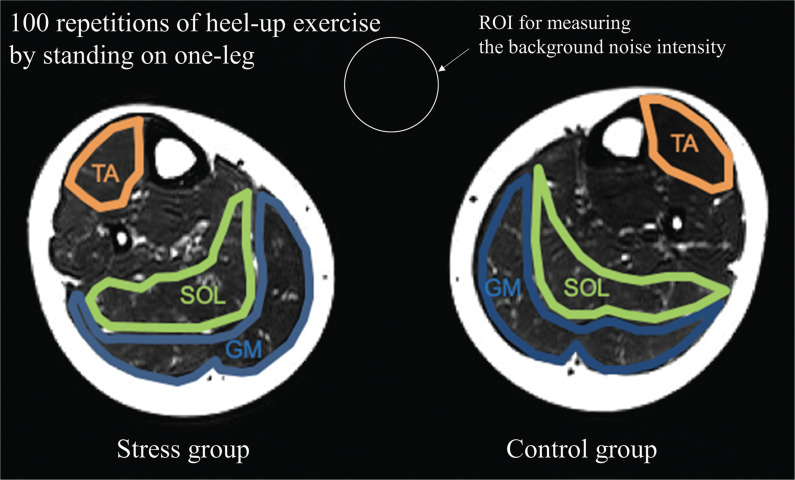
The ROIs for measuring the background noise intensity were placed ventrally between the legs (Fig. 2).
Fig. 2.
Example ROIs on axial T2-weighted images of the bilateral calves. The subjects were asked to perform the heel-up exercise only on the right lower limb. We defined the right lower limb as the stress group and the left lower limb as the control group. ROIs over the TA, SOL, and GM are indicated in orange, green, and blue, respectively. ROI for measuring the background noise intensity is indicated in white. GM, gastrocnemius muscle; SOL, soleus muscle; TA, tibialis anterior muscle.
The qsi calculations were performed using an in-house program (developed in C++; Embarcadero Technologies, Austin, TX, USA). T2 mapping calculations were performed using the vendors software (Siemens Healthcare). Specifically, T2 mapping was performed with mono-exponential curve fitting according to the following formula:
| (2) |
where SI (TE) is the signal intensity at each TE, M(0) is the equilibrium magnetization, and TE is the echo time.
We analyzed the DWI signals at all q-values according to the qsi algorithm for each motion-probing gradient direction.12 In this analysis process, the signal attenuation subjected to the diffusion encoding is related to the displacement probability by means of the reciprocal spatial vector q.13 Probability density function (PDF) calculation was performed by fast Fourier transformation of the data after zero-filling of the measurement.
The shape of the calculated displacement probability could be characterized by kurtosis, the full width at half maximum (FWHM), and the probability at zero displacement (ZP). We used the FWHM and ZP in this study.
We performed the tensor calculation by acquiring six axis data of qsi (Table 1). In this study, we defined our own q-space anisotropic index (qA) based on the concept of FA according to the Gaussian diffusion model for evaluating anisotropy. We used qA to perform detailed discrimination of the muscle cells exhibiting a spindle-shaped morphology, with reference to FA according to the Gaussian diffusion model.14 The three eigenvalues (λ1, λ2, λ3) and their corresponding eigenvectors were calculated. Then, the qA of
qsi values was calculated as follows:
| (3) |
where mqsi represents the mean qsi value. The qA of qsi (FWHM and ZP) values ranged from 0 to 1, indicating isotropic and anisotropic, respectively. The analyzed skeletal muscles included the anterior tibialis muscle (TA), soleus muscle (SOL) and gastrocnemius (GM). As described previously, the left and right lower limbs were allocated as the CG and SG, respectively (Fig. 2).
ROI settings
All ROIs were evaluated by a single orthopedic surgeon and single radiological technologist with 14 and 13 years of experience, respectively. T2WI data were used for anatomical reference and to set the ROIs (Fig. 2). Structures outside the muscles were carefully avoided. The imaging values were measured using ImageJ 1.51k (available at http://rsbweb.nih.gov/ij/; National Institutes of Health, Bethesda, MD, USA).
Statistical analysis
The analyses involving independent triplicate analyses on different days were performed to assess the reliability of the calculations. In order to examine the interobserver reliability, we performed a blinded analysis so that the two observers did not see each other’s ROIs. The reliability of the data was quantified using the intraclass correlation coefficient (ICC) for absolute agreement that were interpreted as follows: 0.81–1.0, substantial agreement; 0.61–0.80, moderate agreement; 0.41–0.60, fair agreement; 0.11–0.40, slight agreement; and 0.00–0.10, virtually no agreement. The Wilcoxon signed-rank test was used to examine the differences between the control and stress groups in each sequence on the TA, SOL, and GM. The size of each difference between the two groups was determined by calculating the effect size of parameters that differed significantly between the groups.
Cohen’s d was used to calculate the effect size between the control and stress groups in each sequence. Cohen’s d is defined as the difference between two means divided by the SD of the data and is calculated using the following formula:
| (4) |
where and are the means of the control and stress groups, respectively. The difference in comparison between the two groups increases with an increasing effect size. We considered a d of < 1 or > 1 to indicate a moderate or large effect size, respectively.
All statistical analyzes were performed using SPSS statistics software, version 24 (IBM, Armonk, NY, USA). The significance level for all tests was set at P < 0.05. Data are presented as means ± SDs.
Results
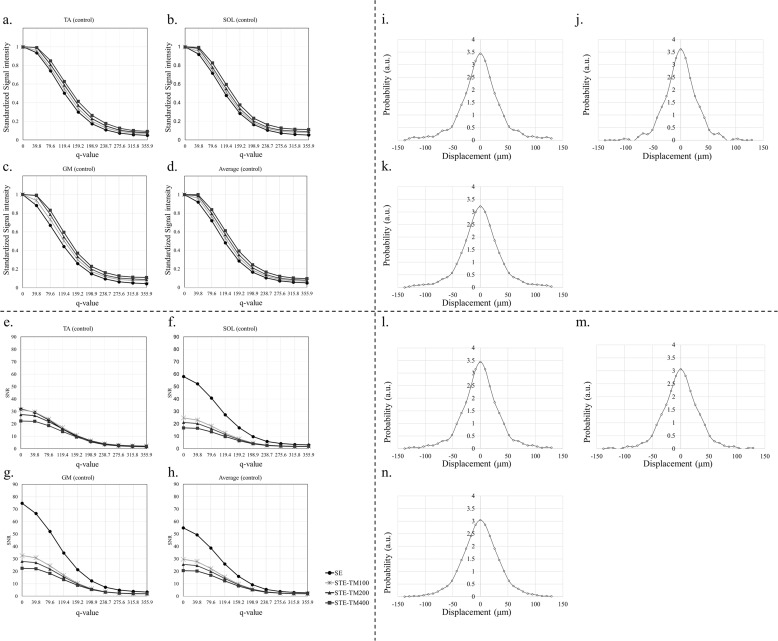
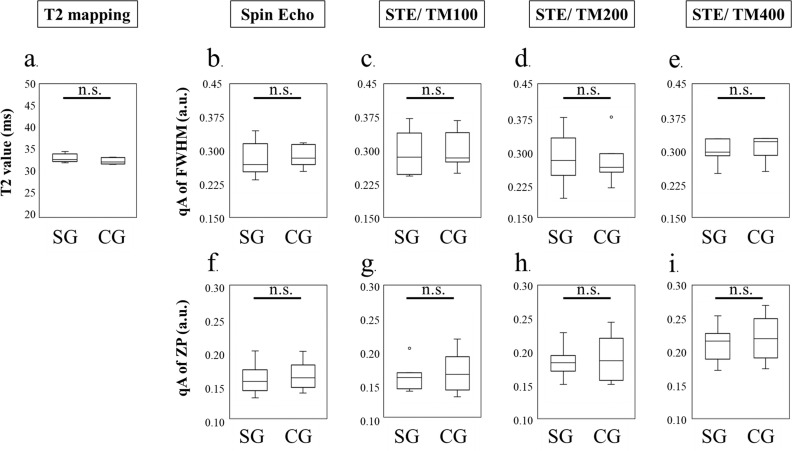
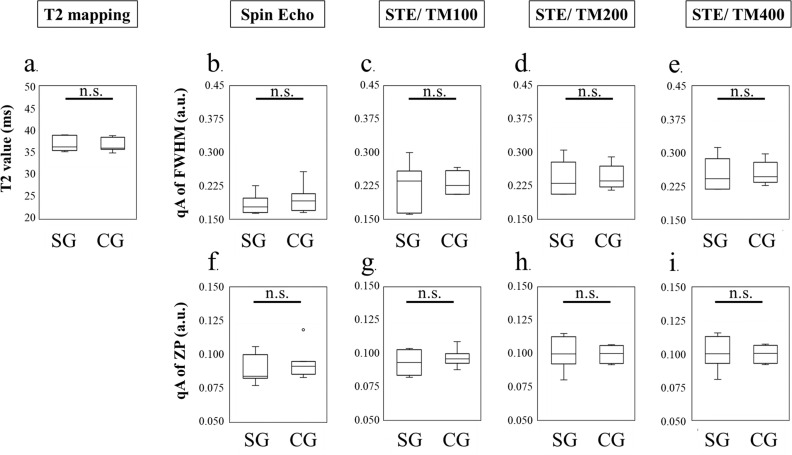
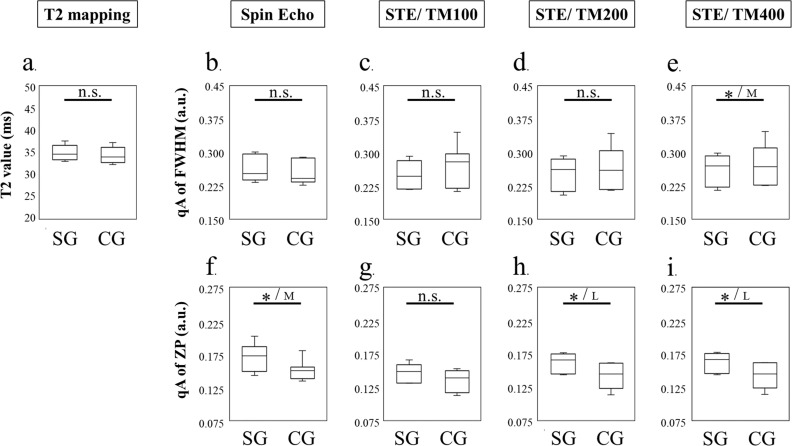
Figure 3 presents the value at each q-value, which was standardized by a q-value of 0 (Fig. 3a–3d), the SNR in each muscle (Fig. 3e–3h) and examples of probability density function curves (Fig. 3i–3n). A blinded assessment (i.e., ROI drawing) was conducted independently and in triplicate to assess the reliability of the MRI parameters. The ICCs for intraobserver and interobserver reliabilities were 0.902 and 0.853, respectively. The quantitative MRI data are presented in Figs. 4–6, which present the results for the TA, SOL, and GM, respectively. On the TA and SOL, none of the MRI parameters (T2 map, qsi parameters using SE and STEs) could identify significant changes between the CG and SG (Figs. 4 and 5) (not significant).
Fig. 3.
The values at each q-value, which were standardized by a q-value of 0, SNRs for each q-value, acquisition type, and muscle for the control group and examples of probability density function curves. The values at each q-value, which were standardized by a q-value of 0 of the (a) TA, (b) SOL, and (c) GM. (d) The average of the standardized values of the TA, SOL, and GM. SNRs of the (e) TA, (f) SOL, and (g) GM. (h) The averages of the SNRs of the TA, SOL, and GM. Examples of probability density function curves of the (i) TA, (j) SOL, and (k) GM on control group. Examples of probability density function curves of the (l) TA, (m) SOL, and (n) GM on stress group. a.u., arbitrary units; GM, gastrocnemius muscle; SE, spin echo; SOL, soleus muscle; STE, stimulated echo; TA, tibialis anterior muscle; TM, mixing time.
Fig. 4.
Comparison of the TA between the CG and SG using T2 mapping, FWHM, and probability at ZP for SE and STE (mixing time: 100 ms, 200 ms, and 400 ms). (a): T2 map. (b): qA of the FWHM using SE. (c–e) qA of the FWHM using STE at a TM of (c) 100 ms, (d) 200 ms, or (e) 400 ms. (f) qA of the ZP using SE. (g–i) qA of the ZP using STE at a TM of (g) 100 ms, (h) 200 ms, or (i) 400 ms. ROIs were set on the TA. None of the imaging parameters could distinguish the effect of the heel-up exercise. a.u., arbitrary units; CG, control group; FWHM, full width at half maximum; n.s., not significant; qA, q-space anisotropic index; SE, spin echo; SG, stress group; STE, stimulated echoes; TA, tibialis anterior muscles; TM, mixing time; ZP, zero displacement.
Fig. 5.
Comparison of the SOL between the CG and SG using T2 mapping, FWHM, and probability at ZP for SE and STE (TMs: 100ms, 200 ms, and 400 ms). (a) T2 map. (b) qA of the FWHM using SE. (c–e) qA of the FWHM using STE at a TM of (c) 100 ms, (d) 200 ms, or (e) 400 ms. (f) qA of the ZP using SE. (g–i) qA of the ZP using STE at a TM of (g) 100 ms, (h) 200 ms, or (i) 400 ms. ROIs were set on the soleus muscles. All imaging parameters could not distinguish the effect of the heel-up exercise. a.u., arbitrary units; CG, control group; FWHM, full width at half maximum; n.s., not significant; qA, q-space anisotropic index; SE, spin echo; SG, stress group; SOL, soleus muscles; STE, stimulated echoes; TM, mixing time; ZP, zero displacement.
Fig. 6.
The results of gastrocnemius muscles: the comparison between CG and SG using T2 mapping, FWHM, and probability at ZP for SE and STE (TM: 100 ms, 200 ms, and 400 ms). (a) T2 map. (b) qA of the FWHM using SE. (c–e): qA of the FWHM using STE at a TM of (c) 100 ms, (d) 200 ms, or (e) 400 ms. (f) qA of the ZP using SE. (g–i) qA of the ZP using STE at a TM of (g) 100 ms, (h) 200 ms, or (i) 400 ms. ROIs were set on the gastrocnemius muscles. The qA of ZP using SE and STE at a TM of 200 ms and STE at a TM of 400 ms and the qA of FWHM using STE at a TM of 400 ms could distinguish the effect of the heel-up exercise. Particularly, STE at a TM of 200 ms and 400 ms had a larger effect size than SE, which had a moderate effect size. T2 mapping could not distinguish this effect. a.u., arbitrary units; CG, control group; FWHM, full width at half maximum; L, large effect size (d ≧ 1.0); M, moderate effect size (d ≧ 1.0); n.s., not significant; qA, q-space anisotropic index; SE, spin echo; SG, stress group; STE, stimulated echoes; TM, mixing time; ZP, zero displacement. *P < 0.05.
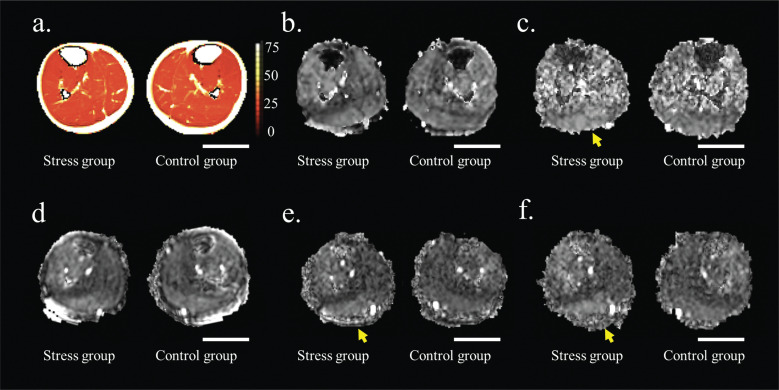
The GM is considered the most stressed area during heel-up exercise. However, the T2 map failed to detect the effect of the heel-up exercise on the GM (Fig. 6a) (not significant). According to a qsi study that used SE, the qA of the FWHM could not detect the effect of the heel-up exercise (Fig. 6b) (not significant). On the other hand, the qA of the ZP using SE could indicate the effect of the heel-up exercise with moderate effect size (Fig. 6f) (P < 0.05). In the STE study, the effect of the heel-up exercise on the GM could not be perceived using a short STE (TM of 100) (Fig 6c and 6g) (not significant). In the qA of an FWHM study, although the effect of heel-up exercise load could not be assessed with an STE TM of 200 (Fig. 6d) (not significant), the effect of exercise load could be shown only by lengthening the TM up to 400 ms with moderate effect size (Fig. 6e) (P > 0.05). In the qA of the ZP study, a TM of >200 ms was the most sensitive way to determine the effect of exercise load compared to other imaging methods with large effect sizes (Fig 6h and 6i) (P > 0.05). Although the qA of the ZP using SE could also discriminate the effect of the heel-up exercise in the GM, the qA of the ZP using STE at a TM of 200 and 400 ms yielded larger effect sizes, suggesting that the longer diffusion time affected the discrimination. Representative MR images (T2 map, qA of FWHM, and qA of the ZP) for each group are presented in Fig. 7. The qA of the FWHM using an STE at a TM of 400 ms (Fig. 7c) and the qA of the ZP using an STE at TM of 200 ms (Fig. 7e) and 400 ms (Fig. 7f) could distinguish the effect of the heel-up exercise in the GM.
Fig. 7.
T2 mapping and representative q-space imaging-derived images (qA of FWHM and probability at ZP). T2 mapping and representative q-space imaging-derived images (qA of FWHM and probability at ZP). (a) T2 map. (b, c) qA of the FWHM maps generated using (b) SE, or (c) STE at a TM of 400 ms. (d–f) qA of the ZP maps using (d) SE, (e) STE at a TM of 200 ms, or (f) STE at a TM of 400 ms. The conditions in (c), (e), and (f) could distinguish the effect of the heel-up exercise on the GM. The yellow arrows indicate regions depicting mild myocyte changes in the gastrocnemius muscle. The contrast is aligned for each q-space imaging parameter. CG, control group; FWHM, full width at half maximum; GM, gastrocnemius muscles; qA, q-space anisotropic index; SE, spin echo; SG, stress group; STE, stimulated echoes; TM, mixing time; ZP, zero displacement. Scale bar = 5 cm.
Discussion
In this study, we subjected the GM, which is the principal mobilized muscle in the lower leg, and the TA and SOL, which are immobilized, to a low-intensity exercise load and subsequent examination. The T2 imaging data and qA of the FWHM and ZP did not reveal any significant differences between the SG and CG in the TA and SOL, irrespective of the diffusion time prolongation. In the GM, the qA at a TM of 200 and 400 ms yielded significant differences between the SG and CG, whereas T2 did not detect significant differences. In this study, we used a low-intensity exercise load to target only the principal mobilized muscle (GM) and avoid affecting the immobilized muscles (TA and SOL). Therefore, the effects on the immobilized muscles were so small that the differences between the two groups could not be identified using any method. Additionally, the load on the GM, a mobilized muscle, was so small that it could not be distinguished using T2 mapping.
A transient muscle contraction, or “simple contraction,” occurs if the simple and short-duration muscle stimulation is included as a factor determined in relation to the qA of the FWHM and ZP. An increasing stimulation strength would increase the number of contracting muscle fibers and improve the muscle tone.10 We theorize that the muscle fibers contracted in response to the low-intensity exercise load, leading to changes in the proportions of the following parameters: (i) restricted diffusion, or diffusion that only occurs within cells; (ii) hindered diffusion, or diffusion that is inhibited by collisions with obstructions between cells; and (iii) a hydration water pool, in which water is restricted to the areas surrounding macromolecules (e.g., cell membranes). Here, a prolonged diffusion time was useful because it enabled sufficient diffusion time along the long axes of skeletal muscles.15 By using STE to prolong the TM, the long set diffusion time enabled the accurate determination of differences in water molecule migration, which appeared to improve the quantitative measurements.
We attributed the deterioration of images at a TM of 400 ms to the prolonged STE TM. When using STE, the stored magnetization decays with the longitudinal relaxation time (T1) during TM, and this is thought to affect the DWI SNR.16 In this study, the device required a set TE of 400 ms when the TM for the SE was set at 200 ms. Although it was not practical to prolong the diffusion time by adjusting the TE in skeletal muscle tissue, which has a short T2, we believe that the use of STE to prolong the diffusion time can be beneficial.
Often, FWHM is used for characterizing qsi, and ZP is rarely used as an independent parameter.17 However, our results demonstrate that ZP might be useful as an independent parameter. Ong et al. reported that ZP is considered to be highly correlated with 1/FWHM because the FWHM is measured as the FWHM of the PDF, and ZP is measured as the height of the profiles at zero displacement.18 Further discussion of the abovementioned aspect is presented in the Supplementary material. Supplementary Fig. 1 shows the results of the correlation analysis of ZP and FWHM. Although our results show a moderately negative correlation between ZP and FWHM, they also show that ZP and FWHM do not exactly capture the same phenomenon. Further research is required to investigate the differences between the phenomena represented by ZP and that represented by FWHM in the future. In our study, at least both FWHM and ZP were used to identify differences, and both were considered capable of reflecting the mechanical properties. We further note that improving the DWI SNR avoided the deterioration of the STE images secondary to a prolonged diffusion time, leading to a potential for significant differences based on the test results.
There are several limitations of note in this study. First, for all measurements involving volunteer subjects, imaging was performed in the order of T2 mapping first and then shortest to longest SE and STE diffusion times. Accordingly, the elapsed time between T2 mapping and STE-TM400 was approximately 20 min. Some reports have discussed observed increases in free water in response to a high exercise load for ≥ 20 min, but none have verified the time-related structural changes in contracting muscles subjected to a period of low-intensity load-bearing exercise. Therefore, the effect of the 20-min interval between the beginning and end of the exercise period remains unknown. However, we note that the observed intergroup difference was detected in the final STE TM400 measurement, which was considered relatively less affected by changes. Therefore, we believe that STE TM400 yields the highest sensitivity. A study with a randomized sequence order will be conducted in the future. Second, it is possible that using the right, or dominant, foot for the load exercise would affect the measurement results. Third, we would like to increase the TM but are concerned that the T1 recovery would reduce the signal accuracy. Future research will also likely include the further development of imaging techniques designed to identify not only the morphological characteristics of muscles, but also the changes caused by exercise load.
Conclusion
Our findings suggest that qsi may detect mild fatigue in the GM when the STE diffusion time is increased.
Acknowledgments
The authors would like to thank Medical Scanning Tokyo and Enago (www.enago.jp) for the English language review.
Footnotes
Conflicts of Interest: Daisuke Nakashima is the CEO of Grace imaging Inc. and owns stock in this company. Katsuya Maruyama and Thorsten Feiweier are employees of Siemens Healthcare GmbH, who provided crucial technical support with the MR sequence but were not involved in data acquisition and analysis. No conflicts of interest are declared for the remaining authors.
References
- 1.Hori M,, Fukunaga I,, Masutani Y,, et al. et al. Visualizing non-Gaussian diffusion: Clinical application of q-space imaging and diffusional kurtosis imaging of the brain and spine. Magn Reson Med Sci 2012; 11:221–233. [DOI] [PubMed] [Google Scholar]
- 2.Cohen Y,, Assaf Y. High b-value q-space analyzed diffusion-weighted MRS and MRI in neuronal tissues – A technical review. NMR Biomed 2002; 15:516–542. [DOI] [PubMed] [Google Scholar]
- 3.Nakashima D,, Fujita N,, Hata J,, et al. et al. Quantitative analysis of intervertebral disc degeneration using Q-space imaging in a rat model. J Orthop Res 2020; 38:2220–2229. [DOI] [PubMed] [Google Scholar]
- 4.Sone Y,, Hata J,, Sera Y,, et al. et al. iShim and water excitation improves the signal-to-noise ratio on q-space imaging: A single-center clinical study. Open J Radiol 2018; 8:244–259. [Google Scholar]
- 5.Cohen Y,, Anaby D,, Morozov D. Diffusion MRI of the spinal cord: From structural studies to pathology. NMR Biomed 2017; 30:e3592. [DOI] [PubMed] [Google Scholar]
- 6.Hata J,, Endo K,, Tsuji O,, et al. et al. Analysis of skeletal-muscle condition after excessive loading of the lower legs by sequential magnetic resonance imaging. J Orthop Sci 2019; 24:873–880. [DOI] [PubMed] [Google Scholar]
- 7.Kern H,, Barberi L,, Lofler S,, et al. et al. Electrical stimulation counteracts muscle decline in seniors. Front Aging Neurosci 2014; 6:189. [DOI] [PMC free article] [PubMed] [Google Scholar]
- 8.Hata J,, Yagi K,, Hikishima K, et al. Characteristics of diffusion-weighted stimulated echo pulse sequence in human skeletal muscle. Radiol Phys Technol 2013; 6:92–97. [DOI] [PubMed] [Google Scholar]
- 9.Hata J,, Nakashima D,, Tsuji O,, et al. et al. Noninvasive technique to evaluate the muscle fiber characteristics using q-space imaging. PLoS One 2019; 14: e0214805. [DOI] [PMC free article] [PubMed] [Google Scholar]
- 10.Miyaguchi K,, Sugiura H,, Demura S. Possibility of stretch-shortening cycle movement training using a jump rope. J Strength Cond Res 2014; 28:700–705. [DOI] [PubMed] [Google Scholar]
- 11.Stejskal EO,, Tanner JE. Spin diffusion measurements: Spin echoes in the presence of a time‐dependent field gradient. J Chem Phys 1965; 42:288–292. [Google Scholar]
- 12.Assaf Y,, Mayk A,, Cohen Y. Displacement imaging of spinal cord using q-space diffusion-weighted MRI. Magn Reson Med 2000; 44:713–722. [DOI] [PubMed] [Google Scholar]
- 13.Yamada I,, Hikishima K,, Miyasaka N,, et al. et al. q-space MR imaging of gastric carcinoma ex vivo: Correlation with histopathologic findings. Magn Reson Med 2016; 76:602–612. [DOI] [PubMed] [Google Scholar]
- 14.Basser PJ. Inferring microstructural features and the physiological state of tissues from diffusion-weighted images. NMR Biomed 1995; 8:333–344. [DOI] [PubMed] [Google Scholar]
- 15.Le Bihan D,, Mangin JF,, Poupon C,, et al. et al. Diffusion tensor imaging: concepts and applications. J Magn Reson Imaging 2001; 13:534–546. [DOI] [PubMed] [Google Scholar]
- 16.Lehnert A,, Machann J,, Helms G,, et al. Diffusion characteristics of large molecules assessed by proton MRS on a whole-body MR system. Magn Reson Imaging 2004; 22:39–46. [DOI] [PubMed] [Google Scholar]
- 17.Yamada I,, Hikishima K,, Miyasaka N,, et al. et al. Esophageal carcinoma: Evaluation with q-space diffusion-weighted MR imaging ex vivo. Magn Reson Med 2015; 73:2262–2273. [DOI] [PubMed] [Google Scholar]
- 18.Ong HH,, Wright AC,, Wehrli SL,, et al. et al. Indirect measurement of regional axon diameter in excised mouse spinal cord with q-space imaging: simulation and experimental studies. Neuroimage 2008; 40:1619–1632. [DOI] [PMC free article] [PubMed] [Google Scholar]


