Abstract
Purpose
The cardiac- and respiratory-driven components of cerebrospinal fluid (CSF) motion characteristics and bulk flow are not yet completely understood. Therefore, the present study aimed to characterize cardiac- and respiratory-driven CSF motions in the intracranial space using delay time, CSF velocity waveform correlation, and displacement.
Methods
Asynchronous two-dimensional phase-contrast at 3T was applied to measure the CSF velocity in the inferior–superior direction in a sagittal slice at the midline (N = 12) and an axial slice at the foramen magnum (N = 8). Volunteers were instructed to engage in six-second respiratory cycles. The calculated delay time and correlation coefficients of the cardiac- and respiratory-driven velocity waveforms, separated in the frequency domain, were applied to evaluate the propagation of the CSF motion. The cardiac- and respiratory-driven components of the CSF displacement and motion volume were calculated during diastole and systole, and during inhalation and exhalation, respectively. The cardiac- and respiratory-driven components of the velocity, correlation, displacement, and motion volume were compared using an independent two-sample t-test.
Results
The ratio of the cardiac-driven CSF velocity to the sum of the cardiac- and respiratory-driven CSF velocities was higher than the equivalent respiratory-driven ratio for all cases (P < 0.01). Delay time and correlation maps demonstrated that the cardiac-driven CSF motion propagated more extensively than the respiratory-driven CSF motion. The correlation coefficient of the cardiac-driven motion was significantly higher in the prepontine(P < 0.01), the aqueduct, and the fourth ventricle (P < 0.05). The respiratory-driven displacement and motion volume were significantly greater than the cardiac-driven equivalents for all observations (P < 0.01).
Conclusion
The correlation mapping technique characterized the cardiac- and respiratory-driven CSF velocities and their propagation properties in the intracranial space. Based on these findings, cardiac-driven CSF velocity is greater than respiratory-induced velocity, but the respiratory-driven velocity might displace farther.
Keywords: cerebrospinal fluid, cardiac, respiration, correlation mapping, displacement
Introduction
The understanding of cerebrospinal fluid (CSF) motion has recently evolved.1,2 CSF motion occurs due to cardiac pulsation, respiration, and bulk flow.3,4 Cardiac-driven motion results from the expansion and contraction of the major arteries and brain parenchyma that are induced by cardiac pulsation. Respiration alters the intrathoracic pressure, which, in turn, alters the venous return and causes a pressure change in the veins in the intracranial space. The motion induced by this pressure change is referred to as respiratory-driven motion. Bulk flow is the slow flow of CSF, possibly related to the clearance of wastes via the glymphatic system.5,6 One such waste is amyloid-beta, which is related to neurodegenerative diseases, such as Alzheimer’s disease. A detailed and comprehensive understanding of CSF dynamics is important but presently unattainable because bulk flow is much slower than the other two motions, making it substantially more difficult to monitor.
To date, cardiac-driven CSF motion has primarily been analyzed using cardiac-gated cine phase-contrast (PC).7 In addition, cardiac-driven CSF modulation has been observed recently using multi-spin echo acquisition cine imaging (MUSACI).8 The CSF motion between deep respiration and breath-holding states has been compared by applying the time-spatial labeling inversion pulse (time-SLIP) technique.9 Dynamic improved motion-sensitized driven-equilibrium steady-state free precession (iMSDE SSFP) has been used to qualitatively visualize intracranial CSF motion in quasi-real-time.10 Additionally, velocity-encoded echo-planar imaging can extract respiratory-driven CSF motion.11–14 However, these studies evaluated respiratory-driven motion in limited regions of the CSF space, providing an understanding of local regions without quantitative evidence. In addition, forced breathing has been shown to affect stroke volume;15 cardiac-driven CSF motion is expected to be minimal during deep respiration. Overall, further investigation is required to comprehensively and quantitatively analyze CSF motions in a wide region of the CSF space.
A correlation mapping technique has been proposed to quantitatively characterize CSF motion propagation in a particular region of the intracranial space.16,17 This technique distinguishes between cardiac-driven CSF motion in patients with idiopathic normal pressure hydrocephalus (iNPH) and healthy volunteers. Because the respiratory-driven motion was ignored in these previous studies,16,17 cardiac- and respiratory-driven CSF motions were separated into different frequency domains.18 In addition, the feasibility of correlation mapping based on asynchronous, non-gated, and 2D-PC imaging was examined in a few healthy volunteers to observe the differences in cardiac- and respiratory-driven CSF motion propagation.19
Based on the recent progress represented by the aforementioned studies, the present study performed correlation mapping in conjunction with an asynchronous 2D-PC technique on 12 healthy volunteers to establish a methodology for separating and characterizing cardiac- and respiratory-driven CSF motion propagation.
Materials and Methods
The internal review board of our institution approved this study. All volunteers were examined after their informed consent was obtained per the terms of the internal review board approval.
Differentiation of the cardiac- and respiratory-driven velocity components
An asynchronous 2D-PC technique using 3T MRI was performed in the evening on 12 healthy volunteers (10 males and 2 females with mean ± SD ages of 31 ± 13 years) in a fasting state. A self-developed audio instructional system directed the volunteers to breathe in six-second periods to limit the range of their respiration frequencies. An electrocardiogram (ECG) was used to measure the cardiac pulsation frequency, and a bellows-type pressure sensor was placed on the abdomen of each volunteer to obtain the respiratory frequency. Asynchronous PC images were acquired under the following conditions: sequence = SSFP; flow encoding direction = caudal–cranial; TR = 6.0 ms; TE = 3.9 ms; flip angle (FA) = 10°; parallel imaging factor = 4; acquisition matrix = 89 × 128 (half-Fourier); reconstruction matrix = 256 × 256; field of view (FOV) = 28 cm × 28 cm; slice thickness = 7 mm; velocity encoding (VENC) = 10 cm/s; slice directions = sagittal and axial. PC image acquisition with 217 ms (4.61 frames per second) of temporal resolution was repeated 256 times, resulting in ~56s of total acquisition time for each volunteer. The resultant frequency resolution of 0.018 Hz was sufficient to characterize the cardiac- and respiratory-driven components in the frequency spectrum.
The simulated velocity waveform consisted of cardiac and respiratory components with frequencies of 1 and 0.167 Hz, respectively. The cardiac- and respiratory-driven components of the CSF motion appeared in different frequency bands. The cardiac frequency band was defined as ± 0.15 Hz of bandwidth near the peak frequency of the ECG signal, while the respiratory frequency band was near the peak frequency of the respiratory monitoring signal. The cardiac- and respiratory-driven CSF velocities were then separately inverse-Fourier transformed to obtain the time-domain signal. During the experiment, the peak frequency of the cardiac-driven component was assigned to the peak frequency of the spectrum calculated from the ECG signal, while that of the respiratory-driven component was calculated from the bellows-type sensor signal. This separation procedure was performed for all the voxels in a voxel-by-voxel manner.
A ROI was selected in each of the following: the prepontine, aqueduct, fourth ventricle, and lateral ventricle. The peak-to-peak amplitudes of the velocity waveforms of the cardiac- and respiratory-driven CSF motions in each ROI were evaluated. The CSF in the intracranial space was segmented and extracted using the spatial-based fuzzy clustering method.20 This segmentation method classifies a specific tissue based on the signal intensity while considering the fuzziness of the boundaries between the tissues.
Spatial correlations and delay times of the cardiac- and respiratory-driven components
Correlation mapping was performed with a reference point set at the spinal subarachnoid space to determine the cardiac- and respiratory-driven CSF velocities. The algorithm of the correlation mapping technique is detailed in the Appendix. The delay time and the maximum correlation of the CSF motion propagation were calculated for the cardiac and respiratory frequency bands. These values were determined for all the voxels to provide the delay time and the maximum correlation maps. The delay time of the color bar was the average period of the cardiac and respiratory cycles of the volunteer during the data acquisition.
Cardiac- and respiratory-driven components of the displacement
The fluid displacement induced by cardiac pulsation and respiration was evaluated to further characterize the CSF motion. The displacements during diastole and systole, as well as during inhalation and exhalation, were separated based on the slope of the cardiac- or respiratory-driven CSF velocity waveform, respectively. A positive velocity waveform slope was defined as the motion induced by diastole or inhalation, while a negative slope was defined as the motion induced by systole or exhalation. The velocities during diastole or inhalation and during systole or exhalation were integrated; the displacement during the physiological state was then averaged over the cycles during the acquisition. The displacements in diastole or inhalation, as well as in systole or exhalation, were calculated using the following equations:
where Ddia/inh is the CSF displacement induced by diastole or inhalation, Dsys/exh is the displacement induced by systole or exhalation, Mdia/inh and Msys/exh are the numbers of data points obtained during each physiological state, N is the number of cardiac or respiratory cycles, v is the CSF velocity, and ∆t is the temporal resolution. The displacements were calculated for the cardiac and respiratory cycles.
The amplitudes of the velocity waveforms of the cardiac- and respiratory-driven CSF motions were modified by multiplying the ratio of the energy loss to the total energy of the cardiac- or respiratory-driven motions to evaluate the energy within the selected frequency bands. The total energy of the cardiac pulsation was calculated as the sum of the energy in ± 0.3 Hz bandwidth distributed about the peak frequency of the ECG signal, while the total energy of the respiratory-driven motion was the sum of the energy between 0.018 and 0.6 Hz. Energy loss was determined as the ratio between the total energy and the energy in the frequency band selected for analysis. After compensating for the energy loss, the cardiac- and respiratory-driven CSF displacements were quantified for each ROI and overlaid with each other to evaluate the correlation and delay time.
Cardiac- and respiratory-driven components of the volume of CSF in motion
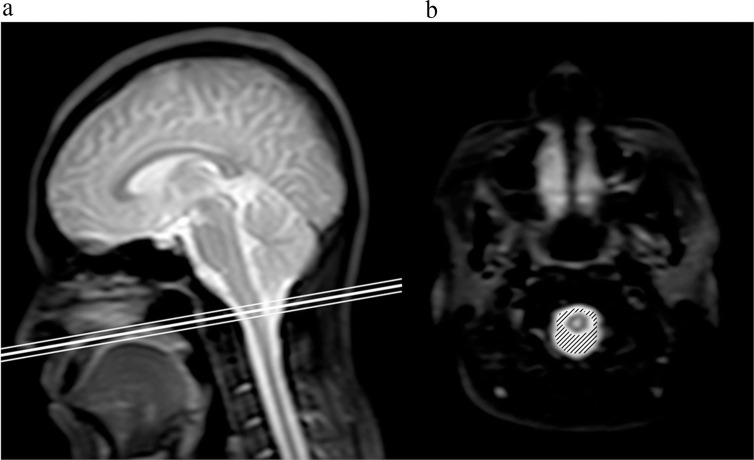
As shown in Fig. 1, the cardiac- and respiratory-driven components of the volume of CSF in motion were measured at the level of the foramen magnum and in the oblique axial plane. Eight healthy volunteers (six males and two females with mean ± SD ages of 33 ± 15 years) were tested, and the same parameters were applied as in the previously described 2D-PC examination. The results were compared with the displacement calculated using the CSF velocity. The volume of CSF in motion was calculated by multiplying the CSF displacement, which was obtained as in Equations [1] and [2], with the cross-sectional area of the CSF cavity. The hatched region in Fig. 1b was the area of the CSF cavity determined using a combination of SFCM and pulsatility-based segmentation (PUBS).21 The latter segmentation technique extracted a region demonstrating a high correlation coefficient (R > 0.7) between the CSF velocity waveforms at particular reference points.
Fig. 1.
Slice location for the motion volume analysis. An oblique axial slice at the foramen magnum, shown on a sagittal T2-weighted image (a), appeared to be normal. The thick line indicates the center of the slice, while the thin lines delineate the slice thickness. The hatched region on the corresponding image (b) denotes the cross-sectional area of the CSF space. CSF, cerebrospinal fluid.
Results
Differentiation of the cardiac- and respiratory-driven components of the CSF velocity
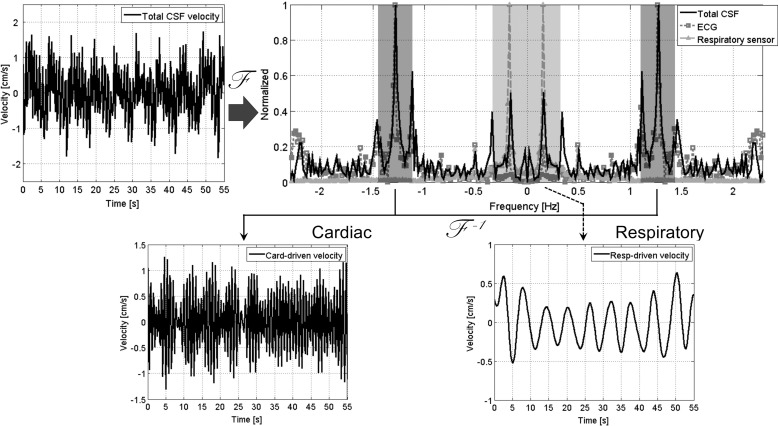
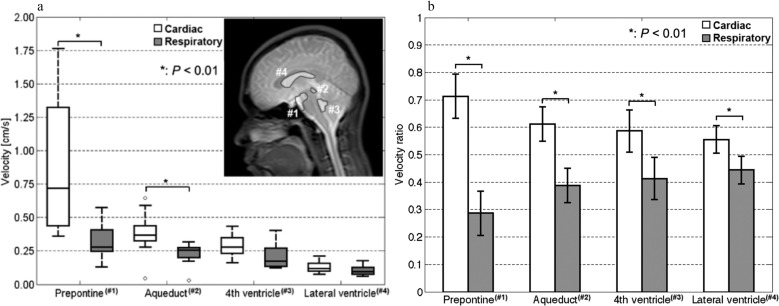
Movie 1 provides an example of the result typically obtained in this study for the intracranial velocity distribution, as measured by the asynchronous 2D-PC technique. The separation of the cardiac- and respiratory-driven components of the CSF velocities is shown in Fig. 2. The mean ± SD of the cardiac frequency in the velocimetry experiments was 1.35 ± 0.21 Hz (= 0.75 ± 0.11s) during the acquisition; the respiratory frequency was 0.16 ± 0.01 Hz (= 6.33 ± 0.30s). The peak frequency of the velocity spectrum quantified at the straight sinus was 0.16 ± 0.01 Hz, which was identical to the respiratory frequency during the scan. The respiratory pressure sensor signal had a maximum variation of 10% in the maximum peak-to-peak values during the scans of the individual volunteers. The cardiac-driven velocity distribution is shown in Movie 2, and the respiratory-driven velocity distribution is presented in Movie 3. The cardiac- and respiratory-driven components of the CSF velocities at each tissue region are shown in Fig. 3a. Figure 3b presents the ratios of the cardiac- and respiratory-driven components to the total velocities. Examples of the ROIs are labeled with numbers in the T2-weighted image inset in Fig. 3a. Significant differences between the cardiac- and respiratory-driven CSF velocities were observed in the prepontine and aqueduct (P < 0.01). In addition, the cardiac-driven velocity ratios were significantly higher than the respiratory-driven velocity ratios (P < 0.01) for all locations.
Fig. 2.
Diagram illustrating the process of separating the cardiac- and respiratory-driven components from the total CSF velocity waveform. The total CSF velocity at a point in the CSF space is shown on the top left. The amplitude spectra of the total CSF velocity (black), the ECG signal (dark gray with a square symbol), and the respiratory pressure sensor signal (light gray with a triangle symbol) were calculated by Fourier transform with the DC components removed. Each spectrum was normalized to make the peak value equal one. The cardiac- and respiratory-driven velocities were separated after the center frequencies of the cardiac and respiratory bands were determined according to the peak frequencies of the ECG and the respiratory spectra. CSF, cerebrospinal fluid; DC, direct current; ECG, electrocardiogram.
Fig. 3.
Cardiac- and respiratory-driven CSF velocities are shown at (a) ROIs in the prepontine (#1), aqueduct (#2), fourth ventricle (#3), and lateral ventricle (#4) and indicated on the T2 image inset. Significant differences were observed in the prepontine (P < 0.01) and the aqueduct (P < 0.01). The ratios of the cardiac- and respiratory-driven CSF velocities are shown in (b). There were significant differences in all the ROIs (P < 0.01). CSF, cerebrospinal fluid.
Spatial correlations and delay times of the cardiac- and respiratory-driven components
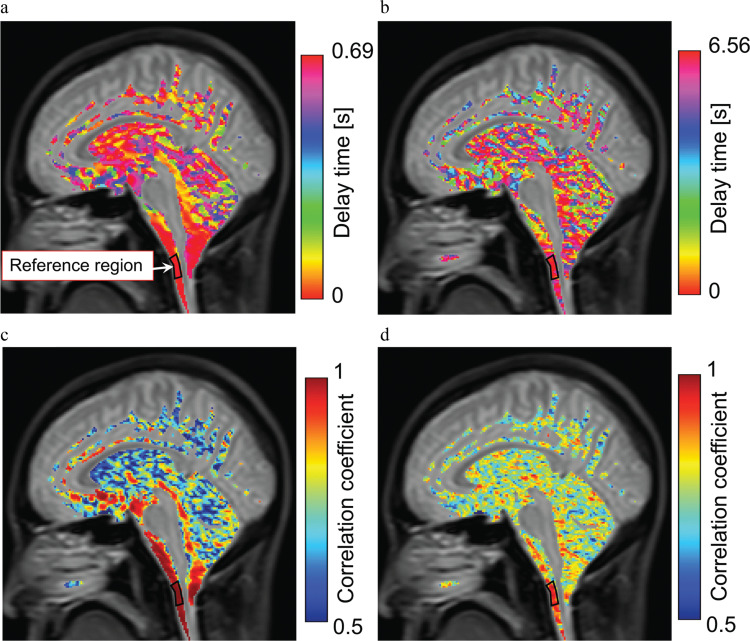
The healthy volunteers were instructed to engage in six-second respiratory cycles, and the correlation mapping technique was applied to demonstrate the differences in the cardiac- and respiratory-driven CSF velocity propagations in the CSF space, as shown in Fig. 4. The delay time distribution of the cardiac-driven motion, shown in Fig. 4a, indicated a gradual change from the reference point; the delay time distribution near the brainstem was relatively short. In contrast, the distribution during the respiratory-driven motion, shown in Fig. 4b, was relatively scattered in the CSF space. The maximum correlation map of the cardiac-driven CSF motion, shown in Fig. 4c, illustrates the markedly high correlation distribution, thus clearly indicating the propagation around the brainstem. The respiratory-driven motion results, shown in Fig. 4d, indicated a scattered and moderate correlation distribution. The correlation coefficient distribution around the cerebellum obviously included the cerebellum parenchyma, because the CSF space was not clearly segmented due to the partial volume effect in the T2 image.
Fig. 4.
Correlation and delay map obtained for the cardiac- and respiratory-driven CSF velocities in a healthy volunteer. The top images (a, b) are the delay time maps, and the bottom images (c, d) are the maximum correlation maps. The results of the cardiac-driven components are on the left side, while those of the respiratory-driven components are on the right. Differences in the propagation process can be observed between the cardiac and respiratory results. CSF, cerebrospinal fluid.
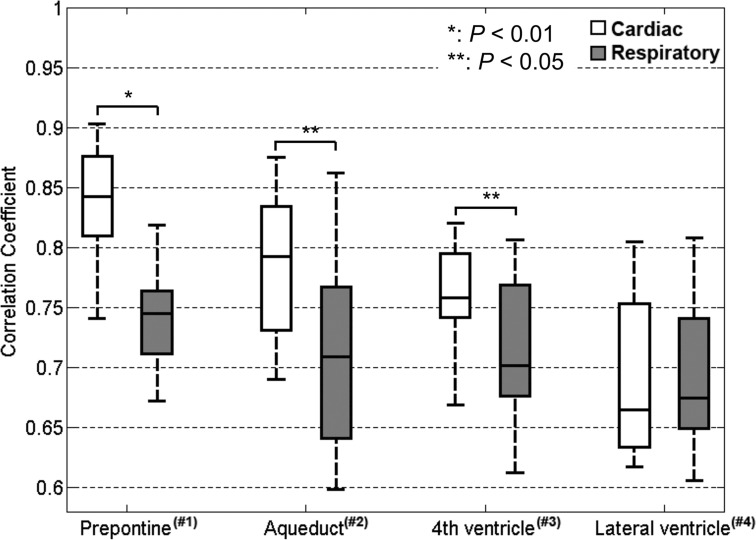
The maximum correlation in each location for all the volunteers is shown in Fig. 5. Significant differences in the maximum correlation between the cardiac- and respiratory-driven CSF motion were observed in the prepontine (P < 0.01), aqueduct, and fourth ventricle (P < 0.05). Because the delay time distribution of the respiratory-driven component within each ROI for all volunteers was remarkably scattered, the delays of those components were not compared.
Fig. 5.
Maximum correlations in the same ROIs as Fig. 3. There were significant differences between the results for the prepontine (P < 0.01), aqueduct (P < 0.05), and fourth ventricle (P < 0.05).
Cardiac- and respiratory-driven components of the CSF displacement
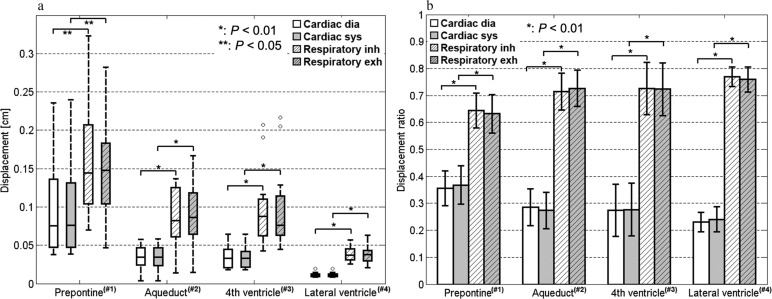
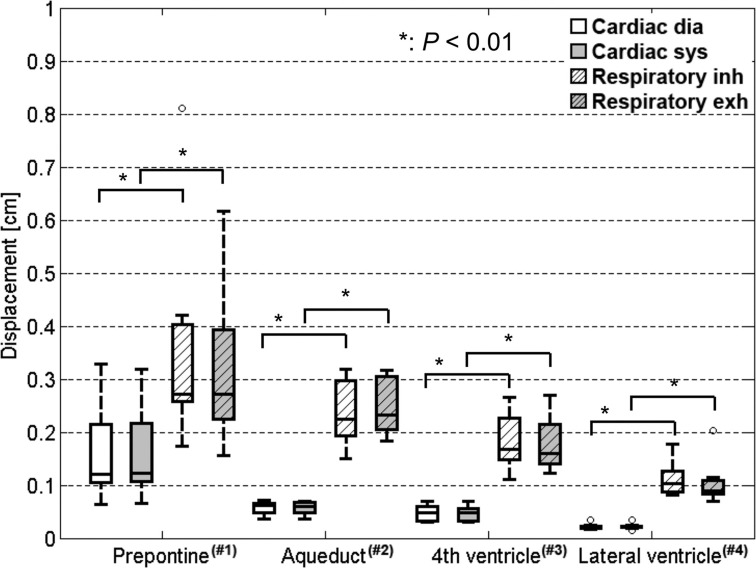
The cardiac- and respiratory-driven components of the CSF displacement during diastole or systole and inhalation or exhalation, respectively, are shown in Fig. 6a for every ROI. The cardiac- and respiratory-driven CSF displacements were significantly different in the prepontine (P < 0.05), aqueduct, fourth ventricle, and lateral ventricle (P < 0.01). The ratio between the diastole component of the cardiac-driven displacement and the inhalation component of the respiratory-driven displacement, which were in the cranial direction, and the ratio between the systole component of the cardiac-driven displacement and the exhalation component of the respiratory-driven displacement, which were in the caudal direction, are shown in Fig. 6b for each tissue location. The ratios of the CSF displacements in each physiological state were distinctly and significantly different (P < 0.01). Furthermore, regarding energy compensation, the cardiac- and respiratory-driven components of the CSF displacement were significantly different (P < 0.01), as shown in Fig. 7.
Fig. 6.
Cardiac- and respiratory-driven CSF displacements calculated in the ROIs shown in Fig. 3. The values are shown with dimensions in (a). The displacements during diastole and systole and during inhalation and exhalation were separated. The respiratory-driven CSF displacement was significantly greater than the cardiac-driven CSF displacement in all ROIs (P < 0.01 or P < 0.05). The cardiac- and respiratory-driven displacement ratios are shown in (b). The ratios were significantly different in all ROIs (P < 0.01). CSF, cerebrospinal fluid; dia, diastole; exh, exhalation; inh, inhalation; sys, systole.
Fig. 7.
Cardiac- and respiratory-driven CSF displacements, which are similar to Fig. 6 but calculated while compensating for the velocity energy leaking from the selected bandwidth. There were significant differences between the cardiac- and respiratory-driven CSF displacements in the cranial and caudal directions (P < 0.01). CSF, cerebrospinal fluid; dia, diastole; exh, exhalation; inh, inhalation; sys, systole.
Cardiac- and respiratory-driven components of the motion volume
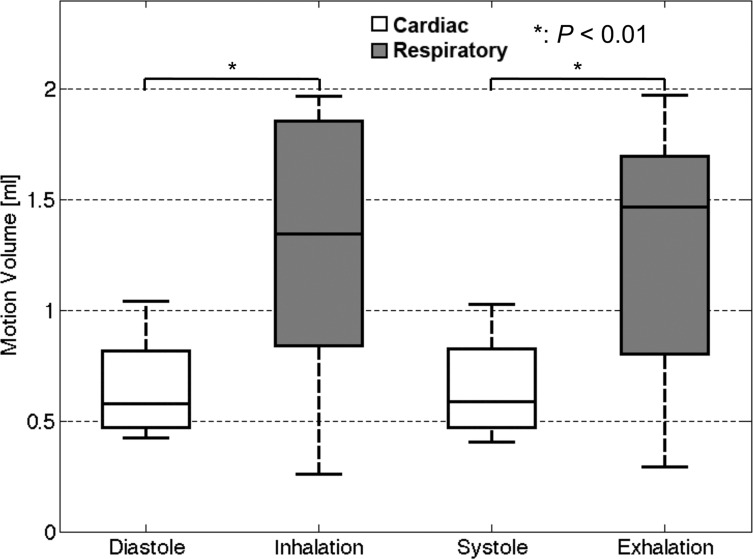
The cardiac- and respiratory-driven components of the CSF motion volumes are shown in Fig. 8. Significant differences were recognized between the cardiac- and respiratory-driven motion volumes in the same direction (P < 0.01). The results of the respiratory-driven motion volume were relatively dispersed due to the different respiratory volumes of each volunteer. The mean ± SD of the cardiac frequency of the healthy volunteers during the motion volumetry experiments was 1.26 ± 0.18 Hz (= 0.81 ± 0.12s) during image acquisition, while that of the respiratory frequency was 0.16 ± 0.01 Hz (= 6.42 ± 0.19s).
Fig. 8.
Averages of the cardiac-driven components of the CSF motion volume during diastole or systole within a cardiac cycle and the average respiration-driven components of the CSF motion volume during inhalation or exhalation within a respiration cycle. The values were obtained in the CSF space at the foramen magnum level, as shown in Fig. 1b. The respiratory-driven motion volumes were significantly larger than the cardiac-driven volumes (P < 0.01). CSF, cerebrospinal fluid.
Discussion
The delay time and maximum correlation distributions of the cardiac- and respiratory-driven propagation of CSF motion in the intracranial space were characterized using correlation mapping with frequency analysis, based on the asynchronous 2D-PC technique. The findings show that combining the asynchronous 2D-PC technique with frequency analysis could identify the real-time cardiac- and respiratory-driven components of CSF motion and, thus, determine the propagation properties of those motions. Pulse wave velocity measurements indicated that transmission of incompressible fluid through an elastic tube delays due to the compliance of the fluid space.22 Likewise, because CSF is also an incompressible fluid, the length of the delay time and decrease in correlation coefficient obtained by the present technique may reflect the compliance of the CSF space. Meanwhile, although many researchers have investigated cardiac-driven CSF motion,23–25 the dynamics of respiratory-driven motion are not yet understood.9,12,14,15,26,27 Therefore, the present findings might improve the understanding of cardiac- and respiratory-driven CSF motion in the intracranial space.
The amplitude of the cardiac-driven CSF velocity waveform was lower at the positive peak of the respiratory-driven velocity waveform, which was induced by inspiration. Because inspiration decreases cardiac stroke volume,15 the force responsible for the cardiac-driven CSF velocity varies during inspiratory periods. The peak-to-peak amplitudes of the cardiac-driven CSF velocity waveforms of the prepontine and the aqueduct were significantly higher than those of the respiratory-driven CSF velocity (P < 0.01). This indicates that a force, such as arterial pulsation, modulated the CSF motion, particularly near the prepontine. In every ROI, the cardiac-driven CSF velocity ratio was significantly higher than the respiratory-driven CSF velocity ratio (P < 0.01), indicating that the cardiac-driven velocity waveform might propagate farther in the space than the respiratory-driven velocity waveform. This finding indicates that the force that causes the cardiac-driven velocity is stronger than that of the respiratory-driven velocity because the compliance of the CSF space depends on the tissues around that space, such as the brain parenchyma.
The delay time maps of the cardiac- and respiratory-driven CSF motions reflected differences in their motion propagation properties. During the cardiac-driven motion, a shorter delay time was distributed near the reference region. In contrast, a longer delay appeared in the spaces farther from the reference region, such as in the aqueduct and the fourth ventricle. The delay time distribution of the respiratory-driven CSF motion did not demonstrate a clear trend. The differences between the cardiac- and respiratory-driven delay time maps indicated differences in the propagation properties and the driving forces; in particular, the driving force of the cardiac-driven CSF motion was greater than that of the respiratory-driven CSF motion. In addition, the maximum correlation maps of the two components exhibited different properties. The map of the cardiac-driven CSF motion had a higher correlation coefficient near the brainstem than did the map of the respiratory-driven CSF motion. These results also indicate that the propagation of the cardiac-driven motion in the intracranial space was more substantial than that of the respiratory-driven motion. Moreover, if the CSF space was not compliant, no delay time and no correlation coefficient variation should be observed. Therefore, the spatial variation of the delay time and the correlation coefficient reflect the distribution of the elasticity of the CSF space. The quantitative results of the correlation coefficient showed that the cardiac-driven CSF motion around the brainstem gradually decreased from the prepontine to the fourth ventricle. This implies that cardiac-driven CSF velocity propagates from the prepontine through the aqueduct to the fourth ventricle. In contrast, the correlation coefficients of the respiratory-driven component did not exhibit a clear spatial relationship. The time variation of the intrathoracic pressure induced by respiration was much less than that of the intracranial pressure induced by cardiac pulsation because the respiratory period (~6s) was notably longer than the cardiac period (~1s). Cardiac pulsation might cause a steep pressure gradient in the intracranial space, resulting in high CSF velocity, whereas respiration appeared to induce less of a gradient due to the slower oscillation cycle. The difference in the pressure gradients produced by the cardiac pulsation and respiration results in a difference in the CSF velocity distribution.
Meanwhile, the cardiac-driven CSF displacement during systole/diastole and respiratory-driven CSF displacement during inhalation/exhalation demonstrated a pattern opposite that of the velocity results. Specifically, the displacement of the respiratory-driven motion was significantly greater than that of the cardiac-driven motion. The difference between the cardiac- and respiratory-driven components of the displacement was minimal in the prepontine, which is the location of major arteries, such as the basilar artery. The differences were notably greater in other spaces because there were no such arteries. Furthermore, the displacements induced by respiration were significantly greater than those resulting from cardiac pulsation. Comparing the cardiac- and respiratory-driven components of the motion volume per cycle at the foramen magnum also indicated that the respiratory-driven motion was greater. This might imply that a respiratory-induced pressure change affects the entire intracranial space rather than a part of the space. These findings also correspond to the clinical experiences of neurosurgeons who have observed that the level of CSF in the manometer tube moves slowly and mostly with patient respiration but only vibrates with cardiac pulsation.28
The peak-to-peak amplitudes of the components of the CSF velocity waveforms demonstrated that the cardiac pulsation more greatly influenced the velocity than did respiration. In contrast, the displacement and motion volume of the CSF exhibited a greater respiratory-driven component. This difference implies that respiration, which involves a relatively slow but larger volumetric change, moves the CSF farther than does cardiac pulsation, which has a faster but smaller volumetric change. The present results correspond to results that have been obtained using the time-SLIP technique,9 in which the spin traveling distance can be visualized.
Recently, cardiac- and respiratory-driven CSF velocities were evaluated at the level of the foramen magnum based on a similar analytical technique,27 except that the volunteers were requested to practice deep respiration. Further, cardiac- and respiratory-gated PC imaging and real-time PC imaging have demonstrated that the CSF motion in the aqueduct and the spinal canal occurs in the cranial direction during inspiration and in the caudal direction during expiration.26,29 In contrast, the spatial motion of the intracranial CSF was investigated in the present study by requesting that the volunteers engage in natural but regular six-second respiratory cycles. Therefore, our results provide new findings regarding the properties of cardiac- and respiratory-driven CSF motions in the intracranial space in a natural state. However, the respiratory-driven CSF motion that would occur when the volunteers held their breath was not characterized because the data acquisition time would be approximately one minute. The respiratory-driven CSF velocity in the aqueduct during breath-holding has been characterized in another study.11
The cardiac- and respiratory-driven CSF motions in young, healthy volunteers were investigated in this study. Older adults might have cerebral arteriosclerosis, which is speculated to decrease brain compliance and can occur due to a lesion, such as a small brain infarction.30 A decrease in brain compliance due to aging or iNPH might shorten the delay time and cause a higher correlation of cardiac-driven CSF motion propagation.17 In general, highly accelerated fluids interact elastically. The compliance change caused by cerebral arteriosclerosis might influence the cardiac-driven CSF motion more greatly than the respiratory-driven motion because the acceleration of the cardiac-driven motion is greater.
The present study has a few limitations. The asynchronous 2D-PC with SSFP used in this study had a sampling frequency of 4.61 Hz; this was insufficient for the cardiac-driven motion, which had a frequency of 1.32 ± 0.20 Hz in the volunteers. The insufficient sampling frequency might cause aliasing for a part of the cardiac-driven velocity waveform, which would decrease the area of the cardiac-driven component in the frequency spectrum. Acquisition with echo-planar imaging (EPI) or an acceleration technique, such as compressed sensing, might be required. Another limitation is that the velocity component of the bulk flow was not considered. The bulk flow related to the transportation of cellular wastes,31 such as amyloid-beta, is too slow (~50 μm/min)32 to be detected using PC techniques.33 Therefore, further investigation is required using a technique such as q-space imaging, which can measure the slow flow as a probability displacement function of spins in a voxel.
Conclusion
The propagation properties of the cardiac- and respiratory-driven CSF motions in the intracranial CSF space were visualized and characterized by a correlation mapping method in conjunction with a real-time, asynchronous 2D-PC technique. The correlation mapping method might reflect the compliance of the CSF space or the brain parenchyma. The respiratory-driven component of the CSF motion displacement and motion volume was greater than the cardiac-driven CSF component, whereas the cardiac-driven CSF motion velocity and propagation were stronger. The present CSF component analysis technique should be applied to patients with CSF-related diseases, such as hydrocephalus, because the development of such diseases alters the mechanical properties of the CSF space, including the compliance of the brain parenchyma.30 The use of the asynchronous 2D-PC technique, in conjunction with the correlation mapping technique, would be expected to identify such alterations in the CSF space. This would provide crucial information about these diseases, particularly when the disease effects appear differently during cardiac- and respiratory-driven motions.
Appendix
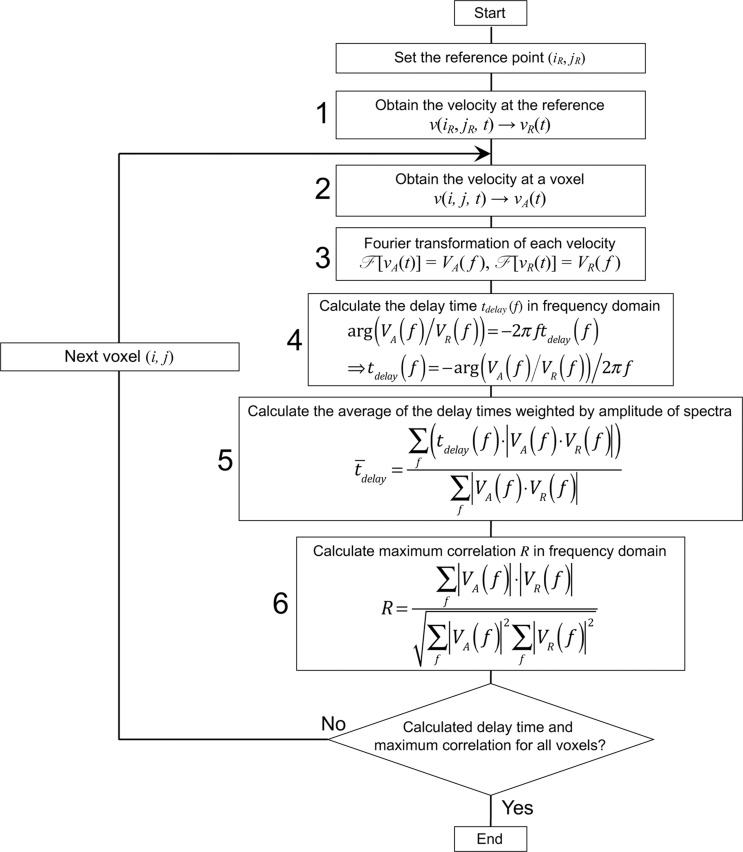
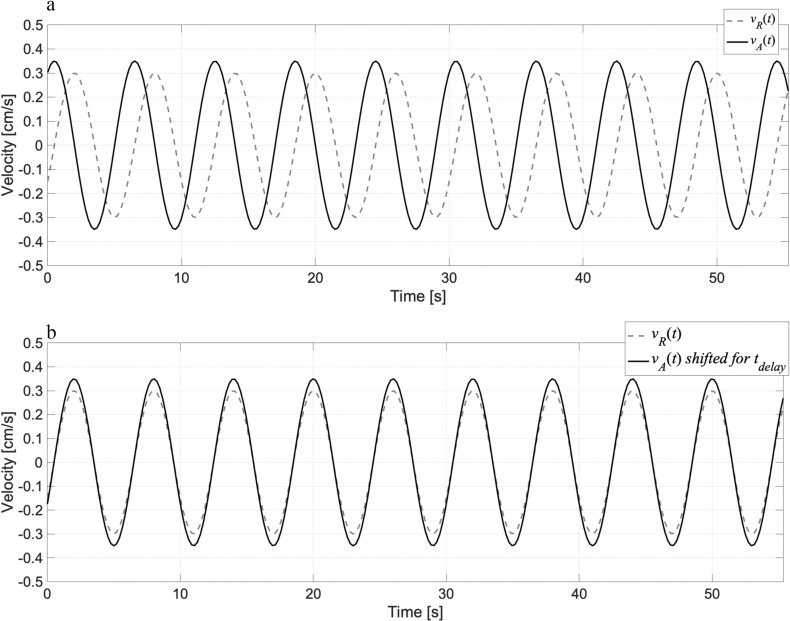
A flowchart of the correlation mapping technique is shown in Fig. A.1. The algorithm was modified from a previous report.17 The technique calculates the delay time and correlation of the CSF motion from the reference point/region to the other space. In step 1, the velocity waveform vR(t) in an ROI set at a reference location in the CSF space is obtained. In step 2, the velocity waveform vA(t) at an arbitrary voxel is obtained. After the Fourier transformation of the waveforms in step 3, the delay time tdelay of vA(t) relative to vR(t) was calculated as a phase shift in the frequency domain by taking the argument of the ratio between VA(f) and VR(f) in step 4. Figure A.2 shows the velocity waveforms vR(t), vA(t), and vA(t) shifted for a delay time tdelay. Because the delay times obtained at different frequencies vary, the weighted average of the delay timedelay is computed based on the product of VA(f) and VR(f) in step 5. In step 6, the correlation coefficient of the spectral amplitudes, |VA| and |VR|, is calculated. After performing steps 1 through 6 for all the voxels in the CSF space, the delay time and maximum correlation are mapped.
Fig. A.1.
Algorithm for calculating the delay time and the maximum correlation between the reference and arbitrary points in the CSF space. The calculation was performed in the frequency domain. The text in the appendix provides further details. CSF, cerebrospinal fluid.
Fig. A.2.
The waveform on (a) schematically shows the velocity waveforms vR(t) and vA(t), while those on (b) provide the velocity waveform vA(t), shifted for a delay time tdelay, thus providing the maximum correlation between vR(t) and vA(t).
Acknowledgments
This work was supported by a Grant-in-Aid from the Ministry of Education, Sciences, and Culture of Japan (#26462220). The authors thank Dr. Koichi Oshio at the Keio University School of Medicine for his valuable suggestions. The authors thank Prof. Yutaka Imai for his MRI assistance.
Conflicts of Interest
Kagayaki Kuroda, Mitsunori Matsumae, and Hideki Atsumi received a research grant from the Terumo Life Science Foundation. The other authors declare that they have no conflicts of interest.
Supplementary Information: Supplementary Movie 1-3 are available online.
Movie 1
Intracranial velocity distribution of a healthy male 25-year-old volunteer, as obtained by asynchronous 2D-PC with a temporal resolution of 217 ms. The velocity encoding direction was caudal–cranial.
Movie 2
Cardiac-driven velocity distribution of the same volunteer as in Movie 1.
Movie 3
Respiratory-driven velocity distribution of the same volunteer as in Movie 1.
References
- 1.Brinker T, Stopa E, Morrison J, et al. A new look at cerebrospinal fluid circulation. Fluids Barriers CNS 2014; 11:10. [DOI] [PMC free article] [PubMed] [Google Scholar]
- 2.Orešković D, Klarica M. A new look at cerebrospinal fluid movement. Fluids Barriers CNS 2014; 11:16. [DOI] [PMC free article] [PubMed] [Google Scholar]
- 3.Matsumae M, Sato O, Hirayama A, et al. Research into the physiology of cerebrospinal fluid reaches a new horizon: intimate exchange between cerebrospinal fluid and interstitial fluid may contribute to maintenance of homeostasis in the central nervous system. Neurol Med Chir (Tokyo) 2016; 56:416–441. [DOI] [PMC free article] [PubMed] [Google Scholar]
- 4.Hladky SB, Barrand MA. Mechanisms of fluid movement into, through and out of the brain: evaluation of the evidence. Fluids Barriers CNS 2014; 11:26. [DOI] [PMC free article] [PubMed] [Google Scholar]
- 5.Louveau A, Smirnov I, Keyes TJ, et al. Structural and functional features of central nervous system lymphatic vessels. Nature 2015; 523:337–341. [DOI] [PMC free article] [PubMed] [Google Scholar]
- 6.Iliff JJ, Wang M, Liao Y, et al. A paravascular pathway facilitates CSF flow through the brain parenchyma and the clearance of interstitial solutes, including amyloid β. Sci Transl Med 2012; 4:147ra111. [DOI] [PMC free article] [PubMed] [Google Scholar]
- 7.Matsumae M, Hirayama A, Atsumi H, et al. Velocity and pressure gradients of cerebrospinal fluid assessed with magnetic resonance imaging. J Neurosurg 2014; 120:218–227. [DOI] [PubMed] [Google Scholar]
- 8.Wada T, Tokunaga C, Togao O, et al. Visualization of cerebrospinal fluid dynamics using multi-spin echo acquisition cine imaging (MUSACI). Magn Reson Med 2019; 81:331–341. [DOI] [PubMed] [Google Scholar]
- 9.Yamada S, Miyazaki M, Yamashita Y, et al. Influence of respiration on cerebrospinal fluid movement using magnetic resonance spin labeling. Fluids Barriers CNS 2013; 10:36. [DOI] [PMC free article] [PubMed] [Google Scholar]
- 10.Horie T, Kajihara N, Matsumae M, et al. Magnetic resonance imaging technique for visualization of irregular cerebrospinal fluid motion in the ventricular system and subarachnoid space. World Neurosurg 2017; 97:523–531. [DOI] [PubMed] [Google Scholar]
- 11.Chen L, Beckett A, Verma A, et al. Dynamics of respiratory and cardiac CSF motion revealed with real-time simultaneous multi-slice EPI velocity phase contrast imaging. Neuroimage 2015; 122:281–287. [DOI] [PMC free article] [PubMed] [Google Scholar]
- 12.Beckett A, Chen L, Verma A, et al. Velocity phase imaging with simultaneous multi-slice EPI reveals respiration driven motion in spinal CSF. Proceedings of the 23rd Annual Meeting of ISMRM, Toronto, Canada, 2015; 4445. [Google Scholar]
- 13.Dreha-Kulaczewski S, Joseph AA, Merboldt KD, et al. Inspiration is the major regulator of human CSF flow. J Neurosci 2015; 35:2485–2491. [DOI] [PMC free article] [PubMed] [Google Scholar]
- 14.Friese S, Hamhaber U, Erb M, et al. The influence of pulse and respiration on spinal cerebrospinal fluid pulsation. Invest Radiol 2004; 39:120–130. [DOI] [PubMed] [Google Scholar]
- 15.Körperich H, Barth P, Gieseke J, et al. Impact of respiration on stroke volumes in paediatric controls and in patients after Fontan procedure assessed by MR real-time phase-velocity mapping. Eur Heart J Cardiovasc Imaging 2015; 16:198–209. [DOI] [PubMed] [Google Scholar]
- 16.Yatsushiro S, Sunohara S, Hayashi N, et al. Characterization of pulsatile cerebrospinal fluid motion among young, elderly and idiopathic normal pressure hydrocephalus by correlation mapping technique. Proceedings of the 24th Annual Meeting of ISMRM, Suntec, Singapore, 2016; 2586. [Google Scholar]
- 17.Yatsushiro S, Sunohara S, Hayashi N, et al. Cardiac-driven pulsatile motion of intracranial cerebrospinal fluid visualized based on a correlation mapping technique. Magn Reson Med Sci 2018; 17:151–160. [DOI] [PMC free article] [PubMed] [Google Scholar]
- 18.Yatsushiro S, Sunohara S, Takizawa K, et al. Characterization of cardiac- and respiratory-driven cerebrospinal fluid motions using correlation mapping with asynchronous 2-dimensional phase contrast technique. Proceedings of the 38th Annual Meeting of the IEEE Eng Med Biol Soc, Orlando, USA, 2016; 3867–3870. [DOI] [PubMed] [Google Scholar]
- 19.Yatsushiro S, Sunohara S, Matsumae M, et al. Propagation patterns of cardiac-driven and respiratory-driven cerebrospinal fluid velocity waves characterized by correlation mapping in conjunction with asynchronous 2-dimensional phase contrast technique. Proceedings of the 25th Annual Meeting of ISMRM, Honolulu, USA, 2017; 350. [Google Scholar]
- 20.Abdullah A, Hirayama A, Yatsushiro S, et al. Cerebrospinal fluid image segmentation using spatial fuzzy clustering method with improved evolutionary Expectation Maximization. Proceedings of the 35th Annual Meeting of IEEE Eng Med Biol Soc, Osaka, Japan, 2013; 3359–3362. [DOI] [PubMed] [Google Scholar]
- 21.Alperin N, Lee SH. PUBS: pulsatility-based segmentation of lumens conducting non-steady flow. Magnetic resonance in medicine. Magn Reson Med 2003; 49:934–944. [DOI] [PubMed] [Google Scholar]
- 22.Bramwell JC, Hill AV. The velocity of pulse wave in man. Proc Royal Soc B 1922; 93:298–306. [Google Scholar]
- 23.Hirayama A, Matsumae M, Yatsushiro S, et al. Visualization of pulsatile CSF motion around membrane-like structures with both 4D velocity mapping and Time-SLIP technique. Magn Reson Med Sci 2015; 14:263–273. [DOI] [PubMed] [Google Scholar]
- 24.Takizawa K, Matsumae M, Hayashi N, et al. Hyperdynamic CSF motion profiles found in idiopathic normal pressure hydrocephalus and Alzheimer’s disease assessed by fluid mechanics derived from magnetic resonance images. Fluids Barriers CNS 2017; 14:29. [DOI] [PMC free article] [PubMed] [Google Scholar]
- 25.Hayashi N, Matsumae M, Yatsushiro S, et al. Quantitative analysis of cerebrospinal fluid pressure gradients in healthy volunteers and patients with normal pressure hydrocephalus. Neurol Med Chir (Tokyo) 2015; 55:657–662. [DOI] [PMC free article] [PubMed] [Google Scholar]
- 26.Spijkerman JM, Geurts LJ, Siero JCW, et al. Phase contrast MRI measurements of net cerebrospinal fluid flow through the cerebral aqueduct are confounded by respiration. J Magn Reson Imaging 2019; 49:433–444. [DOI] [PMC free article] [PubMed] [Google Scholar]
- 27.Yildiz S, Thyagaraj S, Jin N, et al. Quantifying the influence of respiration and cardiac pulsations on cerebrospinal fluid dynamics using real-time phase-contrast MRI. J Magn Reson Imaging 2017; 46:431–439. [DOI] [PubMed] [Google Scholar]
- 28.Shah JL. Influence of cerebrospinal fluid on epidural pressure. Anaesthesia 1981; 36:627–631. [DOI] [PubMed] [Google Scholar]
- 29.Dreha-Kulaczewski S, Joseph AA, Merboldt KD, et al. Identification of the upward movement of human CSF In Vivo and its relation to the brain venous system. J Neurosci 2017; 37:2395–2402. [DOI] [PMC free article] [PubMed] [Google Scholar]
- 30.Bech RA, Waldemar G, Gjerris F, et al. Shunting effects in patients with idiopathic normal pressure hydrocephalus; correlation with cerebral and leptomeningeal biopsy findings. Acta Neurochir (Wien) 1999; 141:633–639. [DOI] [PubMed] [Google Scholar]
- 31.Taoka T, Naganawa S. Glymphatic imaging using MRI. J Magn Reson Imaging 2020; 51:11–24. [DOI] [PubMed] [Google Scholar]
- 32.Ray L, Iliff JJ, Heys JJ. Analysis of convective and diffusive transport in the brain interstitium. Fluids Barriers CNS 2019; 16:6. [DOI] [PMC free article] [PubMed] [Google Scholar]
- 33.Nagata A, Kose K, Terada Y. Development of an outdoor MRI system for measuring flow in a living tree. J Magn Reson 2016; 265:129–138. [DOI] [PubMed] [Google Scholar]


