

Abstract
Background
Myostatin (MSTN) is a transforming growth factor-ß superfamily member that acts as a major regulator of skeletal muscle mass. GDF-11, which is highly related to MSTN, plays multiple roles during embryonic development, including regulating development of the axial skeleton, kidneys, nervous system, and pancreas. As MSTN and GDF-11 share a high degree of amino acid sequence identity, behave virtually identically in cell culture assays, and utilize similar regulatory and signaling components, a critical question is whether their distinct biological functions result from inherent differences in their abilities to interact with specific regulatory and signaling components or whether their distinct biological functions mainly reflect their differing temporal and spatial patterns of expression.
Methods
We generated and characterized mice in which we precisely replaced in the germline the portion of the Mstn gene encoding the mature C-terminal peptide with the corresponding region of Gdf11.
Results
In mice homozygous for the knock-in allele, all of the circulating MSTN protein was replaced with GDF-11, resulting in ~ 30–40-fold increased levels of circulating GDF-11. Male mice homozygous for the knock-in allele had slightly decreased muscle weights, slightly increased weight gain in response to a high-fat diet, slightly increased plasma cholesterol and HDL levels, and significantly decreased bone density and bone mass, whereas female mice were mostly unaffected.
Conclusions
GDF-11 appears to be capable of nearly completely functionally replacing MSTN in the control of muscle mass. The developmental and physiological consequences of replacing MSTN with GDF-11 are strikingly limited.
Keywords: Myostatin, GDF-11, Gene knock-in, Body composition, Muscle, Fat, Bone, Metabolism
Background
Myostatin (MSTN) is a transforming growth factor-ß (TGF-ß) superfamily member that normally acts to limit skeletal muscle mass [1]. Mice lacking MSTN exhibit dramatic increases in muscle mass throughout the body, with individual muscles growing to about twice the normal size. MSTN has been highly conserved through evolution [2], and naturally occurring and engineered mutations in the MSTN gene also have been shown to result in increased muscle mass and/or function in numerous other mammalian [2–16], piscine [17–19], and avian [20, 21] species. Loss of MSTN leads to both an increase in the number of muscle fibers that are formed during development and an increase in the sizes of individual fibers [1]. Postnatally, MSTN is made by myofibers [1], circulates in the blood [22], and signals back to myofibers to limit growth [23, 24]. Based on this postnatal function of MSTN, numerous pharmaceutical and biotechnology companies have developed MSTN inhibitors that have been tested in clinical trials in patients with muscle and metabolic diseases (for review, see ref. [25]).
GDF-11, which was originally identified using Mstn as a probe [1], is a highly related TGF-ß family member that is about 90% identical to MSTN in the mature portion of the protein [26, 27]. Gene targeting studies in mice showed that the function of GDF-11 is distinct from that of MSTN. During embryogenesis, GDF-11 has been shown to regulate anterior-posterior patterning of the axial skeleton [28] as well as the development of the kidney [29], pancreas [30, 31], and nervous system [32–34]. Although the phenotypes of Mstn−/− and Gdf11−/− mice appear to be mostly non-overlapping, the two genes have been shown to be at least partially functionally redundant with respect to anterior-posterior axial patterning [35]. Much less is known about adult functions of GDF-11, as Gdf11−/− mice die within the first 24 h after birth.
MSTN and GDF-11 are nearly indistinguishable in cell culture assays and also share many regulatory and signaling mechanisms and components. MSTN is synthesized in precursor form, and following proteolytic processing, the C-terminal dimer, which is the actual signaling molecule, remains non-covalently bound to the propeptide in an inactive, latent state [36, 37]. The MSTN latent complex can be activated by proteolytic cleavage of the propeptide by members of the BMP-1/tolloid family of metalloproteases [38], which appears to be the dominant mechanism operating in vivo [39]. Similarly, the C-terminal dimer and propeptide of GDF-11 also form a latent complex that can be activated by BMP-1/tolloid proteases [40]. MSTN is regulated extracellularly by other binding proteins as well, including follistatin (FST) [36], FSTL-3 [41], GASP-1, and GASP-2 [42]. Genetic studies have shown that loss of FST [43–45] and/or GASP-1/GASP-2 [46] results in decreases in muscle mass and fiber type shifts consistent with their roles in inhibiting MSTN in vivo. These binding proteins are also capable of inhibiting GDF-11, and mice lacking FST [43] or GASP-1/GASP-2 [46] also exhibit axial patterning defects consistent with increased activity of GDF-11. Finally, when free of inhibitory binding proteins, MSTN is capable of binding the type 2 receptors, ACVR2 and ACVR2B [36], and the type 1 receptors, ALK4 and ALK5 [47]. Targeting these receptors in mice leads to increased muscle mass, consistent with the key roles that these receptors play in mediating MSTN signaling in vivo [24, 48]. GDF-11 is capable of binding to these same receptors, and Acvr2 and Acvr2b mutant mice exhibit axial patterning and kidney defects [49–53] similar to those seen in Gdf11 mutants.
Given that MSTN and GDF-11 share a high degree of amino acid sequence identity, behave virtually identically in cell culture assays, and utilize similar regulatory and signaling components, a critical question is whether their distinct biological functions result from inherent differences in their abilities to interact with specific regulatory and signaling components or whether their distinct biological functions mainly reflect their differing temporal and spatial patterns of expression. Given that both MSTN and GDF-11 circulate in the blood, another critical question is whether these ligands act locally or systemically in signaling to target cells. Genetic studies have suggested that MSTN has both autocrine/paracrine and endocrine modes of action [54], although very little is known about the functions of GDF-11 and its mode of action in adult animals. Although overexpression of either MSTN [22] or GDF-11 [55, 56] has been shown to induce a cachexia-like syndrome in adult mice, at least one study has reported distinct effects of giving MSTN and GDF-11 protein exogenously to mice, suggesting that these two molecules may have inherent differences in their biological properties [57]. Here, we addressed the functional equivalence of these two molecules by replacing the portion of the Mstn gene encoding its mature domain with the corresponding portion of Gdf11 in the germline of mice.
Methods
All animal experiments were carried out in accordance with protocols that were approved by the Institutional Animal Care and Use Committees at the University of Connecticut School of Medicine and Johns Hopkins University School of Medicine. To generate mice carrying a MstnGdf11 knock-in allele, the targeting construct was electroporated into embryonic stem (ES) cells, and ES cell colonies carrying the homologously targeted allele were injected into blastocysts. Chimeric mice generated from these blastocysts were bred to identify those exhibiting germline transmission of the targeted allele. Offspring from these matings were then bred with EIIa-Cre transgenic mice [58] in order to delete the neomycin resistance cassette in the germline. From these crosses, we obtained mice carrying the MstnGdf11 knock-in allele lacking the neo-cassette.
Circulating MSTN and GDF-11 levels were determined using a liquid chromatography-tandem mass spectrometry assay, as described [59]. There was no detectable cross-reactivity of MSTN in the GDF-11 assay or of GDF-11 in the MSTN assay; the addition of up to 100 ng/mL of GDF-11 did not significantly affect GDF-8 measurement, and addition of up to 100 ng/mL GDF-8 did not affect GDF-11 measurement. The lower limit of quantitation was 0.5 ng/mL for GDF-8 as well as for GDF-11. The linear range of the assay was from 0 to 100 ng/mL for both. The inter-assay coefficients of variation in the MSTN assay were 15.1%, 11.3%, and 7.4% in the low- (8.7 ng/mL), medium- (51.1 ng/mL), and high- (97.6 ng/mL) quality control pools, respectively, and the corresponding CVs in the GDF-11 assay were 8.7%, 12.8%, and 17.1% in the low- (3.4 ng/mL), medium- (52.0 ng/ml), and high- (104.7 ng/ml) quality control pools, respectively [59].
For measurement of muscle weights, individual muscles were dissected from both sides of 10-week-old mice, and the average weight was used for each muscle. Serial sections (15 μm) were cut transversely through the widest point of the gastrocnemius muscle using a cryostat. Fiber type analysis was carried out using antibodies (BA-D5, SC-71, and BF-F3 for myosin heavy chains type I, IIa, and IIb, respectively) developed by Schiaffino et al. [60] and obtained from the Developmental Studies Hybridoma Bank developed under the auspices of the National Institute of Child Health and Human Development and maintained by the University of Iowa. Live animal imaging was performed using a Piximus dual-energy X-ray absorptiometer (DXA). Glucose tolerance tests (GTT) were performed by administering an intraperitoneal injection of 1 g glucose/kg body weight following a 6-h fast. Mice were then placed on a 60-kcal % fat diet (D12492, Research Diets, Inc.), and a repeat GTT was performed after 4 weeks; mice were then maintained on the high-fat diet for an additional 4 weeks. For analysis of skeletal patterning, newborn mice were euthanized, skinned, eviscerated, fixed in 80% ethanol, and dehydrated in 95% ethanol for 1 day and acetone for 3 days. Skeletons were stained in 10% acetic acid in ethanol containing 0.003% Alizarin red and 0.0045% Alcian blue for 36 h. After staining, skeletons were cleared in 1% potassium hydroxide and transferred to 20%, 50%, 80%, and 100% glycerol over several days. For microCT analysis, the left femur, left humerus, and lumbar vertebrae were placed in 70% ethanol. μCT was performed in a Scanco μCT40 at 8 μm3 resolution. Samples were scanned in 70% ethanol 55 kVp, 145 μA intensity, and 300 ms. The instrument is calibrated weekly using Scanco phantoms, and all scans passed routine quality control verification. Analysis of bones was conducted using standard protocols, with a lower threshold of 2485 HU for femoral trabeculae, 4932 HU for femoral cortex, and 3078 HU for vertebral trabeculae [61]. Surface renderings were generated corresponding to each of these thresholds. For all data, statistical significance was assessed using Student’s t test.
Results, discussion, and conclusions
As one approach to determine whether there are fundamental inherent differences between MSTN and GDF-11 that can lead to distinct biological activities in vivo, we analyzed the effect of replacing MSTN with GDF-11 in the germline. As shown in Fig. 1, the Mstn gene contains three exons, with the mature C-terminal domain being encoded within exon 3. We generated a targeting construct in which we precisely replaced the coding sequence for the MSTN C-terminal domain, starting at the furin proteolytic processing site, with that encoding the GDF-11 C-terminal domain. Hence, this knock-in allele (MstnGdf11) encodes a hybrid precursor protein consisting of the MSTN propeptide and the GDF-11 C-terminal domain, and following proteolytic processing, the mature GDF-11 signaling molecule would be produced wherever MSTN would normally be produced. A previous study showed that the MSTN propeptide is capable of binding and inhibiting the GDF-11 C-terminal dimer [37], so our expectation was that the MSTN propeptide from this hybrid protein would be capable of maintaining the mature GDF-11 C-terminal dimer in a latent state, as is the case for mature MSTN [36]. Following homologous recombination in embryonic stem cells, injection of the targeted cells into blastocysts, and transfer of the blastocysts to pseudopregnant females, we obtained chimeric mice that transferred the knock-in allele (MstnGdf11) through the germline. After removing the neo-cassette using a germline expressed cre transgene [58], we backcrossed the knock-in allele 5 generations onto a C57BL/6 genetic background prior to analysis.
Fig. 1.

Schematic of the Mstn locus with the locations of the coding segments shown as blue boxes and the sequence of the coding portion of exon 3 shown below. The segment encoding the mature C-terminal domain following the furin processing site is shown in red. In the targeting construct, this segment was replaced precisely with the corresponding segment taken from Gdf11. The neo-cassette, introduced into intron 2 for selection of ES cells, was removed using a germline-expressed cre recombinase, leaving behind a single LoxP site in intron 2. All studies were carried out after crossing the neo-deleted allele (MstnGdf11) onto a C57BL/6 genetic background. X, XbaI; H, HindIII; E, EcoRI
MstnGdf11/Gdf11 mice were viable, and we carried out all analysis on 10-week-old Mstn+/+, Mstn+/Gdf11, and MstnGdf11/Gdf11 mice that we generated from inter-crosses of Mstn+/Gdf11 mice. We first measured MSTN and GDF-11 protein levels in the plasma of these mice using a liquid chromatography-tandem mass spectrometry assay highly specific for each protein [59]. As shown in Fig. 2, wild-type mice had circulating MSTN and GDF-11 levels in the range of ~ 150 ng/ml and ~ 4 ng/ml, respectively. Mice carrying the MstnGdf11 allele showed circulating levels of MSTN and GDF-11 consistent with a complete replacement of MSTN with GDF-11. In particular, MstnGdf11/Gdf11 mice had no detectable circulating MSTN and had levels of circulating GDF-11 comparable to the normal levels of MSTN, which is ~ 30–40-fold higher than the normal circulating levels of GDF-11. Mstn+/Gdf11 mice had intermediate levels of both proteins.
Fig. 2.
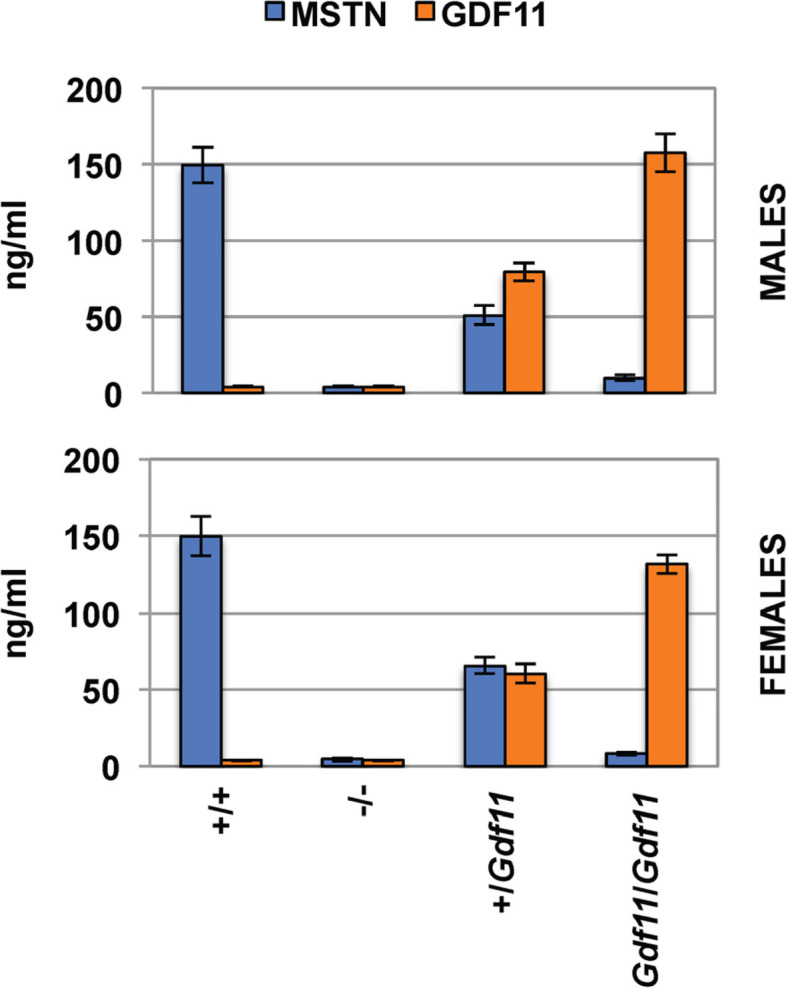
MSTN and GDF-11 plasma levels. Numbers of male (M) and female (F) mice were n = 6M, 6F for Mstn+/+, n = 6M, 6F for Mstn−/−, n = 6M, 4F for Mstn+/Gdf11, and n = 5M, 5F for MstnGdf11/Gdf11. p < 0.001 for all comparisons of MSTN or GDF-11 levels between groups, except for MSTN values between Mstn−/− and MstnGdf11/Gdf11 mice and GDF-11 values between Mstn+/+ and Mstn−/− mice, which were not significant
To determine whether GDF-11 can functionally replace MSTN, we first examined body composition. In 10-week-old mice, total body weights and lean body mass (by DXA analysis) showed a small (~ 6–8%) but statistically significant decrease in MstnGdf11/Gdf11 compared to Mstn+/+ mice in males but not in females (Table 1). Consistent with these decreases in lean body mass, the MstnGdf11 allele had a dose-dependent effect on muscle mass in males, with individual muscles of MstnGdf11/Gdf11 mice weighing approximately 10% less than those of Mstn+/+ mice and Mstn+/Gdf11 mice exhibiting an intermediate effect (Table 2); differences in muscle weights between MstnGdf11/Gdf11 and Mstn+/+ female mice were not statistically significant. The fact that muscle weights were not increased in MstnGdf11/Gdf11 mice implies that GDF-11 can functionally substitute for MSTN in negatively regulating muscle mass. Moreover, the fact that weights are slightly decreased suggests that GDF-11 produced from this knock-in allele may even be slightly more active than endogenous MSTN. We also carried out fiber type analysis, as loss of Mstn has been shown to lead to shifts toward more glycolytic 2B fibers [62]. As shown in Fig. 3A and Table 3, we found no differences in the distribution of fiber types between MstnGdf11/Gdf11 and Mstn+/+ mice.
Table 1.
DXA and fasting blood/plasma analysis
| Male +/+ |
Male Gdf11/Gdf11 |
Female +/+ |
Female Gdf11/Gdf11 |
|
|---|---|---|---|---|
| Body weight (g) | 25.2 ± 0.5 (23) | 23.7 ± 0.3b (30) | 20.0 ± 0.3 (19) | 19.5 ± 0.3 (26) |
| DXA | ||||
| Lean mass (g) | 19.6 ± 0.6 (12) | 18.0 ± 0.4a (11) | 15.7 ± 0.3 (8) | 15.0 ± 0.3 (12) |
| Fat mass (g) | 2.9 ± 0.2 (12) | 3.0 ± 0.1 (11) | 2.3 ± 0.1 (8) | 2.3 ± 0.1 (12) |
| BMD (g/cm2) | ||||
| Whole body | 0.0465 ± 0.0008 (12) | 0.0443 ± 0.0005a (11) | 0.0447 ± 0.0003 (8) | 0.0440 ± 0.0004 (12) |
| Right humerus | 0.0405 ± 0.0008 (12) | 0.0388 ± 0.0004 (11) | 0.0395 ± 0.0006 (8) | 0.0390 ± 0.0006 (12) |
| Left humerus | 0.0444 ± 0.0011 (12) | 0.0409 ± 0.0007b (11) | 0.0414 ± 0.0009 (8) | 0.0419 ± 0.0007 (12) |
| Right femur | 0.0693 ± 0.0025 (12) | 0.0629 ± 0.0011a (11) | 0.0615 ± 0.0008 (8) | 0.0608 ± 0.0006 (12) |
| Left femur | 0.0756 ± 0.0026 (12) | 0.0678 ± 0.0016a (11) | 0.0635 ± 0.0013 (8) | 0.0627 ± 0.0006 (12) |
| L2 + L3 vertebrae | 0.0537 ± 0.0011 (12) | 0.0504 ± 0.0012a (11) | 0.0534 ± 0.0012 (8) | 0.0534 ± 0.0011 (12) |
| L4 + L5 vertebrae | 0.0580 ± 0.0010 (12) | 0.0547 ± 0.0015 (11) | 0.0602 ± 0.0023 (8) | 0.0588 ± 0.0013 (12) |
| Glucose (mg/dL) | ||||
| Standard diet | 160.9 ± 5.8 (18) | 161.2 ± 3.3 (22) | 127.8 ± 4.2 (13) | 139.6 ± 4.1a (17) |
| High-fat diet | 207.6 ± 8.1 (10) | 209.1 ± 6.1 (9) | 148.3 ± 11.0 (7) | 161.3 ± 10.9 (7) |
| Insulin (ng/ml) | ||||
| Standard diet | 0.97 ± 0.17 (10) | 0.93 ± 0.09 (14) | 0.46 ± 0.18 (7) | 0.25 ± 0.07 (10) |
| High-fat diet | 3.33 ± 0.50 (10) | 4.38 ± 0.63 (14) | 0.61 ± 0.17 (7) | 0.98 ± 0.35 (10) |
| Leptin (ng/ml) | ||||
| Standard diet | 2.76 ± 0.66 (10) | 4.04 ± 0.50 (14) | 2.30 ± 0.49 (7) | 2.60 ± 0.32 (10) |
| High-fat diet | 52.82 ± 7.76 (10) | 58.26 ± 9.47 (14) | 20.93 ± 8.55 (7) | 26.91 ± 8.58 (10) |
| Cholesterol (mg/dL) | ||||
| Standard diet | 141.1 ± 3.5 (10) | 168.6 ± 3.3c (14) | 117.7 ± 7.5 (7) | 118.6 ± 5.3 (10) |
| High-fat diet | 192.1 ± 11.5 (10) | 237.4 ± 13.9a (14) | 139.3 ± 10.3 (7) | 154.4 ± 9.6 (10) |
| HDL (mg/dL) | ||||
| Standard diet | 98.9 ± 2.2 (10) | 116.6 ± 1.4c (14) | 79.0 ± 4.5 (7) | 78.8 ± 3.1 (10) |
| High-fat diet | 131.7 ± 6.2 (10) | 151.5 ± 5.5a (14) | 100.1 ± 6.4 (7) | 109.1 ± 6.1 (10) |
| LDL (mg/dL) | ||||
| Standard diet | 1.94 ± 0.46 (10) | 2.03 ± 0.20 (14) | 6.83 ± 0.74 (7) | 7.08 ± 0.46 (10) |
| High-fat diet | 2.90 ± 0.67 (10) | 5.16 ± 0.82 (14) | 5.32 ± 0.34 (7) | 6.46 ± 0.62 (10) |
| Trigylcerides (mg/dL) | ||||
| Standard diet | 76.6 ± 3.5 (10) | 69.2 ± 1.8 (14) | 69.4 ± 3.7 (7) | 60.9 ± 3.8 (10) |
| High-fat diet | 93.9 ± 3.0 (10) | 87.6 ± 1.9 (14) | 71.4 ± 5.3 (7) | 71.3 ± 6.4 (10) |
| Free fatty acids (mEq/L) | ||||
| Standard diet | 0.69 ± 0.06 (10) | 0.61 ± 0.03 (14) | 0.61 ± 0.06 (7) | 0.71 ± 0.17 (10) |
| High fat diet | 0.63 ± 0.02 (10) | 0.57 ± 0.02 (14) | 0.56 ± 0.05 (7) | 0.55 ± 0.07 (10) |
Numbers of mice analyzed are shown in parentheses
ap < 0.05 vs. +/+
bp < 0.01 vs. +/+
cp < 0.001 vs. +/+
Table 2.
Muscle weights (mg)
| Pectoralis | Triceps | Quadriceps | Gastrocnemius | |
|---|---|---|---|---|
| Males | ||||
| +/+ (n = 11) | 78.3 ± 2.1 | 108.3 ± 3.5 | 198.5 ± 5.9 | 138.4 ± 3.0 |
| +/Gdf11 (n = 28) | 70.5 ± 1.1b | 99.8 ± 1.7a | 185.5 ± 3.0 | 130.9 ± 1.8a |
| Gdf11/Gdf11 (n = 19) | 65.4 ± 1.7c | 97.6 ± 2.1a | 173.7 ± 3.3b | 121.5 ± 1.7c |
| Females | ||||
| +/+ (n = 11) | 52.9 ± 1.1 | 77.9 ± 1.0 | 148.8 ± 2.2 | 102.5 ± 1.4 |
| +/Gdf11 (n = 19) | 51.8 ± 1.1 | 77.7 ± 1.5 | 146.8 ± 2.1 | 102.9 ± 1.8 |
| Gdf11/Gdf11 (n = 14) | 49.5 ± 1.5 | 75.1 ± 1.2 | 141.6 ± 3.5 | 98.3 ± 2.3 |
ap < 0.05 vs. +/+
bp < 0.01 vs. +/+
cp < 0.001 vs. +/+
Fig. 3.

A Representative sections of gastrocnemius muscles stained with H&E (upper panels) or analyzed by immunofluorescence for different fiber types (middle and lower panels). Please note that the three images for a given genotype were not taken from adjacent sections. B Weight gain on high-fat diets for Mstn+/+ (n = 6M, 6F, black lines) and MstnGdf11/Gdf11 (n = 5M, 5F, red lines) mice. *p < 0.05. C Glucose tolerance tests on Mstn+/+ (black lines) and MstnGdf11/Gdf11 (red lines) mice. Numbers of mice were n = 9M, 6F for Mstn+/+, and n = 9M, 7F for MstnGdf11/Gdf11 for mice on standard diets, and n = 10M, 7F for Mstn+/+ and n = 9M, 7F for MstnGdf11/Gdf11 for mice on high-fat diets. None of the differences at any time point were statistically significant
Table 3.
Fiber type numbers in gastrocnemius muscles
| +/+ (n = 3) | Gdf11/Gdf11 (n = 3) | |
|---|---|---|
| Total fibers | 8295 ± 357 | 8136 ± 103 |
| Type I fibers | 130 ± 12 | 126 ± 7 |
| Type IIa fibers | 1446 ± 57 | 1540 ± 173 |
| Type IIb fibers | 6398 ± 431 | 6473 ± 405 |
None of the differences between +/+ and Gdf11/Gdf11 mice are statistically significant
In addition to regulating muscle mass, MSTN also regulates body composition in terms of fat mass, with Mstn−/− mice [63] as well as mice in which MSTN receptors (ACVR2 and ACVR2B) have been targeted in myofibers [24] having reductions in total body fat. By DXA analysis, we observed no differences in total body fat content in MstnGdf11/Gdf11 compared to Mstn+/+ mice (Table 1). In addition, we found no significant differences in plasma leptin levels in the knock-in mice compared to wild type mice. Mstn−/− mice have also been shown to exhibit less weight gain when placed on high-fat diets [64], which has also been seen in mice in which Acvr2 and Acvr2b have been targeted in myofibers [24]. As shown in Fig. 3B, male MstnGdf11/Gdf11 mice actually gained slightly more weight than Mstn+/+ mice when placed on high-fat diets, although leptin levels were similar between MstnGdf11/Gdf11 and Mstn+/+ mice even after 8 weeks on the high-fat diet (Table 1); no significant differences in weight gains or leptin levels were seen in female mice placed on high-fat diets. We also observed small, but significant increases in plasma cholesterol and HDL levels in male MstnGdf11/Gdf11 mice maintained on standard diets compared to Mstn+/+ mice (increased by 19% and 18%, respectively) as well as following 8 weeks on a high-fat diet (increased by 24% and 15%, respectively) (Table 1). No differences were seen in LDL, triglyceride, or free fatty acid levels in male MstnGdf11/Gdf11 mice or in any of the lipid levels in female MstnGdf11/Gdf11 mice. Hence, although some small differences in both skeletal muscle mass and high-fat weight gain were seen in male mutant mice, replacement of the MSTN mature domain with that of GDF-11 had only a minor effect on overall body composition.
The MSTN-GDF-11 regulatory system is also known to have effects on glucose metabolism. In particular, Mstn−/− mice are able to maintain normal or lower blood glucose levels despite having lower insulin levels [24, 63]. In addition, GDF-11 is known to play an important role in pancreatic development [30, 31], and administration of GDF-11, but not MSTN, protein to mice has been shown to improve glucose tolerance [57]. As shown in Table 1, fasting blood glucose levels were slightly higher in MstnGdf11/Gdf11 females compared to Mstn+/+ controls maintained on standard diets, but no statistically significant differences were seen in male mice on standard diets or in either males or females maintained on high-fat diets for 8 weeks. Moreover, MstnGdf11/Gdf11 and Mstn+/+ mice exhibited similar responses to a glucose challenge in glucose tolerance tests, both in mice maintained on standard diets and in mice maintained on high-fat diets for 4 weeks (Fig. 3C). Hence, complete replacement of MSTN with GDF-11 appeared to have very little effect on glucose metabolism.
In addition to analyzing whether GDF-11 can functionally replace MSTN, we also examined whether increased expression of GDF-11 in these mice affects other biological processes known to be regulated by GDF-11. In particular, we examined whether axial skeleton patterning was affected in MstnGdf11/Gdf11 mice. Previous studies have shown that loss of GDF-11 leads to anteriorly directed homeotic transformations of the axial skeleton [28] and that loss of GDF-11 inhibitors, specifically FST and/or GASP-1/GASP-2, leads to posteriorly directed transformations [43, 46]. Analysis of Alizarin red- and Alcian blue-stained skeletons prepared from 25 wild-type and 30 MstnGdf11/Gdf11 newborn mice revealed the normal pattern of 7 cervical, 13 thoracic, and 6 lumbar vertebrae in all 55 mice. Moreover, in the cervical region, anterior tuberculi were present on C6 in all mice, and in the thoracic region, the first seven ribs were attached to the sternum in all mice, with the last six ribs remaining floating. Hence, axial skeletal patterning appeared to be normal in MstnGdf11/Gdf11 newborn mice and did not exhibit the posteriorly directed homeotic transformations that might be predicted to result from excess GDF-11 activity.
Finally, we examined bones of MstnGdf11/Gdf11 mice. Mstn−/− mice have been reported to have increased bone density [65], possibly as a secondary effect of increased muscling. The role of GDF-11 in regulating bone homeostasis has been controversial, with one study reporting a decrease in bone density upon exogenous administration of GDF-11 to adult mice [66] and another study reporting decreased bone mass not only in newborn Gdf11 null mice but also in young adult mice in which tamoxifen-inducible cre-mediated recombination was used to target a Gdf11flox allele [67]. Whatever specific role GDF-11 may play in bone, targeting the MSTN/GDF-11/activin A signaling pathway, either pharmacologically using decoy forms of ACVR2 [68] or ACVR2B [69–73] or genetically by targeting Acvr2/Acvr2b [74] or Alk4/Alk5 [45] in osteoblasts, has been shown to cause significant increases in bone mass and density. To assess possible effects of the knock-in allele on bone, we first assessed bone density by DXA. As shown in Table 1, we observed a small (~ 5%) but significant decrease in whole body bone density in MstnGdf11/Gdf11 male mice compared to Mstn+/+ control mice. Comparable differences were present in multiple regions of the body, including upper and lower limb long bones as well as lumbar vertebrae, but no differences were seen in female mice. To analyze bone structure in greater detail, we carried out micro-CT analysis of humeri, femurs, and lumbar vertebrae. As shown in Table 4 and Fig. 4, numerous micro-CT parameters, including bone surface, BV/TV, connectivity density, trabecular number, trabecular thickness, and bone mineral density, were significantly decreased in MstnGdf11/Gdf11 compared to Mstn+/+ male mice; for example, BV/TV and bone mineral density were reduced in femurs by 43% and 48%, respectively, humeri by 26% and 34%, respectively, and L5 vertebrae by 19% and 22%, respectively. Consistent with the DXA data, the only significant differences seen in micro-CT parameters in females were small decreases in BV/TV and bone mineral density (reduced by 8% and 9%, respectively) in L5 vertebrae.
Table 4.
MicroCT analysis (trabecular bone)
| Male +/+ (n = 9) |
Male Gdf11/Gdf11 (n = 8) |
Female +/+ (n = 7) |
Female Gdf11/Gdf11 (n = 10) |
|
|---|---|---|---|---|
| Femurs | ||||
| Total volume (mm3) | 2.16 ± 0.08 | 1.86 ± 0.05b | 1.75 ± 0.05 | 1.72 ± 0.04 |
| Bone volume (mm3) | 0.403 ± 0.058 | 0.194 ± 0.015b | 0.139 ± 0.011 | 0.121 ± 0.012 |
| Bone surface (mm2) | 21.49 ± 1.97 | 13.03 ± 0.87b | 9.36 ± 0.61 | 8.43 ± 0.78 |
| Bone volume fraction (BV/TV) (%) | 18.20 ± 2.04 | 10.34 ± 0.65b | 7.92 ± 0.55 | 7.01 ± 0.57 |
| Bone surface density (1/mm) | 9.82 ± 0.56 | 6.95 ± 0.33c | 5.35 ± 0.28 | 4.86 ± 0.36 |
| Specific bone surface (1/mm) | 57.70 ± 3.80 | 70.85 ± 2.58b | 71.55 ± 1.77 | 73.79 ± 1.92 |
| Connectivity density (1/mm3) | 246.4 ± 12.1 | 179.1 ± 16.3b | 104.4 ± 10.5 | 97.0 ± 13.1 |
| Structure model index | 1.81 ± 0.19 | 2.52 ± 0.07b | 2.75 ± 0.08 | 2.81 ± 0.07 |
| Trabecular number (Tb.N) (1/mm) | 5.61 ± 0.14 | 4.75 ± 0.14c | 4.18 ± 0.08 | 4.01 ± 0.13 |
| Trabecular thickness (Tb.Th) (μm) | 48.0 ± 2.6 | 40.5 ± 1.8a | 40.2 ± 0.6 | 39.5 ± 0.8 |
| Trabecular spacing (Tb.Sp) (μm) | 166.5 ± 5.6 | 204.6 ± 7.0c | 235.4 ± 4.6 | 248.3 ± 8.2 |
| Standard deviation of Tb.Th (μm) | 17.4 ± 1.5 | 14.2 ± 1.1 | 15.0 ± 0.14 | 15.0 ± 0.68 |
| Standard deviation of Tb.Sp (μm) | 53.8 ± 2.5 | 66.0 ± 2.2b | 69.3 ± 2.8 | 75.1 ± 2.9 |
| Degree of anisotropy | 1.67 ± 0.05 | 1.53 ± 0.03a | 1.61 ± 0.03 | 1.56 ± 0.04 |
| Bone mineral density (mg/ccm HA) | 153.5 ± 18.7 | 79.7 ± 6.1b | 54.8 ± 4.9 | 47.0 ± 5.2 |
| Tissue density (mg/ccm HA) | 876.7 ± 7.5 | 854.5 ± 10.0 | 856.9 ± 4.6 | 857.6 ± 4.9 |
| Humeri | ||||
| Total volume (mm3) | 0.93 ± 0.02 | 0.90 ± 0.03 | 0.82 ± 0.03 | 0.77 ± 0.02 |
| Bone volume (mm3) | 0.088 ± 0.007 | 0.063 ± 0.008a | 0.054 ± 0.005 | 0.045 ± 0.005 |
| Bone surface (mm2) | 5.84 ± 0.44 | 4.44 ± 0.51a | 3.47 ± 0.23 | 2.91 ± 0.29 |
| Bone volume fraction (BV/TV) (%) | 9.36 ± 0.59 | 6.97 ± 0.62b | 6.52 ± 0.46 | 5.75 ± 0.52 |
| Bone surface density (1/mm) | 6.21 ± 0.37 | 4.90 ± 0.38a | 4.21 ± 0.20 | 3.73 ± 0.32 |
| Specific bone surface (1/mm) | 70.86 ± 1.97 | 76.32 ± 1.84a | 69.76 ± 2.27 | 69.73 ± 1.41 |
| Connectivity density (1/mm3) | 117.5 ± 12.9 | 80.3 ± 14.4 | 49.4 ± 5.4 | 47.0 ± 8.6 |
| Structure model index | 2.86 ± 0.06 | 3.03 ± 0.07 | 2.89 ± 0.08 | 3.06 ± 0.12 |
| Trabecular number (Tb.N) (1/mm) | 4.99 ± 0.15 | 4.46 ± 0.13a | 3.71 ± 0.06 | 3.63 ± 0.12 |
| Trabecular thickness (Tb.Th) (μm) | 40.4 ± 1.2 | 38.0 ± 1.0 | 40.6 ± 1.4 | 41.4 ± 0.9 |
| Trabecular spacing (Tb.Sp) (μm) | 195.2 ± 6.8 | 220.9 ± 6.7a | 268.7 ± 5.1 | 277.6 ± 9.5 |
| Standard deviation of Tb.Th (μm) | 14.5 ± 0.8 | 13.5 ± 0.6 | 15.3 ± 1.0 | 16.1 ± 0.7 |
| Standard deviation of Tb.Sp (μm) | 57.6 ± 1.8 | 68.5 ± 3.0b | 94.0 ± 8.0 | 87.4 ± 5.0 |
| Degree of anisotropy | 1.83 ± 0.02 | 1.80 ± 0.05 | 1.80 ± 0.04 | 1.81 ± 0.04 |
| Bone mineral density (mg/ccm HA) | 75.5 ± 5.8 | 50.0 ± 6.1b | 43.0 ± 3.4 | 37.1 ± 4.7 |
| Tissue density (mg/ccm HA) | 910.4 ± 7.8 | 901.5 ± 5.8 | 908.1 ± 7.8 | 928.5 ± 9.4 |
| L5 Vertebrae | ||||
| Total volume (mm3) | 2.06 ± 0.06 | 1.98 ± 0.05 | 2.03 ± 0.07 | 2.04 ± 0.05 |
| Bone volume (mm3) | 0.541 ± 0.034 | 0.417 ± 0.020b | 0.427 ± 0.019 | 0.397 ± 0.015 |
| Bone surface (mm2) | 26.63 ± 1.03 | 22.91 ± 1.04a | 22.49 ± 0.72 | 21.41 ± 0.70 |
| Bone volume fraction (BV/TV) (%) | 26.05 ± 0.92 | 20.98 ± 0.56c | 21.03 ± 0.38 | 19.40 ± 0.49a |
| Bone surface density (1/mm) | 12.90 ± 0.21 | 11.55 ± 0.28b | 11.11 ± 0.10 | 10.48 ± 0.22a |
| Specific bone surface (1/mm) | 49.90 ± 1.43 | 55.45 ± 0.29b | 53.31 ± 1.03 | 54.57 ± 0.65 |
| Connectivity density (1/mm3) | 306.1 ± 10.5 | 266.9 ± 13.3a | 280.9 ± 12.0 | 253.9 ± 7.8 |
| Structure model index | 0.46 ± 0.08 | 0.87 ± 0.05c | 0.81 ± 0.04 | 0.91 ± 0.05 |
| Trabecular number (Tb.N) (1/mm) | 5.59 ± 0.08 | 5.21 ± 0.08b | 4.81 ± 0.06 | 4.63 ± 0.07 |
| Trabecular thickness (Tb.Th) (μm) | 46.3 ± 1.6 | 41.6 ± 0.2a | 43.7 ± 0.7 | 43.1 ± 0.5 |
| Trabecular spacing (Tb.Sp) (μm) | 166.2 ± 2.8 | 180.1 ± 3.5b | 198.6 ± 3.2 | 207.4 ± 3.8 |
| Standard deviation of Tb.Th (μm) | 13.8 ± 1.0 | 11.4 ± 0.1a | 12.6 ± 0.19 | 12.7 ± 0.27 |
| Standard deviation of Tb.Sp (μm) | 73.8 ± 2.2 | 75.2 ± 4.4 | 85.2 ± 3.5 | 91.4 ± 2.8 |
| Degree of anisotropy | 2.01 ± 0.04 | 1.98 ± 0.04 | 1.96 ± 0.04 | 1.96 ± 0.02 |
| Bone mineral density (mg/ccm HA) | 231.0 ± 8.7 | 181.3 ± 5.6c | 180.6 ± 4.1 | 164.9 ± 4.9a |
| Tissue density (mg/ccm HA) | 906.7 ± 6.2 | 887.9 ± 1.7a | 873.4 ± 6.6 | 879.1 ± 3.5 |
ap < 0.05 vs. +/+
bp < 0.01 vs. +/+
cp < 0.001 vs. +/+
Fig. 4.

Micro-CT images of representative femurs, humeri, and L5 vertebrae isolated from male Mstn+/+ and MstnGdf11/Gdf11 mice
Two general conclusions seem evident from the results presented here. First, mature GDF-11 appears to be capable of completely functionally replacing mature MSTN with respect to the control of muscle mass; in fact, based on the slight decreases in muscle mass seen in MstnGdf11/Gdf11 male mice, mature GDF-11 made from the knock-in allele actually seems to be even more active than mature MSTN in the control of muscle mass. We did observe trends toward higher levels of circulating GDF-11 resulting from expression of the knock-in allele compared to circulating MSTN levels resulting from expression from the wild-type allele in male mice, but these differences were not statistically significant. This enhanced activity in mice carrying the knock-in allele could reflect either inherent differences in the biological properties of mature MSTN versus mature GDF-11 or differences in levels of activation of the latent MSTN complex versus the hybrid latent complex of mature GDF-11 bound to the MSTN propeptide. Second, complete replacement of mature MSTN with mature GDF-11 does not lead to some of the developmental or physiological changes that might be expected as a result of overexpression of GDF-11. Developmentally, MstnGdf11/Gdf11 mice appear to exhibit completely normal axial skeletal patterning. This might not be surprising given that Gdf11 and Mstn have distinct expression patterns during embryogenesis, with Gdf11 being expressed in the tail bud and primitive streak region in mid-gestation embryos [28] and Mstn being expressed in the myotome compartment of developing somites [1]. Despite these distinct expression patterns, however, the two genes are known to be partially functionally redundant with respect to axial patterning, with Gdf11/Mstn double mutants exhibiting more extensive anteriorly directed homeotic transformations than Gdf11 single mutants [35]. Hence, the normal skeletal patterning seen in MstnGdf11/Gdf11 mice suggests that the biological activities of mature GDF-11 and mature MSTN are similar with respect to regulation of axial patterning. Physiologically, MstnGdf11/Gdf11 mice appear to be relatively normal with respect to glucose metabolism despite having circulating GDF-11 levels that are increased ~ 30–40-fold. Based on the report that purified GDF-11 but not MSTN can improve glucose tolerance [57], one might have expected MstnGdf11/Gdf11 mice to have improved responses to glucose challenges compared to wild-type mice, but we observed no significant differences between MstnGdf11/Gdf11 and wild-type mice in glucose tolerance tests on either standard or high-fat diets. We did observe trends toward lower glucose values in glucose tolerance tests in mice maintained on high-fat diets, but these differences were not statistically significant, and in fact, MstnGdf11/Gdf11 female mice actually had slightly elevated fasting glucose levels that were statistically significant.
One tissue that was substantially affected by replacing MSTN with GDF-11 was bone, with MstnGdf11/Gdf11 mice exhibiting significantly decreased BV/TV, trabecular number, trabecular thickness, and bone mineral density, at least in males. Although there are conflicting reports as to the role of GDF-11 in regulating bone, the phenotype of MstnGdf11/Gdf11 mice is consistent with the effects that have been observed upon blocking this pathway pharmacologically using decoy forms of activin type 2 receptors [68–73] or genetically targeting Acvr2/Acvr2b [74] or Alk4/Alk5 [45] in osteoblasts. The decreased bone mass seen in MstnGdf11/Gdf11 mice would be consistent with the possibility that GDF-11 made from the hybrid precursor protein is slightly more active than endogenous MSTN, as suggested by the slight decreases in muscle mass seen in the knock-in mice. Alternatively, the bone phenotype could result from increased GDF-11 levels per se, perhaps reflecting inherent differences between GDF-11 and MSTN in their ability to regulate bone.
In interpreting the results of these studies, it is important to keep in mind not only that GDF-11 is expressed under the control of Mstn regulatory sequences in these knock-in mice but also that GDF-11 protein is made from a hybrid precursor protein containing the MSTN propeptide. Although the MSTN propeptide and GDF-11 propeptide are each capable of binding mature GDF-11 and being cleaved by BMP-1/tolloid proteases to activate latency [37, 38, 40], it is possible that these propeptides have distinct properties that confer some degree of specificity with respect to the biological functions carried out by MSTN versus GDF-11. Hence, additional experiments, such as germline replacement of the MSTN propeptide with the GDF-11 propeptide or the converse germline replacement of the GDF-11 propeptide and/or mature domain with the corresponding portions of MSTN, will be required to understand the full extent to which the various domains of these molecules are functionally equivalent.
Our findings are significant in the context of the current uncertainty surrounding the biological activity of GDF-11 in vivo. A series of papers have suggested that GDF-11 may play a key role in tissue aging. Circulating GDF-11 levels in mice have been reported to decline during aging [75], and injection of purified GDF-11 protein to aged mice was shown to reverse age-related cardiac hypertrophy [75], stimulate vascular remodeling and enhance neurogenesis in the nervous system of aged mice [76], and improve satellite cell function and muscle regeneration and function in aged mice [77]. These studies have suggested that restoring GDF-11 levels to youthful levels may be a new therapeutic strategy to prevent or reverse age-related tissue dysfunction in a wide range of tissues. Some other studies have not found a decline in GDF-11 levels during aging. Subsequent studies have suggested that the assay used to measure circulating levels of GDF-11 may have been detecting circulating MSTN and that GDF-11 levels are either unchanged or perhaps even increased during aging [59, 78, 79]. The reported effect of GDF-11 in promoting muscle regeneration also has remained uncertain; this finding was unexpected given that loss or inhibition of MSTN signaling had been shown to improve muscle regeneration in the setting of both acute muscle injury and chronic muscle degeneration (for reviews, see references [80–82]). Indeed, subsequent studies reported that administering purified GDF-11 to mice impairs the ability of the muscle to regenerate [78, 83], which is more consistent with the fact that MSTN and GDF-11 are virtually indistinguishable in their biological properties in vitro. Although it is possible that differences in the experimental procedures and dose regimens used may account for the discrepant findings among studies and that exogenously administered GDF-11 may behave differently than endogenously produced MSTN, our findings are consistent with GDF-11 being capable of functionally replacing MSTN in vivo.
Acknowledgements
We thank Ann Lawler and Charles Hawkins at the Johns Hopkins Transgenic Core Laboratory for ES cell transfections and blastocyst injections and The Jackson Laboratory Clinical Chemistry Services for measurements of plasma leptin, insulin, and lipid levels.
Abbreviations
- MSTN
Myostatin
- TGF-ß
Transforming growth factor-ß
- ES
Embryonic stem
- DXA
Dual-energy X-ray absorptiometer
- GTT
Glucose tolerance test
- HU
Hounsfield unit
Authors’ contributions
Conducted experiments: S-JL, AL, RR, and YL. Managed the project: S-JL, DWY, SB, and ELG-L. Wrote paper: S-JL, SB, and ELG-L. All authors read and approved the final manuscript.
Funding
Research reported in this publication was supported by NIH grants R01AR060636 (to S-J.L.), R01AG052962 (to S-J.L.), and R56AG052972 (to SB) and by generous gifts from The Neil Esposito and Donna Hughes Type 1 Diabetes Fund (to E.L.G-L.) and The Bessette Family Type 1 Diabetes Fund (to E.L.G-L.). While at Johns Hopkins, S-J.L. was supported by generous gifts from Michael and Ann Hankin, Partners of Brown Advisory, and James and Julieta Higgins.
Availability of data and materials
All data generated or analyzed during this study are included in this published article.
Declarations
Ethics approval and consent to participate
Not applicable.
Consent for publication
Not applicable.
Competing interests
The authors declare that they have no competing interests.
Footnotes
Publisher’s Note
Springer Nature remains neutral with regard to jurisdictional claims in published maps and institutional affiliations.
References
- 1.McPherron AC, Lawler AM, Lee SJ. Regulation of skeletal muscle mass in mice by a new TGF-beta superfamily member. Nature. 1997;387:83. doi: 10.1038/387083a0. [DOI] [PubMed] [Google Scholar]
- 2.McPherron AC, Lee SJ. Double muscling in cattle due to mutations in the myostatin gene. Proc Natl Acad Sci USA. 1997;94:12457. doi: 10.1073/pnas.94.23.12457. [DOI] [PMC free article] [PubMed] [Google Scholar]
- 3.Grobet L, Martin LJ, Poncelet D, Pirottin D, Brouwers B, Riquet J, et al. A deletion in the bovine myostatin gene causes the double-muscled phenotype in cattle. Nat Genet. 1997;17:71. doi: 10.1038/ng0997-71. [DOI] [PubMed] [Google Scholar]
- 4.Kambadur R, Sharma M, Smith TP, Bass JJ. Mutations in myostatin (GDF8) in double-muscled Belgian Blue and Piedmontese cattle. Genome Res. 1997;7:910. doi: 10.1101/gr.7.9.910. [DOI] [PubMed] [Google Scholar]
- 5.Schuelke M, Wagner KR, Stolz LE, Hübner C, Riebel T, Kömen W, et al. Myostatin mutation associated with gross muscle hypertrophy in a child. N Engl J Med. 2004;350:2682. doi: 10.1056/NEJMoa040933. [DOI] [PubMed] [Google Scholar]
- 6.Clop A, Marcq F, Takeda H, Pirottin D, Tordoir X, Bibé B, et al. A mutation creating a potential illegitimate microRNA target site in the myostatin gene affects muscularity in sheep. Nat Genet. 2006;38:813. doi: 10.1038/ng1810. [DOI] [PubMed] [Google Scholar]
- 7.Mosher DS, Quignon P, Bustamante CD, Sutter NB, Mellersh CS, Parker HG, Ostrander EA. A mutation in the myostatin gene increases muscle mass and enhances racing performance in heterozygote dogs. PLoS Genet. 2007;3:e79. doi: 10.1371/journal.pgen.0030079. [DOI] [PMC free article] [PubMed] [Google Scholar]
- 8.Hill EW, Gu J, Eivers SS, Fonseca RG, McGivney BA, Govindarajan P, et al. A sequence polymorphism in MSTN predicts sprinting ability and racing stamina in thoroughbred horses. PLoS One. 2010;5:e8645. doi: 10.1371/journal.pone.0008645. [DOI] [PMC free article] [PubMed] [Google Scholar]
- 9.Dall'Olio S, Fontanesi L, Nanni Costa L, Tassinari M, Minieri L, Falaschini A. Analysis of horse myostatin gene and identification of single nucleotide polymorphisms in breeds of different morphological types. J Biomed Biotechnol. 2010;2010:542945. doi: 10.1155/2010/542945. [DOI] [PMC free article] [PubMed] [Google Scholar]
- 10.Hill EW, McGivney BA, Gu J, Whiston R, Machugh DE. A genome-wide SNP-association study confirms a sequence variant (g.66493737C>T) in the equine myostatin (MSTN) gene as the most powerful predictor of optimum racing distance for Thoroughbred racehorses. BMC Genomics. 2010;11:552. doi: 10.1186/1471-2164-11-552. [DOI] [PMC free article] [PubMed] [Google Scholar]
- 11.Tozaki T, Sato F, Hill EW, Miyake T, Endo Y, Kakoi H, et al. Sequence variants at the myostatin gene locus influence the body composition of Thoroughbred horses. J Vet Med Sci. 2011;73:1617. doi: 10.1292/jvms.11-0295. [DOI] [PubMed] [Google Scholar]
- 12.Lv Q, Yuan L, Deng J, Chen M, Wang Y, Zeng J, et al. Efficient generation of myostatin gene mutated rabbit by CRISPR/Cas9. Sci Rep. 2016;6:25029. doi: 10.1038/srep25029. [DOI] [PMC free article] [PubMed] [Google Scholar]
- 13.Gu H, Cao Y, Qiu B, Zhou Z, Deng R, Chen Z, et al. Establishment and phenotypic analysis of an Mstn knockout rat. Biochem Biophys Res Commun. 2016;477:115. doi: 10.1016/j.bbrc.2016.06.030. [DOI] [PubMed] [Google Scholar]
- 14.Wang K, Tang X, Xie Z, Zou X, Li M, Yuan H, et al. CRISPR/Cas9-mediated knockout of myostatin in Chinese indigenous Erhualian pigs. Transgenic Res. 2017;26:799. doi: 10.1007/s11248-017-0044-z. [DOI] [PubMed] [Google Scholar]
- 15.Rooney MF, Hill EW, Kelly VP, Porter RK. The “speed gene” effect of myostatin arises in Thoroughbred horses due to a promoter proximal SINE insertion. PLoS One. 2018;13:e0205664. doi: 10.1371/journal.pone.0205664. [DOI] [PMC free article] [PubMed] [Google Scholar]
- 16.He Z, Zhang T, Jiang L, Zhou M, Wu D, Mei J, Cheng Y. Use of CRISPR/Cas9 technology efficiently targetted goat myostatin through zygotes microinjection resulting in double-muscled phenotype in goats. Biosci Rep. 2018;38:BSR20180742. doi: 10.1042/BSR20180742. [DOI] [PMC free article] [PubMed] [Google Scholar]
- 17.Acosta J, Carpio Y, Borroto I, González O, Estrada MP. Myostatin gene silenced by RNAi show a zebrafish giant phenotype. J Biotechnol. 2005;119:324. doi: 10.1016/j.jbiotec.2005.04.023. [DOI] [PubMed] [Google Scholar]
- 18.Lee CY, Hu SY, Gong HY, Chen MH, Lu JK, Wu JL. Suppression of myostatin with vector-based RNA interference causes a double-muscle effect in transgenic zebrafish. Biochem Biophys Res Commun. 2009;387:766. doi: 10.1016/j.bbrc.2009.07.110. [DOI] [PubMed] [Google Scholar]
- 19.Khalil K, Elayat M, Khalifa E, Daghash S, Elaswad A, Miller M, et al. Generation of myostatin gene-edited channel catfish (Ictalurus punctatus) via zygote injection of CRISPR/Cas9 system. Sci Rep. 2017;7:7301. doi: 10.1038/s41598-017-07223-7. [DOI] [PMC free article] [PubMed] [Google Scholar]
- 20.Lee J, Kim DH, Lee K. Muscle hyperplasia in japanese quail by single amino acid deletion in MSTN propeptide. Int J Mol Sci. 2020;21:1504. doi: 10.3390/ijms21041504. [DOI] [PMC free article] [PubMed] [Google Scholar]
- 21.Kim GD, Lee JH, Song S, Kim SW, Han JS, Shin SP, et al. Generation of myostatin-knockout chickens mediated by D10A-Cas9 nickase. FASEB J. 2020;34:5688. doi: 10.1096/fj.201903035R. [DOI] [PubMed] [Google Scholar]
- 22.Zimmers TA, Davies MV, Koniaris LG, Haynes P, Esquela AF, Tomkinson KN, et al. Induction of cachexia in mice by systemically administered myostatin. Science. 2002;296:1486. doi: 10.1126/science.1069525. [DOI] [PubMed] [Google Scholar]
- 23.Lee SJ, Huynh TV, Lee YS, Sebald SM, Wilcox-Adelman SA, Iwamori N, et al. Role of satellite cells versus myofibers in muscle hypertrophy induced by inhibition of the myostatin/activin signaling pathway. Proc Natl Acad Sci USA. 2012;109:E2353. doi: 10.1073/pnas.1206410109. [DOI] [PMC free article] [PubMed] [Google Scholar]
- 24.Lee SJ, Lehar A, Liu Y, Ly CH, Pham QM, Michaud M, et al. Functional redundancy of type I and type II receptors in the regulation of skeletal muscle growth by myostatin and activin A. Proc Natl Acad Sci USA. 2020;117:30907. doi: 10.1073/pnas.2019263117. [DOI] [PMC free article] [PubMed] [Google Scholar]
- 25.Lee SJ. Targeting the myostatin signaling pathway to treat muscle loss and metabolic dysfunction. J Clin Invest. 2021;131:e148372. doi: 10.1172/JCI148372. [DOI] [PMC free article] [PubMed] [Google Scholar]
- 26.Gamer LW, Wolfman NM, Celeste AJ, Hattersley G, Hewick R, Rosen V. A novel BMP expressed in developing mouse limb, spinal cord, and tail bud is a potent mesoderm inducer in Xenopus embryos. Dev Biol. 1999;208:222. doi: 10.1006/dbio.1998.9191. [DOI] [PubMed] [Google Scholar]
- 27.Nakashima M, Toyono T, Akamine A, Joyner A. Expression of growth/differentiation factor 11, a new member of the BMP/TGFbeta superfamily during mouse embryogenesis. Mech Dev. 1999;80:185. doi: 10.1016/s0925-4773(98)00205-6. [DOI] [PubMed] [Google Scholar]
- 28.McPherron AC, Lawler AM, Lee SJ. Regulation of anterior/posterior patterning of the axial skeleton by growth/differentiation factor 11. Nat Genet. 1999;22:260. doi: 10.1038/10320. [DOI] [PubMed] [Google Scholar]
- 29.Esquela AF, Lee SJ. Regulation of metanephric kidney development by growth/differentiation factor 11. Dev Biol. 2003;257:356. doi: 10.1016/s0012-1606(03)00100-3. [DOI] [PubMed] [Google Scholar]
- 30.Harmon EB, Apelqvist AA, Smart NG, Gu X, Osborne DH, Kim SK. GDF11 modulates NGN3+ islet progenitor cell number and promotes beta-cell differentiation in pancreas development. Development. 2004;131:6163. doi: 10.1242/dev.01535. [DOI] [PubMed] [Google Scholar]
- 31.Dichmann DS, Yassin H, Serup P. Analysis of pancreatic endocrine development in GDF11-deficient mice. Dev Dyn. 2006;235:3016. doi: 10.1002/dvdy.20953. [DOI] [PubMed] [Google Scholar]
- 32.Wu HH, Ivkovic S, Murray RC, Jaramillo S, Lyons KM, Johnson JE, Calof AL. Autoregulation of neurogenesis by GDF11. Neuron. 2003;37:197. doi: 10.1016/s0896-6273(02)01172-8. [DOI] [PubMed] [Google Scholar]
- 33.Kim J, Wu HH, Lander AD, Lyons KM, Matzuk MM, Calof AL. GDF11 controls the timing of progenitor cell competence in developing retina. Science. 2005;308:1927. doi: 10.1126/science.1110175. [DOI] [PubMed] [Google Scholar]
- 34.Liu JP. The function of growth/differentiation factor 11 (Gdf11) in rostrocaudal patterning of the developing spinal cord. Development. 2006;133:2865. doi: 10.1242/dev.02478. [DOI] [PubMed] [Google Scholar]
- 35.McPherron AC, Huynh TV, Lee SJ. Redundancy of myostatin and growth/differentiation factor 11 function. BMC Dev Biol. 2009;9:24. doi: 10.1186/1471-213X-9-24. [DOI] [PMC free article] [PubMed] [Google Scholar]
- 36.Lee SJ, McPherron AC. Regulation of myostatin activity and muscle growth. Proc Natl Acad Sci USA. 2001;98:9306. doi: 10.1073/pnas.151270098. [DOI] [PMC free article] [PubMed] [Google Scholar]
- 37.Thies RS, Chen T, Davies MV, Tomkinson KN, Pearson AA, Shakey QA, Wolfman NM. GDF-8 propeptide binds to GDF-8 and antagonizes biological activity by inhibiting GDF-8 receptor binding. Growth Factors. 2001;18:251. doi: 10.3109/08977190109029114. [DOI] [PubMed] [Google Scholar]
- 38.Wolfman NM, McPherron AC, Pappano WN, Davies MV, Song K, Tomkinson KN, et al. Activation of latent myostatin by the BMP-1/tolloid family of metalloproteinases. Proc Natl Acad Sci USA. 2003;100:15842. doi: 10.1073/pnas.2534946100. [DOI] [PMC free article] [PubMed] [Google Scholar]
- 39.Lee SJ. Genetic analysis of the role of proteolysis in the activation of latent myostatin. PLoS One. 2008;3:e1628. doi: 10.1371/journal.pone.0001628. [DOI] [PMC free article] [PubMed] [Google Scholar]
- 40.Ge G, Hopkins DR, Ho WB, Greenspan DS. GDF11 forms a bone morphogenetic protein 1-activated latent complex that can modulate nerve growth factor-induced differentiation of PC12 cells. Mol Cell Biol. 2005;25:5846. doi: 10.1128/MCB.25.14.5846-5858.2005. [DOI] [PMC free article] [PubMed] [Google Scholar]
- 41.Hill JJ, Davies MV, Pearson AA, Wang JH, Hewick RM, Wolfman NM, Qiu Y. The myostatin propeptide and the follistatin-related gene are inhibitory binding proteins of myostatin in normal serum. J Biol Chem. 2002;277:40735. doi: 10.1074/jbc.M206379200. [DOI] [PubMed] [Google Scholar]
- 42.Hill JJ, Qiu Y, Hewick RM, Wolfman NM. Regulation of myostatin in vivo by growth and differentiation factor-associated serum protein-1: a novel protein with protease inhibitor and follistatin domains. Mol Endocrinol. 2003;17:1144. doi: 10.1210/me.2002-0366. [DOI] [PubMed] [Google Scholar]
- 43.Matzuk MM, Lu N, Vogel H, Sellheyer K, Roop DR, Bradley A. Multiple defects and perinatal death in mice deficient in follistatin. Nature. 1995;374:360. doi: 10.1038/374360a0. [DOI] [PubMed] [Google Scholar]
- 44.Lee SJ, Lee YS, Zimmers TA, Soleimani A, Matzuk MM, Tsuchida K, et al. Regulation of muscle mass by follistatin and activins. Mol Endocrinol. 2010;24:1998. doi: 10.1210/me.2010-0127. [DOI] [PMC free article] [PubMed] [Google Scholar]
- 45.Liu Y, Lehar A, Rydzik R, Chandok H, Lee YS, Youngstrom DW, et al. Local versus systemic control of bone and skeletal muscle mass by components of the transforming growth factor-β signaling pathway. Proc Natl Acad Sci USA. 2021;118:e2111401118. doi: 10.1073/pnas.2111401118. [DOI] [PMC free article] [PubMed] [Google Scholar]
- 46.Lee YS, Lee SJ. Regulation of GDF-11 and myostatin activity by GASP-1 and GASP-2. Proc Natl Acad Sci USA. 2013;110:E3713. doi: 10.1073/pnas.1309907110. [DOI] [PMC free article] [PubMed] [Google Scholar]
- 47.Rebbapragada A, Benchabane H, Wrana JL, Celeste AJ, Attisano L. Myostatin signals through a transforming growth factor beta-like signaling pathway to block adipogenesis. Mol Cell Biol. 2003;23:7230. doi: 10.1128/MCB.23.20.7230-7242.2003. [DOI] [PMC free article] [PubMed] [Google Scholar]
- 48.Lee SJ, Reed LA, Davies MV, Girgenrath S, Goad ME, Tomkinson KN, et al. Regulation of muscle growth by multiple ligands signaling through activin type II receptors. Proc Natl Acad Sci USA. 2005;102:18117. doi: 10.1073/pnas.0505996102. [DOI] [PMC free article] [PubMed] [Google Scholar]
- 49.Oh SP, Li E. The signaling pathway mediated by the type IIB activin receptor controls axial patterning and lateral asymmetry in the mouse. Genes Dev. 1997;11:1812. doi: 10.1101/gad.11.14.1812. [DOI] [PubMed] [Google Scholar]
- 50.Oh SP, Yeo CY, Lee Y, Schrewe H, Whitman M, Li E. Activin type IIA and IIB receptors mediate Gdf11 signaling in axial vertebral patterning. Genes Dev. 2002;16:2749. doi: 10.1101/gad.1021802. [DOI] [PMC free article] [PubMed] [Google Scholar]
- 51.Andersson O, Reissmann E, Ibáñez CF. Growth differentiation factor 11 signals through the transforming growth factor-beta receptor ALK5 to regionalize the anterior-posterior axis. EMBO Rep. 2006;7:831. doi: 10.1038/sj.embor.7400752. [DOI] [PMC free article] [PubMed] [Google Scholar]
- 52.Sako D, Grinberg AV, Liu J, Davies MV, Castonguay R, Maniatis S, et al. Characterization of the ligand binding functionality of the extracellular domain of activin receptor type IIb. J Biol Chem. 2010;285:21037. doi: 10.1074/jbc.M110.114959. [DOI] [PMC free article] [PubMed] [Google Scholar]
- 53.Goebel EJ, Corpina RA, Hinck CS, Czepnik M, Castonguay R, Grenha R, et al. Structural characterization of an activin class ternary receptor complex reveals a third paradigm for receptor specificity. Proc Natl Acad Sci USA. 2019;116:15505. doi: 10.1073/pnas.1906253116. [DOI] [PMC free article] [PubMed] [Google Scholar]
- 54.Lee YS, Huynh TV, Lee SJ. Paracrine and endocrine modes of myostatin action. J Appl Physiol (1985) 2016;120:592. doi: 10.1152/japplphysiol.00874.2015. [DOI] [PMC free article] [PubMed] [Google Scholar]
- 55.Zimmers TA, Jiang Y, Wang M, Liang TW, Rupert JE, Au ED, et al. Exogenous GDF11 induces cardiac and skeletal muscle dysfunction and wasting. Basic Res Cardiol. 2017;112:48. doi: 10.1007/s00395-017-0639-9. [DOI] [PMC free article] [PubMed] [Google Scholar]
- 56.Jones JE, Cadena SM, Gong C, Wang X, Chen Z, Wang SX, et al. Supraphysiologic administration of GDF11 induces cachexia in part by upregulating GDF15. Cell Rep. 2018;22:3375. doi: 10.1016/j.celrep.2018.03.024. [DOI] [PubMed] [Google Scholar]
- 57.Walker RG, Barrandon O, Poggioli T, Dagdeviren S, Carroll SH, Mills MJ, et al. Exogenous GDF11, but not GDF8, reduces body weight and improves glucose homeostasis in mice. Sci Rep. 2020;10:4561. doi: 10.1038/s41598-020-61443-y. [DOI] [PMC free article] [PubMed] [Google Scholar]
- 58.Lakso M, Pichel JG, Gorman JR, Sauer B, Okamoto Y, Lee E, et al. Efficient in vivo manipulation of mouse genomic sequences at the zygote stage. Proc Natl Acad Sci USA. 1996;93:5860. doi: 10.1073/pnas.93.12.5860. [DOI] [PMC free article] [PubMed] [Google Scholar]
- 59.Peng L, Gagliano-Jucá T, Pencina KM, Krishnan S, Li Z, Tracy RP, et al. Age trends in growth and differentiation factor-11 and myostatin levels in healthy men, measured using liquid chromatography tandem mass spectrometry: differential response to testosterone. J Gerontol A Biol Sci Med Sci. 2021:glab146. 10.1093/gerona/glab146. [DOI] [PMC free article] [PubMed]
- 60.Schiaffino S, Gorza L, Sartore S, Saggin L, Ausoni S, Vianello M, et al. Three myosin heavy chain isoforms in type 2 skeletal muscle fibres. J Muscle Res Cell Motil. 1989;10:197. doi: 10.1007/BF01739810. [DOI] [PubMed] [Google Scholar]
- 61.Bouxsein ML, Boyd SK, Christiansen BA, Guldberg RE, Jepsen KJ, Müller R. Guidelines for assessment of bone microstructure in rodents using micro-computed tomography. J Bone Miner Res. 2010;25:1468. doi: 10.1002/jbmr.141. [DOI] [PubMed] [Google Scholar]
- 62.Girgenrath S, Song K, Whittemore LA. Loss of myostatin expression alters fiber-type distribution and expression of myosin heavy chain isoforms in slow- and fast-type skeletal muscle. Muscle Nerve. 2005;31:34. doi: 10.1002/mus.20175. [DOI] [PubMed] [Google Scholar]
- 63.McPherron AC, Lee SJ. Suppression of body fat accumulation in myostatin-deficient mice. J Clin Invest. 2002;109:595. doi: 10.1172/JCI13562. [DOI] [PMC free article] [PubMed] [Google Scholar]
- 64.Hamrick MW, Pennington C, Webb CN, Isales CM. Resistance to body fat gain in ‘double-muscled’ mice fed a high-fat diet. Int J Obes (Lond) 2006;30:868. doi: 10.1038/sj.ijo.0803200. [DOI] [PubMed] [Google Scholar]
- 65.Hamrick MW, McPherron AC, Lovejoy CO. Bone mineral content and density in the humerus of adult myostatin-deficient mice. Calcif Tissue Int. 2002;71:63. doi: 10.1007/s00223-001-1109-8. [DOI] [PubMed] [Google Scholar]
- 66.Liu W, Zhou L, Zhou C, Zhang S, Jing J, Xie L, et al. GDF11 decreases bone mass by stimulating osteoclastogenesis and inhibiting osteoblast differentiation. Nat Commun. 2016;7:12794. doi: 10.1038/ncomms12794. [DOI] [PMC free article] [PubMed] [Google Scholar]
- 67.Suh J, Kim NK, Lee SH, Eom JH, Lee Y, Park JC, et al. GDF11 promotes osteogenesis as opposed to MSTN, and follistatin, a MSTN/GDF11 inhibitor, increases muscle mass but weakens bone. Proc Natl Acad Sci USA. 2020;117:4910. doi: 10.1073/pnas.1916034117. [DOI] [PMC free article] [PubMed] [Google Scholar]
- 68.Pearsall RS, Canalis E, Cornwall-Brady M, Underwood KW, Haigis B, Ucran J, et al. A soluble activin type IIA receptor induces bone formation and improves skeletal integrity. Proc Natl Acad Sci USA. 2008;105:7082. doi: 10.1073/pnas.0711263105. [DOI] [PMC free article] [PubMed] [Google Scholar]
- 69.Chiu CS, Peekhaus N, Weber H, Adamski S, Murray EM, Zhang HZ, et al. Increased muscle force production and bone mineral density in ActRIIB-Fc-treated mature rodents. J Gerontol A Biol Sci Med Sci. 2013;68:1181. doi: 10.1093/gerona/glt030. [DOI] [PubMed] [Google Scholar]
- 70.Bialek P, Parkington J, Li X, Gavin D, Wallace C, Zhang J, et al. A myostatin and activin decoy receptor enhances bone formation in mice. Bone. 2014;60:162. doi: 10.1016/j.bone.2013.12.002. [DOI] [PubMed] [Google Scholar]
- 71.DiGirolamo DJ, Singhal V, Chang X, Lee SJ, Germain-Lee EL. Administration of soluble activin receptor 2B increases bone and muscle mass in a mouse model of osteogenesis imperfecta. Bone Res. 2015;3:14042. doi: 10.1038/boneres.2014.42. [DOI] [PMC free article] [PubMed] [Google Scholar]
- 72.Guo W, Pencina KM, O'Connell K, Montano M, Peng L, Westmoreland S, et al. Administration of an activin receptor IIB ligand trap protects male juvenile rhesus macaques from simian immunodeficiency virus-associated bone loss. Bone. 2017;97:209. doi: 10.1016/j.bone.2017.01.032. [DOI] [PMC free article] [PubMed] [Google Scholar]
- 73.Lee SJ, Lehar A, Meir JU, Koch C, Morgan A, Warren LE, et al. Targeting myostatin/activin A protects against skeletal muscle and bone loss during spaceflight. Proc Natl Acad Sci USA. 2020;117:23942. doi: 10.1073/pnas.2014716117. [DOI] [PMC free article] [PubMed] [Google Scholar]
- 74.Goh BC, Singhal V, Herrera AJ, Tomlinson RE, Kim S, Faugere MC, et al. Activin receptor type 2A (ACVR2A) functions directly in osteoblasts as a negative regulator of bone mass. J Biol Chem. 2017;292:13809. doi: 10.1074/jbc.M117.782128. [DOI] [PMC free article] [PubMed] [Google Scholar]
- 75.Loffredo FS, Steinhauser ML, Jay SM, Gannon J, Pancoast JR, Yalamanchi P, et al. Growth differentiation factor 11 is a circulating factor that reverses age-related cardiac hypertrophy. Cell. 2013;153:828. doi: 10.1016/j.cell.2013.04.015. [DOI] [PMC free article] [PubMed] [Google Scholar]
- 76.Katsimpardi L, Litterman NK, Schein PA, Miller CM, Loffredo FS, Wojtkiewicz GR, et al. Vascular and neurogenic rejuvenation of the aging mouse brain by young systemic factors. Science. 2014;344:630. doi: 10.1126/science.1251141. [DOI] [PMC free article] [PubMed] [Google Scholar]
- 77.Sinha M, Jang YC, Oh J, Khong D, Wu EY, Manohar R, et al. Restoring systemic GDF11 levels reverses age-related dysfunction in mouse skeletal muscle. Science. 2014;344:649. doi: 10.1126/science.1251152. [DOI] [PMC free article] [PubMed] [Google Scholar]
- 78.Egerman MA, Cadena SM, Gilbert JA, Meyer A, Nelson HN, Swalley SE, et al. GDF11 increases with age and inhibits skeletal muscle regeneration. Cell Metab. 2015;22:164. doi: 10.1016/j.cmet.2015.05.010. [DOI] [PMC free article] [PubMed] [Google Scholar]
- 79.Schafer MJ, Atkinson EJ, Vanderboom PM, Kotajarvi B, White TA, Moore MM, et al. Quantification of GDF11 and myostatin in human aging and cardiovascular disease. Cell Metab. 2016;23:1207. doi: 10.1016/j.cmet.2016.05.023. [DOI] [PMC free article] [PubMed] [Google Scholar]
- 80.Hoogaars WMH, Jaspers RT. Past, present, and future perspective of targeting myostatin and related signaling pathways to counteract muscle atrophy. Adv Exp Med Biol. 2018;1088:153. doi: 10.1007/978-981-13-1435-3_8. [DOI] [PubMed] [Google Scholar]
- 81.Egerman MA, Glass DJ. The role of GDF11 in aging and skeletal muscle, cardiac and bone homeostasis. Crit Rev Biochem Mol Biol. 2019;54:174. doi: 10.1080/10409238.2019.1610722. [DOI] [PubMed] [Google Scholar]
- 82.Rodgers BD, Ward CW. Myostatin/activin receptor ligands in muscle and the development status of attenuating drugs. Endocr Rev. 2021:bnab030. [DOI] [PMC free article] [PubMed]
- 83.Hinken AC, Powers JM, Luo G, Holt JA, Billin AN, Russell AJ. Lack of evidence for GDF11 as a rejuvenator of aged skeletal muscle satellite cells. Aging Cell. 2016;15:582. doi: 10.1111/acel.12475. [DOI] [PMC free article] [PubMed] [Google Scholar]
Associated Data
This section collects any data citations, data availability statements, or supplementary materials included in this article.
Data Availability Statement
All data generated or analyzed during this study are included in this published article.