

Abstract
Infralimbic cortical (IL) manipulations indicate that this region mediates extinction learning and suppresses cocaine seeking following cocaine self‐administration. However, little work has recorded IL activity during the inhibition of cocaine seeking due to the difficulty of determining precisely when cocaine‐seeking behaviour is inhibited within a cocaine‐seeking session. The present study used in vivo electrophysiology to examine IL activity across extinction as well as during cocaine self‐administration and reinstatement. Sprague–Dawley rats underwent 6‐h access cocaine self‐administration in which the response lever was available during discrete signalled trials, a procedure which allowed for the comparison between epochs of cocaine seeking versus the inhibition thereof. Subsequently, rats underwent extinction and cocaine‐primed reinstatement using the same procedure. Results indicate that theta rhythms (4–10 Hz) dominated IL local‐field potential (LFP) activity during all experimental stages. During extinction, theta power fluctuated significantly surrounding the lever press and was lower when rats engaged in cocaine seeking versus when they withheld from doing so. These patterns of oscillatory activity differed from self‐administration and reinstatement stages. Single‐unit analyses indicate heterogeneity of IL unit responses, supporting the idea that multiple neuronal subpopulations exist within the IL and promote the expression of different and even opposing cocaine‐seeking behaviours. Together, these results are consistent with the idea that aggregate synaptic and single‐unit activity in the IL represent the engagement of the IL in action monitoring to promote adaptive behaviour in accordance with task contingencies and reveal critical insights into the relationship between IL activity and the inhibition of cocaine seeking.
Keywords: cocaine seeking, cocaine self‐administration, in vivo electrophysiology, local‐field potential, reinstatement, single units
In this study, we use a novel cocaine self‐administration paradigm to compare infralimbic cortical (IL) activity during periods of cocaine seeking versus inhibition thereof. Only during extinction training theta oscillations varied surrounding the lever‐press event and theta power was lower during epochs of cocaine seeking versus the inhibition thereof. Together with single‐unit and spike‐field results, these data indicate a role for IL activity that goes beyond behavioural inhibition and may serve to promote adaptive behaviour in accordance with task contingencies.

1. INTRODUCTION
Extensive work implicates rodent infralimbic cortical (IL) activity as part of the neurocircuitry that facilitates the extinction of cocaine‐seeking behaviour and inhibits cocaine seeking during reinstatement, following cocaine self‐administration. 1 , 2 , 3 , 4 , 5 , 6 , 7 , 8 However, not all work agrees with an inhibitory influence of IL activity over cocaine seeking. 9 For example, Koya et al. found that IL activation on the first day of extinction promotes cocaine seeking. 10 Studies utilizing in vivo electrophysiological recordings of IL activity could directly inform this discrepancy in the field, yet such work is sparse as most studies examining the modulatory influence of IL activity over cocaine seeking involve manipulations of the region.
Recently, both pre‐clinical and clinical studies have pointed to an important role for prefrontal cortical (PFC) theta oscillations (4–10 Hz) in action monitoring and regulating behavioural output, especially in situations when multiple competing actions are possible, but only one should be selected. 11 , 12 Indeed, recent work examining ventral PFC local‐field potential (LFP) activity in a cocaine or saccharin reward choice task identified a role for theta oscillations in biasing the regions' neural assemblies in favour of a cocaine reward over the saccharin reward. 13 However, the role of theta oscillations in the IL specifically and in relation to the inhibition of cocaine seeking is unknown. Work examining IL activity during fear conditioning indicates that theta oscillations represent a crucial mechanism for communication across brain regions required for the consolidation, retrieval, and extinction of fear memories. 14 , 15 , 16 Of note, Lesting and colleagues found that IL activity led theta oscillations in the lateral amygdala and the hippocampus when rats did not freeze to a conditioned stimulus during an extinction recall test, 14 suggesting a role for such activity in guiding the inhibition of freezing.
Although studies examining IL LFPs during the inhibition of cocaine seeking are rare, more work has focused examining the relationship between IL single‐unit activity and cocaine seeking. Evidence suggests that IL neurons respond to both rewarded and unrewarded lever presses during cocaine seeking, 17 suggesting a role for IL activity that is broader than behavioural inhibition alone. Similarly, work using Daun02 lesioning and in vivo electrophysiological recordings of the IL suggest separate neuronal ensembles for promoting or inhibiting cocaine seeking within the region. 13 , 18 Fear conditioning studies indicate that extinction learning alters the intrinsic excitability of IL pyramidal cells, making them more likely to fire and more likely to fire in bursts. 19 Moreover, IL burst firing is necessary for the consolidation of fear extinction and the degree of burst firing following extinction training predicts extinction recall. 20 Whether similar types of single‐unit activity occur with the extinction of cocaine seeking remains unknown.
Interpreting neurophysiological data from studies investigating the inhibitory role of IL activity over cocaine seeking has been challenging, in part, due to the difficulty in determining periods within the larger cocaine‐seeking session when drug‐seeking behaviour is actively being suppressed. A common approach to investigating neuronal circuits is analysing neurophysiological activity (single units or LFPs) in relation to relevant experimental events. However, the lack of events that defines the inhibition of cocaine seeking does not allow for a direct comparison of IL activity during cocaine seeking versus the inhibition thereof. To address this, we created a novel behavioural paradigm to permit investigation into IL activity during epochs when cocaine seeking did not occur, a critical advance for addressing the aforementioned issues. Using this paradigm, in conjunction with fixed electrode arrays implanted in the IL, the present study recorded in vivo electrophysiological activity during early, middle and late extinction, with ancillary analyses during self‐administration and reinstatement. IL LFP and single‐unit signals were analysed to determine whether theta rhythms are associated with the inhibition of cocaine seeking and whether single‐unit activity related to the inhibition versus promotion of cocaine seeking could be identified.
2. MATERIALS AND METHODS
For all sections in Section 2, additional details are provided in the Supporting Information.
2.1. Rats and surgery
Male Sprague–Dawley rats (Charles River, ~300 g at time of surgery, n = 40) underwent two surgeries. First, intrajugular catheters (SAI Infusion Technologies, Lake Villa, IL) were implanted for intravenous drug self‐administration. Following acquisition of the self‐administration task, rats underwent a stereotaxic surgery for the implantation of a fixed 9‐ or 12‐channel array (NB Labs, Dennison, TX) aimed at the left IL. Methods were approved by the University of Iowa Institutional Animal Care and Use Committee and complied with the National Institutes of Health guidelines for care of laboratory animals.
Out of the 40 rats, 19 rats were excluded from the final analyses due to incorrect electrode placement (n = 6), death/illness (n = 4) or premature catheter failure (n = 9). Successful recordings were obtained from the remaining 21 rats during early and middle extinction. Successful recordings during self‐administration, late extinction and reinstatement were obtained from 17, 18 and 16 rats, respectively.
2.2. Behavioural procedures
Rats underwent 6 h/day of cocaine self‐administration for a minimum of 15 days, using operant chambers (MedAssociates Inc., Fairfax, VT) with a house light, a single lever and a cue light over the lever. To avoid confounds during electrophysiological analysis, an inactive lever was not used. Rats were trained on an epoched cocaine self‐administration task in which the lever was only available in discrete trials during the session. Lever extension and cue light illumination signalled trial onset. Lever presses yielded a cocaine infusion (50 μl containing 100 μg of cocaine; kindly provided by NIDA) and a 5‐s tone cue. The maximum number of trials was 120. Trials ended either when rats made a lever press (lever‐press trial) or when 30 s elapsed with no response on the lever (withhold trial). Thus, the event ‘lever press’ indicates the end of the lever‐press trials, whereas the event ‘trial offset’ indicates the end of the withhold trials. Trial ending was marked by lever retraction and cue light offset. This was followed by a variable 2‐ to 2.5‐min intertrial interval (ITI). The house light remained illuminated for the session duration. Rats were trained on the epoched task for 6 h/day until they reached the criterion of pressing the lever in at least 80% of trials before fixed electrode array implantation.
After electrode array implantation, rats underwent a single 2‐h self‐administration session during which IL activity was recorded. Rats began extinction training (2 h/d) the following day, during which all procedures remained the same as self‐administration, except that lever presses yielded the tone cue but did not yield cocaine infusions (i.e., cued extinction). The average number of trials during the 2‐h recording sessions was 30. Rats underwent extinction training for at least 4 days. Data were collected every day but only analysed for early extinction (Day 1 of extinction), middle extinction (the first day when rats displayed 50% of early extinction lever presses) and late extinction (the first day when rats displayed 10% of early extinction lever presses). Thus, except for early extinction, data analysis time points were based on the rat's behaviour, not the passage of a pre‐determined amount of time. Following extinction, rats underwent one 2‐h cocaine primed (10 mg/kg, i.p., given immediately beforehand) reinstatement session using the same procedures as the extinction sessions.
2.3. Electrophysiology
2.3.1. Spectral analyses of LFPs
LFP analyses were conducted using custom‐written MatLab routines. Raw LFPs were down sampled from 32 to 1 kHz. LFPs between 0 and 3 Hz were filtered out as they can contain DC noise and movement artefacts. 21 Spectral data were convolved using the fast‐Fourier transform. Theta LFPs (4–10 Hz) were obtained by band‐pass filtering the raw LFP signal. Time‐varying power across frequencies was calculated using a complex Morlet wavelet transform method. 21
A fundamental question for this study was whether the IL exhibits different neurophysiological signatures when rats press the lever versus withhold from doing so. As such, a withhold window was determined based on the average lever‐press latency for each rat's session. The length of the withhold window and lever‐press window were the same, which allowed for comparisons between trial types. Importantly, the withhold window event does not represent the precise time point when rats decided to withhold from cocaine seeking (as this is impossible to determine), but rather served as an event around which to centre analyses during withhold trials. The use of a withhold window is preferred over a comparison between the lever press and the trial end events, as the withhold window is centred using the mean lever‐press latency for each rat's session, thus controlling for confounds relating to the passage of time. Visual inspection of the time‐series data was used to inform statistical analysis windows around events of interest. Analysis windows were 500 ms long for the lever‐press and withhold window and 250 ms long for trial onset/offset windows.
2.3.2. Single‐unit analyses
Spike sorting was automated using KlustaKwik. 22 Peri‐event analyses were conducted using custom‐written MatLab routines. Spikes were sorted in a trial‐by‐trial format using a 50‐ms bin resolution. The number of spikes within each peri‐event time histogram (PETH) was z‐transformed in relation to a 2‐s baseline prior to trial onset. The statistical significance of trial‐by‐trial neural modulation to experimental events was determined via a Wilcoxon signed‐rank test (time window compared = 500 ms, α level = 0.05). For baseline firing rate analyses, the baseline epoch consisted of the 0.5‐s window before trial onset. Bursting spike train analyses were conducted using custom‐written MatLab routines using the max interval detection method. 23 , 24 Finally, we engaged in spike‐field analyses as described in the Supporting Information.
2.4. Statistical analyses
Independent t tests or one‐way analyses of variances (ANOVAs) were used to evaluate behaviour differences in reinstatement (GraphPad Software, La Jolla, CA). Tukey's test was utilized for post hoc analyses. For electrophysiological data, a Wilcoxon matched‐pairs signed‐rank test (indicated by a ‘Z’ statistic) was used to analyse differences before and after events of interest. Initial analyses focused on the primary question of interest regarding how neurophysiological activity changes across extinction learning. Electrophysiological measures were compared using Kruskal–Wallis tests (‘H’ statistic) when across all three extinction stages or Mann–Whitney tests (‘U’ statistic) when across two extinction stages. Ancillary questions concerning how neurophysiological activity during self‐administration compared with early extinction and how activity during reinstatement compared with late extinction were examined in subsequent analyses. A chi‐square test (χ 2 statistic) was used to analyse differences in the proportion of modulated units across experimental stages.
3. RESULTS
3.1. Procedures and initial behavioural/electrophysiological data
Figure 1A,B shows the experimental timeline and behavioural task used, respectively. Figure 1C shows the proportion of trials in which the lever was pressed during self‐administration training during the 7 days prior to electrophysiological recordings. Figure 1D,E shows a diagram of an electrode array and a representative histological image stained with cresyl violet, indicating the implant location marked with an electrolytic lesion. Figure 1F shows a representative spectral density plot from a single channel recorded during early extinction. Theta rhythms were the dominant during self‐administration (4–10 Hz, red). Figure 1G shows a representative raw LFP trace from a single channel in the IL (top) and a band‐pass‐filtered theta trace (bottom).
FIGURE 1.
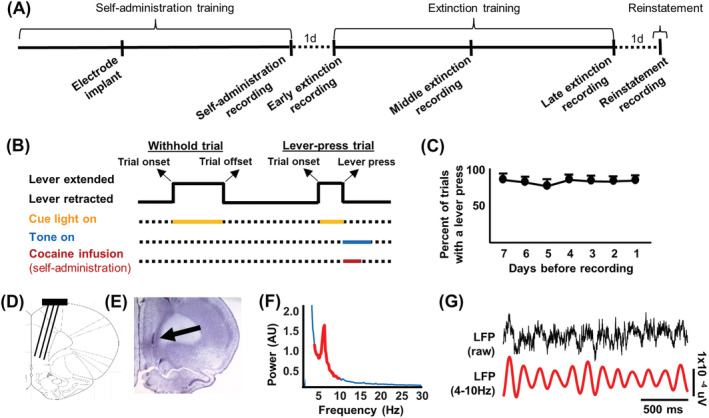
Procedures and initial behavioural/electrophysiological data. (A) Experimental timeline. In vivo electrophysiological data were analysed for early, middle and late extinction, with ancillary analyses occurring during self‐administration and cocaine‐primed reinstatement. (B) Schematic of behavioural procedures. Trial onset was signalled by lever extension and illumination of a cue light. If no response occurred within 30 s, the lever was retracted, and the intertrial interval ensued (withhold trial). A lever press led to a cocaine infusion (during self‐administration only), a tone cue and lever retraction (lever‐press trial). (C) Self‐administration performance for all rats included in the final analyses across the last 7 days of self‐administration training. (D) Schematic of an electrode implanted in the infralimbic cortical (IL). (E) Cresyl violet staining shows an electrolytic lesion (arrow) marking an electrode implanted in the IL. (F) Representative spectral power distribution for a single channel during early extinction indicated dominant local‐field potential oscillations within the theta range (4–10 Hz, red peak). (G) Representative raw and band‐pass filtered local‐field potential data from a single channel during early extinction verified theta oscillations as the dominant rhythm
3.2. Cocaine‐seeking behaviour and LFP activity during extinction
Figure 2 shows behavioural and LFP analyses during extinction. Rats made significantly fewer lever presses during middle and late extinction, compared with early extinction (F [2,57] = 38.82, p < 0.0001, post hoc test p < 0.0001, Figure 2A), with a trend towards a reduction in late extinction compared with middle extinction (p = 0.054). For clarity, the inset in Figure 2A shows the same data as Figure 2A, but the unit of the y axis is ‘lever presses’. Latency to press the lever during lever‐press trials did not change across extinction (F [2,57] = 0.7996, p = 0.47, Figure 2B).
FIGURE 2.
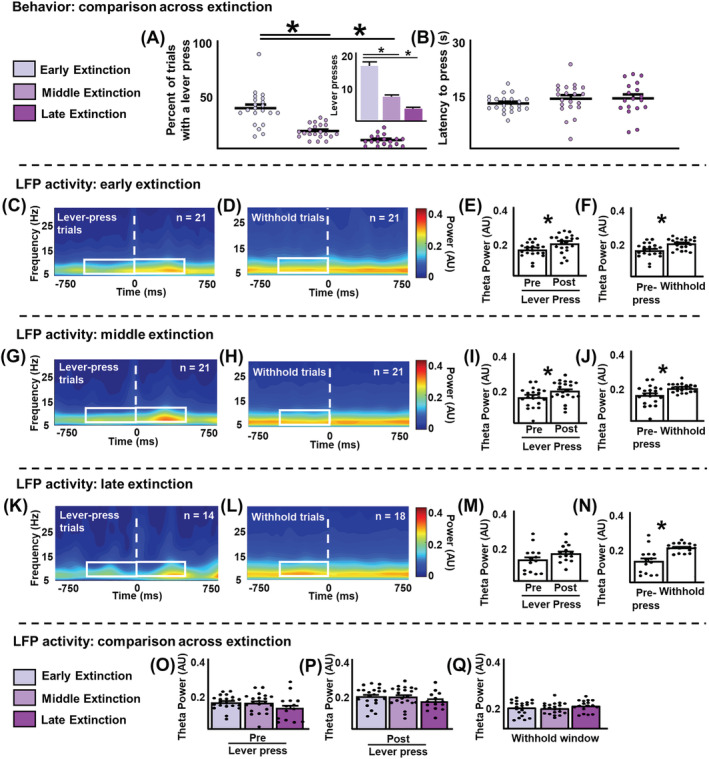
Cocaine‐seeking behaviour and local‐field potentials during extinction. (A) Percentage of trials including a lever press across extinction stages. Rats significantly decreased lever pressing throughout extinction. Dots represent the proportion of trials where a lever press occurred for individual rats. Inset: Same data plotted as the number of lever presses throughout extinction. (B) Latency to lever press during a trial did not change across extinction. (C–F) early extinction. (C and D) averaged power spectrograms centred on the lever press (C) and the withhold window (D). White boxes represent the analysis window (500 ms, 4–10 Hz). (E) Mean theta power surrounding the lever press. Theta power was significantly higher following the lever press, compared with before the lever press. Dots represent averaged theta power values from individual rats. (F) Mean theta power before the lever press versus during the withhold window. Theta power was lower during lever‐press trials compared with withhold trials. (G–J) middle extinction. (G and H) averaged power spectrograms centred on the lever press (G) and the withhold window (H). As with early extinction, theta power was significantly higher following the lever press compared with before the lever press (I) and was lower during lever‐press trials compared to withhold trials (J). (K–N) late extinction. (K and L) averaged power spectrograms centred on the lever press (K) and the withhold window (L). Differing from previous extinction stages, theta power before and after the lever press did not significantly differ (M). However, like previous extinction stages, theta power was lower during lever‐press trials compared to withhold trials (N). (O–Q) comparison across extinction stages. Mean theta power did not differ between extinction stages before the lever press (O), after the lever press (P), and during the withhold window (Q). *p < 0.05
Figure 2C–F shows LFP analyses during early extinction. To determine whether the IL exhibited different neurophysiological signatures during cocaine seeking or the inhibition thereof, analyses were centred on either the lever press or the withhold window depending on the trial type. Figure 2C,D shows averaged power spectrograms centred on the lever press and the withhold window, respectively. White boxes represent the analysis windows (500 ms, 4–10 Hz). Statistical analyses revealed that theta power was significantly higher following a lever press compared with before the lever press (Z = −2.38, p = 0.016, Figure 2E). Comparing lever‐press and withhold trials, analyses revealed that theta power before the lever press was lower than theta power during the withhold window (U = 95, p = 0.0012, Figure 2F). This may suggest a role for IL theta during inhibition of cocaine‐seeking behaviour during early extinction.
Similar analyses were conducted for the middle and late extinction periods (Figure 2G–N). For middle extinction, theta power was significantly higher following the lever press (Z = −2.03, p = 0.042, Figure 2I). Similar to early extinction, theta power before the lever press was lower than that during the withhold window (U = 105, p = 0.0031, Figure 2J). During late extinction and differing from earlier extinction stages, theta power before and after the lever press did not significantly differ (Z = −1.22, p = 0.24, Figure 2M), although this likely reflects an underpowered analysis, as there are few lever‐press events during late extinction. N's differ between lever‐press (n = 14) and withhold (n = 18) trials, as four rats did not engage in enough lever presses for reliable data analysis. Like other extinction stages, theta power before the lever press was lower than during the withhold window (U = 39, p = 0.00010, Figure 2N). Thus, a critical finding within each extinction stage was that higher theta power was detected in the IL when rats withheld from cocaine seeking (withhold trials), compared with the period immediately before they made a cocaine‐seeking response in lever‐press trials.
The differences in IL theta oscillations as a function of trial type (lever press or withhold) led us to consider a more granular view of the potential time course for decreasing theta power within each trial. To address this question, the analysis window was expanded up to 2000 ms before the lever press (data not shown). However, we could not identify a clear point where theta power decreased prior to the lever press, likely due to variability between trials and animals. We also compared theta power across extinction stages. Theta power did not differ across extinction stages before the lever press (H (2) = 3.37, p = 0.19, Figure 2O), after the lever press (H (2) = 3.74, p = 0.15, Figure 2P) or during the withhold window (H (2) = 1.44, p = 0.49, Figure 2Q). As presented in the Supporting Information, we analysed theta oscillations during trial onset/offset and the ITI within and across extinction stages but did not identify patterns related to the inhibition of cocaine seeking. Additionally, through spike‐field analyses, we identified a proportion of IL units that showed significant phase locking to the theta rhythm in the pre‐lever‐press period (Figure S1). However, the proportion of IL units significantly phase locked to the theta rhythm, and the circular concentration coefficient did not change throughout extinction. Due to the low number of units recorded, further spike‐field analyses could not be conducted. Finally, theta power during the post lever‐press and withhold windows were compared. Theta power did not differ between these epochs for early and middle extinction (U = 200, p = 0.81 and U = 173, p = 0.88, respectively). During late extinction, theta power was significantly higher during the withhold window compared the post‐lever‐press window (U = 15, p = 0.0243). However, given the low number post‐lever‐press samples during late extinction, further investigations are necessary before interpreting this finding.
3.3. Single‐unit activity during extinction
Figure 3 shows single‐unit analyses during extinction. Figure 3A depicts representative PETHs for IL units with a significant increase (top) or decrease (bottom) in firing rate in response to trial onset (left), the lever press (middle) or trial offset (right). The proportion of units modulated by trial onset, the lever press, and trial offset are outlined in Table 1. Significantly more units were modulated by trial onset during early extinction compared with middle or late extinction (χ 2 (2) = 13.59, p = 0.0011, Figure 3B [left]). The proportion of units modulated by the lever press did not significantly differ between early and middle extinction (χ 2 (1) = 0.76, p = 0.38, Figure 3B [middle]). Late extinction data were not included, as reliable PETHs could not be constructed given the low number of lever presses during this stage. There was a trend‐level difference such that fewer units were modulated by trial offset during late extinction compared with other extinction stages (χ 2 (2) = 5.11, p = 0.078, Figure 3B [right]).
FIGURE 3.
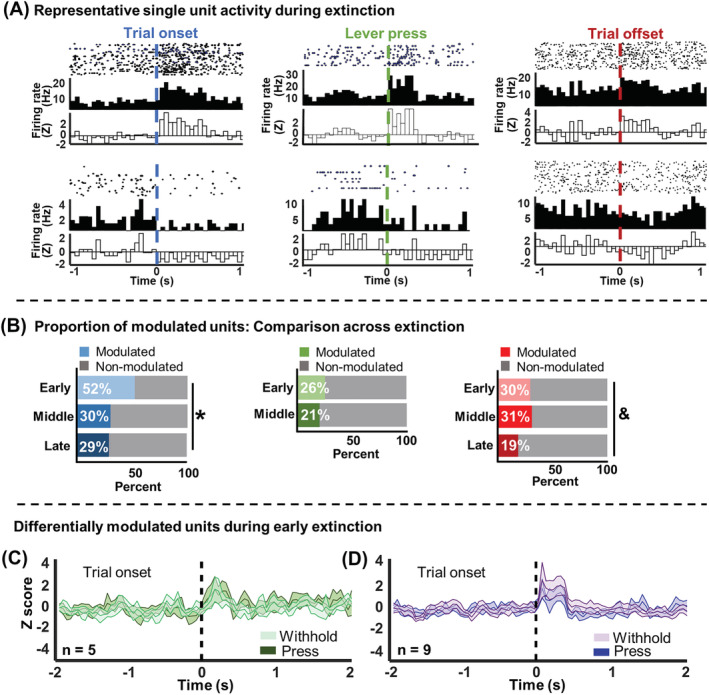
Single unit activity during extinction. (A) Peri‐event histogram and raster plots of IL single units that significantly increased (top) or decreased (bottom) firing rates in response to trial onset (left), the lever press (middle), and trial offset (right). (B) Proportion of units modulated by experimental events across extinction stages. (left) significantly more units were modulated by trial onset during early extinction than during middle or late extinction. (middle) there were no significant differences in the number of units modulated by the lever press between early and middle extinction stages. Late extinction was not included because there were not enough lever press events during this time point for reliable analysis. (right) there was a trend towards a decrease in the percentage of units modulated by trial offset during late extinction compared with other extinction stages. (C and D) averaged activity for pre‐motor units identified during early extinction. Middle line represents the mean z‐scored firing rate with shading indicating ±SEM. (C) Units that were only significantly modulated by trial onset when the rat subsequently pressed the lever. Light green and dark green show withhold and lever‐press trials, respectively. (D) Units that were only significantly modulated by trial onset when rats withheld from lever pressing throughout the trial. Light purple and dark purple show withhold and lever‐press trials, respectively. *p < 0.05. &p < 0.1
TABLE 1.
Number of units modulated by experimental events across extinction stages
| Event | Experimental time point | Total units | % modulated units that increased firing rates |
|---|---|---|---|
| Trial onset | Early extinction | 79 | 95% |
| Middle extinction | 70 | 90% | |
| Late extinction | 48 | 71% | |
| Lever press | Early extinction | 69 | 94% |
| Middle extinction | 24 | 80% | |
| Late extinction | N/A | N/A | |
| Trial offset | Early extinction | 74 | 91% |
| Middle extinction | 70 | 82% | |
| Late extinction | 48 | 89% |
Note: ‘Total units’ reflects the number of putative infralimbic pyramidal cells recorded during each experimental stage. ‘% units that increased firing rates’ reflects the proportion of modulated units which showed a significant increase in firing rate in response to experimental events.
During early extinction, the activity of some single‐unit subsets predicted the rat's subsequent cocaine‐seeking behaviour. Units in Figure 3C only reached the statistical threshold for significant modulation surrounding the trial onset event during lever‐press trials (dark green). For withhold trials, the same neurons were not significantly modulated by trial onset (light green). The neurons in Figure 3D showed the opposite pattern of activity, only reaching the threshold for statistical modulation by trial onset during withhold trials (purple) and not lever‐press trials (blue). These units were deemed pre‐motor units because of their differential changes in firing rate depending on the rat's cocaine‐seeking behaviour. Pre‐motor analyses could not be conducted for middle and late extinction, as the distribution of lever‐press and withhold trials was not comparable. Table S1 shows baseline firing and bursting rates for IL units across extinction and the results of statistical analyses, which are described in more detail in the Supporting Information. The only notable findings were that, during early extinction, significantly more bursts occurred during the trial than during the ITI and that, for units which were not modulated by trial onset, there was a trend towards an increase in bursting rates throughout extinction.
3.4. Ancillary analyses: Self‐administration and reinstatement
In addition to the main analyses examining neurophysiological activity within and across extinction stages, we also conducted ancillary analyses during the important shift in contingencies that occurs from self‐administration to early extinction and late extinction to reinstatement. Figure 4 (top) shows cocaine‐seeking behaviour, LFP analyses, and single‐unit analyses during cocaine self‐administration alone and in comparison with early extinction. Rats pressed the lever significantly more (t (36) = 9.87, p < 0.0001, Figure 4A [left]) and had a shorter latency to press the lever (t (36) = 6.22, p < 0.0001, Figure 4A [right]) during self‐administration compared with early extinction. Figure 4B,C shows averaged power spectrograms centred on the lever‐press and the withhold window, respectively during self‐administration. N's differ between lever‐press and withhold trials because eight rats did not have enough withhold trials for reliable analyses. In contrast to extinction, there were no significant differences in theta power before and after the lever press during self‐administration (Z = −1.21, p = 0.24, Figure 4D). Critically, there were no significant differences in theta power before the lever press and during the withhold window during self‐administration (U = 70, p = 0.75, Figure 4E). This indicates that, during self‐administration, when lever presses were rewarded, theta power did not vary in accordance with the rat's cocaine‐seeking behaviour.
FIGURE 4.
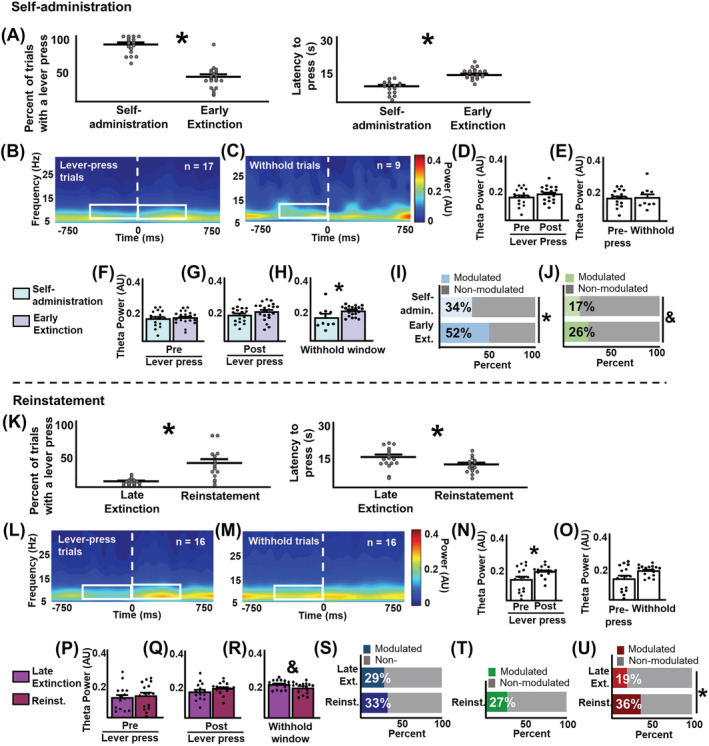
Ancillary analyses: Self‐administration and reinstatement. (A–J) self‐administration. (A) Percentage of lever‐press trials (left) and latency to press the lever during a trial (right) during self‐administration compared to early extinction. During self‐administration, rats pressed the lever significantly more and had significantly shorter latencies to press the lever compared to early extinction. (B and C) averaged spectrograms showing local‐field activity centred on the lever press (B) and the withhold window (C). White boxes represent the analysis window (500 ms, 4–10 Hz). (D and E) different from what was observed during extinction, mean theta power did not significantly differ before vs. after the lever press (D) or during lever‐press versus withhold trials. (F–J) neurophysiological comparisons between self‐administration and early extinction. Theta power did not differ between sessions before the lever press (F) and after the lever press (G). Theta power during the withhold window was significantly lower during self‐administration than during early extinction (H). (I) Significantly fewer units were modulated by trial onset during self‐administration compared to early extinction. (J) There was a trend towards fewer units modulated by the lever press during self‐administration compared with early extinction. (K–U) reinstatement. (K) Percentage of lever‐press trials (left) and latency to press the lever (right) during reinstatement. During reinstatement, rats pressed the lever significantly more and had significantly shorter latencies to press the lever compared with late extinction. (L and M) averaged spectrograms showing local‐field activity centred on the lever press (L) and the withhold window (M). (N) Mean theta power was significantly higher after the lever press. (O) Theta power did not significantly differ between lever‐press and withhold trials. (P–U) local‐field potential comparisons between late extinction and reinstatement. Theta power before the lever press (P) and after the lever press (Q) did not differ between stages. There was a trend towards decreased theta power during the withhold window during reinstatement (R). (S) the proportion of units modulated by trial onset did not differ between stages. (T) Proportion of units modulated by the lever press during reinstatement. Late extinction was not analysed because there were not enough lever press events to generate reliable analyses. (U) Significantly more units were modulated by trial offset during reinstatement than during late extinction. *p < 0.05. &p < 0.1
Figure 4F–J shows neurophysiological comparisons between self‐administration and early extinction. There were no significant differences in theta power between self‐administration and early extinction before the lever press (U = 170, p = 0.81, Figure 4F) and after the lever press (U = 126, p = 0.13, Figure 4G). However, theta power during the withhold window was significantly lower during self‐administration than during early extinction (U = 45, p = 0.025, Figure 4H). Figure 4I,J and Table 2 show the proportion of single units modulated by experimental events. Significantly fewer units were modulated by trial onset during self‐administration compared to early extinction (χ 2 (1) = 6.70, p = 0.0096, Figure 4I). There was a trend‐level difference such that fewer units were modulated by the lever press during self‐administration than during early extinction (χ 2 (1) = 3.02, p = 0.082, Figure 4J). Trial offset‐centred analyses were not conducted, as there were not enough events of this type to construct reliable PETHs.
TABLE 2.
Number of units modulated by experimental events during self‐administration compared to early extinction
| Event | Experimental time point | Total units | % units that increased firing rates |
|---|---|---|---|
| Trial onset | Self‐administration | 65 | 95% |
| Early extinction | 79 | 95% | |
| Lever press | Self‐administration | 65 | 100% |
| Early extinction | 69 | 94% | |
| Trial offset | Self‐administration | N/A | N/A |
| Early extinction | 74 | 91% |
Note: ‘Total units’ reflects the number of putative infralimbic pyramidal cells recorded during each experimental stage. ‘% units that increased firing rates’ reflects the proportion of modulated units which showed a significant increase in firing rate in response to experimental events.
Figure 4 (bottom) shows cocaine‐seeking behaviour, LFP and single‐unit analyses during reinstatement in comparison to late extinction. Rats pressed the lever more (t (32) = 5.19, p < 0.0001, Figure 4K [left]) with shorter latencies to do so (t (32) = 2.45, p = 0.020, Figure 4K [right]) during reinstatement compared with late extinction. Figure 4L,M shows averaged power spectrograms centred on the lever‐press and the withhold window, respectively. Analyses revealed that theta power was significantly higher after the lever press during reinstatement compared with before the lever press (Z = −2.27, p = 0.021, Figure 4N). As with the self‐administration session, but not the extinction sessions, no significant differences in theta power were detected before the lever press and during the withhold window (U = 84, p = 0.102, Figure 4O).
Figure 4P–U shows LFP and single‐unit analyses during reinstatement compared to late extinction. Analyses revealed that theta power before the lever press (U = 99, p = 0.61, Figure 4P) and after the lever press (U = 76, p = 0.14, Figure 4Q) did not differ between reinstatement and late extinction. There was a trend towards lower theta power during the withhold window during reinstatement compared with late extinction (U = 93, p = 0.081, Figure 4R). Figures 4S–U and Table 3 show the proportion of single units modulated by experimental events. The proportion of units modulated by trial onset did not differ between reinstatement and late extinction. (χ 2 (1) = 0.37, p = 0.54, Figure 4T). Statistical comparisons between late extinction and reinstatement were not conducted, as there were not enough lever presses during late extinction to construct reliable PETHs. Significantly fewer units were modulated by trial offset during reinstatement compared to late extinction (χ 2 (1) = 7.45, p = 0.0064; Figure 4U).
TABLE 3.
Number of units modulated by experimental events during reinstatement compared to late extinction
| Event | Experimental time point | Total units | % units with increased firing rates |
|---|---|---|---|
| Trial onset | Late extinction | 48 | 71% |
| Reinstatement | 39 | 92% | |
| Lever press | Late extinction | N/A | N/A |
| Reinstatement | 30 | 100% | |
| Trial offset | Late extinction | 48 | 89% |
| Reinstatement | 39 | 100% |
Note: ‘Total units’ reflects the number of putative infralimbic pyramidal cells recorded during each experimental stage. ‘% units that increased firing rates’ reflects the proportion of modulated units which showed a significant increase in firing rate in response to experimental events.
Baseline firing and bursting rates did not differ between self‐administration and early extinction (Table S2). However, similar to early extinction, significantly more bursts occurred during the trial than during the ITI for self‐administration. Table S3 shows baseline firing and bursting rates of IL units during reinstatement. Some IL populations displayed trends towards decreased baseline firing and bursting rates during reinstatement compared with late extinction. During reinstatement, significantly more bursts occurred during the trial than during the ITI for all units recorded. Finally, Figure S2 shows LFP and spike‐field analyses during self‐administration and reinstatement centred on trial onset/offset and the ITI, but no patterns relating to the inhibition of cocaine‐seeking emerged.
4. DISCUSSION
Using a novel behavioural paradigm that permitted the comparison of cocaine seeking versus withhold epochs, the present work revealed patterns of IL theta power related to cocaine‐seeking behaviour. Initial LFP analyses indicated that theta rhythms were dominant in the IL while rats underwent this behavioural paradigm, independent of the experimental stage examined. However, further analyses centred on self‐generated cocaine‐seeking responses, or the inhibition thereof revealed that, during extinction, there appeared to be an interaction between the failure to inhibit cocaine seeking and a decrease in theta power. In contrast, during self‐administration, no such differences in oscillatory activity were detected. These data, together with single‐unit findings, provide support for the engagement of the IL in action monitoring to promote adaptive behaviour in accordance with task contingencies.
4.1. LFP activity
Previous work suggests that the rodent medial prefrontal cortex (mPFC) is a theta rhythm generator and that this rhythm relates to reward value encoding. 25 The present spike‐field analyses support this conclusion, suggesting that the recorded theta oscillations were generated as a result of IL aggregate synaptic activity and not volume conduction. Extensive evidence supports a role for mPFC theta oscillations during periods of action monitoring in both rats and humans. 12 , 26 , 27 Theta power is commonly detected in the mPFC when multiple competing actions are activated but only one is appropriate and should be selected. 11 Under this theoretical framework, a decrease in theta power reflects a decrease in action monitoring and often precedes an incorrect response. The present spectral power changes from extinction and reinstatement time points indicate that theta power oscillated as a function of the lever press. In contrast, these changes did not occur during self‐administration. One possible explanation of these findings is that decreased theta power prior the lever press during extinction and reinstatement represents a failure of aggregate synaptic activity in inhibiting cocaine‐seeking behaviour, leading to a cocaine‐seeking response when one is not rewarded.
In further support of this idea, the present study found that theta power differed between lever‐press and withhold trials during extinction, with lower theta power detected during lever‐press trials compared with withhold trials. This pattern was not detected during self‐administration. Interestingly, although the reinstatement data showed a pattern similar to extinction, the difference between lever‐press versus withhold trials did not achieve statistical significance. The reason for this discrepancy is unclear. One possibility is that the administration of a cocaine‐priming injection served as a ‘reminder cue’, which may have altered the neural computations during reinstatement such that lever presses were no longer as ‘incorrect’ as they were during extinction. Additionally, visual examination of the pre‐press versus withhold data during reinstatement suggests greater variability in theta power compared with that observed during extinction. Thus, there may have been insufficient power to detect statistical significance in that case.
Although it is possible that the LFP changes detected between self‐administration versus early extinction and late extinction versus reinstatement were due to the influence of cocaine itself, this is likely not the case. ITI analyses indicate that gross differences in theta power were not driving session differences. When differences in theta power were detected, self‐administration and reinstatement sessions showed lower theta power than extinction sessions. However, previous work suggests that cocaine increases theta power. 28 Thus, the observed decrease was likely not due to the pharmacological effects of cocaine itself. Finally, although theta oscillations varied around the lever press in accordance with session contingencies, theta patterns did not differ around trial onset/offset in the same manner, suggesting that the changes in theta oscillations observed were not generally affecting all experimental events but were specifically related to the cocaine‐seeking response itself.
The present work supporting this role for IL theta oscillations is consistent with studies that link PFC hypo‐frontality to the loss of inhibitory control over drug taking in drug‐addicted individuals. 29 Indeed, evidence indicates that mPFC stimulation via transcranial magnetic stimulation (TMS) improves abstinence outcomes and reduces craving in drug‐addicted individuals. 30 , 31 , 32 Moreover, repetitive‐TMS stimulation of the prefrontal and the cingulate cortices using theta‐band frequencies decreases addicted individuals' preference for a cocaine reward. 33 Although it is unclear why the theta rhythm in particular is related to drug use disorders, initial theories point to a role for mediofrontal theta in conflict detection and cognitive control activation, 27 processes that are disrupted in drug addiction. 29
4.2. Single‐unit activity
The present work revealed IL unit activity related to the inhibition of cocaine seeking. During early extinction, trial onset modulated over half of the neurons recorded, a significantly higher number than that observed during self‐administration and other extinction stages. This finding may reflect neural encoding related to the contingency shift that occurs during early extinction. Additionally, the current work found a trend towards increased single unit bursting throughout extinction and a reduction in bursting during reinstatement, consistent with the proposed importance of IL bursting in the extinction of fear conditioning. 19 , 20 Intriguingly, only units that were not modulated by trial onset showed changes in bursting rates. This may reflect statistical power issues, as the number of units in the ‘non‐modulated’ group was higher than that in the ‘modulated’ group. Additionally, even though neurons in the ‘non‐modulated’ group showed no change in activity in response to trial onset, work indicates that such units carry task‐relevant information in other ways. 34
The present work found considerable heterogeneity in single‐unit responses, identifying single‐unit modulation to all events of interest during all experimental stages examined. Of particular relevance, the current study found subpopulations of pre‐motor units during early extinction, the activity of which preceded opposite behaviours—a lever press or the inhibition thereof. This finding provides neurophysiological correlates in support of previous work using Daun02 lesioning that revealed separate neuronal ensembles in the IL for promoting versus inhibiting cocaine seeking. 18 Likewise, work using ethanol self‐administration suggests that IL neurons differentially regulate ethanol seeking depending on their projection targets. 35 Thus, IL single‐unit subpopulations projecting to different downstream targets may compete to promote different behavioural outcomes depending on task contingencies. Which neuronal population ‘wins’ this competition likely depends on the current circumstances facing the organism. This idea helps to clarify how, under a change in experimental procedures, IL activity differentially regulates drug‐seeking behaviour, directly informing an apparent discrepancy in the field.
Because of the relatively low number of single units included in this dataset, it is prudent to take a conservative approach during the discussion of the single unit results. At the onset of the present work, we did not use an approach which optimized single unit yield, in part due to the focus on developing a successful behavioural paradigm that could be combined with in vivo neurophysiological recordings. In the future, combining this behavioural paradigm with different recording approaches that increase unit yield would enable further spike/field analyses. Likewise, future work using different behavioural and recording approaches to optimize analysis of extinction encoding would complement other work from this laboratory indicating that IL activity in the period following an unreinforced lever press is important for such learning. 8
4.3. Conclusion
The present results indicate that IL theta power was related to the successful inhibition of cocaine seeking during extinction. The patterns of theta oscillations around experimental events within sessions and changes in theta power between sessions are consistent with the idea that theta rhythms represent the engagement of the IL in action monitoring to promote adaptive behaviour in accordance with task contingencies. Additionally, the current study found considerable heterogeneity in IL single unit responding, indicating the existence of multiple subpopulations, including neurons whose activity predicted a lever press versus a lack of a lever press. Future experiments need to investigate how IL theta oscillations are implicated in a broader circuit controlling inhibition of cocaine seeking.
CONFLICT OF INTEREST
Authors have no conflicts of interest to declare.
AUTHOR CONTRIBUTIONS
This study was conceptualized by authors VAME and RTL. VAME collected the data. VAME, JK, SJF and JHF conducted data analysis. VAME and RTL drafted the manuscript. All authors provided intellectual contributions to the revised manuscript. All authors approved the manuscript for content.
Supporting information
Figure S1. Local field potential activity around trial onset/offset and during the intertrial interval during extinction.
Figure S2. Local field potential activity during early extinction session halves, self‐administration and reinstatement.
Table S1. Single‐unit baseline firing and bursting rates during extinction. Baseline firing and bursting rates reported in Hz [mean ± SEM (number of units)]. In cells where there are two lines, the top line reflects all modulated units and the bottom line reflects only modulated units that increased firing in response to experimental events. Differences in n's between baseline firing and bursting rates within each group are due to the exclusion of statistical outliers. Kruskal‐Wallis test results are reported as H statistics, Mann–Whitney test results are reported as U statistics, and Wilcoxon matched‐pairs signed rank test results are reported as Z statistics. Outlined values, p < 0.10.
Table S2. Single‐unit baseline firing and bursting rates during self‐administration compared to early extinction. Baseline firing and bursting rates reported in Hz [mean ± SEM (number of units)]. In cells where there are two lines, the top line reflects all modulated units and the bottom line reflects only modulated units that increased firing in response to experimental events. Differences in n's between baseline firing and bursting rates within each group of units are due to the exclusion of statistical outliers. Mann–Whitney test results are reported as U statistics and Wilcoxon matched‐pairs signed rank test results are reported as Z statistics. Outlined values, p < 0.10.
Table S3. Single‐unit baseline firing and bursting rates during reinstatement compared to late extinction. Baseline firing and bursting rates reported in Hz [mean ± SEM (number of units)]. In cells where there are two lines, the top line reflects all modulated units and the bottom line reflects only modulated units that increased firing in response to experimental events. Differences in n's between baseline firing and bursting rates within each group of units are due to the exclusion of statistical outliers. Mann–Whitney test results are reported as U statistics and Wilcoxon matched‐pairs signed rank test results are reported as Z statistics. Outlined values, p < 0.10.
ACKNOWLEDGMENTS
The authors would like to thank Dr. A. Gutman, Dr. M. Sarrett and Mr. K. Tarrant, for their excellent technical assistance. This work was supported by NIDA (DA048055 [RTL], DA049139 [RTL] and DA034684 [RTL]).
Müller Ewald VA, Kim J, Farley SJ, Freeman JH, LaLumiere RT. Theta oscillations in rat infralimbic cortex are associated with the inhibition of cocaine seeking during extinction. Addiction Biology. 2022;27 (1): e13106. doi: 10.1111/adb.13106
DATA AVAILABILITY STATEMENT
The data that support the findings in this study are available from the corresponding author upon reasonable request.
REFERENCES
- 1. Muller Ewald VA, LaLumiere RT. Neural systems mediating the inhibition of cocaine‐seeking behaviors. Pharmacol Biochem Behav. 2018;174:53‐63. [DOI] [PMC free article] [PubMed] [Google Scholar]
- 2. Van den Oever MC, Lubbers BR, Goriounova NA, et al. Extracellular matrix plasticity and GABAergic inhibition of prefrontal cortex pyramidal cells facilitates relapse to heroin seeking. Neuropsychopharmac: Off Publ Am Coll Neuropsychopharmacol. 2010;35(10):2120‐2133. [DOI] [PMC free article] [PubMed] [Google Scholar]
- 3. Van den Oever MC, Rotaru DC, Heinsbroek JA, et al. Ventromedial prefrontal cortex pyramidal cells have a temporal dynamic role in recall and extinction of cocaine‐associated memory. J Neurosci. 2013;33(46):18225‐18233. [DOI] [PMC free article] [PubMed] [Google Scholar]
- 4. Muller Ewald VA, De Corte BJ, Gupta SC, et al. Attenuation of cocaine seeking in rats via enhancement of infralimbic cortical activity using stable step‐function opsins. Psychopharmacology (Berl). 2019;236(1):479‐490. [DOI] [PMC free article] [PubMed] [Google Scholar]
- 5. Augur IF, Wyckoff AR, Aston‐Jones G, Kalivas PW, Peters J. Chemogenetic Activation of an Extinction Neural Circuit Reduces Cue‐Induced Reinstatement of Cocaine Seeking. J Neurosci. 2016;36(39):10174‐10180. [DOI] [PMC free article] [PubMed] [Google Scholar]
- 6. Peters J, Vallone J, Laurendi K, Kalivas PW. Opposing roles for the ventral prefrontal cortex and the basolateral amygdala on the spontaneous recovery of cocaine‐seeking in rats. Psychopharmacology (Berl). 2008;197(2):319‐326. [DOI] [PubMed] [Google Scholar]
- 7. LaLumiere RT, Niehoff KE, Kalivas PW. The infralimbic cortex regulates the consolidation of extinction after cocaine self‐administration. Learn Mem. 2010;17(4):168‐175. [DOI] [PMC free article] [PubMed] [Google Scholar]
- 8. Gutman AL, Nett KE, Cosme CV, et al. Extinction of Cocaine Seeking Requires a Window of Infralimbic Pyramidal Neuron Activity after Unreinforced Lever Presses. J Neurosci. 2017;37(25):6075‐6086. [DOI] [PMC free article] [PubMed] [Google Scholar]
- 9. Gutman AL, Ewald VA, Cosme CV, Worth WR, LaLumiere RT. The infralimbic and prelimbic cortices contribute to the inhibitory control of cocaine‐seeking behavior during a discriminative stimulus task in rats. Addict Biol. 2017;22(6):1719‐1730. [DOI] [PMC free article] [PubMed] [Google Scholar]
- 10. Koya E, Uejima JL, Wihbey KA, Bossert JM, Hope BT, Shaham Y. Role of ventral medial prefrontal cortex in incubation of cocaine craving. Neuropharmacology. 2009;56(Suppl 1):177‐185. [DOI] [PMC free article] [PubMed] [Google Scholar]
- 11. Cavanagh JF, Frank MJ. Frontal theta as a mechanism for cognitive control. Trends Cogn Sci. 2014;18(8):414‐421. [DOI] [PMC free article] [PubMed] [Google Scholar]
- 12. Kahana MJ, Seelig D, Madsen JR. Theta returns. Curr Opin Neurobiol. 2001;11(6):739‐744. [DOI] [PubMed] [Google Scholar]
- 13. Guillem K, Ahmed SH. Reorganization of theta phase‐locking in the orbitofrontal cortex drives cocaine choice under the influence. Sci Rep. 2020;10:8041. [DOI] [PMC free article] [PubMed] [Google Scholar]
- 14. Lesting J, Daldrup T, Narayanan V, Himpe C, Seidenbecher T, Pape HC. Directional theta coherence in prefrontal cortical to amygdalo‐hippocampal pathways signals fear extinction. PLoS One. 2013;8(10):e77707. [DOI] [PMC free article] [PubMed] [Google Scholar]
- 15. Popa D, Duvarci S, Popescu AT, Lena C, Pare D. Coherent amygdalocortical theta promotes fear memory consolidation during paradoxical sleep. Proc Natl Acad Sci U S A. 2010;107(14):6516‐6519. [DOI] [PMC free article] [PubMed] [Google Scholar]
- 16. Lesting J, Narayanan RT, Kluge C, Sangha S, Seidenbecher T, Pape HC. Patterns of coupled theta activity in amygdala‐hippocampal‐prefrontal cortical circuits during fear extinction. PLoS One. 2011;6(6):e21714. [DOI] [PMC free article] [PubMed] [Google Scholar]
- 17. West EA, Saddoris MP, Kerfoot EC, Carelli RM. Prelimbic and infralimbic cortical regions differentially encode cocaine‐associated stimuli and cocaine‐seeking before and following abstinence. Eur J Neurosci. 2014;39(11):1891‐1902. [DOI] [PMC free article] [PubMed] [Google Scholar]
- 18. Warren BL, Kane L, Venniro M, et al. Separate vmPFC Ensembles Control Cocaine Self‐Administration Versus Extinction in Rats. J Neurosci. 2019;39(37):7394‐7407. [DOI] [PMC free article] [PubMed] [Google Scholar]
- 19. Santini E, Quirk GJ, Porter JT. Fear conditioning and extinction differentially modify the intrinsic excitability of infralimbic neurons. J Neurosci. 2008;28(15):4028‐4036. [DOI] [PMC free article] [PubMed] [Google Scholar]
- 20. Burgos‐Robles A, Vidal‐Gonzalez I, Santini E, Quirk GJ. Consolidation of fear extinction requires NMDA receptor‐dependent bursting in the ventromedial prefrontal cortex. Neuron. 2007;53(6):871‐880. [DOI] [PubMed] [Google Scholar]
- 21. Kim J, Goldsberry ME, Harmon TC, Freeman JH. Developmental Changes in Hippocampal CA1 Single Neuron Firing and Theta Activity during Associative Learning. PLoS One. 2016;11(10):e0164781. [DOI] [PMC free article] [PubMed] [Google Scholar]
- 22. Harris KD, Henze DA, Csicsvari J, Hirase H, Buzsáki G. Accuracy of tetrode spike separation as determined by simultaneous intracellular and extracellular measurements. J Neurophysiol. 2000;84(1):401‐414. [DOI] [PubMed] [Google Scholar]
- 23. Legendy CR, Salcman M. Bursts and recurrences of bursts in the spike trains of spontaneously active striate cortex neurons. J Neurophysiol. 1985;53(4):926‐939. [DOI] [PubMed] [Google Scholar]
- 24. Cotterill E, Charlesworth P, Thomas CW, Paulsen O, Eglen SJ. A comparison of computational methods for detecting bursts in neuronal spike trains and their application to human stem cell‐derived neuronal networks. J Neurophysiol. 2016;116(2):306‐321. [DOI] [PMC free article] [PubMed] [Google Scholar]
- 25. Amarante LM, Caetano MS, Laubach M. Medial Frontal Theta Is Entrained to Rewarded Actions. J Neurosci. 2017;37(44):10757‐10769. [DOI] [PMC free article] [PubMed] [Google Scholar]
- 26. van de Vijver I, Ridderinkhof KR, Cohen MX. Frontal oscillatory dynamics predict feedback learning and action adjustment. J Cogn Neurosci. 2011;23(12):4106‐4121. [DOI] [PubMed] [Google Scholar]
- 27. Cohen MX. A neural microcircuit for cognitive conflict detection and signaling. Trends Neurosci. 2014;37(9):480‐490. [DOI] [PubMed] [Google Scholar]
- 28. Yabase M, Carino MA, Horita A. Cocaine produces cholinergically mediated analeptic and EEG arousal effects in rabbits and rats. Pharmacol Biochem Behav. 1990;37(2):375‐377. [DOI] [PubMed] [Google Scholar]
- 29. Volkow ND, Fowler JS, Wang GJ. The addicted human brain: insights from imaging studies. J Clin Invest. 2003;111(10):1444‐1451. [DOI] [PMC free article] [PubMed] [Google Scholar]
- 30. Sanna A, Fattore L, Badas P, Corona G, Cocco V, Diana M. Intermittent Theta Burst Stimulation of the Prefrontal Cortex in Cocaine Use Disorder: A Pilot Study. Front Neurosci. 2019;13:765‐775. [DOI] [PMC free article] [PubMed] [Google Scholar]
- 31. Rapinesi C, Del Casale A, Di Pietro S, et al. Add‐on high frequency deep transcranial magnetic stimulation (dTMS) to bilateral prefrontal cortex reduces cocaine craving in patients with cocaine use disorder. Neurosci Lett. 2016;629:43‐47. [DOI] [PubMed] [Google Scholar]
- 32. Steele VR, Maxwell AM, Ross TJ, Stein EA, Salmeron BJ. Accelerated Intermittent Theta‐Burst Stimulation as a Treatment for Cocaine Use Disorder: A Proof‐of‐Concept Study. Front Neurosci. 2019;13:1147‐1160. [DOI] [PMC free article] [PubMed] [Google Scholar]
- 33. Martinez D, Urban N, Grassetti A, et al. Transcranial Magnetic Stimulation of Medial Prefrontal and Cingulate Cortices Reduces Cocaine Self‐Administration: A Pilot Study. Front Psychiatry. 2018;9:80‐86. [DOI] [PMC free article] [PubMed] [Google Scholar]
- 34. Insanally MN, Carcea I, Field RE, et al. Spike‐timing‐dependent ensemble encoding by non‐classically responsive cortical neurons. Elife. 2019;8:1‐31. [DOI] [PMC free article] [PubMed] [Google Scholar]
- 35. Halladay LR, Kocharian A, Piantadosi PT, et al. Prefrontal Regulation of Punished Ethanol Self‐administration. Biol Psychiatry. 2020;87(11):967‐978. [DOI] [PMC free article] [PubMed] [Google Scholar]
Associated Data
This section collects any data citations, data availability statements, or supplementary materials included in this article.
Supplementary Materials
Figure S1. Local field potential activity around trial onset/offset and during the intertrial interval during extinction.
Figure S2. Local field potential activity during early extinction session halves, self‐administration and reinstatement.
Table S1. Single‐unit baseline firing and bursting rates during extinction. Baseline firing and bursting rates reported in Hz [mean ± SEM (number of units)]. In cells where there are two lines, the top line reflects all modulated units and the bottom line reflects only modulated units that increased firing in response to experimental events. Differences in n's between baseline firing and bursting rates within each group are due to the exclusion of statistical outliers. Kruskal‐Wallis test results are reported as H statistics, Mann–Whitney test results are reported as U statistics, and Wilcoxon matched‐pairs signed rank test results are reported as Z statistics. Outlined values, p < 0.10.
Table S2. Single‐unit baseline firing and bursting rates during self‐administration compared to early extinction. Baseline firing and bursting rates reported in Hz [mean ± SEM (number of units)]. In cells where there are two lines, the top line reflects all modulated units and the bottom line reflects only modulated units that increased firing in response to experimental events. Differences in n's between baseline firing and bursting rates within each group of units are due to the exclusion of statistical outliers. Mann–Whitney test results are reported as U statistics and Wilcoxon matched‐pairs signed rank test results are reported as Z statistics. Outlined values, p < 0.10.
Table S3. Single‐unit baseline firing and bursting rates during reinstatement compared to late extinction. Baseline firing and bursting rates reported in Hz [mean ± SEM (number of units)]. In cells where there are two lines, the top line reflects all modulated units and the bottom line reflects only modulated units that increased firing in response to experimental events. Differences in n's between baseline firing and bursting rates within each group of units are due to the exclusion of statistical outliers. Mann–Whitney test results are reported as U statistics and Wilcoxon matched‐pairs signed rank test results are reported as Z statistics. Outlined values, p < 0.10.
Data Availability Statement
The data that support the findings in this study are available from the corresponding author upon reasonable request.