Abstract
The global spread and continued evolution of SARS-CoV-2 has driven an unprecedented surge in viral genomic surveillance. Amplicon-based sequencing methods provide a sensitive, low-cost and rapid approach but suffer a high potential for contamination, which can undermine laboratory processes and results. This challenge will increase with the expanding global production of sequences across a variety of laboratories for epidemiological and clinical interpretation, as well in genomic surveillance of emerging diseases in future outbreaks. We present SDSI+AmpSeq, an approach which uses 96 synthetic DNA spike-ins (SDSIs) to track samples and detect inter-sample contamination throughout the sequencing workflow. We apply SDSIs to the ARTIC Consortium’s amplicon design, demonstrate their utility and efficiency in a real-time investigation of a suspected hospital cluster of SARS-CoV-2 cases and validate them across 6,676 diagnostic samples at multiple laboratories. We establish that SDSI+AmpSeq provides increased confidence in genomic data by detecting and correcting for relatively common, yet previously unobserved modes of error, including spillover and sample swaps, without impacting genome recovery.
Introduction
The COVID-19 pandemic has again demonstrated the crucial role of genomic sequencing in combatting infectious disease outbreaks globally. Monitoring the emergence of pathogens and the spread of variants of concern has become commonplace in government, academic, and private laboratories1,2. Genomics data provides insights into the diversity, evolution and transmission of a virus, a critical guide for public health interventions ranging from contact tracing, identifying cases of reinfection, or understanding the basis of resistance to clinical interventions3–6. Laboratories are now performing viral genomic sequencing on SARS-CoV-2 at an unprecedented scale7,8, highlighting the pressing need to ensure the integrity of genomes.
Multiplexed amplicon-based genome sequencing methods have accelerated the massive scale of SARS-CoV-2 genomic surveillance due to their improved sensitivity, cost, and speed over other, lower-amplification RNA sequencing approaches, such as unbiased metagenomic sequencing9. However, the risk for contamination during the amplification stage is especially high as the 35+ cycles of virus-specific PCR produces trillions of SARS-CoV-2 amplicons in a single reaction. Other high-risk modes of contamination, including sample swaps, cross-contamination of samples, or aerosolization, can occur throughout the sample processing pipeline. With many laboratories performing viral sequencing by processing multiple large batches in parallel, the potential for contamination increases10. Even small amounts of sample mixing or contaminating amplicons could potentially confound studies where detection is sensitive to tens of molecules10,11. Moreover, as SARS-CoV-2 has relatively low genetic diversity and often spreads in local outbreaks or clusters11,12, genomes are often identical at the consensus level11,15–17, a pattern that could also occur with contamination. The risk of contamination, and the challenges in detecting it, can confound a wide array of genomic analyses including estimates of the frequencies of variants, lineage dynamics, and transmission events. Additionally, methods to address the critical risk of sample processing errors in clinical sequencing could enable its use more widely in clinical decision making.
While inclusion of internal standards is commonplace in many experimental approaches13–15 and some technical assay controls exist for DNA sequencing16–18, the use of internal controls is currently rare in amplicon-based genomic surveillance. Here we developed and extensively tested a sample identification method using 96 synthetic DNA spike-ins (SDSIs) for amplicon-based sequencing approaches. Using the widely used open-access ARTIC tiled primer design (https://artic.network/), we implemented these SDSIs for SARS-CoV-2 genomic sequencing in thousands of residual diagnostic (clinical) samples. The resulting user-friendly and highly versatile SDSI+AmpSeq protocol can be easily implemented to improve the quality of genomic data generated for epidemiological and clinical investigations of human pathogens (Fig. 1 and Supplementary Data Table 1).
Figure 1. SDSI+AmpSeq Protocol.
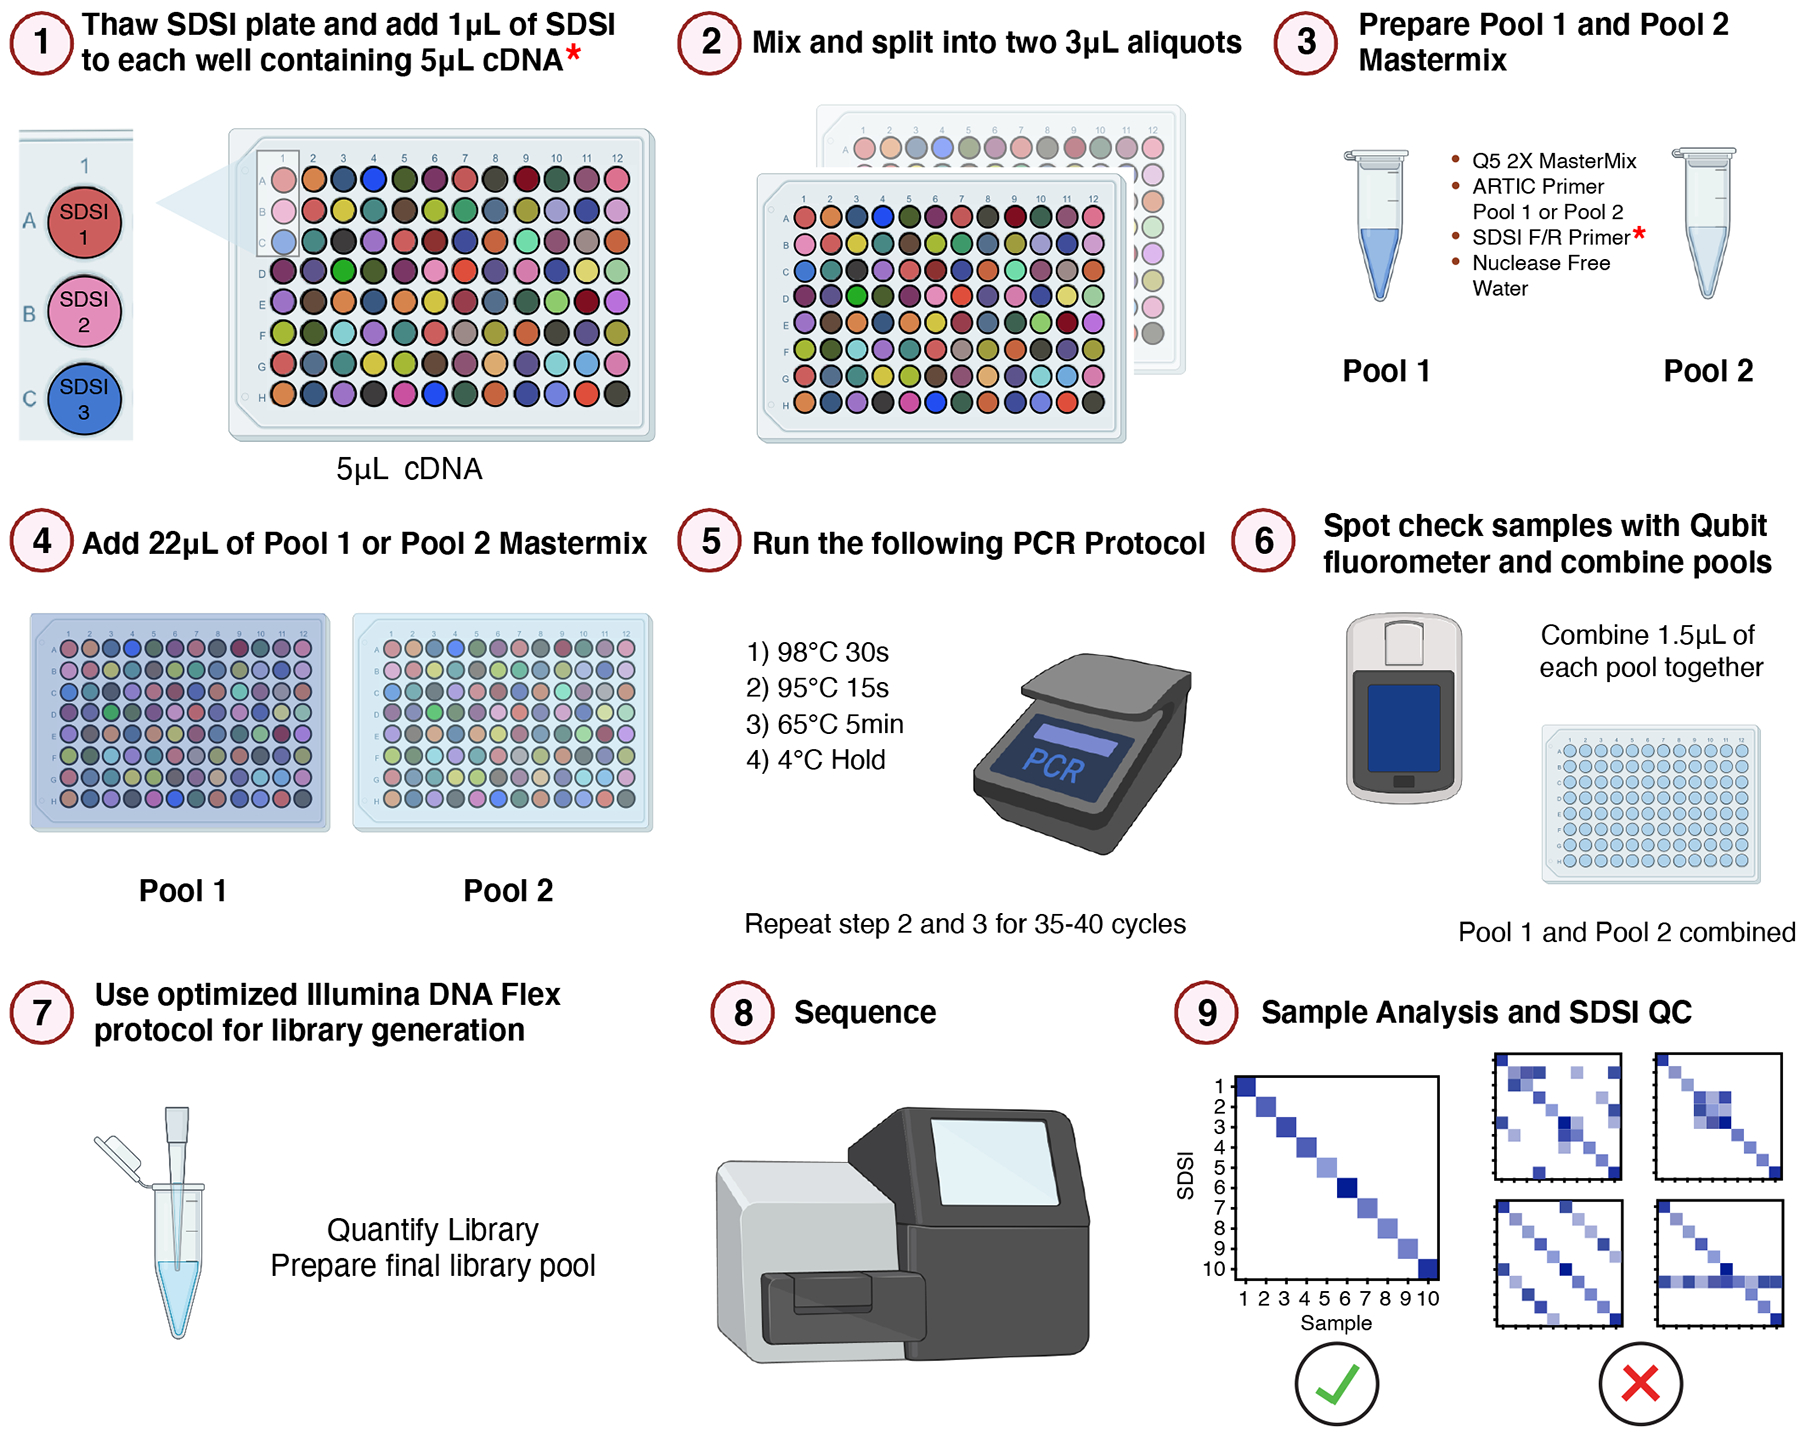
Illustrative workflow for 96 samples through the SDSI+AmpSeq amplicon-sequencing pipeline. A unique, synthetic DNA spike-in (SDSI) will be added to each cDNA sample to allow for contamination tracking and accurate sample identification in analysis. Asterisks indicate additional steps to the standard ARTIC pipeline.
Results
Design and characterization of SDSIs for amplicon sequencing
We designed a simple, flexible system for sample tracking and contamination tracing using a uniquely identifiable core DNA sequence flanked by constant priming regions satisfying several design requirements. This design allows in-sample tracking through the addition of a different SDSI to each sample during sample processing. Following sequencing, the data can be analyzed for both the presence of the expected or any other SDSI, illuminating sample misassignment or contamination with high resolution and accuracy (Fig. 1). Our design focused on highly stable DNA oligos that could be added to sample cDNA to capture contamination at or after the critical viral amplification step, including contamination generated during amplification and in handling amplified material. In contrast to a short barcode system, SDSIs are compatible with both tagmentation and ligation-based sequencing approaches18. The constant priming regions mean that only a single primer pair needs to be added into the existing multiplexed PCR step to co-amplify all SDSIs with the primary reaction target(s) (Fig. 2a).
Figure 2. Synthetic DNA oligos spiked into amp-seq reactions designed to flag contamination and sample swaps.
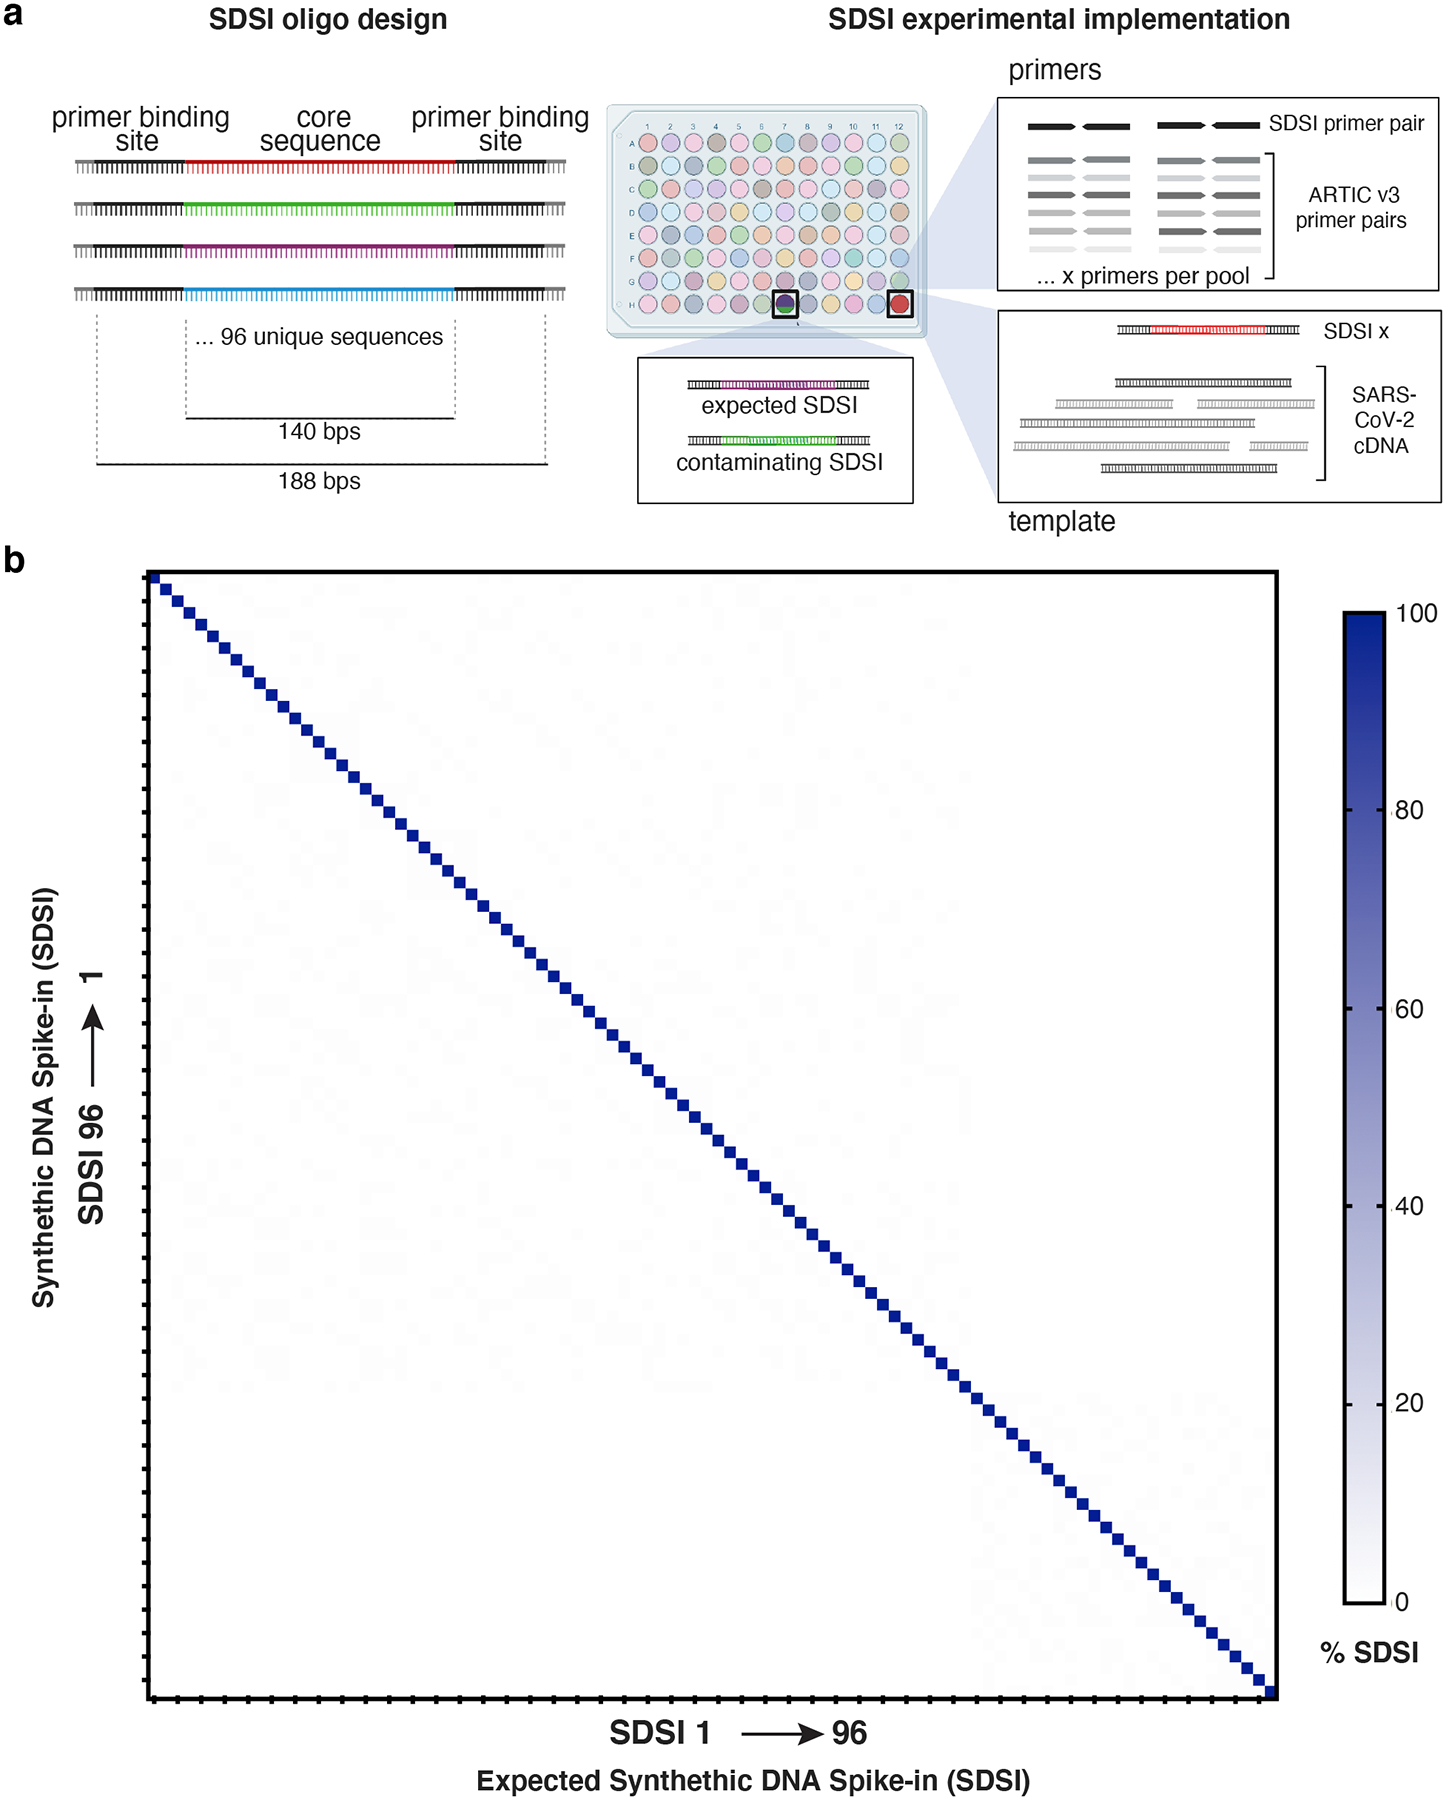
a, Schematic of SDSI design. Each oligo contains 140 bp of unique sequence flanked by common primer binding sites. Primers designed to amplify all SDSIs are added to ARTIC primer pools, and a unique SDSI is added to each clinical sample. Identification of multiple SDSIs in the same sample indicates contamination. b, Percent of SDSI reads mapping for each of the 96 SDSIs (horizontal axis) were quantified for each of the 96 SDSIs (vertical axis). Any off-diagonal signal would indicate non-specific identification of SDSIs.
The core portion of each SDSI constitutes 96 distinct DNA sequences from the genomes of diverse, uncommon archaea, precluding false detection and cross-identification (Supplementary Data File 1, Methods). By using extremophilic archaea, our designs maximized evolutionary distance from common human pathogens. To avoid false positive results the core SDSI sequences should be sufficiently distinct from one another, as well as sequences commonly found in laboratories and clinical samples. A permissive BLASTn search performed against the entire NCBI database confirmed that the SDSI core sequences had limited homology outside the domain archaea, specifically to genera unlikely to be found in laboratories (Extended Data Fig. 1a). While this limited homology outside of the domain archaea maximized the potential for broad applications, we also confirmed that none of the core sequences shared significant homology (>90% identity over 50 bps) with Homo sapiens or known viral genomes (Methods). Similarly, we confirmed that all SDSIs were significantly different from each other to prevent misidentification (Extended Data Fig. 1b). Sequencing of the SDSIs confirmed that each of the 96 constructs resulted in a robust and specific signal of mapped reads (Fig. 2b).
We selected a pair of primers and priming regions that are highly specific and show reliable amplification across SDSIs and under standard PCR conditions. Using Primer-BLAST, we predicted that these sequences had limited homology to common organisms and thus were unlikely to amplify off-target sequences. Experimentally we confirmed that the SDSI primers did not produce any nonspecific amplification, including in the presence of cDNA from a nasopharyngeal (NP) swab sample (Extended Data Fig. 2a). The primer pair also had a common length (24 bps), GC content (45.8%), and melting temperature (62°C and 63°C, respectively in our SDSI+AmpSeq protocol), ensuring their compatibility with many multiplexed PCR reactions, including the most widely used SARS-CoV-2 amplicon sequencing strategy (https://artic.network/) (Extended Data Fig. 2b). Each SDSI was identically sized, shared a priming region, and had similar GC content (range: 33–65%) to promote similar amplification rates across different SDSIs and to viral amplicons (e.g., SARS-CoV-2 genome is 37±5% GC)19 (Extended Data Fig. 2c). All SDSIs amplified in an ARTIC SARS-CoV-2 PCR reaction with SDSI primers included, in each case yielding a single clean product of the expected size (Extended Data Fig. 2d). Furthermore, we observed that GC content did not significantly bias the number of SDSI reads detected in clinical samples (Extended Data Fig. 2e).
Validation of an SDSI+AmpSeq SARS-CoV-2 sequencing approach
The addition of SDSIs into the ARTIC PCR did not detrimentally alter SARS-CoV-2 cDNA amplification from clinical samples. To prevent SDSIs from overtaking the amplification and sequencing of SARS-CoV-2 amplicons, we titrated the amount of SDSI added to the reaction. We found that the highest concentration tested, 600 copies/μL, resulted in reliable SDSI detection with >96% of reads mapping to SARS-CoV-2 and no apparent alteration in coverage across the genome (Extended Data Fig. 3a,b). We assessed the specificity of the 96 SDSIs in clinical samples to confirm there was no unpredicted cross-mapping, misidentification, or significant differences in amplification rate (Fig. 3a). We processed 14 samples, spanning a range of CT values (CT range = 25–33), with both the standard ARTIC and SDSI+AmpSeq methods. For each amplicon, across all samples, there was no significant difference in coverage between the ARTIC and SDSI+AmpSeq conditions (Fig. 3b). Even in samples with low viral loads (CT>30), we found that there were no significant differences in amplicon coverage (Extended Data Fig. 4a). Additionally, within the 14 samples processed +/− SDSI, we see a 100% genome concordance rate illustrating the addition of the SDSIs does not impact the accuracy of assembled genomes.
Figure 3. SDSI+AmpSeq amplicon coverage and genome concordance.
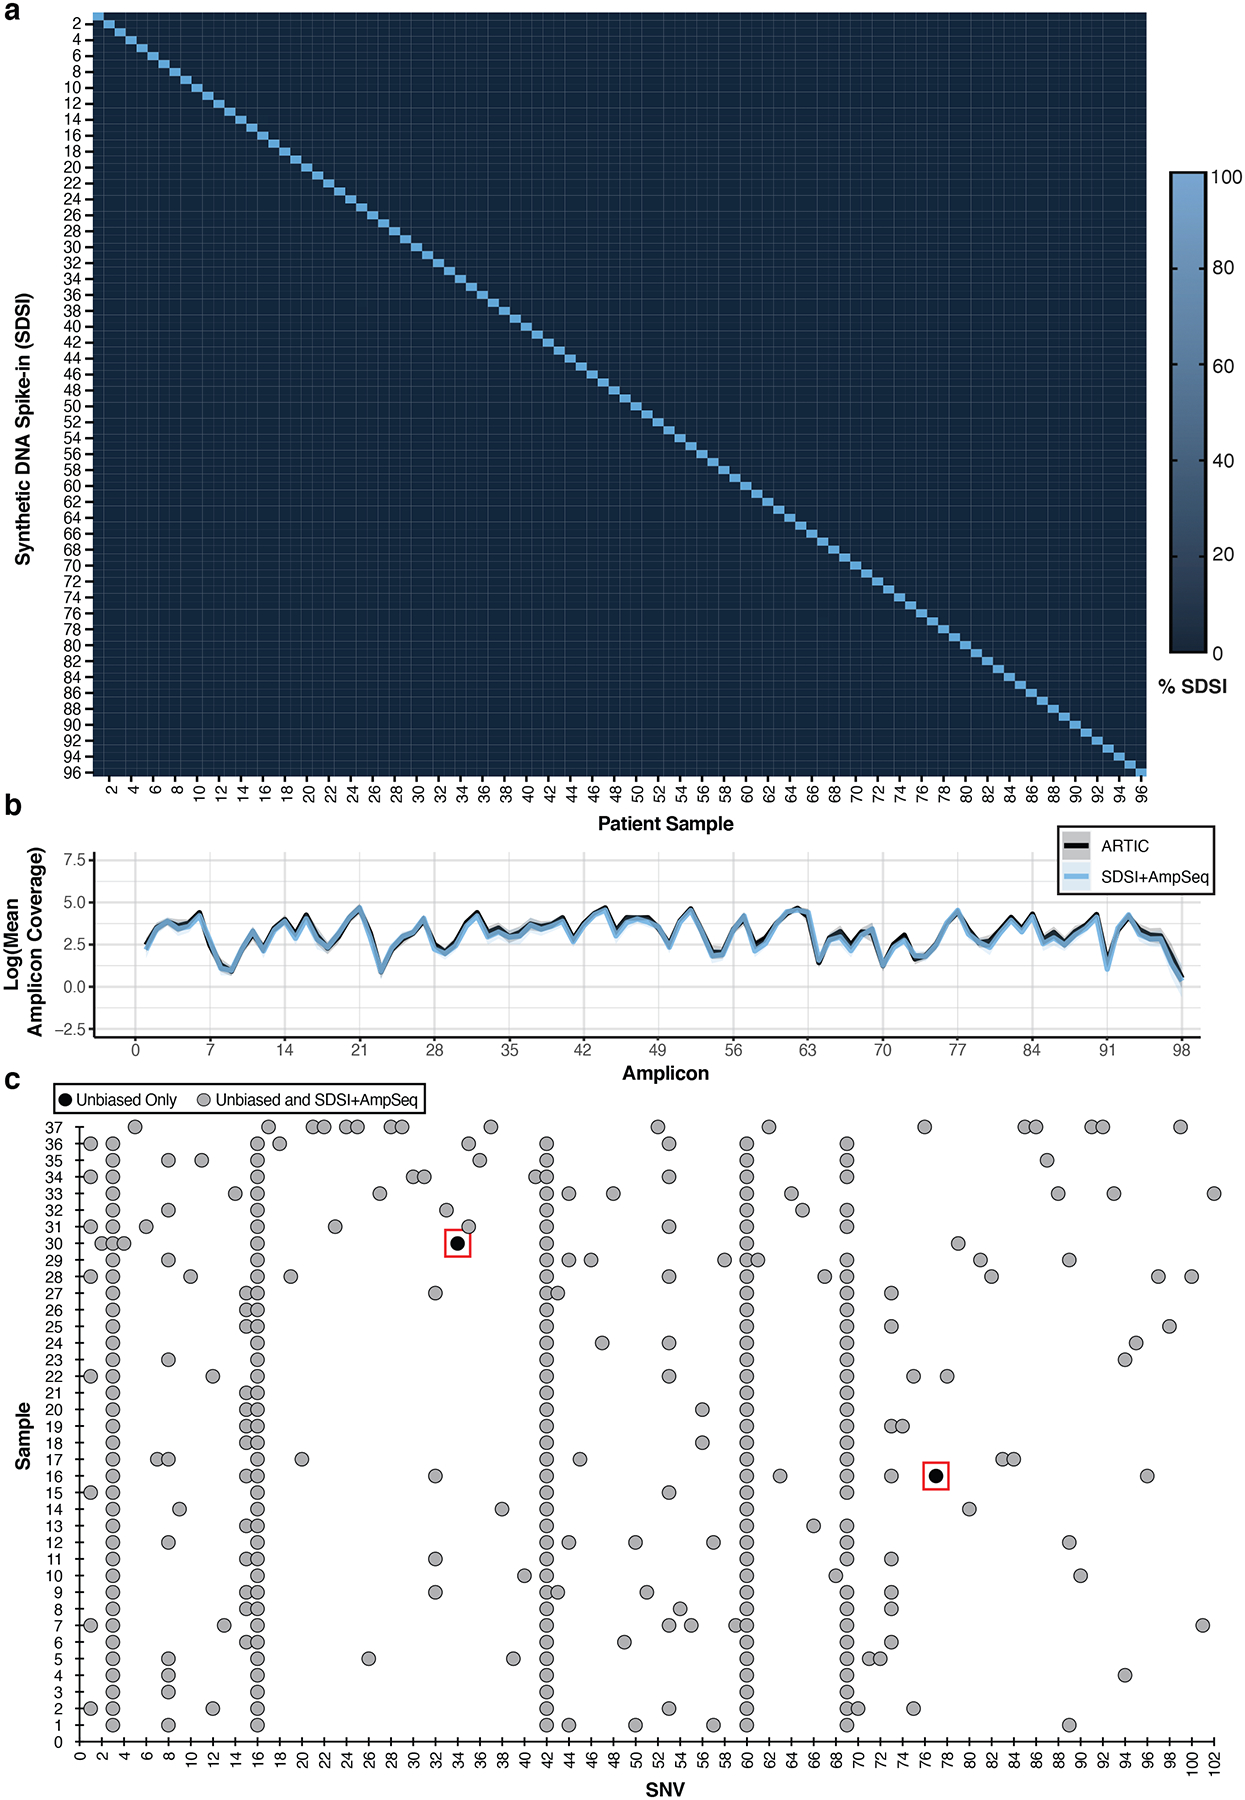
a, Percent of SDSI for SDSI 1–96 in patient samples. b, Log of the mean amplicon coverage for the same clinical samples run with and without an SDSI (n=14). A unique SDSI was used in each sample. The solid blue line represents SDSI+AmpSeq and the solid black line is ARTIC only with no SDSI. Blue and black shading around the solid lines represents the 95% confidence interval. There were no statistical differences (p-value > 0.05) in the mean amplicon coverage for each amplicon between the groups (two-tailed Mann Whitney t-test and multiple comparison two-stage step-up Benjamini, Krieger, and Yekutieli test with FDR set to 5%). c, SNV concordance plot between SDSI+AmpSeq and unbiased consensus sequences. Two discordant SNVs, outlined in a red box, were found. Blue dots represent SNVs found in both the unbiased and SDSI+AmpSeq method, whereas black dots indicate the SNV was only present in unbiased.
As extensive PCR can result in the propagation of numerous types of errors, such as DNA polymerase base substitution errors, PCR recombination events, and thermocycling induced DNA damage, we further compared SARS-CoV-2 genome concordance between SDSI+AmpSeq and unbiased, metagenomic sequencing on a batch of 89 unique patient samples9,10,20,21. The samples consisted of diverse viral lineages and loads (CT range = 11.9–37.4) with the more sensitive amplicon sequencing method generating more complete genomes at higher CTs (Extended Data Fig. 5a–d). We assessed the coverage uniformity, as increasing uniformity reduces the sequencing depth required to generate reliable genomes22. We found that unbiased sequencing had more uniform coverage up to a CT of 25 (n=31, Gini Coefficient = 0.240 ± 0.046 (unbiased) vs 0.428 ± 0.026 (SDSI+AmpSeq)), while SDSI+AmpSeq generated more uniform coverage for samples above a CT of 25 (n=39, Gini Coefficient = 0.766 ± 0.265 (unbiased) vs 0.554 ± 0.124 (SDSI+AmpSeq)) (Extended Data Fig. 5e). For the 37 samples that assembled a full genome in both methods, only two out of 332 total single nucleotide variants (SNVs) were divergently identified by SDSI+AmpSeq (Fig. 3c). Each SNV was observed in only one sample and both fell within an ARTIC primer region, despite primer trimming during analysis; for one SNV this suggests that PCR error from the ARTIC protocol contributed to the discrepancy23, whereas manual inspection of the other (C9565T) indicated the presence of intra-host variation in both methods with a variant allele frequency of 39.4% (SDSI+AmpSeq) and 59.2% (unbiased sequencing). Overall, the discordance SNV calling rate was 0.6%, consistent with observed circulating diversity and sequencing based errors. Consistent with previous reports from other groups, ARTIC amplicon sequencing maintains a high level of concordance at the consensus genome level10, even with the addition of SDSIs.
Figure 5. SDSI+AmpSeq is used to identify sample swaps and contamination.
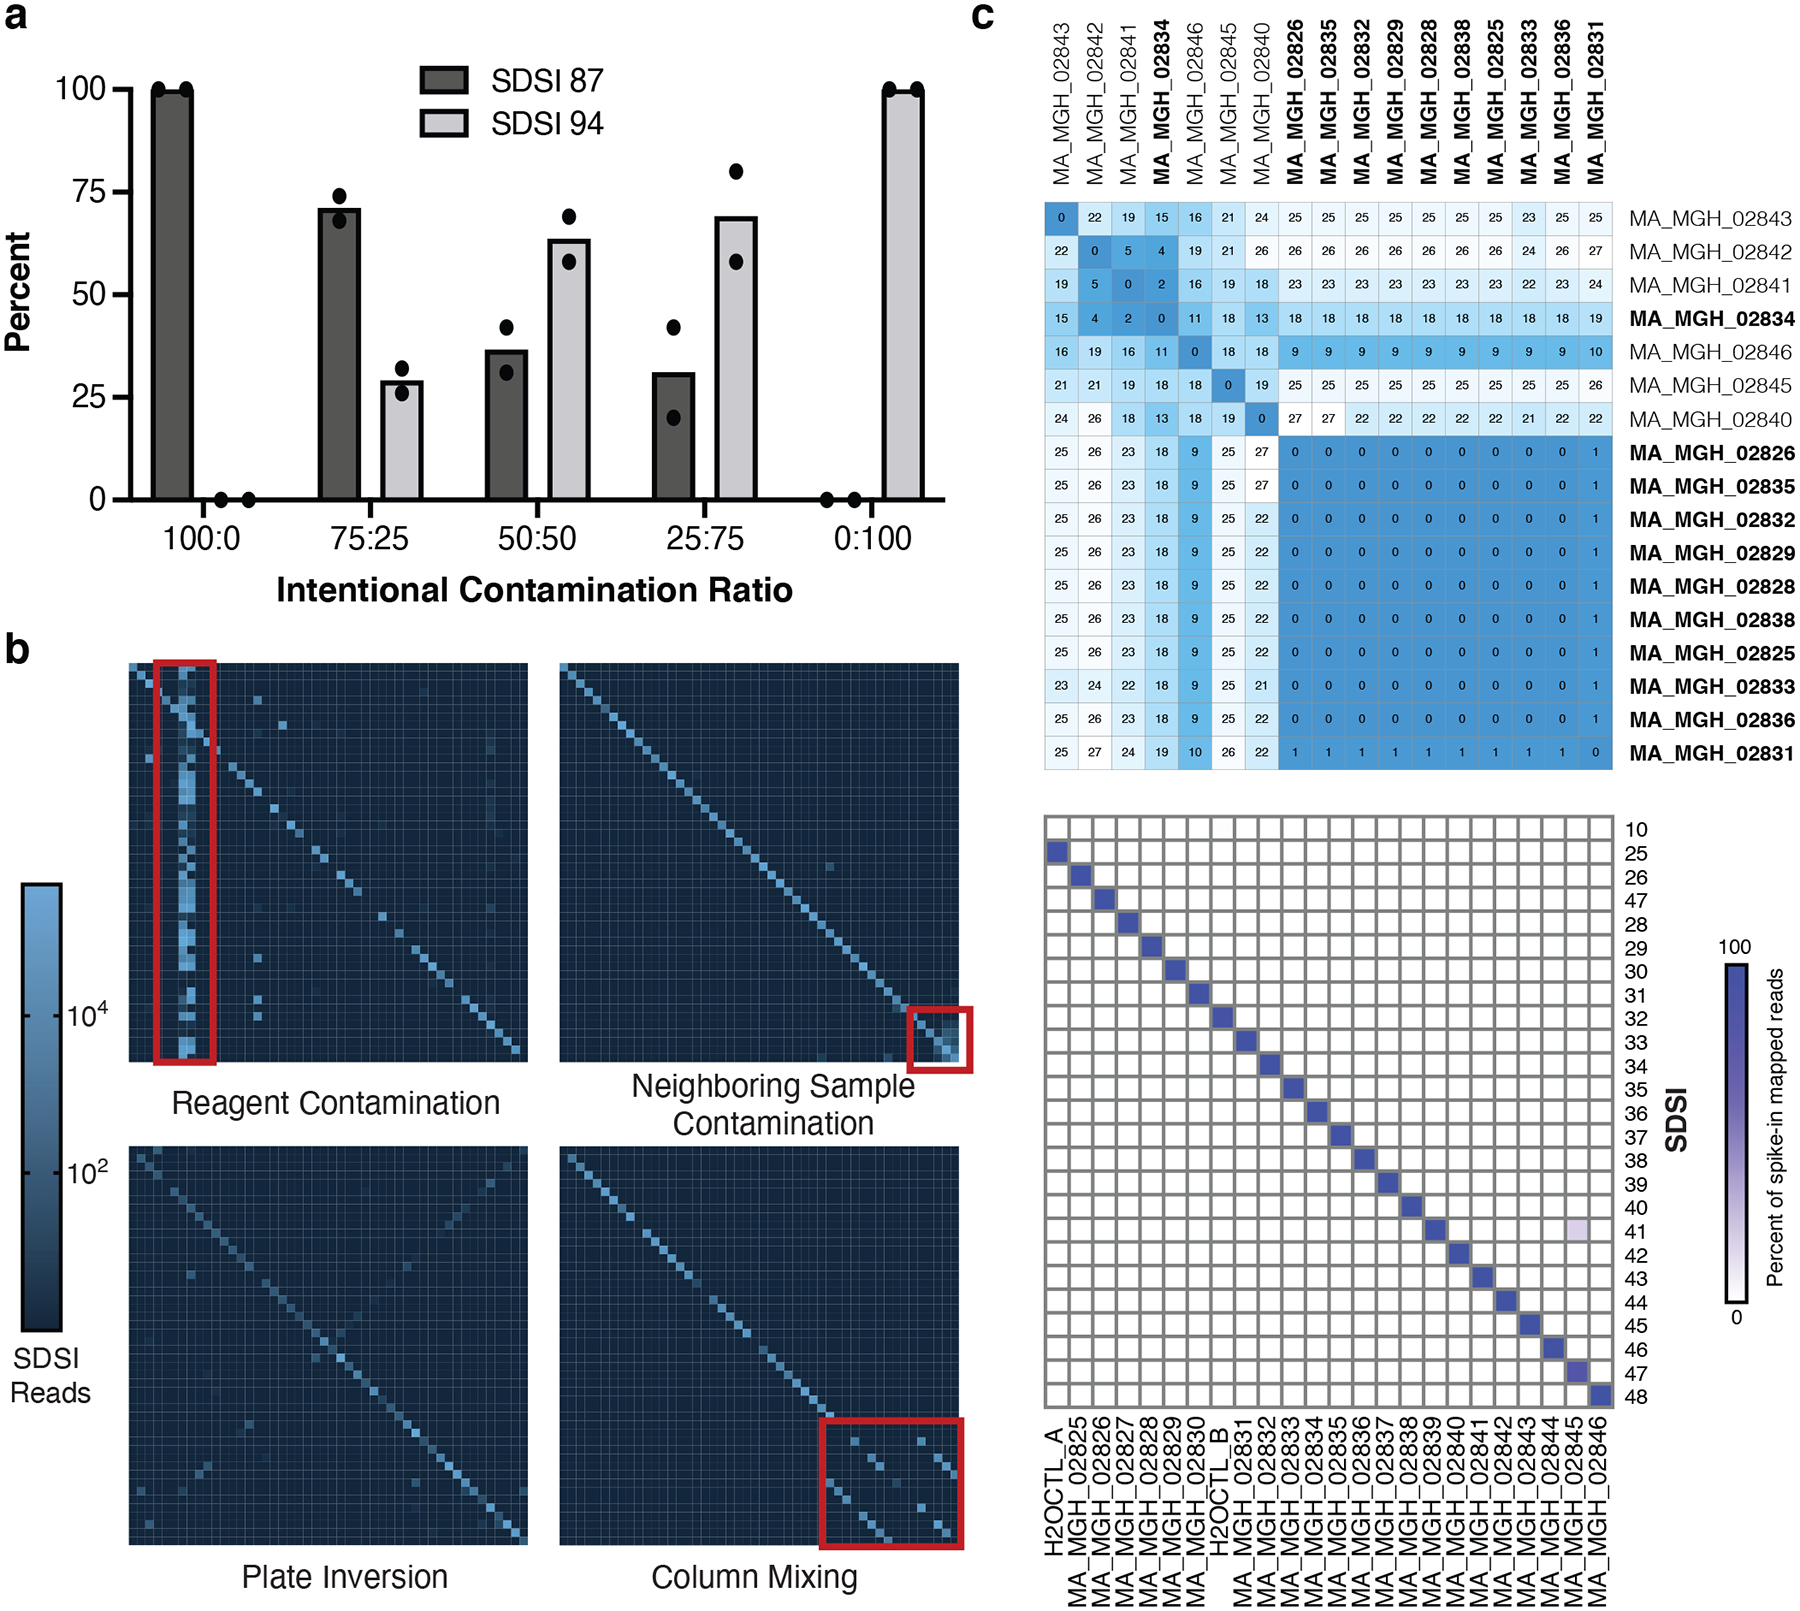
a, Intentional SDSI contamination experiment (run in duplicate) assessing if different ratios of contamination between SDSI 87 and SDSI 94 (SDSI 87:SDSI 94) were detectable with the SDSI+AmpSeq method. b, Examples of experimental errors that were caught using the SDSI+AmpSeq method. c, Top: Distance matrix showing pairwise differences between the 17 complete genomes assembled from this sample set. Putative cluster samples are bolded. Bottom: Spike-in counts for each of the 24 samples and water controls in this sequencing batch.
We explored other technical modifications to the ARTIC amplicon sequencing protocol in order to improve genome recovery, limit contamination points, and enhance reproducibility of our SDSI approach. Foremost, increasing cDNA length by use of more processive reverse transcriptases improved amplicon coverage (Extended Data Fig. 6a,b). Amplification of ARTIC amplicons and SDSIs by Q5 Hot Start High-Fidelity 2x Master Mix resulted in higher amplification (Extended Data Fig. 6c and Supplementary Data Table 2). We found that increasing (2X) primer concentrations (20.8nM final) for poorly performing amplicons increased coverage in these amplicons, even enabling whole genome recovery for multiple samples, supporting that primer rebalancing can enable greater coverage24,25 (Extended Data Figs. 6d and 7 and Supplementary Data Table 3). We explored the effects of different numbers of PCR cycles, DNA-hybridization steps, and temperature ramp speeds. Both DNA-hybridization steps and temperature ramping provided no significant changes in amplification (Extended Data Fig. 6e,f). Additional PCR cycles can increase genome coverage uniformity of low viral load samples, although it may lead to increased erroneous SNV calls23 (Extended Data Fig. 6g). Using a standardized cDNA input, we found the DNA Flex library workflow resulted in increased genome coverage depth across all CT values tested, compared to Nextera XT (Extended Data Fig. 6h). To further mitigate the risk of contamination from highly amplified libraries, we took advantage of the self-normalizing feature of the DNA flex kit and found that limiting the tagmentation beads by scaling down (.5X) all components of the DNA Flex library construction reagents restricted library over-amplification. Notably, this did not impact final library size distributions or SDSI amplification, while generating final sequencing libraries at half their original concentrations and halving the library construction cost per sample (Methods, Supplementary Data Table 4). We summarized the results of our optimizations (https://benchling.com/s/prt-R95g0tCxKOeCAqn8lAk3); and show that SDSIs can be easily integrated with numerous protocol alterations.
Implementation of SDSIs to clinical samples at scale
The SDSI+AmpSeq method is compatible with a range of viral CTs, SARS-CoV-2 lineages, origin of the patient sample, and laboratory in which the pipeline is implemented, demonstrating this is a robust and flexible approach that can be readily implemented for surveillance. A half plate of SDSIs were used at two large-scale sequencing facilities, the Broad Institute and Jackson Laboratories (JAX), for SDSI+AmpSeq SARS-CoV-2 surveillance across a total of 6,676 clinical samples and controls (JAX: n=3,773; Broad: n=2,903). Individual batches typically consisted of 92 clinical samples with 4 designated water controls. Clinical samples were largely from Maine, Massachusetts, and Rhode Island from December 2020 to July 2021 and covered a wide range of viral CT values (CT 8.4–39.9) and pango lineages (77 total lineages) (Fig. 4a). The SDSI+AmpSeq method worked robustly despite minor implementation differences in protocols between the two laboratories including different cDNA synthesis enzymes, CT normalization, and library construction approaches (0.5X Illumina DNA Flex vs Illumina COVID-Seq) (Methods).
Figure 4. SDSI+AmpSeq performs well across thousands of samples.
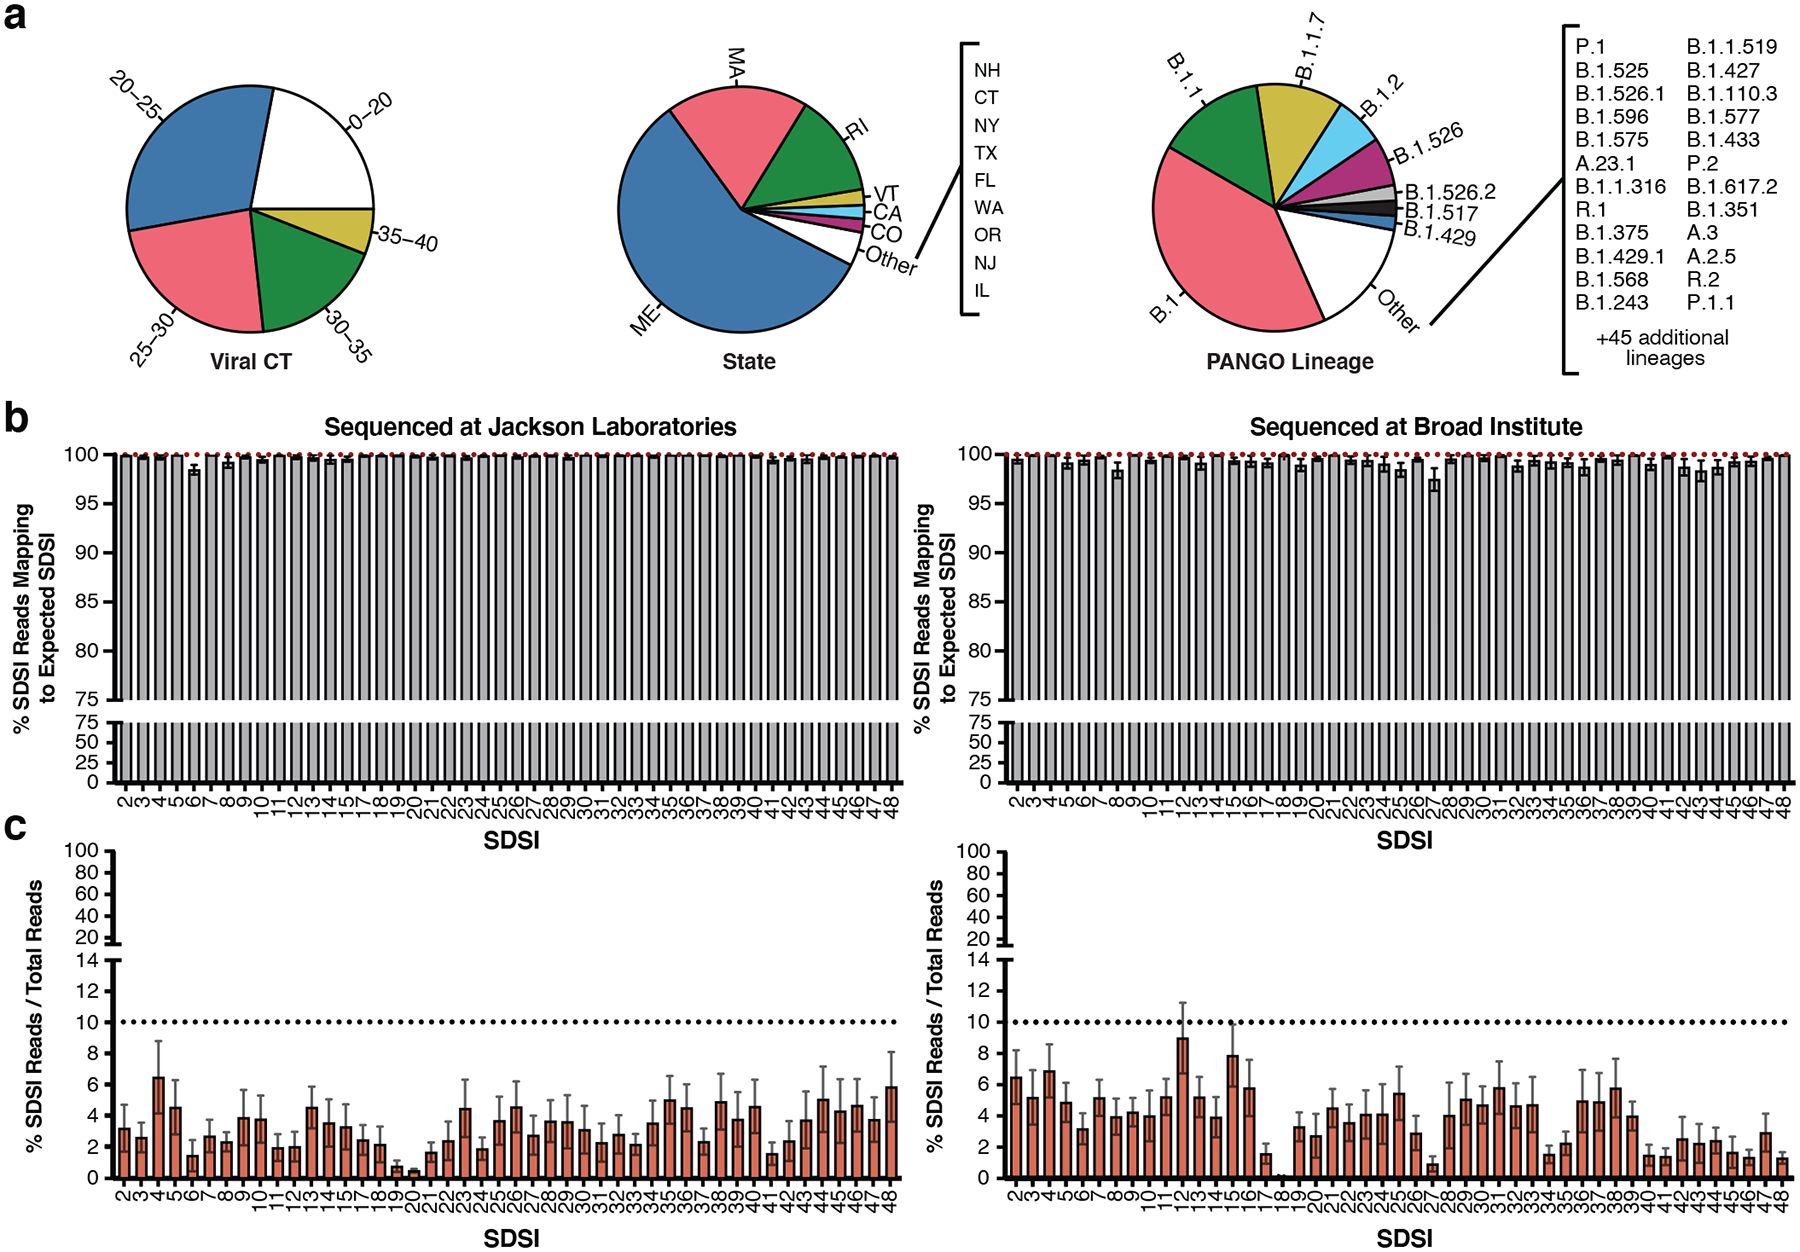
a, Sample diversity from two different institutions representing a range of CTs, viral lineages, and states of sample collection from samples where the data was available. b, The percent of SDSI reads out of the sum of all SDSI reads that map to the correct spike-in (Left: JAX, n=3,773 biologically independent samples, Right: Broad, n=2,903 biologically independent samples). Data are presented as mean values +/− SEM. Individual data points are displayed when n ≤ 10. c, The percent of SDSI reads over the total of all sequenced reads for all SARS-CoV-2 positive samples (Left: JAX, n=3,045 biologically independent samples, Right: Broad, n=2,670 biologically independent samples). Data are presented as mean values +/− SEM. Individual data points are displayed when n ≤ 10.
SDSI+AmpSeq is a tractable and easily-implemented method for genome quality control when applied to high-throughput processing of clinical samples. Across thousands of clinical samples, the SDSIs performed consistently and reliably (Fig. 4b,c). The mean percentage of SDSI reads that mapped to the expected SDSI was above 95% for all SDSIs in both laboratories (Fig. 4b). This demonstrated that across a large set of highly variable clinical samples, there were no systemic issues of misidentification for specific SDSIs. Additionally, across 5,715 samples from both institutions, the percentage of all SDSI reads in SARS-CoV-2 positive samples averaged 3.72% (90% of samples fell between 0.0003–9.9887%) (Fig. 4c). Importantly, this low, but consistent percentage of reads mapping to SDSIs allows for their implementation without necessitating increased sequencing depth. Notably, the SDSIs performed well with and without prior normalization of cDNA based on CT, however normalizing did increase the percentage of SDSI reads (Extended Data Fig. 4b, Fig. 4b left and Methods). Normalization of viral CT may provide an additional level of quality control that is especially important for labs with limited sequencing capacities.
Confident genome sequencing and analysis with SDSI+AmpSeq
SDSIs enable detection of sample swaps and contamination events that occur in large scale batch processing which may otherwise go undetected. To demonstrate that SDSI+AmpSeq can accurately detect contamination, we mixed two SDSIs at various ratios prior to the ARTIC PCR and found that SDSI ratios were reflected in the sequencing output (Fig. 5a). Across 6,676 SARS-CoV-2 samples processed in large batches, SDSIs allowed for identification of multiple key modes of error (Fig. 5b). As plotted, a plate without contaminating events or sample swaps should display a simple diagonal pattern with 1–1 matching of expected and observed SDSIs. In some cases, off-diagonal events occur in clear patterns, enabling speculation on the nature of the contamination, demonstrating the utility of SDSIs as an internal control and in-sample label. We observed cases where a plate was accidentally inverted when the post-PCR reaction pool 1 was mixed with pool 2 (Fig. 5b). SDSI+AmpSeq detects entire flawed batches that may not have been flagged with standard controls (as in the case with the plate inversion where water controls in plate corners would not have been affected). In another example, SDSIs were detected unexpectedly throughout a batch, indicating that an SDSI (and possibly SARS-CoV-2) contaminated a common reagent.
SDSI+AmpSeq also enables fine-resolution insight into sample processing errors with high specificity. In one example, SDSI counts indicated columns were unintentionally mixed together (Fig. 5b). Here, in-sample labeling allowed researchers to confidently move forward with analyses on unaffected samples. In other cases, samples are associated with both the expected SDSI and SDSIs from neighboring samples, indicating potential spillover or pipetting errors. Again, genomes generated from samples with suspicious SDSI profiles can be investigated further, and removed from analyses and/or reprocessed. We recommend manual curation of genomes assembled from any samples with <95% of SDSI reads mapping to the expected SDSI. This level of impurity is likely attributable to sample processing contamination, given minimal baseline crosstalk from sources like indexing primer or oligo synthesis observed (Methods and Extended Data Fig. 8). Moreover, these patterns of contamination events identified via use of SDSI+AmpSeq illuminated key sources of error in processing pipelines and provided an opportunity to improve processing fidelity in subsequent batches.
To demonstrate SDSIs ability to enable confident interpretation of sequencing data in an outbreak investigation, we used SDSI+AmpSeq to investigate a putative SARS-CoV-2 cluster from Massachusetts General Hospital (MGH). The Infection Control Unit suspected nosocomial transmission, yet sample swaps and contamination could easily undermine findings. We sequenced 24 samples with SDSI+AmpSeq (including 14 suspected cluster-related samples, 8 unlinked contextual controls, and 2 water controls). Out of 11 assembled genomes that were suspected to be part of the cluster, 10 were genetically highly similar (0–1 consensus nucleotide difference) (Fig. 5c) and distinct from other samples from Massachusetts around the same time (Extended Data Fig. 9), strongly suggesting that this cluster arose from nosocomial transmission. Analysis of the SDSIs confirmed that genome sequence similarity among cluster-associated samples was not the result of cross-contamination (Fig. 5c). Indeed, 23/24 libraries contained >95% SDSI-mapped reads corresponding to the expected SDSI. One sample that was not part of the cluster (MA_MGH_02845) showed 18% of reads from a second SDSI, which was added to a different sample in the batch (MA_MGH_02839). We resequenced both samples implicated in the contamination event. We confirmed that the two genome sequences for MA_MGH_02845 were 100% concordant, and no genome was assembled for MA_MGH_02839 in either attempt, likely due to its very low viral load (CT = 37). This example illustrates how SDSIs can be used to isolate and validate only those samples implicated in contamination events and altogether increase confidence in cluster investigations.
To further increase our ability to comprehensively identify sources of error in AmpSeq methods for viral genomics, we sought to capture contamination and sample swaps that might occur before cDNA synthesis. We explored the feasibility of modifying the SDSI approach to use synthetic RNA spike-ins (SRSIs) from the same constructs, which could be added to clinical sample RNA. For a subset of SDSIs, we included a T7 promoter site to produce RNAs in-vitro. For two clinical samples representing low (20) and mid (26) CTs, we detected reads from the SRSIs added directly to extracted viral RNA as a proof-of-principle (Extended Data Fig. 10). Notably, this approach did not require any additional protocol modifications, and we therefore expect it to be a highly versatile and user-friendly method when deployed at scale for complete end-to-end sample tracking.
Discussion
Amplicon-based sequencing methods enable rapid, full genome recovery for emerging SARS-CoV-2 variant surveillance, however, robust tools are needed to ensure accuracy in genomic data. SDSI+AmpSeq is an invaluable technique for detecting key modes of contamination, addressing this critical gap in standard controls and practices. SDSIs do not compromise genome quality, have been successfully deployed in thousands of clinical samples, and are in use across multiple laboratories with differing protocols. These SDSIs revealed numerous instances of sample swaps and contamination, many of which would go unnoticed with standard batch-level controls. SDSIs further provide critical confidence in the interpretation of clusters of identical genomes, a renewed challenge in the surveillance of more transmissible variants. The common primer design enables SDSI’s applicability to multiple short amplicon designs and sequencing strategies, adding only minor changes to existing protocols and minimal additional cost.
SDSIs overcome multiple modes of error in the production of amplicon-based genomic sequencing data, and are a critical component of quality control measures. The approach is most effective when adopted fully within a laboratory setting and thus we propose routine use of the SDSI+AmpSeq method to flag laboratory-wide contamination. We provide an extensively tested protocol with ARTIC v3 and Illumina-based tagmentation. It can also be applied to other sequencing pipelines, though this potentially requires further optimization. Our pathogen-exclusion design criteria allows our 96 validated SDSIs to be immediately incorporated into other tiled amplicon panels, such as existing ones for Zika, Ebola, and other viruses of epidemic potential26,27.
The SDSI-labeling paradigm is broadly applicable to many amplicon-based needs: amenable to various technical enhancements, flexible to remaining error modes, and expandable to additional targets. One could apply the same design parameters to expand the set of SDSIs, such as to 384 well formats. To design larger panels of SDSIs, one could use artificial core sequences, rather than excerpting from archaea. Primer sites could also be easily adapted for integration with new advancements in amplicon sequencing, like tailed primer approaches or new primer schemes28–32. In its current implementation, our SDSIs detect contamination or workflow errors that occur during and after amplification, but not issues arising at the RNA or cDNA generation stage. While we expect DNA spike-ins would be more robust to variation in samples and protocols and are applicable to both RNA and DNA viruses, further refinement of the RNA spike-in approach could address other modes of contamination, enabling end-to-end sample tracking for RNA viruses at scale. Specifically, SRSIs could improve tracking high viral load samples that are more likely to have well to well contamination than low viral load samples. Future work improving quantification and SDSI analysis pipelines may enable them to serve as within-sample controls, since samples or batches with outlier SDSI read counts may reveal experimental error.
The integration of SDSIs can mitigate a critical vulnerability of amplicon-based sequencing while preserving the many advantages, increasing the robustness of its use across laboratory and clinical settings. Adoption of controls across the viral surveillance community would increase accuracy and integrity of genomic data worldwide. Looking forward, SDSIs could serve as a crucial component in improving data integrity in amplicon based genomic sequencing beyond infectious disease surveillance, such as food safety, species identification and environmental sampling.
Methods
We have provided our SDSI implementation protocol on Benchling in addition to the detailed methods below: https://benchling.com/s/prt-R95g0tCxKOeCAqn8lAk3
Sample collection and study design
Research was conducted at the Broad Institute with an exempt determination from the Broad Office of Research Subjects Protections and with approval from the MIT Institutional Review Board under protocol #1612793224. Samples were obtained from Massachusetts General Hospital (MGH), Massachusetts Department of Public Health, the Rhode Island Department of Public Health and the Broad Institute Clinical Research Sequencing Platform. Samples from Massachusetts General Hospital (MGH) fall under Partners Institutional Review Board under protocol #2019P003305. Samples were secondary-use or residual clinical and diagnostic specimens (referred to collectively throughout as clinical samples), obtained by researchers under a waiver of consent. All samples were nasopharyngeal or anterior nares swabs in a stabilizing medium (e.g.Molecular Transport Media (MTM), Viral Transport Media (VTM) or Universal Transport Media (UTM)). These unique biological materials are not available to other researchers as they are human patient samples from clinical excess material and thus are of limited volume. Samples sequenced at Jackson Laboratories (JAX) were approved under protocol 2020-NHSR-019-BH.
SDSI design and in silico validation
We designed synthetic DNA fragments that each contained a 140 bp unique sequence and constant priming regions. Core SDSI sequence homology to sequences from various organisms was predicted by a permissive BLAST search (blastn; 5000 max targets; E=10; word size=11; no mask for low complexity). We considered homologies identified with this BLASTn search described above that were additionally >50 bps (>35% query cover) and >90% sequence identity to be significant homologies. For all 96 selected SDSIs, there were no such significant homologies when results were filtered to all Homo sapiens (taxid:9606) or viral (taxid:10239) sequences in the NCBI database. For significant homologies to bacterial or eukaryotic sequences in the NCBI database (excluding archaea: taxid:2157), we report both the SDSI and the genus it mapped to in each case (Extended Data Fig. 1a). Using the same BLASTn (BLASTN 2.12.0+) parameters, we also mapped SDSIs against a custom database including SDSI core sequences, and found no significant homologies between SDSIs. As there were no significant homologies between SDSIs and human, virus, or other SDSI sequences, we noted the maximum alignment scores for any non-significant homology identified, and reported these (Extended Data Fig. 1b).
We confirmed that SDSI primers and amplicons were predicted to amplify specifically and consistently with ARTIC v3 amplicons. We used Primer-BLAST to predict 50–5000 bp amplicons produced on templates in the entire nonredundant (nr) nucleotide database; no amplicons were identified. We calculated the length and GC content of SDSI primers and full SDSI amplicon sequences and ARTIC v3 primers and amplicons using Geneious Prime (2019.2.1) and compared their distributions (Extended Data Fig. 2b,c). ARTIC and SDSI primer melting temperatures were matched and calculated using the New England Biolabs online calculator (version 1.13.0; https://tmcalculator.neb.com).
SDSI experimental validation
We sought to validate in silico predictions for the performance of our SDSI primers and amplicons. We ordered primers (IDT) (oligo sequences in Supplementary Data File 1) and performed qPCR using the Q5 Hotstart 2x Mastermix, with 500nM SDSI primers and 0.17X SYBR Gold (ThermoFisher # S11494), and without ARTIC primer pools. We performed this assay in triplicate in 10μL reactions on a QuantStudio 6 with the following cycling conditions: 95°C for 30 seconds, followed by 35 cycles of 95°C for 15 seconds and 65°C for 5 minutes. We tested 4 conditions: (1) 0.5μL of an SDSI gene block (IDT) (1pM), (2) 0.5μL of an SDSI gene block + 0.5μL of cDNA from an NP swab, (3) 0.5μL of cDNA from an NP swab, and (4) no template to detect any nonspecific amplification of the primers (Extended Data Fig. 2a). We performed PCR on each SDSI oligo, using the standard SDSI+AmpSeq PCR conditions (https://benchling.com/s/prt-R95g0tCxKOeCAqn8lAk3), then ran the PCR products on a 2.2% agarose gel to confirm that these primers amplified the SDSIs and that the product was clean and of the expected size (Extended Data Fig. 2d).
We ordered unique oligos as TruGrade ultramers (IDT), then resuspended and stored them at 10μM in water (oligo sequences in Supplementary Data File 1). Further characterization for identification of 96 SDSIs was achieved by direct PCR amplification with primers containing the constant SDSI handle and an Illumina P5/P7 adapter followed by sequencing with a MiSeq Nano 2×150bp kit (Illumina #MS-102-2002). SDSI reads were quantified by mapping each SDSI against other SDSIs with the align_and_count_multiple_report wdl implemented in Terra, as described below, and purity and sequence fidelity of SDSIs was achieved by calculating the percentage of reads mapping to each SDSI out of total SDSI reads (Fig. 2b). Given these same data, we explored our SDSI mapping stringency threshold. We determined whether each SDSI was uniquely identified over a range of SDSI stringency thresholds (0.01%–50% of SDSI reads mapping, with a step size of 0.01%) (Extended Data Fig. 8). We tested 142 total unique SDSIs; all SDSIs amplified successfully with high sequence fidelity and purity (>95% of reads mapped to the expected SDSI in the experiment described above). The final set of 96 SDSIs were chosen after first pass validation in a combination of clinical sample amplification tests, GC cutoffs, and sequence homology cutoffs. SDSIs excluded because of poor amplification or impurity in clinical sample processing were not retested to determine whether error was technical or biological.
Viral CT Determination
Viral cycle threshold (CT) for all samples sequenced at the Broad Institute were obtained using the CDC RT-qPCR assay with the N1 probe as previously described21. Viral CTs for samples sequenced at JAX were obtained from various providers and thus the RT-qPCR assays used are variable.
CT Normalization
CT normalization was performed by first setting a desired mock viral CT and calculating the difference between this desired mock viral CT and the measured viral CT of a given sample, rounding to the nearest whole number. We next calculated the number of doublings required for the mock viral CT (assuming 100% PCR efficiency), and multiplied this by the volume of cDNA input to be used for the normalization. The final volume of water used to dilute the cDNA was the doubling factor minus the volume of cDNA input. An example calculation is illustrated below:
CT Normalization calculation:
N= Difference between actual and mock
X= Volume (μL) of cDNA to use for normalization
DF=Doubling factor is X(2N)
Volume water for dilution (μL)=DF-X
This CT normalization was done for certain method development samples which are described throughout the manuscript as being “mock diluted” or “normalized to CT X”. The nosocomial cluster was normalized to CT 27. The majority of batch data generated at the Broad Institute underwent CT normalization to CT 25. Batch data from JAX did not undergo CT normalization.
cDNA generation and ARTIC amplification optimization
Reverse transcriptase
We tested reverse transcriptase enzymes using extracted RNA from four SARS-CoV-2 positive clinical samples (CTs = 13.9, 23.9, 29.6, 33.6) (Extended Data Fig. 6a,b). We added 2μL of purified DNase treated RNA as input into SuperScript III (Thermo #18080093), SuperScript IV (Thermo #18091050), or SuperScript IV VILO (Thermo #11756500). Superscript IV (SSIV) reactions incubated at room temperature for 10 minutes, followed by 50°C for 60 min and an inactivation step at 80°C for 10 min. Superscript IV VILO shared the same protocol, but with a temperature of 85°C for the inactivation step. We input 2.5μL of cDNA for ARTIC pool #1 PCR under standard conditions for 40 cycles. We then tested the resulting pool #1 using the scaled down Illumina DNA Flex library construction (as described in Methods below) and sequenced on Illumina Miseq (V2 reagent kit) with 2 × 150 bp paired end sequencing.
ARTIC PCR enzyme
We tested PCR enzyme efficiency using extracted RNA from SARS-CoV-2 positive clinical samples followed by cDNA generation using SuperScript IV and diluted the resulting cDNA to a mock CT value of 35 for standardization across all PCR enzyme tests. We set up the standard ARTIC PCR pool #1 and pool #2 using an input of 2.5μL, altering only the PCR enzyme and corresponding buffer. We tested NEB Q5 Hot Start High-fidelity 2x Master Mix (Q5 2X MM) (NEB #M0494L), NEB Q5 Hot Start High-fidelity 2x Master Mix plus .01% SDS, NEB Q5 Ultra II Master Mix (NEB #M0544L), KAPA HiFi HotStart (Roche #KK2601), and KOD Hot Start DNA polymerase (Sigma-Aldrich #71842) (Extended Data Fig. 6c). We quantified the resulting ARTIC PCR amplicons using a High Sensitivity DNA Qubit kit, then input 25ng from each pool (50ng total) into scaled down Illumina DNA Flex library construction. The resulting libraries (except Q5 plus .01% SDS, which had no visible product using the Tapestation D1000 High Sensitivity Kit) were quantified and pooled on Illumina Miseq (V2 reagent kit) with 2 × 150 paired end sequencing.
Rehybridization PCR
We optimized PCR cycling conditions on mock CT 35 cDNA (generated as described above) using standard ARTIC PCR primer conditions. We performed a catch-up/rehybridization PCR under the following conditions: 98°C for 30s, 95°C for 15s then 65°C for 5 min (10 cycles), 95°C for 15s then 80°C for 30s then 65°C for 5 min (2 cycles), 95°C for 15s then 65°C for 5 min (8 cycles), 4°C hold (Extended Data Fig. 6e).We quantified the resulting ARTIC PCR amplicons using a High Sensitivity DNA Qubit kit, then input 25ng from each pool (50ng total) into scaled down Illumina DNA Flex library construction. We then quantified these libraries and pooled on Illumina Miseq (V2 reagent kit) with 2 × 150 paired end sequencing.
Cycle Test
We further optimized ARTIC PCR by modifying PCR cycle numbers. Extracted RNA from six SARS-CoV-2 positive clinical samples ranging from CT 27–37 were converted to cDNA with Superscript IV and amplified under standard ARTIC PCR reaction components (with Q5 2X MM) modifying the final number of cycles of PCR from 35, 40 and 45 (Extended Data Fig. 6g). We quantified cDNA and used a standard 50ng of input for scaled down Illumina DNA Flex Library Construction, then quantified the resulting libraries and pooled on Illumina Miseq (V2 reagent kit) with 2 × 150 paired end sequencing.
Ramp Test
We used mock CT 35 cDNA to test the effect of decreased ramp speed on genome recovery and coverage. ARTIC PCR conditions for this experiment were 98°C for 30 seconds, followed by 40 cycles of 95°C for 15 seconds and 65°C for 5 minutes with a cooling and heating ramping speed of 3°C/s. We tested a slow ramp PCR protocol with the ramp speed reduced to 1.5°C/s (Extended Data Fig. 6f). Libraries were constructed with Illumina DNA Flex and were sequenced on Illumina Miseq (V2 reagent kit) with 2 × 150 paired end sequencing.
Primer Concentration Optimization
Under standard ARTIC protocol conditions, we ordered lyophilized ARTIC v3 primers from IDT and resuspended in water at 100μM each. Pool #1 primers consisted of all odd numbered amplicons whereas pool #2 primers consisted of all even numbered amplicons. To generate the 100μM pool #1 primer stock, we combined 5μL of each 100μM pool #1 primer, and repeated this protocol for the even numbered primers to give a 100μM pool #2 primer stock. We selected a total of 20 amplicons as regions of low coverage from previous sequencing data (Sup Table 3). Low coverage amplicons were present in both pools, with 11 coming from pool #1 and 9 coming from pool #2. For the primer 2X pools, we spiked in primers for the corresponding amplicons at 2X the concentration (20.8nM final) of the other primers in the pool. For these low coverage primers, we used 10μL of the 100μM stock rather than 5μL. We diluted both the original and 2X primer pools 1:10 in nuclease free water to generate a 10μM working stock. We then selected 8 samples with varying CT values to determine if selectively increasing primer concentrations reduced amplicon dropout (Extended Data Fig. 6d). We used the SDSI+AmpSeq protocol (without the SDSI or SDSI primers) and processed each sample with both the original primer pool, as well as the 2X primer pool, then sequenced these 16 samples on an Illumina Miseq (V2 reagent kit) with 2 × 150 paired end sequencing. Only 6 of the 8 samples generated complete genomes (>98%) in both conditions and were used for further analysis.
CT normalization experiment
The CT normalization experiment was performed by taking four individual clinical samples (CT = 18–25) with four randomly selected SDSIs and either not normalizing the cDNA or normalizing to CT 25, 26, or 27 prior to the ARTIC PCR (Extended Data Fig. 4b). Samples were processed with the standard SDSI+AmpSeq protocol described below and were sequenced on a NextSeq 500 Mid Output Kit v2.5 (300 Cycles)
Illumina DNA Flex
We performed a head-to-head comparison of standard Illumina Nextera DNA Flex and Nextera XT (Illumina #FC-131-1096) library construction kits (Extended Data Fig. 6h). The Nextera XT protocol was performed as previously described21,33. Both library construction methods were compared on post ARTIC v1 PCR amplicons from clinical samples. In short, we amplified samples with a range of SARS-CoV-2 viral CT values (CTs = 22.9, 26.2, 30.3) with ARTIC v1 primers, producing 400 bp size fragments. We quantified amplicons from each ARTIC primer pool and pooled in equal molar concentrations. Standard Nextera DNA Flex input was 100ng (50ng from each pool) and 1ng (.5ng from each pool) for Nextera XT. We quantified and pooled the resulting libraries before sequencing on an Illumina Miseq (V2 reagent kit) with 2 × 150 paired end sequencing.
We optimized Illumina DNA Flex library construction (Illumina #20018705) construction with the goal of reducing normalization steps, cost and increasing throughput. We scaled down (.5X) Illumina DNA Flex throughout the standard Illumina sequencing protocol, also scaling down sample input for a total of 50ng (25ng from each primer pool). Due to the CT normalization step, we removed the pre-DNA Flex DNA concentration and pooling step. We used 1–2μL of post ARTIC PCR amplicon as input into the scaled down DNA Flex library construction, and performed post library construction quantification and pooling with more uniform library size and concentration, further reducing time and cost of pooling libraries for sequencing. This protocol was used for all method development experiments, the cluster investigation, and a portion of the batch data generated from both the Broad Institute and JAX.
SDSI+AmpSeq SDSI titration in ARTIC SARS-CoV-2 sequencing
To determine an optimal concentration for SDSIs in ARTIC SARS-CoV-2 sequencing, we diluted SDSI 49 to 0.6, 6, 60, and 600 copies/μL (1, 0.1, 0.01, and 0.001fM); 1μL of SDSI 49 was added to 5μL of cDNA, to be split to 2×3μL for each ARTIC pool (Extended Data Fig. 3, Supplementary Data File 1). SDSI primers were added to each ARTIC pool with a final concentration of 40nM. The cDNA from one clinical sample (MA_MGH_00195; CT =16) was mock diluted to CT 20,25,30, and 35 for this experiment using the protocol described within the CT normalization section. Based on the results of this experiment, SDSIs were used at 6e2 copies/μL (1fM) for all method development data. Batch processing modifications to this approach from the Broad Institute and JAX are detailed below.
SDSI+AmpSeq Protocol
Full protocol details can be found here: https://benchling.com/s/prt-R95g0tCxKOeCAqn8lAk3 (Fig. 1). In short, cDNA synthesis is performed on 2.5μL of DNAse-treated viral RNA with SSIV following the manufacturer’s protocol with an extension of the 50°C incubation from 10 minutes to 60 minutes. An additional cDNA normalization step can be performed (see above) or one can move directly into the ARTIC PCR by taking 5μL of cDNA and mixing this with 1uL of a 1fM SDSI (equal to 600 copies/μL). After mixing, split into 2 × 3μL aliquots and add ARTIC primer pool 1 or pool 2, as well as 1μM of the spike-in forward and reverse primers (40nM final concentration in the ARTIC pool). The ARTIC PCR conditions were 98°C for 30 seconds, followed by 40 cycles of 95°C for 15 seconds and 65°C for 5 minutes. Pool 1 and pool 2 PCR reactions were combined and taken through library construction with scaled down Illumina DNA Flex.
Broad Institute Sample Processing
The batch data from the Broad Institute was generated using SDSI+AmpSeq with minor modifications (Fig. 4). In short, SSIV was used for cDNA synthesis. Q5 2X MM was used for the ARTIC PCR which was run for 35 cycles. The SDSIs were spiked in at 6e3 copies/μL and the SDSI specific primers were added to each ARTIC pool at a final concentration of 40nM. Library construction was performed either with the scaled down Illumina DNA Flex (previously described) or COVID-seq (Illumina #20043675). Samples were sequenced on a NovaSeq 6000 SP Reagent Kit v1 (300 cycles) or v1.5 kits (300 cycles), or NextSeq 500 v2 kit (300 cycles). The GC percent for each SDSIs and percent SDSI reads over total reads correlation for SDSI (2–48) was performed with the samples sequenced at the Broad Institute (n=2,903) (Extended Data Fig. 2e). A linear regression was used to evaluate significance (p-value = 0.8160).
Jackson Laboratory Sample Processing
Data generated at Jackson Laboratory (JAX) used two different protocols publicly available here: https://github.com/tewhey-lab/SARS-CoV-2-Consensus (Fig. 4). All samples included 6e2 copies/μL of SDSIs and the SDSI specific primers were added to each ARTIC pool at a final concentration of 4nM. Samples processed from December 2020 to April 2021 used Lunascript (NEB #E3010) for cDNA synthesis and Q5 2X MM for the ARTIC PCR which was run for 35 cycles. These samples used scaled down Illumina DNA Flex for library construction. Samples sequenced after April 2021 used the standard COVID-seq protocol. All samples were sequenced on a NextSeq500 using paired 75 bp reads by the Genome Technology group on Jackson Laboratory’s Bar Harbor campus. The validation of all SDSIs in clinical samples (Fig. 3a) was performed with this protocol and is presented as the percent of SDSI reads over the total of all reads for each sample. Of note, the SDSIs (used at the lowest recommended concentration of 6e2 copies/uL) were reliably detected in the samples sequenced at JAX. This reliable detection however is also dependent on the sequencing depth used by the institution.
SDSI impact on genome recovery
For +/− SDSI experiments testing impact on recovery of viral genomes, fourteen clinical samples spanning a range of CTs (CT = 17.6–30) were selected (Fig. 3b, Extended Data Fig. 4a). Samples were CT normalized and split after cDNA synthesis into 2 × 5μL aliquots. Samples below CT 20 were normalized to CT 25 and samples between CT 20–25 were normalized to CT 26. Fourteen randomly selected SDSIs were used with each sample receiving either an SDSI (600 copies/μL) and the SDSI specific primers (40nM final concentration in the ARTIC pool) or just the ARTIC pool 1 and pool 2 mastermix with additional nuclease free water and no SDSI primers. Samples were processed according to the SDSI+AmpSeq protocol using scaled down Illumina DNA Flex for library construction, sequenced on a NextSeq 500 Mid Output Kit v2.5 (300 Cycles) and analyzed as described below.
Statistical analysis for the +/− SDSI experiment involved analysis of the mean coverage for all 98 amplicons for the full sample set with a two-tailed Mann Whitney t-test and multiple comparison two-stage step-up Benjamini, Krieger, and Yekutieli test with FDR set to 5%. All 98 amplicons were found to be not significantly different (p-value > 0.05) between the plus and minus SDSI group. Samples were also separated into three CT bins (CT <27 (n=4), 27–29 (n=6), CT>30 (n=4)) and this test repeated for each CT bin. This analysis also revealed that there was no significant difference (p-value > 0.05) in the mean coverage across any amplicon for any CT bin.
Intentional SDSI contamination experiment
The intentional contamination experiment used SDSI 87 and SDSI 94 (SDSI 87: SDSI 94). The SDSIs were mixed at five different proportions (100:0, 75:25, 50:50, 25:75, and 0:100) (Fig. 5a). Each condition was performed in duplicate. All validation experiment samples were processed according to the SDSI+AmpSeq protocol using scaled down Illumina DNA Flex for library construction. Samples were processed with the standard SDSI+AmpSeq protocol and sequenced on a NextSeq 500 Mid Output Kit v2.5 (300 Cycles).
Production and application of synthetic RNA spike-ins (SRSI)
We ordered SDSI oligos with minor modifications to enable in-vitro transcription of RNAs (including a T7 promoter upstream of the SDSI amplicon, as well as 17 bps of constant sequence within the primer region) (Twist Bioscience) (Supplementary Data File 1). For two SDSIs (SDSI 1 and SDSI 4) we in-vitro transcribed RNA using a T7 transcription kit (NEB E2050), quantified by RNA screen tape (Agilent 5067–5579 and 5067–5580), then diluted in water to 10fM (6,000 copies/μL), 1fM (600 copies/μL), 100aM (60 copies/μL), and 10aM (6 copies/μL). We added 1μL of SRSI at each concentration directly to 5 μL of RNA from two patient samples with high and intermediate viral loads, respectively, and prepared sequencing libraries using the SDSI+AmpSeq protocol (without the SDSI addition step at the cDNA stage). For the sample with a high viral load, we performed a dilution at the cDNA stage (diluting 32-fold for a mock Ct of 25 rather than 20). Reads mapping to unique SDSI sequences and SARS-CoV-2 were quantified using the align_and_count_multiple_report and assemble_refbased wdls respectively, and % SDSI/combined reads was reported (Extended Data Fig. 10).
Computational analysis workflow
We analyzed sequencing data on the Terra platform (app.terra.bio) using viral-ngs 2.1.28 with workflows that are publicly available on the Dockstore Tool Repository Service (dockstore.org/organizations/BroadInstitute/collections/pgs).
Samples were demultiplexed using the demux_plus workflow with a spike in database file for the SDSIs. We performed any separate analyses to quantify read counts, including those for SDSIs, with the align_and_count_multiple_report workflow with the relevant database. For most analyses involving direct comparisons between samples, we performed downsampling to the lowest number of reads passing filter with the downsample workflow. We performed assembly using the assemble_refbased workflow to the following reference fasta: https://www.ncbi.nlm.nih.gov/nuccore/NC_045512.2?report=fasta. We used iVar version 1.2.1 for primer trimming on all samples followed by assembly with minimap2 set to a minimum coverage of either 3, 10, or 20, skipping deduplication procedures. The computational pipeline for all samples sequenced at JAX is publicly available at the following: https://github.com/tewhey-lab/SARS-CoV-2-Consensus.
Samples from the batch data were subset in the following way for analysis. All samples with a present SDSI were used for the percent of SDSI reads out of the sum of all SDSI reads analysis (JAX: n=3,773, Broad: n=2,903). Samples with known experimental contamination errors or where the dominant (>50%) SDSI was not the correct SDSI were removed. For the percent of SDSI reads over the total of all sequenced reads analysis (JAX: n=3,045, Broad: n=2,670), non-template controls (waters) and clinical samples with no detectable viral load (CT>40 or not detected via qPCR as described above) were removed from analysis.
Metagenomic sequencing and comparison
Metagenomic sequencing data and genome assemblies used for the comparison of amplicon-based sequencing were prepared, sequenced, analyzed as described previously,21 and the data are publicly available at NCBI’s GenBank and SRA databases under BioProject PRJNA622837. We prepared amplicon sequencing libraries from the sample RNA extract following our SDSI+AmpSeq protocol (Fig. 1). We normalized cDNA samples that had a high viral load (CT<27) to a CT of 27. To prepare for the ARTIC PCR, we transferred 5μL of the normalized cDNA to a new plate and added 1μL of a SDSI (600 copies/μL). After mixing, we transferred 3μL to a new plate, added ARTIC PCR pool #1 mastermix and pool #2 mastermix to the respective plates, and on a thermal cycler incubated at 98°C for 30s, followed by 40 cycles of 95°C for 15s and 65°C for 5min. We then combined in equal molar amounts of amplified samples for a total of 50ng and processed through .5X Illumina Flex library construction pipeline. We sequenced the concordance data set on a NovaSeq 6000 SP Reagent Kit v1 (300 cycles) and analyzed as detailed in the methods below. For SNV analysis, the coverage depth over each divergent SNV was greater than 1000X for both platforms, and both SNV calls persisted at relaxed (n=3) and conservative (n=20) minimum coverage thresholds. Primer trimming using iVar version 1.2.1 was manually confirmed.
Suspected nosocomial cluster investigation
We received NP swab samples in UTM and extracted RNA from 200μL of biosample as previously described8. We prepared amplicon sequencing libraries as described above and analyzed them as detailed in the methods below. A pairwise distance was calculated between all partial genomes (>80% complete), excluding gaps, to determine whether samples were likely to be the result of nosocomial transmission (Fig. 5c). We calculated the proportion of reads that mapped to a given SDSI out of all reads that mapped to any SDSI. Data has been made available in both the Short Read Archive and NCBI GenBank under Bioprojects PRJNA622837 and PRJNA648098. GenBank accessions for SARS-CoV-2 genomes from this set of samples are MW454553 MW454562.
For phylogenetic tree reconstruction we placed the suspected nosocomial cluster in a broader genomic context by performing a subsampling of the genome sequences available in GISAID34 (Extended Data Fig. 9). We used the sarscov2_nextstrain workflow to perform a Massachusetts-weighted subsampling of samples from 1 January 2020 – 1 November 2020. Our subsampled dataset included 3146 sequences; 1449 samples from Massachusetts, 1425 samples from elsewhere in the United States and 283 from other countries. We constructed a maximum likelihood tree using iqtree with a GTR substitution model and edited and interpreted the tree in Figtree v1.4.4.
Data presentation
Data analysis and graphing was performed using R Statistical Software (version 1.3.959; R Foundation for Statistical Computing, Vienna, Austria), GraphPad PRISM (version 9.0.2; GraphPad Software, La Jolla California USA, www.graphpad.com) and Python (version 3.7). We created original figures using BioRender (BioRender.com).
Code availability
Viral genomes were processed using the Terra platform (app.terra.bio) using viral-ngs 2.1.28 with workflows that are publicly available on the Dockstore Tool Repository Service (dockstore.org/organizations/BroadInstitute/collections/pgs). Downstream analyses were performed using Geneious Prime 2020.1.2 or standard R (Version 1.3.959) packages. Custom scripts used to generate figures are available upon request.
Data availability
Sequences and genome assembly data are publicly available on NCBI’s Genbank and SRA databases under BioProjects PRJNA715749, PRJNA622837 and PRJNA648098. GenBank accessions for SARS-CoV-2 genomes newly reported in this study are MW454553 - MW454562. SDSI sequences are reported in Supplementary Data File 1. We performed SDSI homology analyses using NCBI databases [Homo sapiens (taxid:9606), viral (taxid:10239)]. We performed assembly using the assemble_refbased workflow to the following reference fasta: https://www.ncbi.nlm.nih.gov/nuccore/NC_045512.2?report=fasta. Source data are provided with this paper. Additional data are available upon request.
Statistics & Reproducibility
The aim of our study was to establish the potential utility of our method, and study sample sets were largely dictated by the availability of clinical samples. No statistical method was used to predetermine sample size and experiments were not randomized. The Investigators were not blinded to allocation during experiments and outcome assessment. We performed some experiments, such as RT-qPCRs with technical replicates and Figure 5a was run in duplicate.
Samples that failed sequencing due to technical reasons or where insufficient genome coverage was obtained for a given analysis (see Methods) were excluded. Data for Figure 4b and Extended Data Figure 2e was subsetted to exclude samples where SDSIs showed evidence of substantial contamination (expected SDSI is not the dominant (>50%) SDSI), the addition of no SDSIs, or failed sequencing. This dataset was further subsetted for Figure 4c to exclude non-template controls and samples with no detectable CT for SARS-CoV-2. Analysis for 46 SDSIs that we did not proceed with further (due to suspected overlap with lab contaminants or contamination during synthesis or preparation) was omitted from this manuscript. Data from one sample that we added SRSI to was omitted from reported data.
Extended Data
Extended Data Fig. 1. SDSI core sequence in silico validation.
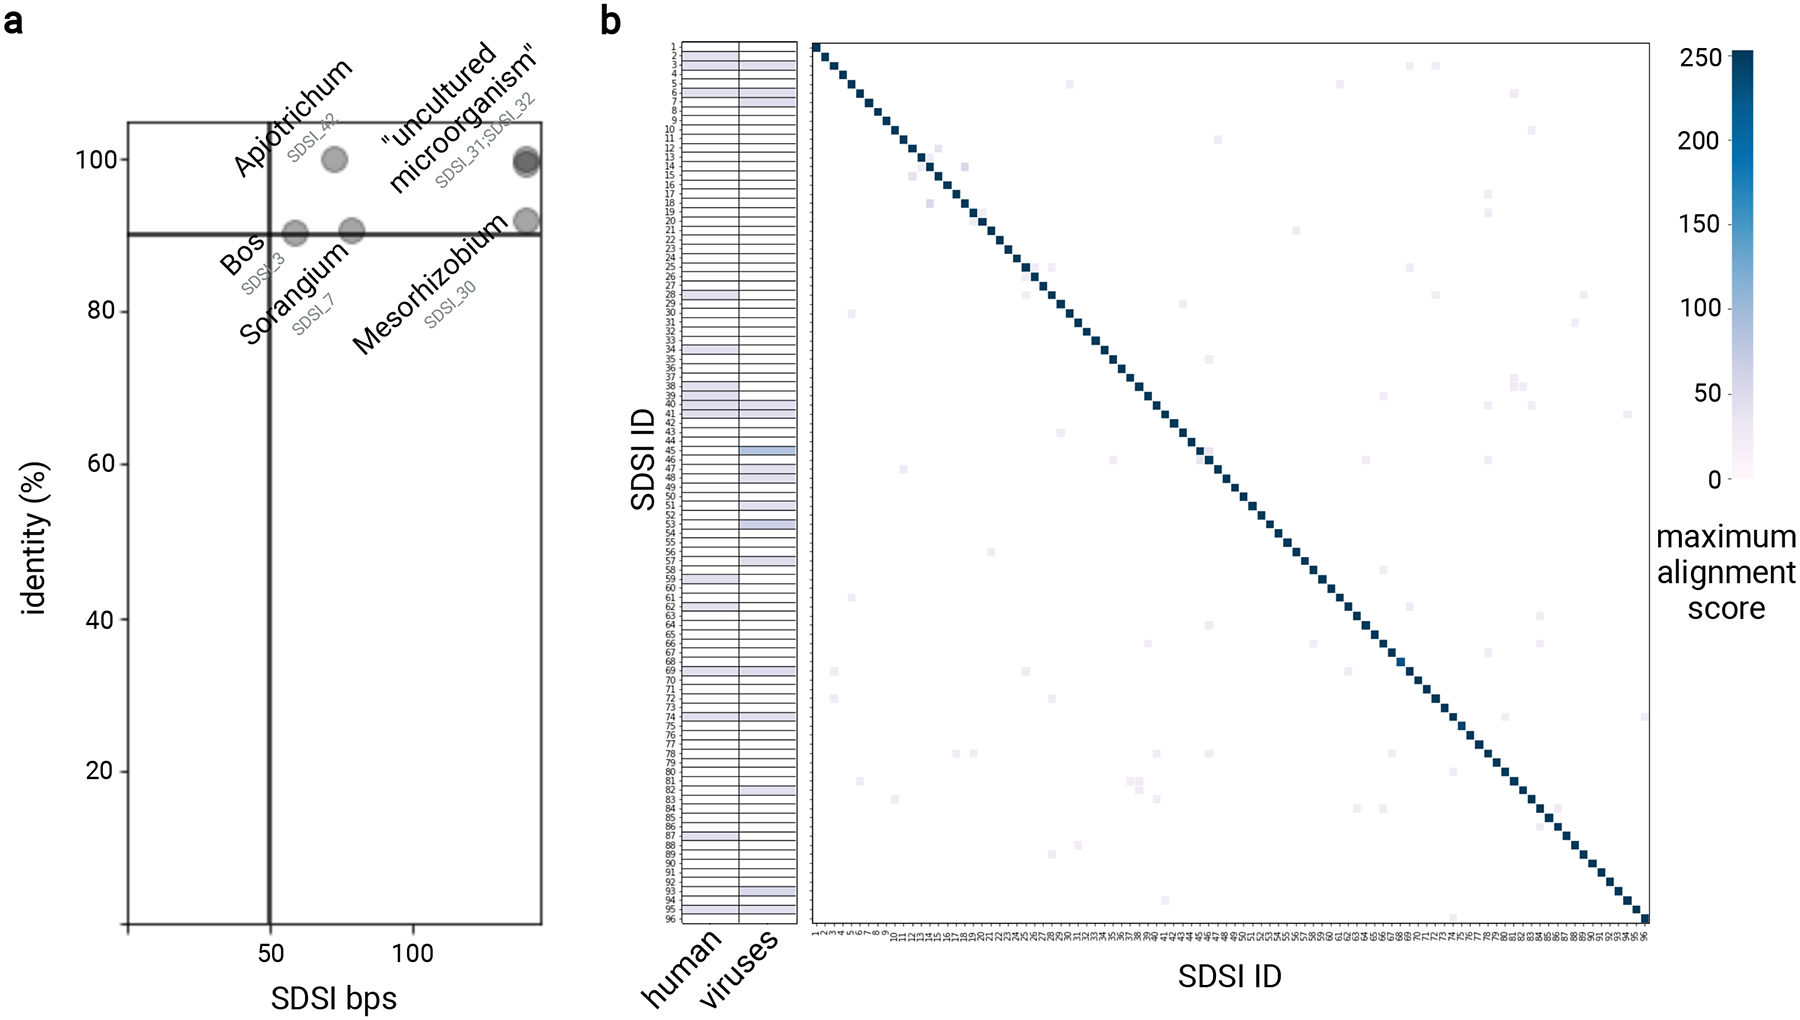
We surveyed the core SDSI sequences by BLASTn to identify significant homology. a, Significant homology between SDSIs and anything in the NCBI database outside the domain archaea was identified and the SDSI and genus were plotted if identity (y-axis) was greater than 90% and query cover (x-axis) was greater than 50 bps. b, For each SDSI, we identified and plotted (see color scale) the maximum alignment score for a significant homology to human (taxid:9606) and viral (taxid:10239) sequences in the NCBI database. We also identified and plotted the alignment score for each pairwise combination of SDSIs.
Extended Data Fig. 2. Spike-in validation.
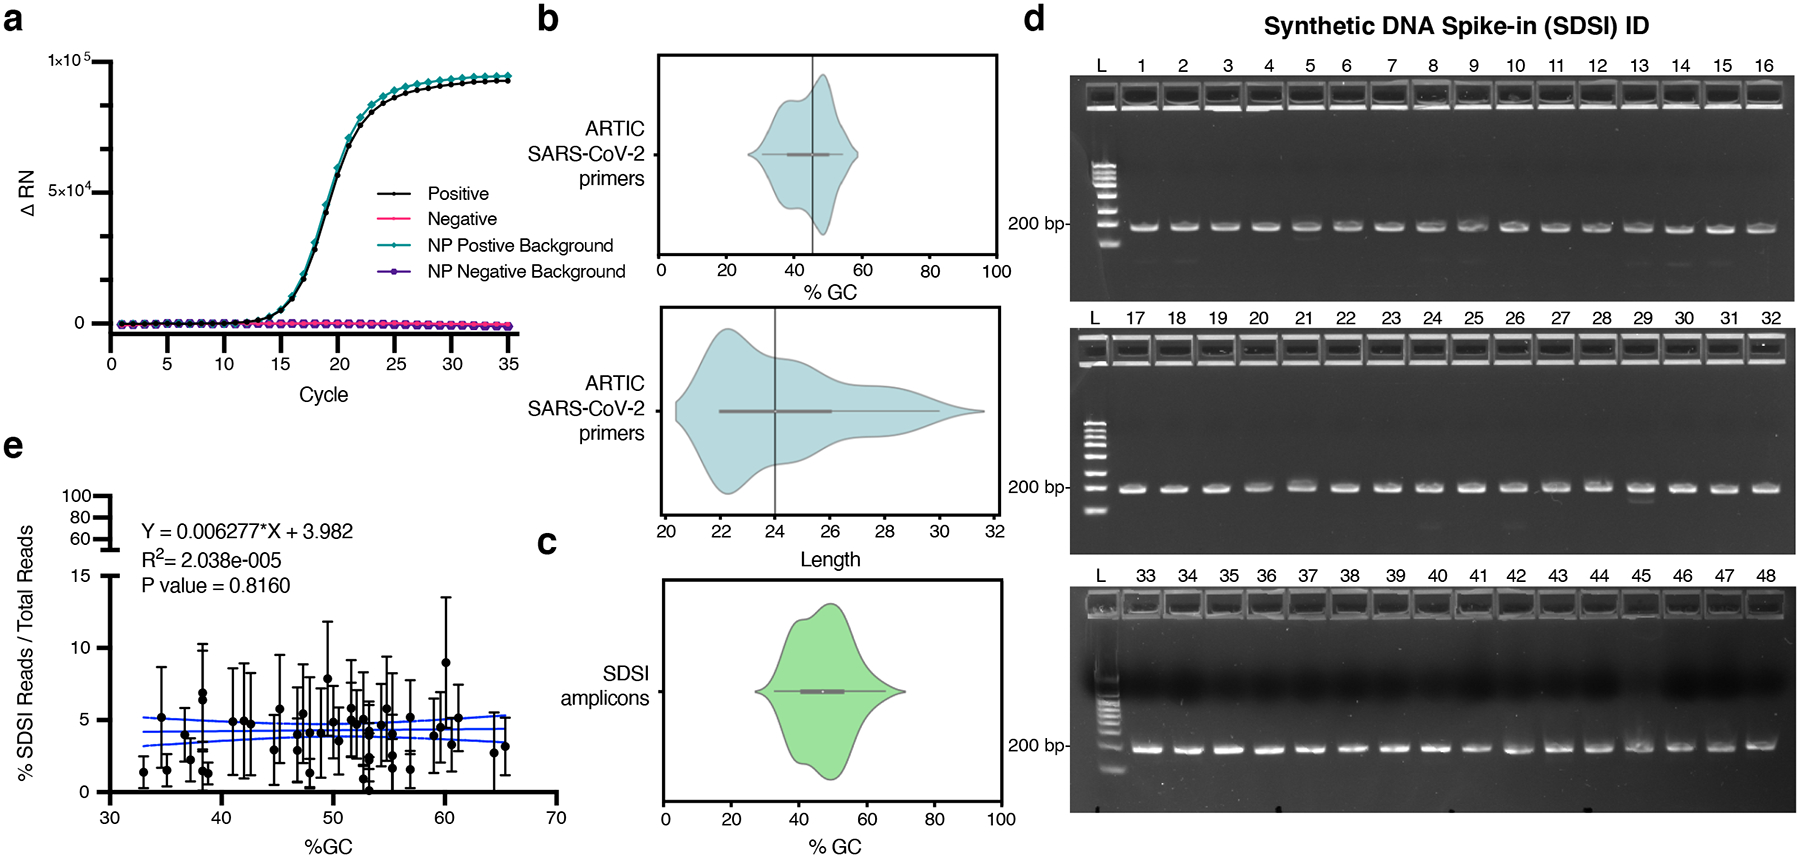
a, RT-PCR for an SDSI in water and a SARS-CoV-2 positive clinical sample background. Mastermix and SDSI specific primers were added to all samples. SARS-CoV-2 positive clinical sample is cDNA generated from a nasopharyngeal (NP) swab. b, The distribution of GC content and length for ARTIC v3 primers. c, The distribution of GC content of SDSI amplicons (n=96). d, 100fmol DNA spike-in amplified under standard ARTIC PCR conditions for 40 cycles run on 2.2% agarose gel image with 188bp amplified spike-in (SDSI 1–48) (n=2, representative image shown). e, % SDSI reads over total reads for SDSI (2–48) over a range of SDSI GC% (33%–65.4%) showed no significant read depth bias. Data are presented as mean values +/− 95% CI. Linear regression: p-value=0.8160, R2=2.038e-005 (Broad, n=2,903 biologically independent samples).
Extended Data Fig. 3. SDSI Titration.
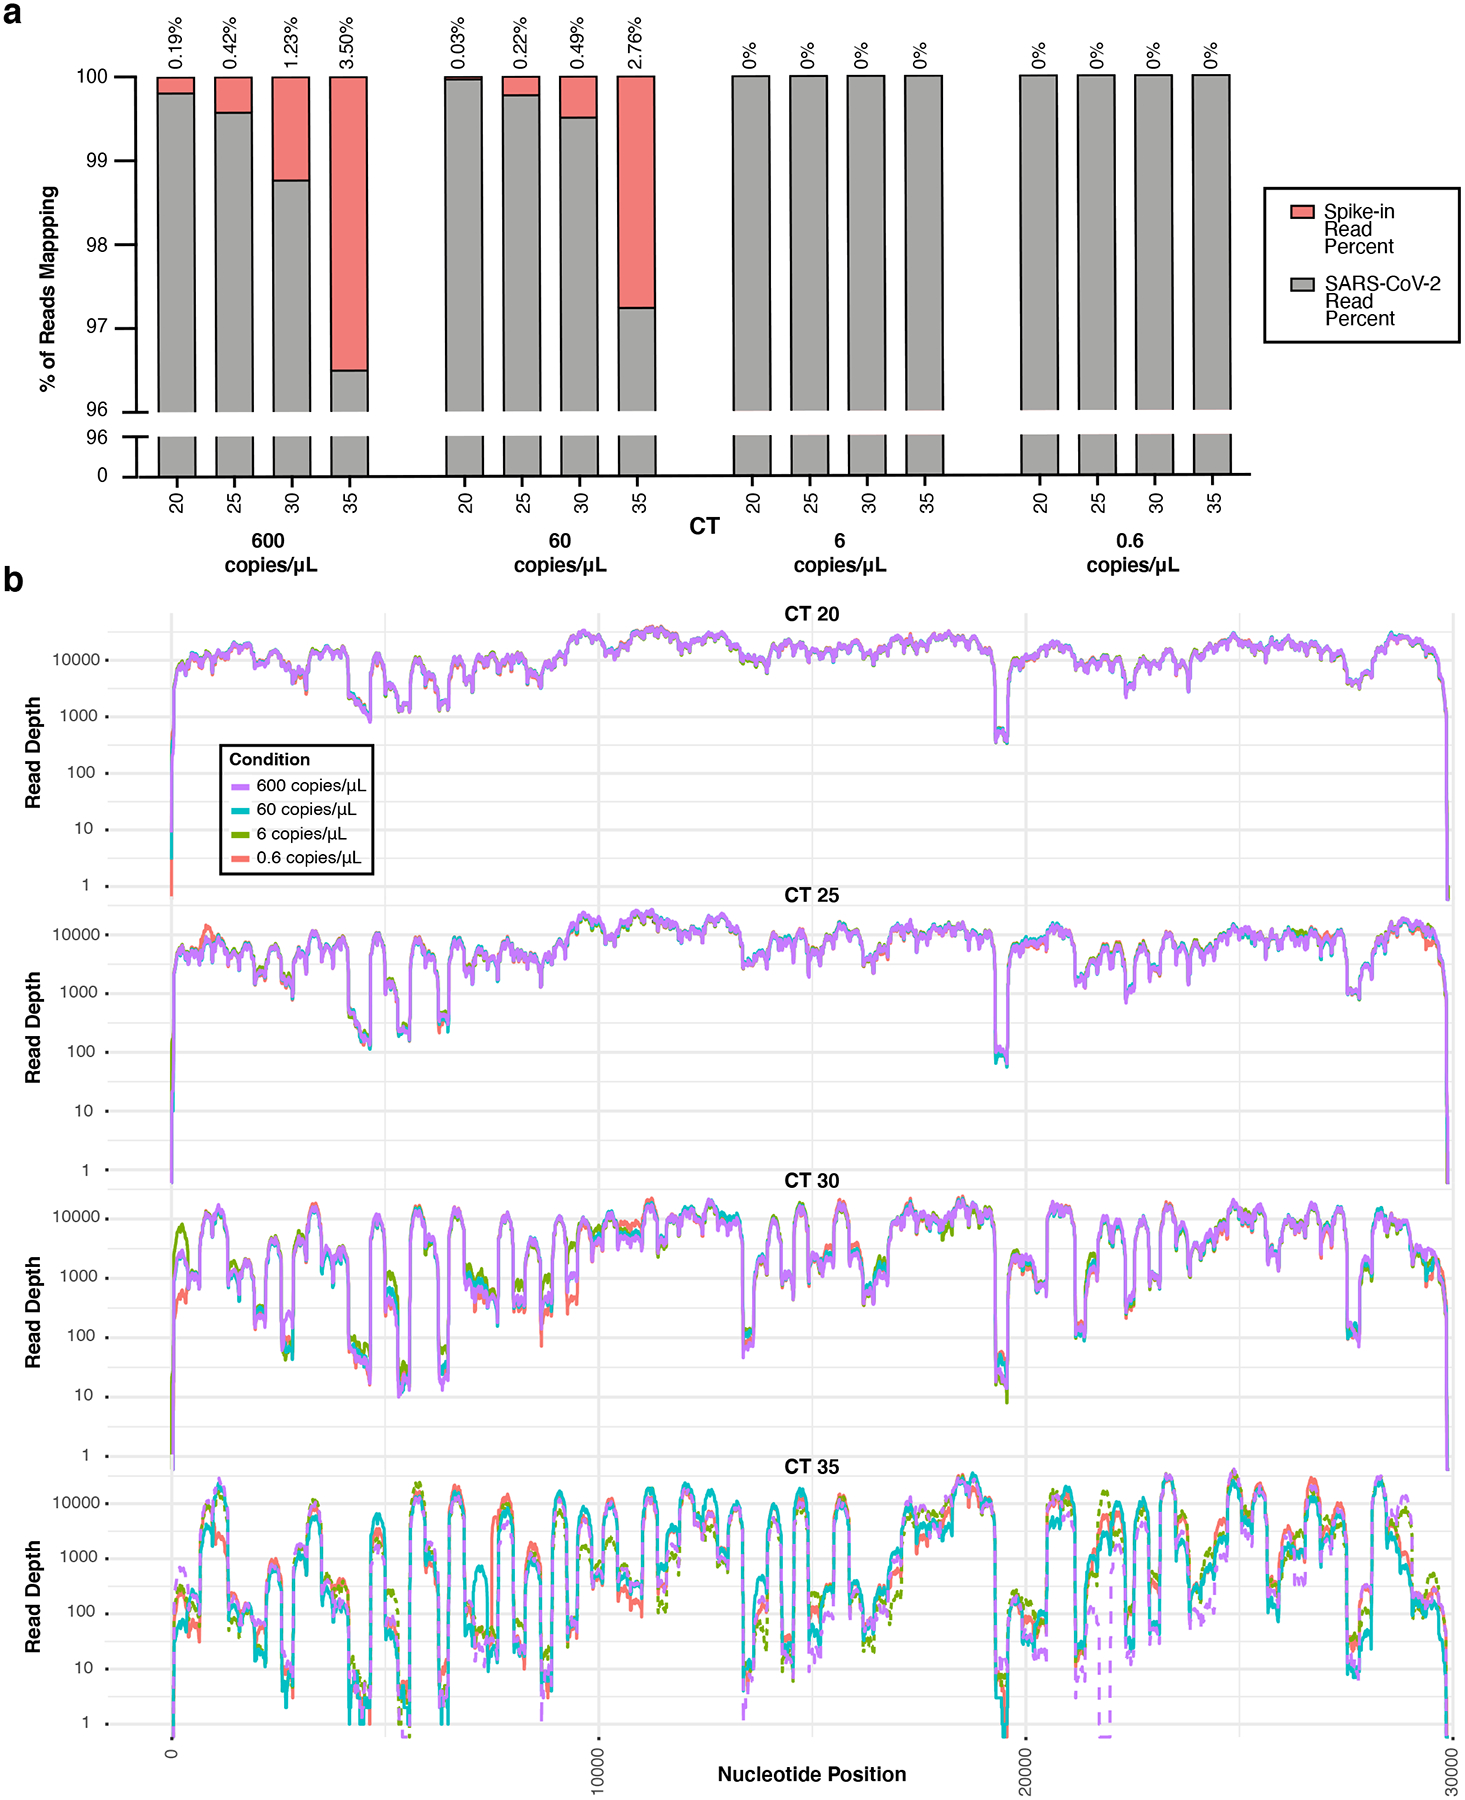
a, In a titration of SDSI 49 across one clinical sample (CT=16) mock diluted to various CTs (CT=20,25,30,35), the number of reads mapping to both SARS-CoV-2 and the SDSI were quantified, and the percentage of each was calculated. SDSI 49 was tested at 600,60,6, and 0.6 copies/μL in each mock diluted sample. b, Coverage plots for the SDSI 49 titration experiment.
Extended Data Fig. 4. ARTIC SARS-CoV-2 amplicon sequencing with and without SDSI and normalization.
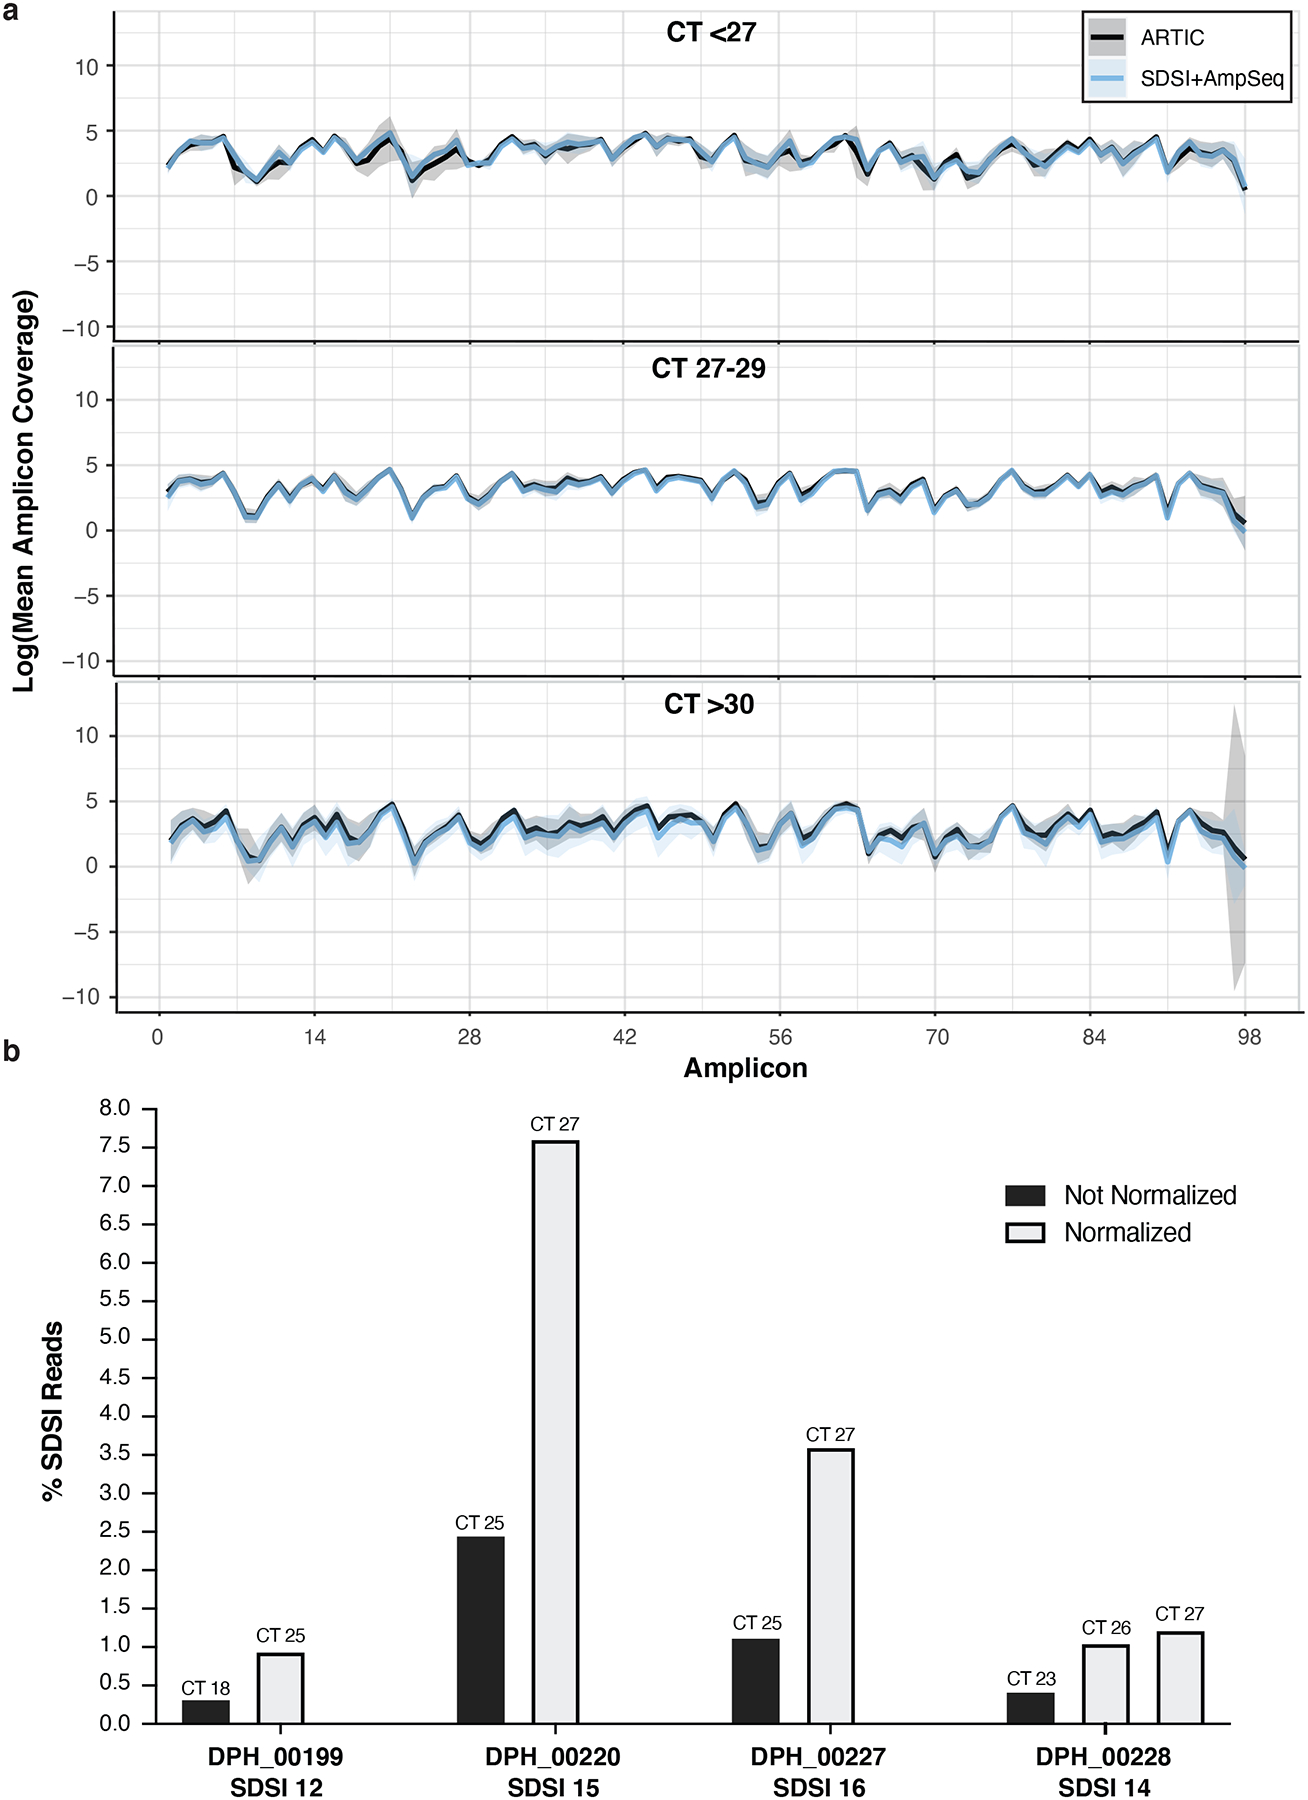
a, In three different CT bins, we show coverage plots with 95% confidence intervals for multiple samples sequenced with and without SDSIs (CT<27, n=4; CT 27–29, n=6; CT>30, n=4). The solid blue line represents SDSI+AmpSeq and the solid black line is ARTIC only with no SDSI. Blue and black shading around the solid lines represents the 95% confidence interval. There were no significant differences (p-value > 0.05) between the with and without SDSI group for the mean coverage at any of the amplicons (two-tailed Mann Whitney t-test and multiple comparison two-stage step-up Benjamini, Krieger, and Yekutieli test with FDR set to 5%). b, The percentage of SDSI reads for 4 different SDSIs was assessed within 4 clinical samples that were run with and without CT normalization of the cDNA prior to the ARTIC PCR.
Extended Data Fig. 5. SDSI+AmpSeq over a diverse set of samples has superior genome recovery and more coverage uniformity at higher CTs.
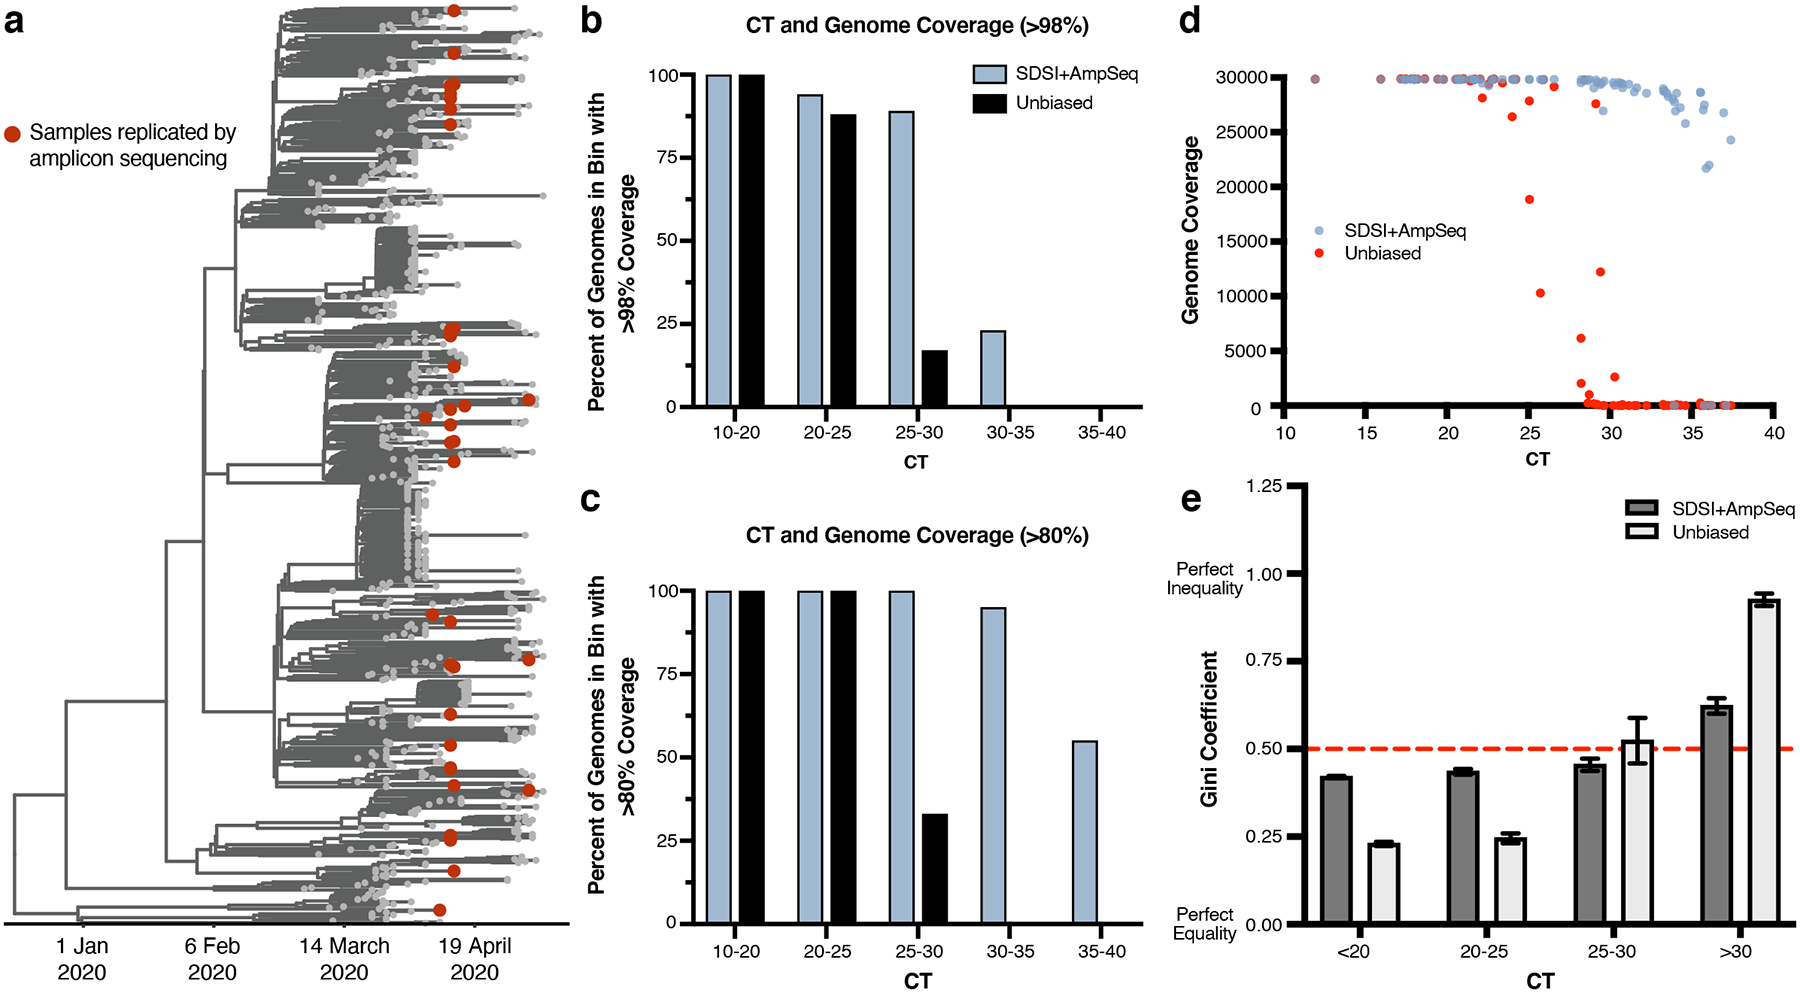
a, Time-measured maximum clade credibility tree of 772 genomes from Massachusetts, reported in Lemieux et al., 2021. The 89 samples compared for metagenomic and amplicon sequencing are shown with red dots. b, Percent of assemblies with greater than 98% or c, 80% coverage in different CT bins (n=81 biologically independent samples, excluded samples had no detectable CT) (downsampled to 975,000 reads). d, Genome coverage for unbiased metagenomic sequencing versus SDSI+AmpSeq amplicon sequencing pipeline (n=81 biologically independent samples, excluded samples had no detectable CT). All samples downsampled to 975,000 reads. e, Gini coefficients grouped by CT (n=70 biologically independent samples, excluded samples that did not generate assemblies in either one or both methods). Dashed red line represents a Gini coefficient of 0.50. Data are presented as mean values +/− SEM.
Extended Data Fig. 6. Maximizing Genome Recovery and Coverage with SDSI+AmpSeq.
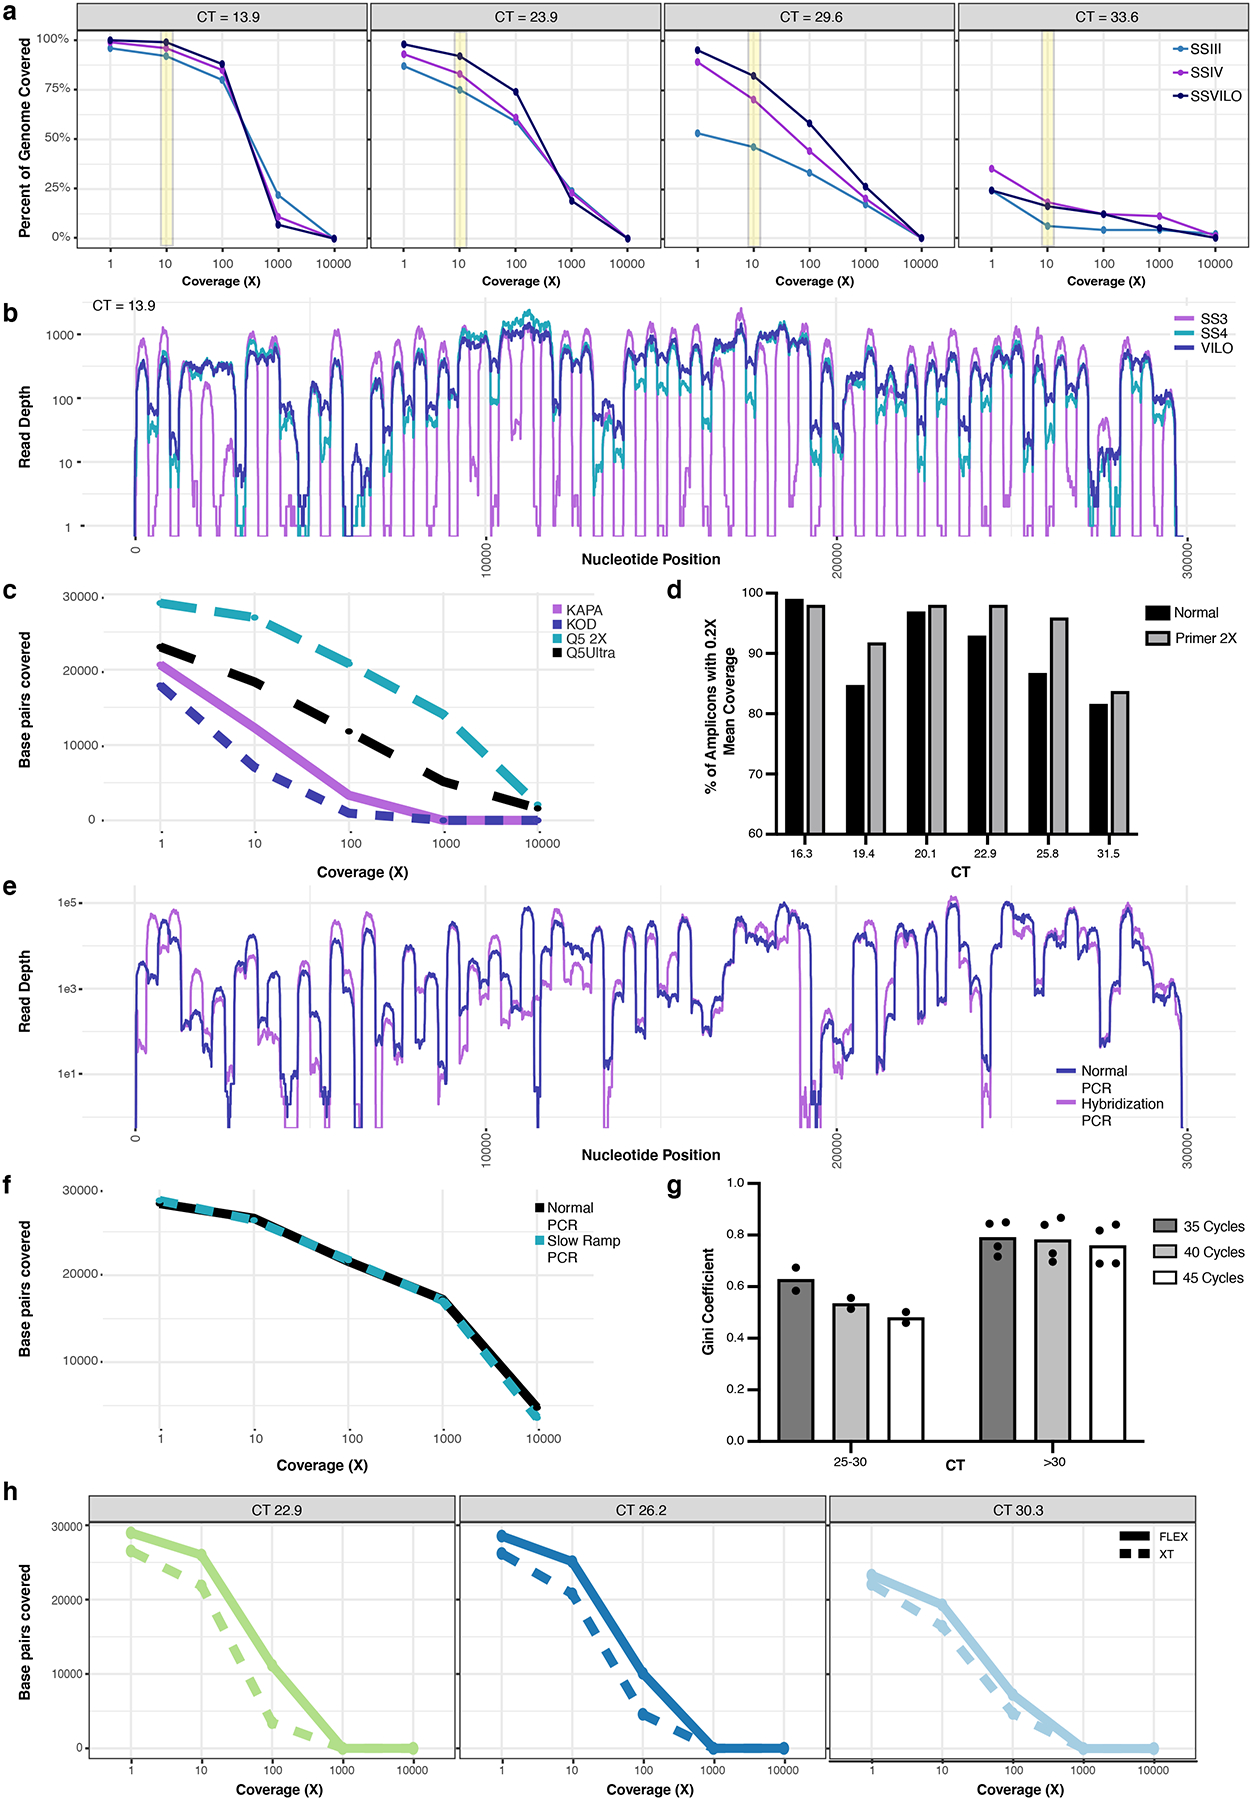
a, The percent of the target genome covered at various depths of coverage for four individual samples (CT=13.9, 23.9, 29.6, 33.6), with each undergoing cDNA with three different reverse transcriptases (SSIII, SSIV, or SSVILO). Yellow bar highlights comparison between the reverse transcriptases at a coverage depth of 10X. b, Read depth across each nucleotide position for the same sample (CT=13.9) when using these reverse transcriptases. c, Base pairs of the SARS-CoV-2 genome covered at various depths when using different enzymes for the ARTIC PCR (n=1). d, Amplicons with at least 0.2X of the mean amplicon coverage with the normal ARTIC v3 primer pools or with a modified primer pool with a 2X concentration of 20 poor-performing ARTIC primer pairs. Six individual samples with different CTs were used. e, Read depth across each nucleotide position for normal ARTIC PCR vs an alternate hybridization PCR (n=1). f, Base pairs of the SARS-CoV-2 genome covered at various depths when using either normal ramping (3°C/s) or reduced ramping (1.5°C/s) speed for the ARTIC PCR (n=1). g, Mean Gini coefficients for two mid-high CT samples (n=2 biologically independent samples over 3 independent experiments) and four high CT samples (n=4 biologically independent samples over 3 independent experiments) when using either 35, 40, or 45 cycles for the ARTIC PCR. h, Comparison of Nextera DNA Flex and Nextera XT on the number of SARS-CoV-2 base pairs covered at various depths of coverage for three samples with different CTs.
Extended Data Fig. 7. Increasing primer concentration 2-fold in regions of low amplicon coverage.
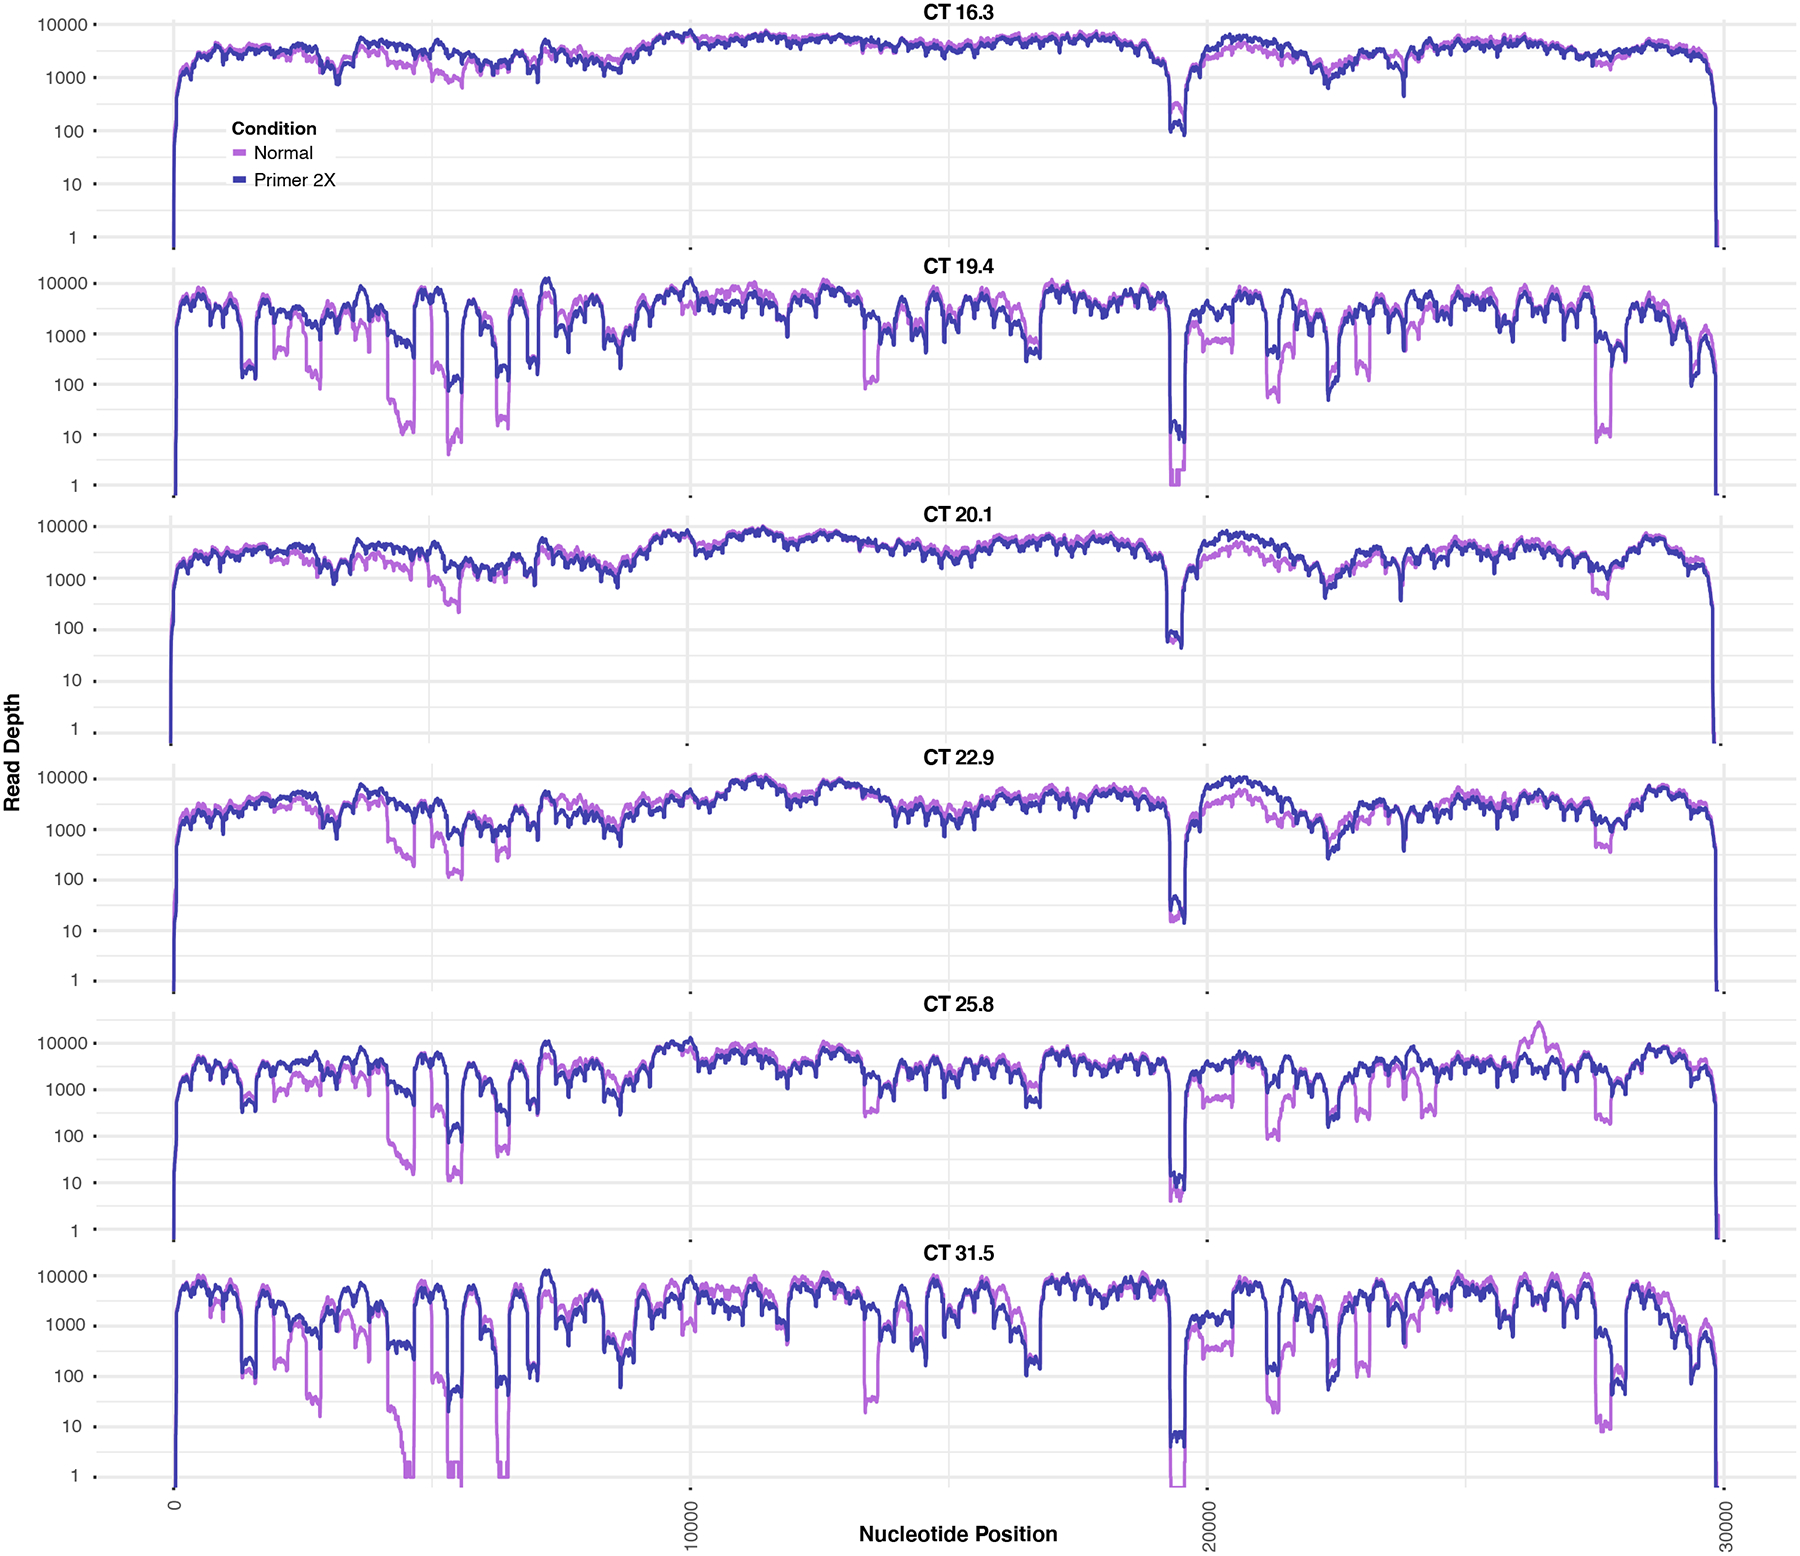
Data represents 6 individual samples at different CTs.
Extended Data Fig. 8. Unique identification of SDSIs given varying thresholds of SDSI mapping stringency.
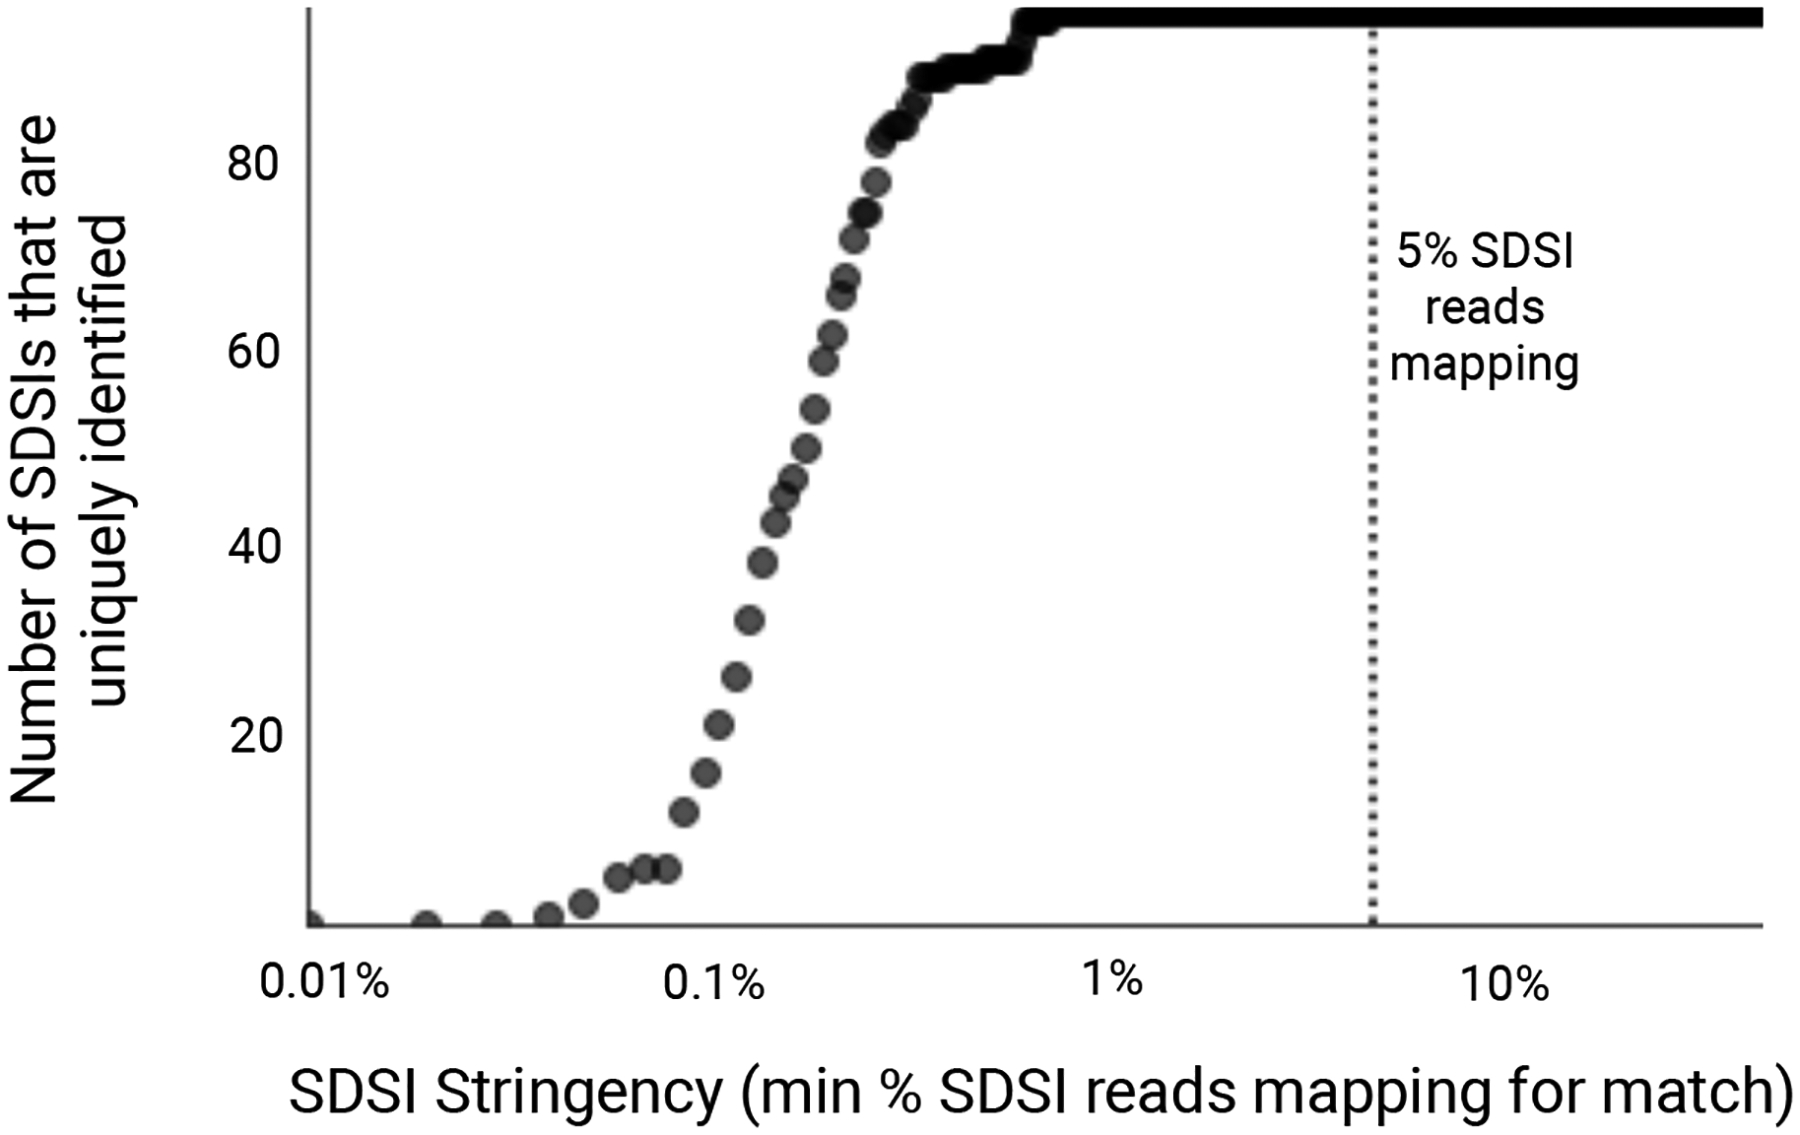
We considered a range of cutoffs of the percentage of all SDSI-mapped reads mapping to a given SDSI (0.01%-50%, with a step size of 0.01). For an experiment where we sequenced SDSIs without any clinical sample, we calculated, at each cutoff, the number of SDSIs (y-axis) in the set we present (96 total) for which only the expected SDSI had a proportion of mapped reads that exceeded the cutoff (x-axis). Assuming no contamination, all 96 SDSIs should be identified uniquely, i.e. no other SDSI should have a proportion of mapped reads that exceeds the cutoff. The dotted line at x=5% represents the stringency cutoff that we recommend in practice to detect contamination events.
Extended Data Fig. 9. Deployment of SDSI+AmpSeq to assess for possible nosocomial transmission.
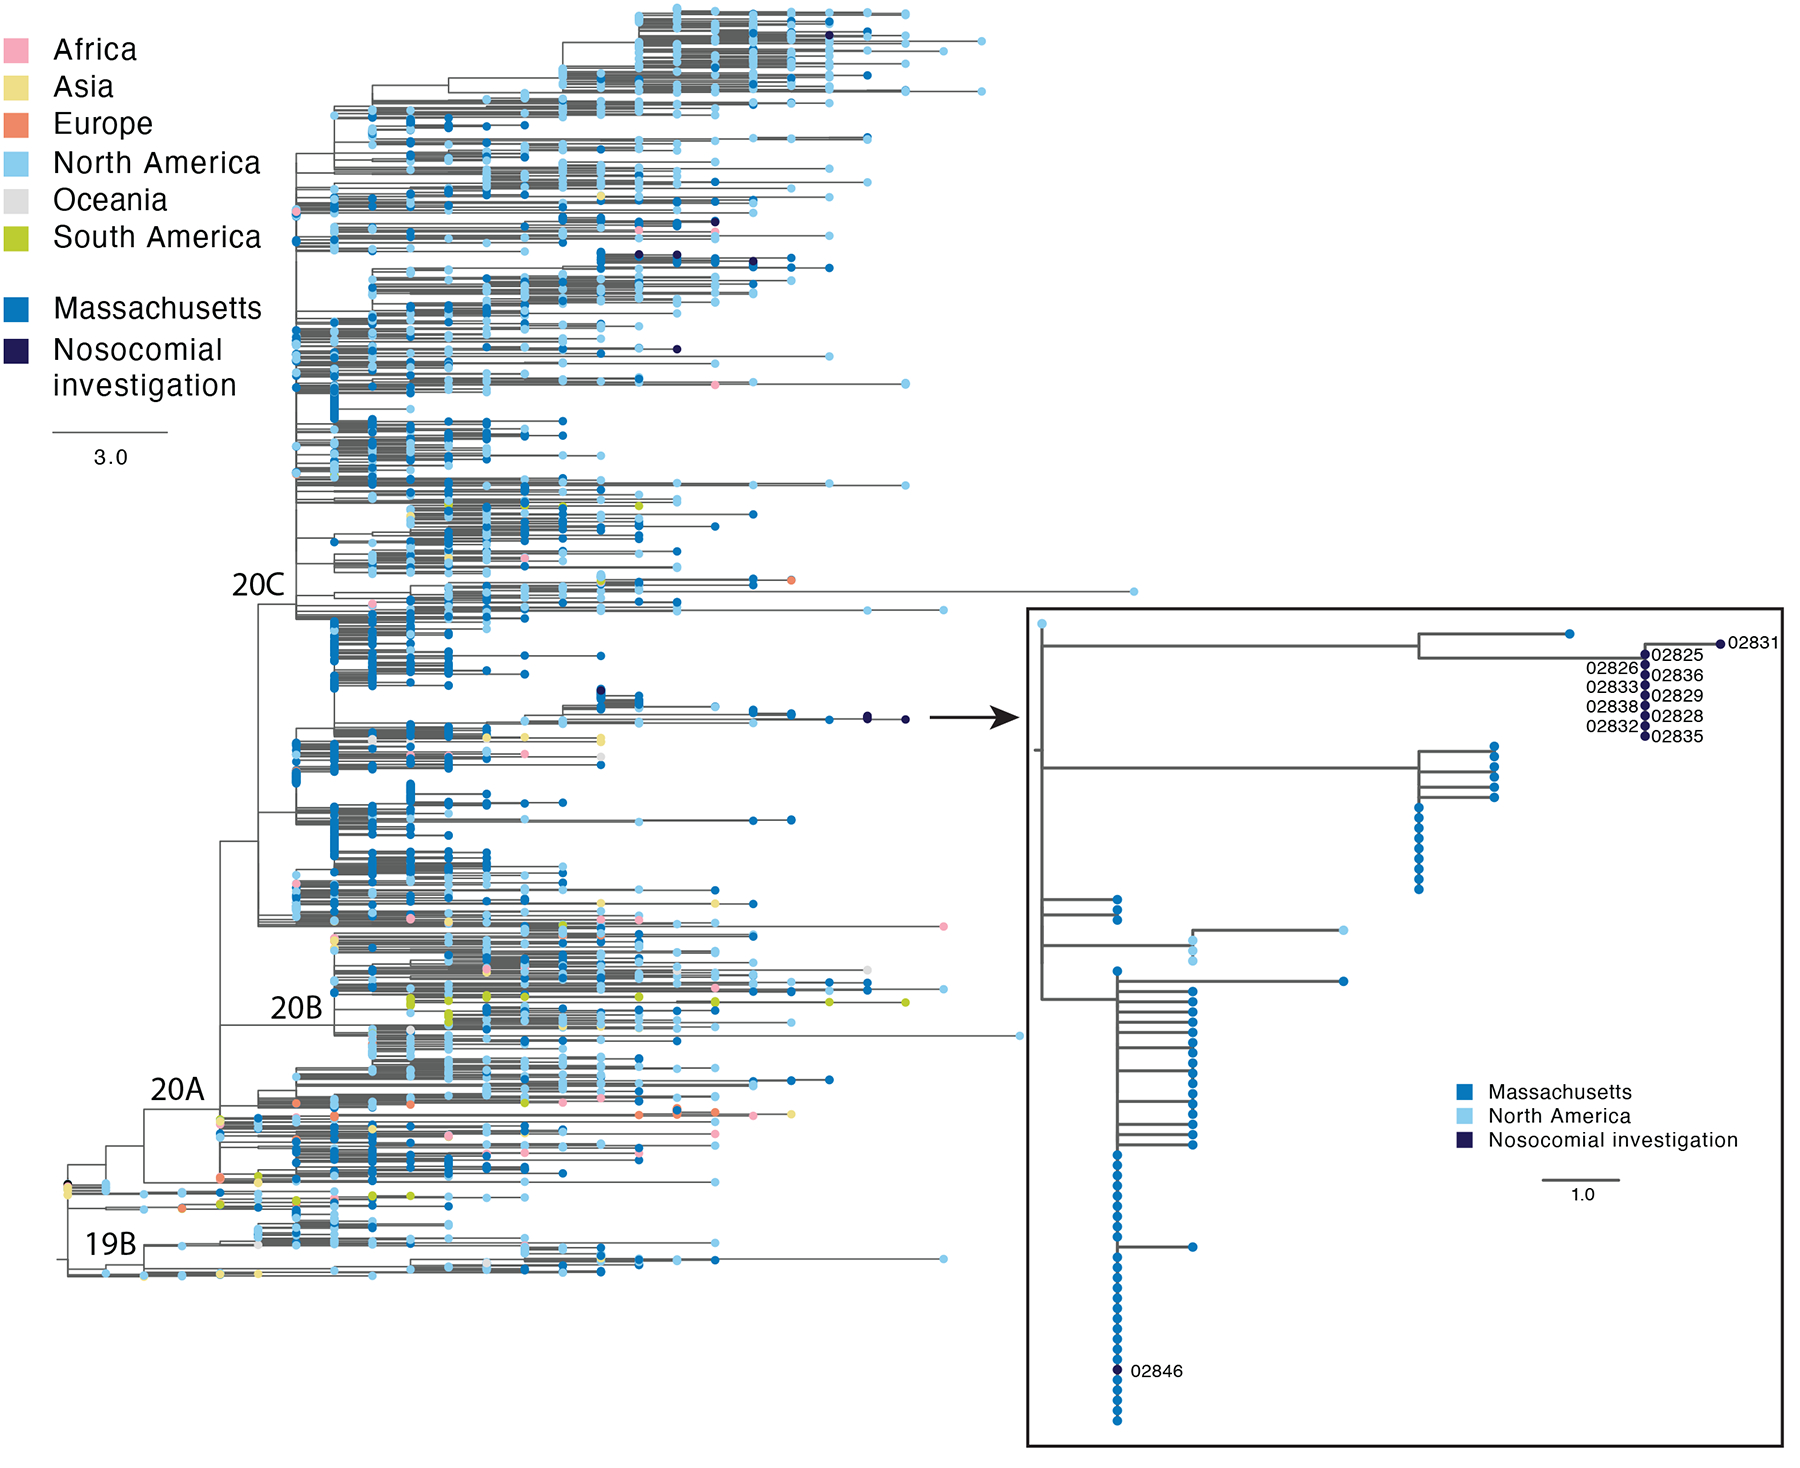
Phylogenetic tree showing the location of the putative cluster sequences in the context of a global subset of circulating SARS-CoV-2 diversity. Zoom box shows the 10 highly similar cluster genomes and one putative cluster sample that was excluded from the cluster based on genome sequence.
Extended Data Fig. 10. Modification enables addition of spike-ins to RNA.
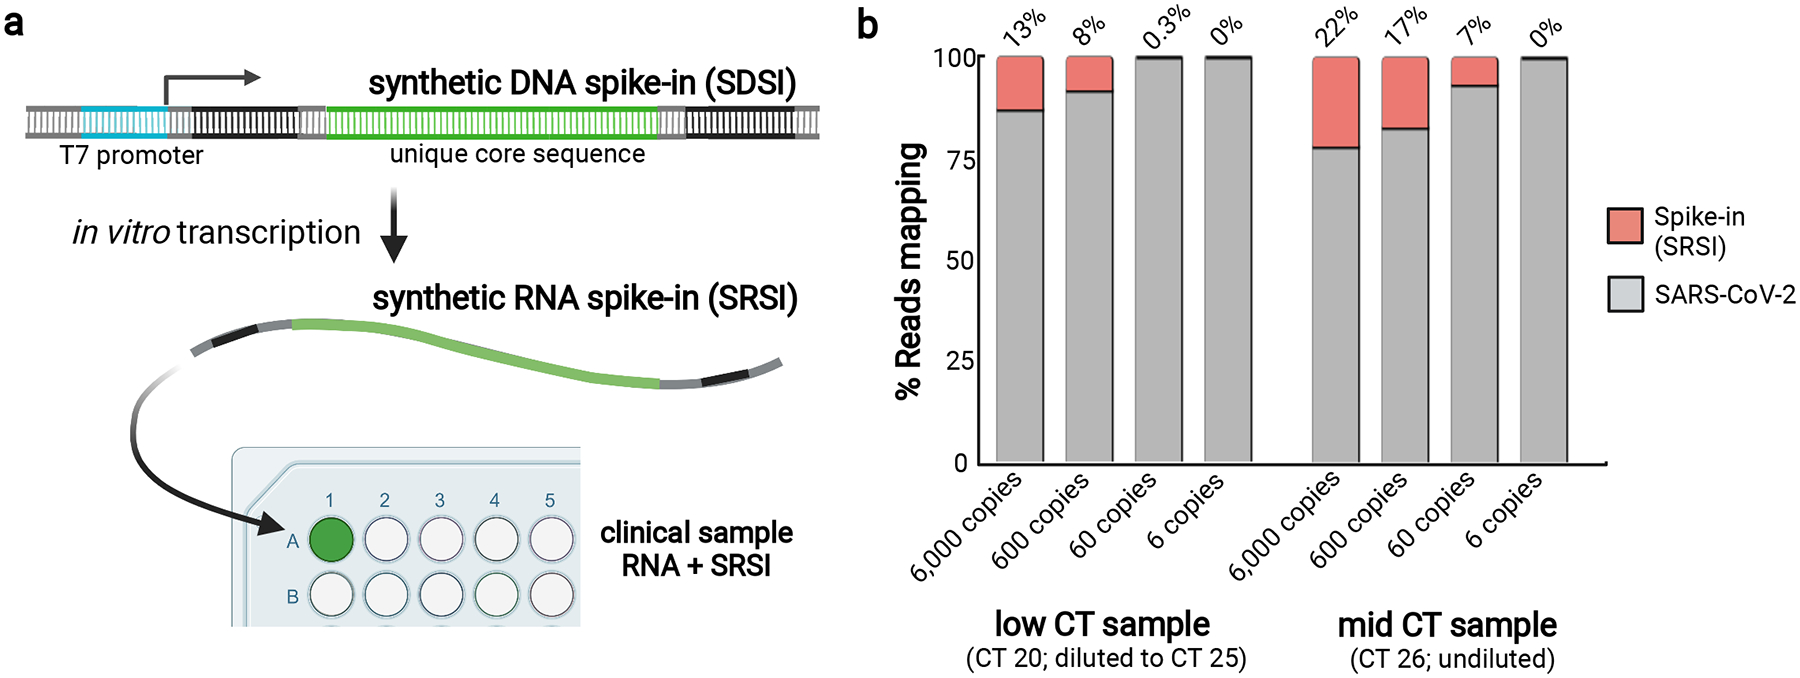
a, A schematic of how to design, produce, and apply synthetic RNA spike-ins (SRSIs). b, A limited titration experiment where SRSIs of varying concentrations were added to two clinical samples with low and intermediate SARS-CoV-2 CTs. SRSIs were added to the sample at the RNA stage; the sample with a low CT (20) was then normalized to CT 25 at the cDNA stage, whereas the sample with mid CT (26) was not normalized.
Supplementary Material
Acknowledgements
We gratefully acknowledge the microbiology laboratory staff and infection control personnel at Massachusetts General Hospital, Massachusetts Department of Public Health, the Rhode Island Department of Health, the Maine CDC, and the Broad Clinical Research Sequencing Platform, and all members of the regional COVID-19 emergency response efforts. We thank Patricia Rodgers and the entire Broad Flow Core Team for sharing laboratory space and equipment. We also thank Kayla Barnes, Sid Raju, and Sameed Siddiqui for valuable feedback and helpful discussions. We gratefully acknowledge the contribution of Ryan Lynch, Mary Barter and the Genome Technologies Service at The Jackson Laboratory. Funding: This work was sponsored by the National Institute of Allergy and Infectious Diseases (U19AI110818 and U01AI151812 to P.C.S.), Centers for Disease Control (75D30120C09605 to B.L.M and baseline surveillance contract 75D30121C1050 to the Clinical Research Sequencing Platform, LLC), Maine CDC (contract to R.T. funded by the Centers for Disease Control ELC NU50CK000523), the Bill and Melinda Gates Foundation (Broad Institute), and the US Food and Drug Administration (HHSF223201810172C), with in-kind support from Illumina, Inc., as well as support from the Herchel Smith Fellowship (K.A.L.), the Doris Duke Charitable Foundation (J.E.L.), the Howard Hughes Medical Institute (P.C.S.), and the National Human Genome Research Institute (K99HG010669 to S.K.R. and R00HG008179 to R.T.). This work is made possible by support from Flu Lab and a cohort of generous donors through TED’s Audacious Project, including the ELMA Foundation, MacKenzie Scott, the Skoll Foundation, and Open Philanthropy. The content is solely the responsibility of the authors and does not necessarily represent the official views of the National Institutes of Health. The funders had no role in study design, data collection and analysis, decision to publish or preparation of the manuscript. We gratefully acknowledge the authors from the originating laboratories responsible for obtaining the specimens and the submitting laboratories where genetic sequence data were generated and shared via the GISAID Initiative used for Extended Data Figure 9 (Supplementary Data File 2). We created Figures 1 and 2b, as well as Extended Data Figures 1, 2b, 2c, 8, and 10 with the aid of Biorender.com.
Footnotes
Competing interests
J.E.L. has received consulting fees from Sherlock Biosciences. P.C.S. is a co-founder of, shareholder in, and scientific advisor to Sherlock Biosciences, Inc., as well as a Board member of and shareholder in Danaher Corporation. M.R.B., K.A.L., E.N., S.K.R., K.J.S., B.L.M., P.C.S are co-inventors on a patent application filed by the Broad Institute relating to methods of this manuscript. The remaining authors report no competing interests.
References
- 1.Washington NL et al. Emergence and rapid transmission of SARS-CoV-2 B.1.1.7 in the United States. Cell 184, 2587–2594.e7 (2021). [DOI] [PMC free article] [PubMed] [Google Scholar]
- 2.Walensky RP, Walke HT & Fauci AS SARS-CoV-2 Variants of Concern in the United States—Challenges and Opportunities. JAMA vol. 325 1037 (2021). [DOI] [PMC free article] [PubMed] [Google Scholar]
- 3.Wang P et al. Antibody resistance of SARS-CoV-2 variants B.1.351 and B.1.1.7. Nature 593, 130–135 (2021). [DOI] [PubMed] [Google Scholar]
- 4.Focosi D, Tuccori M, Baj A & Maggi F SARS-CoV-2 Variants: A Synopsis of In Vitro Efficacy Data of Convalescent Plasma, Currently Marketed Vaccines, and Monoclonal Antibodies. Viruses 13, (2021). [DOI] [PMC free article] [PubMed] [Google Scholar]
- 5.Wang P et al. Increased resistance of SARS-CoV-2 variant P.1 to antibody neutralization. Cell Host Microbe 29, 747–751.e4 (2021). [DOI] [PMC free article] [PubMed] [Google Scholar]
- 6.Naveca F et al. SARS-CoV-2 reinfection by the new Variant of Concern (VOC) P. 1 in Amazonas, Brazil. virological.org (2021).
- 7.Organization WH & et al. Genomic sequencing of SARS-CoV-2: a guide to implementation for maximum impact on public health, 8 January 2021. (2021).
- 8.COVID-19 Genomics UK (COG-UK) consortiumcontact@cogconsortium.uk. An integrated national scale SARS-CoV-2 genomic surveillance network. Lancet Microbe 1, e99–e100 (2020). [DOI] [PMC free article] [PubMed] [Google Scholar]
- 9.Chiara M et al. Next generation sequencing of SARS-CoV-2 genomes: challenges, applications and opportunities. Brief. Bioinform (2020) doi: 10.1093/bib/bbaa297. [DOI] [PMC free article] [PubMed] [Google Scholar]
- 10.Charre C et al. Evaluation of NGS-based approaches for SARS-CoV-2 whole genome characterisation. Virus Evol 6, veaa075 (2020). [DOI] [PMC free article] [PubMed] [Google Scholar]
- 11.Rausch JW, Capoferri AA, Katusiime MG, Patro SC & Kearney MF Low genetic diversity may be an Achilles heel of SARS-CoV-2. Proceedings of the National Academy of Sciences of the United States of America vol. 117 24614–24616 (2020). [DOI] [PMC free article] [PubMed] [Google Scholar]
- 12.Endo A, Centre for the Mathematical Modelling of Infectious Diseases COVID-19 Working Group, Abbott S, Kucharski AJ & Funk S Estimating the overdispersion in COVID-19 transmission using outbreak sizes outside China. Wellcome Open Res 5, 67 (2020). [DOI] [PMC free article] [PubMed] [Google Scholar]
- 13.Lagerborg KA, Watrous JD, Cheng S & Jain M High-Throughput Measure of Bioactive Lipids Using Non-targeted Mass Spectrometry. Methods Mol. Biol 1862, 17–35 (2019). [DOI] [PubMed] [Google Scholar]
- 14.Boja ES & Rodriguez H Mass spectrometry-based targeted quantitative proteomics: achieving sensitive and reproducible detection of proteins. Proteomics 12, 1093–1110 (2012). [DOI] [PubMed] [Google Scholar]
- 15.Chen K et al. The Overlooked Fact: Fundamental Need for Spike-In Control for Virtually All Genome-Wide Analyses. Molecular and Cellular Biology vol. 36 662–667 (2016). [DOI] [PMC free article] [PubMed] [Google Scholar]
- 16.Illumina COVIDSeq Test. https://emea.illumina.com/products/by-type/ivd-products/covidseq.html.
- 17.Jiang L et al. Synthetic spike-in standards for RNA-seq experiments. Genome Res 21, 1543–1551 (2011). [DOI] [PMC free article] [PubMed] [Google Scholar]
- 18.Quail MA et al. SASI-Seq: sample assurance Spike-Ins, and highly differentiating 384 barcoding for Illumina sequencing. BMC Genomics 15, 110 (2014). [DOI] [PMC free article] [PubMed] [Google Scholar]
- 19.Dilucca M, Forcelloni S, Pavlopoulou A, Georgakilas AG & Giansanti A Codon usage and evolutionary rates of the 2019-nCoV genes. Cold Spring Harbor Laboratory 2020.03.25.006569 (2020) doi: 10.1101/2020.03.25.006569. [DOI] [Google Scholar]
- 20.Potapov V & Ong JL Examining Sources of Error in PCR by Single-Molecule Sequencing. PLOS ONE vol. 12 e0169774 (2017). [DOI] [PMC free article] [PubMed] [Google Scholar]
- 21.Lemieux JE et al. Phylogenetic analysis of SARS-CoV-2 in Boston highlights the impact of superspreading events. Science 371, (2021). [DOI] [PMC free article] [PubMed] [Google Scholar]
- 22.So AP et al. A robust targeted sequencing approach for low input and variable quality DNA from clinical samples. NPJ Genom Med 3, 2 (2018). [DOI] [PMC free article] [PubMed] [Google Scholar]
- 23.Grubaugh ND et al. An amplicon-based sequencing framework for accurately measuring intrahost virus diversity using PrimalSeq and iVar. Genome Biol 20, 8 (2019). [DOI] [PMC free article] [PubMed] [Google Scholar]
- 24.Pipelines R&D, D. N. A. et al. COVID-19 ARTIC v3 Illumina library construction and sequencing protocol v5. protocols.io (2020) doi: 10.17504/protocols.io.bibtkann. [DOI] [Google Scholar]
- 25.Lam C et al. Sars-CoV-2 Genome Sequencing Methods Differ In Their Ability To Detect Variants From Low Viral Load Samples. J. Clin. Microbiol JCM0104621 (2021). [DOI] [PMC free article] [PubMed] [Google Scholar]
- 26.Quick J et al. Real-time, portable genome sequencing for Ebola surveillance. Nature 530, 228–232 (2016). [DOI] [PMC free article] [PubMed] [Google Scholar]
- 27.Metsky HC et al. Zika virus evolution and spread in the Americas. Nature 546, 411–415 (2017). [DOI] [PMC free article] [PubMed] [Google Scholar]
- 28.Gohl DM et al. A rapid, cost-effective tailed amplicon method for sequencing SARS-CoV-2. BMC Genomics 21, 863 (2020). [DOI] [PMC free article] [PubMed] [Google Scholar]
- 29.Itokawa K, Sekizuka T, Hashino M, Tanaka R & Kuroda M Disentangling primer interactions improves SARS-CoV-2 genome sequencing by multiplex tiling PCR. PLoS One 15, e0239403 (2020). [DOI] [PMC free article] [PubMed] [Google Scholar]
- 30.Tyson JR et al. Improvements to the ARTIC multiplex PCR method for SARS-CoV-2 genome sequencing using nanopore. bioRxiv (2020) doi: 10.1101/2020.09.04.283077. [DOI] [Google Scholar]
- 31.VarSkip: VarSkip multiplex PCR designs for SARS-CoV-2 sequencing. (Github; ). [Google Scholar]
- 32.ARTIC: nanopore protocol for nCoV2019 novel coronavirus. https://github.com/artic-network/artic-ncov2019 (2020).
- 33.Matranga CB et al. Enhanced methods for unbiased deep sequencing of Lassa and Ebola RNA viruses from clinical and biological samples. Genome Biol 15, 519 (2014) [DOI] [PMC free article] [PubMed] [Google Scholar]
- 34.Elbe S & Buckland-Merrett G Data, disease and diplomacy: GISAID’s innovative contribution to global health. Glob Chall 1, 33–46 (2017) [DOI] [PMC free article] [PubMed] [Google Scholar]
Associated Data
This section collects any data citations, data availability statements, or supplementary materials included in this article.
Supplementary Materials
Data Availability Statement
Sequences and genome assembly data are publicly available on NCBI’s Genbank and SRA databases under BioProjects PRJNA715749, PRJNA622837 and PRJNA648098. GenBank accessions for SARS-CoV-2 genomes newly reported in this study are MW454553 - MW454562. SDSI sequences are reported in Supplementary Data File 1. We performed SDSI homology analyses using NCBI databases [Homo sapiens (taxid:9606), viral (taxid:10239)]. We performed assembly using the assemble_refbased workflow to the following reference fasta: https://www.ncbi.nlm.nih.gov/nuccore/NC_045512.2?report=fasta. Source data are provided with this paper. Additional data are available upon request.


