Abstract
Objective:
To test the hypothesis that the capability of two-dimensional lateral cephalogram in recognizing pharyngeal obstruction is poor compared with the capability of three-dimensional magnetic resonance imaging (MRI) and clinical observation of tonsillar size.
Materials and Methods:
The study participants were 36 prepubertal children (19 male, 17 female; mean age 7.3 ± 1.43 years, range 4.8–9.8 years) with sleep-disordered breathing diagnosed by nocturnal polygraphy. Pharyngeal airway was imaged with a low-field open-configuration MRI scanner. Tonsillar size was clinically determined and lateral skull radiographs were taken and measured. Pearson correlation coefficients were calculated between the clinical, cephalometric, and MRI variables.
Results:
Nasopharyngeal and retropalatal cephalometric variables had a significant positive correlation with the MRI findings. Both techniques showed the narrowest measurement to be located in the retropalatal region. Clinical assessment of tonsillar size correlated inversely with MRI findings such as minimal retropalatal cross-sectional airway area (P = .000), minimal retroglossal cross-sectional airway area (P = .015), and intertonsillar airway width (P = .000). Cephalometric soft palate and tonsillar area correlated with clinical tonsillar size (P = .001).
Conclusions:
The hypothesis is rejected. The findings confirm that the lateral cephalogram is a valid method for measuring dimensions of the nasopharyngeal and retropalatal region. When evaluating oropharyngeal size, clinical assessment of tonsillar size is a relatively reliable method.
Keywords: Airway, Pharynx, MR imaging, Cephalometry, Tonsils
INTRODUCTION
Upper airway size and resistance have been items of interest in orthodontics since several studies have indicated that impaired nasal breathing may be associated with unfavorable dentofacial growth in children.1–3 During the past two decades, there has been a growing awareness of the deleterious effects of pediatric obstructive sleep-disordered breathing (SDB) on the general and craniofacial development in children.4 Childhood obstructive SDB refers to the spectrum of nocturnal breathing disorders characterized by prolonged increased upper airway resistance and partial or complete upper airway obstruction.5 Obstructive sleep apnea (OSA), obstructive hypopnea, upper airway resistance syndrome (UARS), and snoring represent a continuum of sleep-related breathing disorders.5
The methods for evaluating pharyngeal patency in orthodontic practices are limited. Lateral cephalometric radiograph is a conventional orthodontic method used for determining craniofacial morphology and possible airway obstruction. Because of its two-dimensional nature and inability to provide volumetric data, lateral cephalogram has limitations when evaluating three-dimensional upper airway structure.6,7 Thus, the reliability of anteroposterior oropharyngeal airway evaluation on lateral cephalogram can be expected to be poor. Recently, the magnetic resonance imaging (MRI) technique has been increasingly utilized to identify and quantify pharyngeal size as a risk factor for OSA, since it permits accurate three-dimensional measurement of the airway.8
The purpose of this study was to test the validity of two-dimensional cephalometric evaluation of the pharynx as compared with three-dimensional upper airway MRI in children with SDB. In addition, we tested the association of cephalometric and MRI findings with the clinical grading of tonsillar size. The null hypothesis was that cephalometric pharyngeal airway assessment would not correlate strongly with clinical or MRI findings.
MATERIALS AND METHODS
Subjects
The study protocol was approved by the Ethics Committee of Oulu University Hospital, Finland. An informed written consent was obtained from the parents before the subjects entered the study.
The study population consisted of 36 consecutive prepubertal Finnish children (19 boys, 17 girls, mean age 7.3 years, standard deviation 1.43, range 4.8–9.8 years) who participated in a larger project undertaken to investigate the influence of obstructed sleep on dentofacial development at Oulu University Hospital during the years 2000–2002. Inclusion criteria were good general health, normal weight, and no previous orthodontic treatment. Children with known upper airway anomalies, abnormal development, chronic infections, asthma or perennial allergy were excluded. All examined children were diagnosed as having SDB by overnight polygraphy.9 Ten children had mild OSA and nine were found to have UARS. The rest of the children had snoring symptoms without clinically significant apneas, hypopneas, or features of UARS.
MRI Procedures
The children were imaged with a low-field 0.23T open-configuration MRI scanner (Philips Outlook Proview, Philips Medical Systems MR Technologies Finland, Vantaa, Finland). Images were acquired with a standard, commercially available head coil. During the scanning, the subjects were accompanied by a parent. The children were awake and remained in the supine position during the examination.
Contiguous sagittal T1-weighted 3D gradient echo MR images (repetition time [TR] = 24 ms, echo time [TE] = 9 ms, 250 × 250 matrix, field of view [FOV] = 249 mm, 3-mm slice thickness) were acquired centered about the midsagittal plane through the long axis of the airway. Axial sections (TR = 24 ms, TE = 9 ms, 250 × 250 matrix, FOV = 249 mm, 4-mm slice thickness, imaging time = 4 min) of the pharynx were gathered perpendicularly to the tangent of the posterior pharyngeal wall spanning from the top of the nasopharynx to the epiglottis.
The image sets were reviewed and traced manually at a workstation (RadWorks 5.1 software (Applicare Medical Imaging BV, Zeist, Netherlands) by the same investigator. The following airway area variables were registered from MR axial images: (1) the minimal nasopharyngeal cross-sectional airway area (NPCA; mm2); (2) the minimal retropalatal cross-sectional airway area (RPCA; mm2); (3) the minimal retroglossal cross-sectional airway area (RGCA; mm2); and (4) cross-section of the airway area at the level of the epiglottis (ECA; mm2). The cross-sectional airway area was registered in all oropharyngeal slices. The volume of the oropharynx (OPV; mm3) was measured by using the cross-sectional area of each oropharyngeal axial slice and multiplying the cross-sectional area by the slice thickness (4 mm) in order to obtain a volume for each slice. The regional oropharyngeal volume was calculated as a sum of the volume measures of each sequential slice. In addition, minimal intertonsillar airway width (mm) was measured.
Cephalometry
The lateral radiographs were taken in a Cephalix cephalostat (Tagarno AS, Horsens, Denmark). The magnification error was corrected for pharyngeal measurements. The cephalograms were taken with the subjects standing, the head fixed in the cephalostat with ear-rods and support on the forehead, the teeth in the maximum intercuspal position, and the head in natural position.
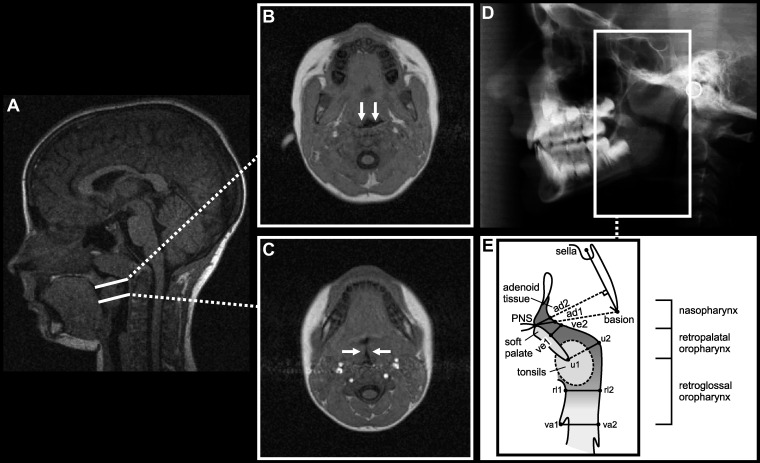
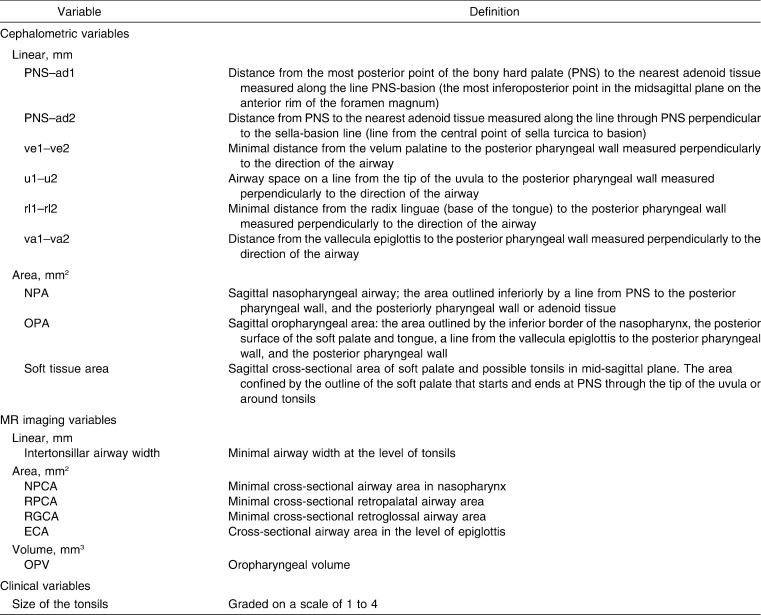
The cephalometric variables used for the description of nasopharyngeal and oropharyngeal airways1,10 are presented in Figure 1 and listed in Table 1. Cephalograms were measured manually by the same investigator (Dr Pirilä-Parkkinen). Nasopharyngeal, oropharyngeal, and soft tissue areas were traced, digitalized, and analyzed by the ImageJ program (Image processing and analysis in Java).
Figure 1.
(A) Midsagittal MRI from a representative child with adenotonsillar hypertrophy and diagnosed OSA. Selected axial scans in (B) retropalatal and (C) retroglossal regions at the level of tonsils from the same subject. Arrows show anteroposterior narrowing of the (B) retropalatal airway and transversal narrowing of the (C) retroglossal airway due to enlarged tonsils. (D) Lateral radiograph of the same child. (E) Schematic presentation of the pharyngeal airway presents the cephalometric variables measured. Definitions of abbreviations are given in Table 1.
Table 1.
Upper Airway Variables Studied
Clinical Assessment of Tonsillar Size
Clinical examination was carried out in the Department of Otorhinolaryngology by the same investigator. The tonsils were graded on a scale of 1 to 4.11 Grade 1 tonsils remain within the tonsillar fossa, grade 2 tonsils do not reach the midline between the anterior faucial pillar and the uvula, grade 3 tonsils extend medially from the midline, and grade 4 tonsils have a maximum distance of 4 mm between them. The size of both right and left tonsil was registered separately, but a single score was used to express tonsillar size in order to simplify statistical analysis. The score of the larger tonsil was used when asymmetric expression of the tonsils existed (in 17% of the cases).
Data Analysis
Descriptive statistics, including means and 95% confidence intervals, were computed for each variable. Pearson correlation coefficients were calculated between the clinical, cephalometric, and MRI variables. P values of ≤ .05 were considered statistically significant.
In order to calculate the error of method, MRI scans and cephalograms of 10 randomly selected children were traced and measured twice, with a 2-week interval between the measurements. The intraclass correlation coefficient values varied from 0.923 to 0.975 for MRI area measurements, from 0.933 to 0.998 for MRI linear measurements, from 0.973 to 0.993 for cephalometric linear measurements, and from 0.856 to 0.892 for cephalometric area measurements.
RESULTS
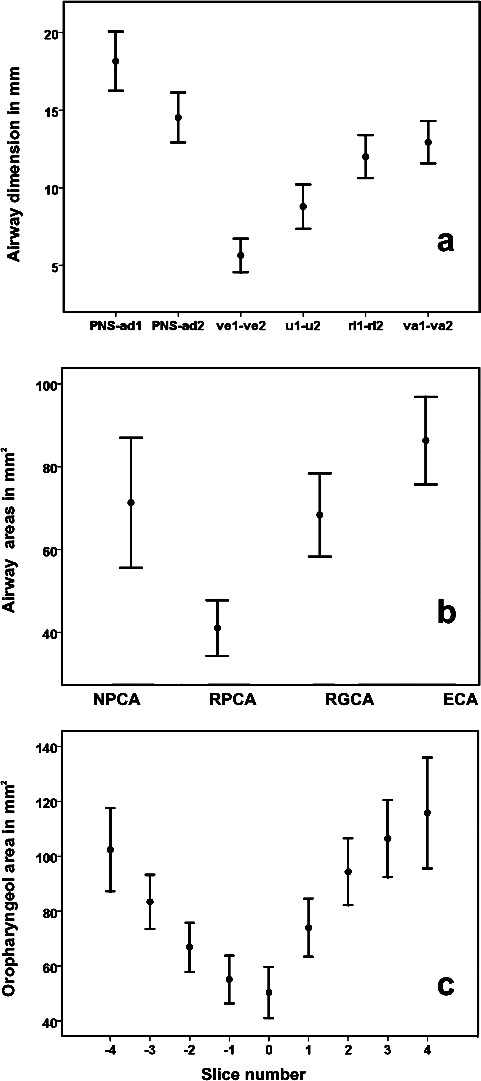
Descriptive statistics for cephalometric and MRI pharyngeal variables are given in Figure 2.
Figure 2.

Means and 95% confidence intervals for (a) cephalometric linear airway measurements (mm), (b) MRI minimal cross-sectional airway area measurements (mm2), and (c) consecutive oropharyngeal MRI measurements (mm2) in children with SDB (n = 36). Slice number 0 represents the tip of the uvula; negative slice numbers, retropalatal measures; and positive slice numbers, retroglossal measures.
Correlations Between Cephalometric and MRI Measurements
Nasopharyngeal cephalometric measurements showed significant correlations with MRI measurements. The nasopharyngeal variable PNS–ad1 showed a significant positive correlation with the minimal NPCA (r = 0.49; P = .002). Also, the PNS–ad2 measurement had a significant positive correlation with NPCA (r = 0.43; P = .009). NPA also correlated with NPCA (r = 0.44; P = .007). Of the oropharyngeal cephalometric variables, ve1–ve2 correlated positively with NPCA (r = 0.41; P = .012), and u1–u2 correlated positively with minimal RPCA (r = .40; P = .017). Cephalometric sagittal soft tissue area correlated negatively with intertonsillar airway width (r = −0.38; P = .02). Cephalometric soft tissue area also correlated with six consecutive oropharyngeal cross-sectional area slices (MRI): slice −2 (r = −0.34; P = .043), slice −1 (r = −0.39; P = .020), slice 0 (r = −0.33; P = .048), slice 1 (r = −0.43; P = .009), slice 2 (r = −0.38; P = 0.021), and slice 3 (r = −0.38; P = .027), where slice number 0 represents the tip of the uvula, and negative and positive slice numbers represent retropalatal and retroglossal measurements, respectively.
Correlations Between Clinical Tonsillar Grading and MRI Measurements
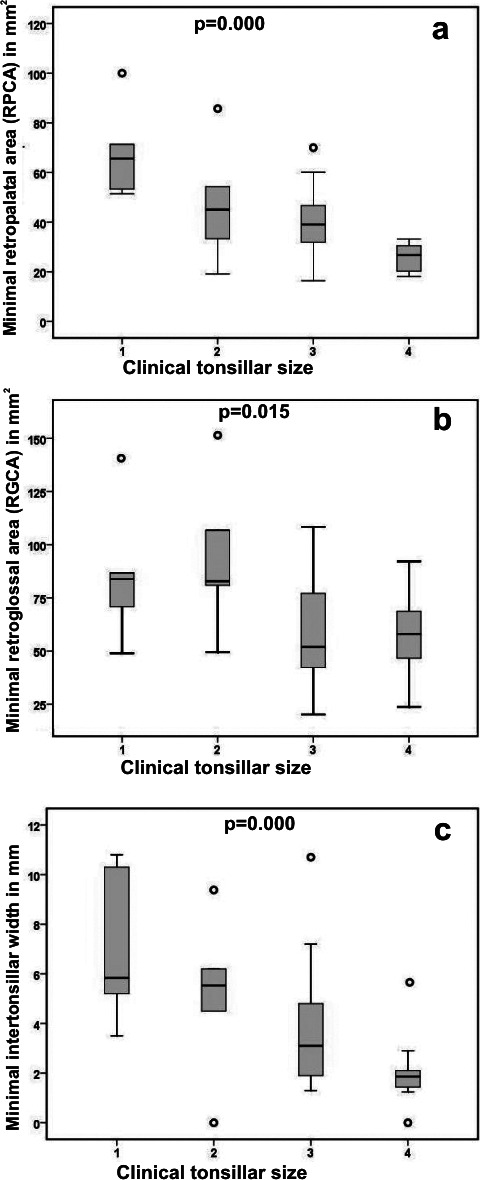
Grade 4 tonsils were observed in 25.0%, grade 3 tonsils in 47.2%, grade 2 tonsils in 13.9%, and grade 1 tonsils in 13.9% of the examined children. Clinical assessment of tonsillar size correlated well with MRI measurements. Tonsillar size correlated negatively with minimal RPCA (r = −0.66; P = .000), minimal RGCA (r = −0.40; P = .015), and intertonsillar airway width (r = −0.55; P = .000) (Figure 3). Tonsillar size also correlated negatively with five consecutive oropharyngeal cross-sectional area slices: slice −1 (r = −0.60; P = .000), slice 0 (r = −0.63; P = .000), slice 1 (r = −0.56; P = .000), slice 2 (r = 0.52; P = .001), and slice 3 (r = −0.41; P = .017), where slice number 0 represents the tip of the uvula, and negative and positive slice numbers represent retropalatal and retroglossal measurements, respectively. Tonsillar size did not correlate with oropharyngeal volume.
Figure 3.

Interrelationships of clinical tonsillar size (grade 1–4) and (a) minimal RPCA (mm2), (b) minimal RGCA (mm2), and (c) intertonsillar airway width (mm). Each box plot represents the median and 25th and 75th percentile. The significances were tested by Pearson correlation.
Correlations Between Cephalometric Measurements and Clinical Tonsillar Grading
Cephalometric airway variables did not correlate with clinical tonsillar size. Cephalometric cross-sectional soft tissue area correlated significantly with clinical tonsillar size (r = 0.51; P = .001).
DISCUSSION
The results of the present study showed an association between the cephalometric nasopharyngeal and retropalatal airway measurements and MRI findings in children with SDB. Both methods also showed the narrowest measurement to be located in the retropalatal airway space. The most common cause for pediatric SDB is adenotonsillar hypertrophy.12 Adenoid tissue locates on the posterior nasopharyngeal wall and may also extend to the retropalatal region. Thus, enlarged adenoid tissue causes anteroposterior reduction in the nasopharyngeal and retropalatal airway, which may explain the correlation with cephalometric linear measurements. Large tonsils may also have an effect on anteroposterior retropalatal airway dimension, especially near the tip of the uvula. Retroglossal pharyngeal measurements, however, did not correlate with MRI variables. Palatal tonsils mainly situate in the retroglossal region. Because of their lateral position, enlarged tonsils cause transversal narrowing of the retroglossal airway, which is not detectable in the anteroposterior view of the cephalogram. However, the size of the tonsils, as judged by clinical observation, correlated significantly with MR imaging measurements and also with the cephalometric soft tissue area.
The validity of lateral radiograph in diagnosing enlarged adenoids and obstructed nasopharynx has been systematically reviewed.13 It has been suggested that cephalogram appears to be a useful tool in diagnosing adenoid size rather than nasopharyngeal airway size. Many previous studies, however, have used subjectively graded adenoid sizes or adenoid volumes removed at surgery as gold standards to which cephalometric measurements have been compared.14–17 The development of SDB depends more on a decreased upper airway size than on the absolute size of the lymphoid tissue.18 For this reason the actual size of pharyngeal airway should be used as a gold standard comparison when evaluating methods for diagnosing obstructed airways.
Posture has a significant effect on pharyngeal size. In the supine position, the oropharyngeal airway decreases while the thickness of both the tongue and soft palate increases due to either gravitational force or changes in upper airway reflexes, which may predispose to increased collapsibility of the upper airway.19,20 The nasopharynx is surrounded by bony structures, whereas the oropharyngeal airway is surrounded by soft tissues,21 which probably explains why the oropharynx is more predisposed to external factors such as posture. A supine MRI thus provides more physiologic information since it is obtained in the usual sleeping posture. A conventional cephalogram, on the other hand, is obtained in the upright natural standing head position. However, postural effect most likely explains why retroglossal variables were not found to be correlating here.
MRI scans were performed with the subjects awake, but they were able to remain still during the scanning, since an open-configuration scanner is more comfortable for children than a standard cylindrical closed-bore scanner. Because of the dynamic changes during the scanning, MRI measurements represent the relative values for the pharyngeal size. Despite lower image quality when compared with high-field units, volumetric analysis of the air spaces was feasible due to high contrast differences between air and soft tissues. On the other hand, only T1-weighted images were obtained, which did not allow differentiation of different soft tissues. Volumetric analysis of lymphoid tissue could therefore not be achieved.
The results of this study showed that clinically graded tonsillar sizes correlated inversely with retropalatal and retroglossal minimal MRI airway measurements. In a previous study, no correlation was found between clinically determined tonsillar size and MRI findings during sleep in children with SDB.22 Tonsillar size was not found to be correlated with oropharyngeal volume in the present study. This may be explained by compensatory increase in oropharyngeal length. Pharyngeal length has been shown to elongate in apneic adults when changing their body position from upright to supine.23
We were not able to have an appropriate control group composed of children with a total absence of upper airway-related problems, since for ethical reasons radiographs cannot be taken from nonsymptomatic children. Previously, SDB children have been shown to have narrower pharyngeal airways compared with nonobstructed children during wakefulness.24–26
Childhood SDB is a relatively common disorder. Its estimated prevalence has varied in the range of 5% to 12%.27 The dental profession may have an important role in the early recognition of pediatric SDB because of its potential orthodontic consequences.28,29 The children with structural narrowing of the pharyngeal airway and history of sleep or breathing difficulties are at high risk and should be referred for consultation and possible overnight sleep registration.
CONCLUSIONS
Using MRI airway measurements as a gold standard, the findings of this study suggest that the lateral radiograph is a useful screening tool when evaluating nasopharyngeal or retropalatal airway size.
Lateral radiographs should not be used, however, as a diagnostic tool, since much of the retroglossal oropharyngeal information is missing from the anteroposterior two-dimensional view.
Clinical inspection of oropharynx and tonsillar size is a relatively reliable method, when oropharyngeal airway size is examined.
REFERENCES
- 1.Linder-Aronson S. Adenoids. Their effect on mode of breathing and nasal airflow and their relationship to characteristics of the facial skeleton and the dentition. Acta Otolaryngol Suppl. 1970;265:1–132. [PubMed] [Google Scholar]
- 2.McNamara J. A., Jr Neuromuscular and skeletal adaptations to altered functions in the orofacial region. Am J Orthod. 1973;64:578–606. doi: 10.1016/0002-9416(73)90290-x. [DOI] [PubMed] [Google Scholar]
- 3.Solow B, Siersbaek-Nielsen S, Greve E. Airway adequacy, head posture, and craniofacial morphology. Am J Orthod. 1984;86:214–223. doi: 10.1016/0002-9416(84)90373-7. [DOI] [PubMed] [Google Scholar]
- 4.Guilleminault C, Lee J. H, Chan A. Pediatric obstructive sleep apnea syndrome. Arch Pediatr Adolesc Med. 2005;159:775–785. doi: 10.1001/archpedi.159.8.775. [DOI] [PubMed] [Google Scholar]
- 5.Carroll J. L. Obstructive sleep-disordered breathing in children: new controversies, new directions. Clin Chest Med. 2003;24:261–282. doi: 10.1016/s0272-5231(03)00024-8. [DOI] [PubMed] [Google Scholar]
- 6.Schwab R. J. Upper airway imaging. Clin Chest Med. 1998;19:33–54. doi: 10.1016/s0272-5231(05)70430-5. [DOI] [PubMed] [Google Scholar]
- 7.Aboudara C. A, Hatcher D, Nielsen I. L, Miller A. A three-dimensional evaluation of the upper airway in adolescents. Orthod Craniofac Res. 2003;6:173–175. doi: 10.1034/j.1600-0544.2003.253.x. [DOI] [PubMed] [Google Scholar]
- 8.Schwab R. J, Pasirstein M, Pierson R, Mackley A, Hachadoorian R, Arens R, Maislin G, Pack A. I. Identification of upper airway anatomic risk factors for obstructive sleep apnea with volumetric magnetic resonance imaging. Am J Respir Crit Care Med. 2003;168:522–530. doi: 10.1164/rccm.200208-866OC. [DOI] [PubMed] [Google Scholar]
- 9.Nieminen P, Löppönen T, Tolonen U, Lanning P, Knip M, Löppönen H. Growth and biochemical markers of growth in children with snoring and obstructive sleep apnea. Pediatrics. 2002;109:e55. doi: 10.1542/peds.109.4.e55. [DOI] [PubMed] [Google Scholar]
- 10.Solow B, Skov S, Ovesen J, Norup P. W, Wildschiødtz G. Airway dimensions and head posture in obstructive sleep apnoea. Eur J Orthod. 1996;18:571–579. doi: 10.1093/ejo/18.6.571. [DOI] [PubMed] [Google Scholar]
- 11.Nieminen P, Tolonen U, Löppönen H. Snoring and obstructive sleep apnea in children. A 6-month follow-up-study. Arch Otolaryngol Head Neck Surg. 2000;126:481–486. doi: 10.1001/archotol.126.4.481. [DOI] [PubMed] [Google Scholar]
- 12.Arens R, Marcus C. L. Pathophysiology of upper airway obstruction: a developmental perspective. Sleep. 2004;27:997–1019. doi: 10.1093/sleep/27.5.997. [DOI] [PubMed] [Google Scholar]
- 13.Major M. P, Flores-Mir C, Major P. W. Assessment of lateral cephalometric diagnosis of adenoid hypertrophy and posterior upper airway obstruction: a systematic review. Am J Orthod Dentofacial Orthop. 2006;130:700–708. doi: 10.1016/j.ajodo.2005.05.050. [DOI] [PubMed] [Google Scholar]
- 14.Holmberg H, Linder-Aronson S. Cephalometric radiographs as a means of evaluating the capacity of the nasal and nasopharyngeal airway. Am J Orthod. 1979;76:479–490. doi: 10.1016/0002-9416(79)90252-5. [DOI] [PubMed] [Google Scholar]
- 15.Jeans W. D, Fernando D. C. J, Maw A. R. How should adenoidal enlargement be measured? A radiological study based on interobserver agreement. Clin Radiol. 1981;32:337–340. doi: 10.1016/s0009-9260(81)80060-8. [DOI] [PubMed] [Google Scholar]
- 16.Maw A. R, Jeans W. D, Fernando D. C. Inter-observer variability in the clinical and radiological assessment of adenoid size, and the correlation with adenoid volume. Clin Otolaryngol Allied Sci. 1981;6:317–322. doi: 10.1111/j.1365-2273.1981.tb01805.x. [DOI] [PubMed] [Google Scholar]
- 17.Cohen L. M, Koltai P. J, Scott J. R. Lateral cervical radiographs and adenoid size: do they correlate? Ear Nose Throat J. 1992;71:638–642. [PubMed] [Google Scholar]
- 18.Arens R, McDonough J. M, Corbin A. M, Rubin N. K, Carroll M. E, Pack A. I, Liu J, Udupa J. K. Upper airway size analysis by magnetic resonance imaging of children with obstructive sleep apnea syndrome. Am J Respir Crit Care Med. 2003;167:65–70. doi: 10.1164/rccm.200206-613OC. [DOI] [PubMed] [Google Scholar]
- 19.Yildirim N, Fitzpatrick M, Whyte K. F, Jalleh R, Wightman A. J. A, Douglas N. J. The effect of posture on upper airway dimensions in normal subjects and patients with the sleep apnoea/hypopnea syndrome. Am Rev Respir Dis. 1991;144:845–847. doi: 10.1164/ajrccm/144.4.845. [DOI] [PubMed] [Google Scholar]
- 20.Pae E. K, Lowe A. A, Sasaki K, Price C, Tsuchiya M, Fleetham J. A cephalometric and electromyographic study of upper airway structures in the upright and supine positions. Am J Orthod Dentofacial Orthop. 1994;106:52–59. doi: 10.1016/S0889-5406(94)70021-4. [DOI] [PubMed] [Google Scholar]
- 21.Fleetham J. A. Upper airway imaging in relation to obstructive sleep apnea. Clin Chest Med. 1992;13:399–416. [PubMed] [Google Scholar]
- 22.Suto Y, Matsuda E, Inoue Y. MRI of the pharynx in young patients with sleep disordered breathing. Br J Radiol. 1996;69:1000–1004. doi: 10.1259/0007-1285-69-827-1000. [DOI] [PubMed] [Google Scholar]
- 23.Pae E. K, Lowe A. A, Fleetham J. A. A role of pharyngeal length in obstructive sleep apnea patients. Am J Orthod Dentofacial Orthop. 1997;111:12–17. doi: 10.1016/s0889-5406(97)70296-8. [DOI] [PubMed] [Google Scholar]
- 24.Arens R, McDonough J. M, Costarino A. T, Mahboubi S, Tayag-Kier C. E, Maislin G, Schwab R. J, Pack A. I. Magnetic resonance imaging of the upper airway structure of children with obstructive sleep apnea syndrome. Am J Respir Crit Care Med. 2001;164:698–703. doi: 10.1164/ajrccm.164.4.2101127. [DOI] [PubMed] [Google Scholar]
- 25.Monahan K. J, Larkin E. K, Rosen C. L, Graham G, Redline S. Utility of noninvasive pharyngometry in epidemiologic studies of childhood sleep-disordered breathing. Am J Respir Crit Care Med. 2002;165:1499–1503. doi: 10.1164/rccm.200111-061OC. [DOI] [PubMed] [Google Scholar]
- 26.Fregosi R. F, Quan S. F, Kaemingk K. L, Morgan W. J, Goodwin J. L, Cabrera R, Gmitro A. Sleep-disordered breathing, pharyngeal size and soft tissue anatomy in children. J Appl Physiol. 2003;95:2030–2038. doi: 10.1152/japplphysiol.00293.2003. [DOI] [PubMed] [Google Scholar]
- 27.Lumeng J. C, Chervin R. D. Epidemiology of pediatric obstructive sleep apnea. Proc Am Thorac Soc. 2008;5:242–252. doi: 10.1513/pats.200708-135MG. [DOI] [PMC free article] [PubMed] [Google Scholar]
- 28.Pirilä-Parkkinen K, Pirttiniemi P, Nieminen P, Tolonen U, Pelttari U, Löppönen H. Dental arch morphology in children with sleep-disordered breathing. Eur J Orthod. 2009;31:160–167. doi: 10.1093/ejo/cjn061. [DOI] [PubMed] [Google Scholar]
- 29.Pirilä-Parkkinen K, Löppönen H, Nieminen P, Tolonen U, Pirttiniemi P. Cephalometric evaluation of children with nocturnal sleep-disordered breathing. Eur J Orthod. 2010 doi: 10.1093/ejo/cjp162. [DOI] [PubMed] [Google Scholar]


