

Abstract
Alzheimer's disease (AD) is an irreversible, progressive brain disorder that impairs memory and cognitive function. Dysregulation of the amyloid‐β (Aβ) pathway and amyloid plaque accumulation in the brain are hallmarks of AD. Aducanumab is a human, immunoglobulin gamma 1 monoclonal antibody targeting aggregated forms of Aβ. In phase Ib and phase III studies, aducanumab reduced Aβ plaques in a dose dependent manner, as measured by standard uptake value ratio of amyloid positron emission tomography imaging. The goal of this work was to develop a quantitative systems pharmacology model describing the production, aggregation, clearance, and transport of Aβ as well as the mechanism of action for the drug to understand the relationship between aducanumab dosing regimens and changes of different Aβ species, particularly plaques in the brain. The model was used to better understand the pharmacodynamic effects observed in the clinical trials of aducanumab and assist in the clinical development of future Aβ therapies.
Study Highlights.
WHAT IS THE CURRENT KNOWLEDGE ON THE TOPIC?
A phase Ib trial and two identically designed phase III trials with aducanumab in patients with early Alzheimer's disease (AD) showed a dose‐dependent reduction of amyloid‐β (Aβ) plaque in the brain.
WHAT QUESTION DID THIS STUDY ADDRESS?
A quantitative systems pharmacology model that integrates the current understanding of the Aβ pathway and the mechanism of action of aducanumab was developed to understand the relationship between dosing regimens and changes of different Aβ species, particularly plaque in the brain.
WHAT DOES THIS STUDY ADD TO OUR KNOWLEDGE?
Increasing aducanumab dose from 1 to 10 mg/kg every 4 weeks not only leads to faster plaque reduction but also results in larger plaque reduction at steady state. The total dose regardless of regimens determines the plaque reduction with aducanumab.
HOW MIGHT THIS CHANGE DRUG DISCOVERY, DEVELOPMENT, AND/OR THERAPEUTICS?
The model can be used to understand the results with aducanumab and other Aβ therapeutics and help find the right dose and design future AD therapies.
INTRODUCTION
Alzheimer's disease (AD) is the most common cause of dementia, which is associated with impairment and progressive loss of memory and cognitive functions. AD progresses slowly, and its prevalence increases with age. 1 As the disease advances, the decline of cognitive and functional abilities leads to a loss of independence for patients. Patients’ disability and dependence during the long duration of illness contributes significantly to the public health impact of AD. 1
AD is characterized primarily by two neuropathologic hallmarks: amyloid plaques containing amyloid‐β (Aβ) peptide in the extracellular space of the brain and neurofibrillary tangles composed of tau localized inside neurons. 2 Although evidence suggests that tau pathology plays a key role in neurodegenerative process and exhibits stronger correlation with clinical symptoms in AD, 3 , 4 , 5 it is believed that the deposition of Aβ in the brain parenchyma is a crucial initial step in the cascade that precedes the development of tau pathology and ultimately leads to the development of AD. 6 AD has been viewed as a continuum spanning from preclinical (asymptomatic with pathology) to clinical phases (symptomatic), 7 , 8 and it is suggested that Aβ deposition takes more than 2 decades before symptoms are observed. 9
A number of therapeutics intended to slow the disease progression, including those targeting Aβ pathway, have failed to show clinical benefits. 10 Aducanumab is a human, immunoglobulin gamma 1 (IgG1) monoclonal antibody (mAb) that selectively targets aggregated forms of Aβ, including soluble oligomers and insoluble fibrillar forms, with much weaker binding to monomers. 11 , 12 , 13 In mice, administration of aducanumab enhanced recruitment of microglia to Aβ plaques, which suggested that antibody‐dependent cellular phagocytosis (ADCP) likely contributes to plaque clearance induced by aducanumab. 11 Moreover, a phase Ib trial and two identically designed phase III trials with aducanumab administered intravenously (i.v.) up to 10 mg/kg every 4 weeks (q4w) in patients with early AD reported dose‐dependent plaque reduction. 11 , 14 Statistically significant improvement on clinical end points was also found in the high‐dose group from the phase Ib and one of the phase III trials but not the other. 14 , 15 The two phase III trials were terminated early based on prespecified interim analyses that suggested futility; however, the data were analyzed according to the prespecified statistical analysis plan. Aducanumab is the first AD therapy approved by the US Food and Drug Administration to reduce a defining pathophysiological feature of the disease, brain Aβ plaques. 14
Quantitative systems pharmacology (QSP) modeling, as an emerging field in the biotech and pharmaceutical industries, formulates mathematical models that integrate mechanistic understanding of biological processes at different levels and data from a variety of sources, such as in vitro, animal, and clinical data, to understand how components interact and contribute to the pharmacological effects of drugs. 16 , 17 , 18 , 19 QSP modeling is an emerging tool with predictive capabilities and complements the widely used population pharmacokinetic (PK)/pharmacodynamic (PD) modeling in drug development.
Several QSP models characterizing the Aβ cascade have been developed to understand the biological process in response to therapeutic modulation. 20 , 21 , 22 , 23 In this article, a QSP model describing aducanumab, an anti‐Aβ agent specifically targeting aggregated Aβ, is presented to enhance our understanding of the pharmacological effects of aducanumab in AD, particularly the relationship between dosing regimens and Aβ plaque reduction. The model integrates the current understanding of the Aβ pathway, the disease, and the mechanism of action of aducanumab. It was calibrated and then validated with available clinical data. The model was subsequently used to identify sensitive parameters and knowledge gaps and to predict changes of brain Aβ species including plaques with various dosing regimens, which will provide insights into the therapeutic effects of aducanumab and inform the future clinical study designs.
METHODS
Model construction
The model was constructed to include the current understanding of Aβ biology for AD and the mechanism of action of aducanumab. The schematics is depicted in Figure 1. Aβ monomer is produced via sequential cleavage of the amyloid precursor protein (APP). APP is first cleaved by β‐secretase to form C terminal fragment of amyloid β protein precursor, which is then cleaved by γ‐secretase to form an Aβ monomer. The γ‐secretase cleavage can happen at different sites within the Aβ sequence, leading to different Aβ isoforms, among which Aβ1‐40 and Aβ1‐42 are the two most prominent peptides found in AD. The monomers in the model represent the sum of Aβ1‐40 and Aβ1‐42, which aggregate to form soluble oligomers, with further aggregation to form insoluble fibrils. 24 , 25 Overall, the model includes three different pools of Aβ species: monomers, soluble oligomers, and insoluble plaques.
FIGURE 1.

Schematic for the quantitative systems pharmacology (QSP) model of amyloid‐β (Aβ) pathway with aducanumab. The model describes Aβ kinetics, including production, degradation, and aggregation; aducanumab kinetics, including pharmacokinetics (PK); binding to Aβ monomer, oligomer, and plaque and ability to induce antibody‐dependent cellular phagocytosis (ADCP) to clear Aβ aggregates; and the transport of soluble Aβ species, drug, and soluble drug–Aβ complexes between compartments. Abeta, amyloid‐β; APP, amyloid precursor protein; BACE, β‐secretase; sBACE, soluble β‐secretase; CSF, cerebrospinal fluid; CTFβ, amyloid β protein precursor; ISF, interstitial fluid
The model primarily comprises three compartments: plasma, cerebrospinal fluid (CSF), and brain interstitial fluid (ISF). An additional peripheral compartment was implemented only to describe aducanumab PK. In the model, Aβ production and degradation occur in brain ISF and plasma, monomer aggregation occurs in all three compartments, and oligomer aggregation to form plaque only happens in brain ISF. The mechanism of action of aducanumab accounted for in the model includes drug distribution and clearance, binding to different Aβ species, and the ability to induce ADCP to clear Aβ aggregates in brain ISF. In addition, the model incorporates intercompartment transport of soluble Aβ monomers and oligomers, drug and soluble drug–Aβ complexes.
Model calibration and validation
The model was informed by a large pool of literature and experimental data on Aβ biology and therapeutics. It was calibrated to simultaneously capture all of the data summarized in Table S1, including concentrations of Aβ monomer, oligomer, and plaque in different compartments prior to treatment, in vivo Aβ kinetics in CSF, aducanumab PK and plasma total Aβ concentration from the single‐ascending dose (SAD) study, and brain plaque data measured by amyloid positron emission tomography (PET) imaging from the placebo‐controlled period of the phase Ib multiple‐ascending dose (MAD) study. Model parameters that were not constrained by these data were informed by literature knowledge (see Table S2 for details).
After the final parameter values were identified through model calibration, the following data sets were used as model validation to compare against model simulations without further modification of parameter values: (i) plasma PK data from the MAD study, (ii) standard uptake value ratio (SUVR) data at Year 2 from the long‐term extension (LTE) of the MAD study, and (iii) 1‐year SUVR data from the dose titration cohort in the MAD study.
SUVR data processing
SUVR is a widely used approach to quantify PET imaging signals and is defined as the ratio of radioactivity in a region of interest to that in a reference region. In aducanumab studies, Aβ burden in the brain was measured by PET with a 18F‐florbetapir ligand. 11 In the model, the percentage change of plaque concentration relative to pretreatment was compared with the percentage change of composite SUVR from baseline, which were calculated as follows:
where the SUVR cutoff value was set to be 1.0 in the model as the value represents the measured region has the same signal as the reference region that has no plaque. It is lower than the cutoff value of 1.10 that discriminates between AD positive and negative for PET with the 18F‐florbetapir ligand, 26 assuming that a small amount of Aβ aggregates also exist in the brain of AD‐negative (healthy) subjects.
Group mean of composite SUVR data from the 1‐year placebo‐controlled period of the MAD study was used for model calibration, whereas data at Year 2 from the LTE of the MAD study was used for model validation.
Sensitivity analysis
To identify parameters whose values have a considerable impact on the model output of plaque reduction with aducanumab treatment, sensitivity analysis was performed. One parameter was changed at a time by a 10‐fold increase or decrease from the nominal value, whereas other parameters were fixed to their nominal values.
Software
The model was implemented using KroneckerBio v0.5.1.1. KroneckerBio is open‐source software (https://github.com/kroneckerbio). The version was tested prior to use and was archived by Applied BioMath (Concord, MA). Simulations were performed using MATLAB 2017 (Mathworks, Natick, MA).
RESULTS
Model calibration
Compelling evidence indicates that plaque accumulation in the brain is near plateau before cognitive impairment occurs 27 , 28 ; thus, it is reasonable to assume that prior to therapeutic intervention, Aβ plaque has reached steady state in patients with early symptomatic AD in the model. The model outputs at steady state without therapeutics were calibrated to match the baseline concentrations of different Aβ species in brain, CSF, and plasma reported or inferred from the literature. In plasma and CSF, Aβ exclusively exists in soluble forms as monomer or oligomer. 29 , 30 , 31 , 32 Aβ monomer concentration was estimated to be approximately 0.1 nM in plasma 29 and approximately 3 nM in CSF. 30 , 31 , 32 In brain ISF, Aβ exists in all three forms, of which the majority belong to the pool of plaque. Aβ soluble oligomer concentration was estimated to be approximately 370 nM, and insoluble plaque concentration was approximately 5500 nM in brain ISF. 33 , 34 In addition to the baseline concentrations of different Aβ species, the model was calibrated to describe the Aβ dynamics data in CSF (Figure S1) as measured by the stable isotope labeling kinetic (SILK) experiment (details of the simulation of SILK in the Supplementary Material) in patients with AD. 35
The model was also calibrated to adequately describe aducanumab plasma PK (Figure 2a), CSF to plasma drug concentration ratio at steady state (Figure S2), and total Aβ data (Figure 2b) with i.v. administration of aducanumab across a range of doses from 0.3 mg/kg to 60 mg/kg from the SAD study in patients with AD. 29 Aducanumab PK characteristics were comparable with a typical IgG1 mAb and were well described by a two‐compartment PK model. 36 The CSF to plasma concentration ratio was approximately 0.5%, as aducanumab appears to have better brain penetration than other mAbs. 11 The plasma total Aβ measures both free Aβ and drug‐bound Aβ and increases post‐aducanumab dosing due to the Aβ‐drug complex having slower clearance compared with free Aβ. This effect is minimal with doses up to 30 mg/kg and becomes only apparent at the highest dose of 60 mg/kg, which is expected based on extremely weak binding between aducanumab and Aβ monomers. Finally, the model was calibrated to capture the brain plaque data in patients with AD measured by amyloid PET imaging during the first year (i.e., 1‐year SUVR data) with aducanumab dosing of 1 mg/kg to 10 mg/kg q4w from the placebo‐controlled period of the MAD study 11 (Figure 2c). The binding affinity between drug and plaque was estimated to be 20 nM to capture the SUVR data, which is different from the reported in vitro measurement. 11 This change is discussed in the Supplementary Material. The final model parameter values are listed in Table S2.
FIGURE 2.
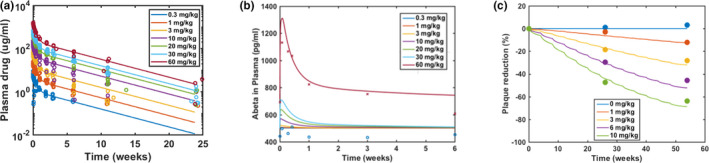
Model calibration to aducanumab pharmacokinetic (PK) and pharmacodynamic data. Model simulations are overlaid with plasma PK and plasma amyloid‐β (Aβ) data from a single‐ascending dose study with aducanumab dosing from 0.3 to 60 mg/kg (a, b), and 1‐year standard uptake value ratio data from a placebo‐controlled period in a phase Ib multiple‐ascending dose study with aducanumab dosing from 1 to 10 mg/kg every 4 weeks (c). In panel b, the red cross symbols represent mean of plasma Aβ data from 60 mg/kg, and the blue open circles represent data from 0.3 mg/kg. Observed data from in‐between doses were indistinguishable from data from 0.3 mg/kg and hence were not shown. Note the baseline Aβ data for 60 mg/kg was higher than the other dose groups. The level of β‐secretase in the model was adjusted only when simulating this particular dose group of this study to match the baseline
Model validation
Data that became available after the initial model development were used for model validation. Because PK data from the SAD study were used for model calibration, PK from multiple q4w i.v. doses of aducanumab was used for validation. Model simulations with multiple‐dose PK agreed well with the PK data from the MAD study (Figure S3). Moreover, plaque reduction with a longer treatment duration and with a new titration dosing regimen were simulated and compared against SUVR data that were not used for model calibration. As shown in Figure 3a, the model predictions of plaque reduction with a 2‐year treatment matched well with the mean SUVR data at Year 2 (Week 110) from the LTE of the MAD study. The subjects from the 1 mg/kg group after 1 year of treatment were switched to the 3 mg/kg group during the LTE. The model accurately predicted the increased reduction in SUVR for this group and continued reduction in SUVR for other groups at the end of Year 2. Furthermore, there was a dose titration cohort with dosing q4w 1 mg/kg for two doses followed by 3 mg/kg for four doses, 6 mg/kg for five doses, and 10 mg/kg for two doses. 37 The model was able to predict the plaque reduction at the end of 1 year with this new dosing regimen (Figure 3b). These results demonstrate the predictive power of the model.
FIGURE 3.
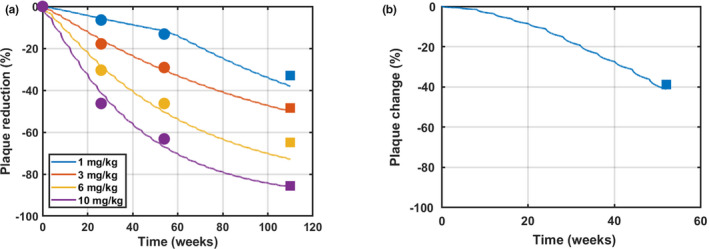
Model validation with additional standard uptake value ratio (SUVR) data with aducanumab. Model simulations are overlaid with SUVR data from a phase Ib multiple‐ascending dose study with aducanumab dosing from 1 to 10 mg/kg every 4 weeks (q4w) (a) and from the dose titration cohort during a placebo‐controlled period (b). In panel a, dot symbols represent data for model calibration from a placebo‐controlled period, and square symbols represent data for model validation from Week 110 in a long‐term extension (LTE) where patients continued receiving the same dose except patients in 1 mg/kg receiving 3 mg/kg in the LTE. In panel b, square symbols represent data for model validation from the dose titration cohort with the following dosing schedule: dosing q4w 1 mg/kg for two doses + 3 mg/kg for four doses + 6 mg/kg for five doses + 10 mg/kg for two doses
Model analysis
The final model was used to simulate plaque reduction with long‐term treatment of 1–10 mg/kg aducanumab q4w up to 10 years (Figure 4a). The results showed that a higher dose led to a faster rate of plaque reduction and a lower steady‐state level, which suggested that the drug‐induced clearance process via ADCP is not saturated within the dose range tested.
FIGURE 4.
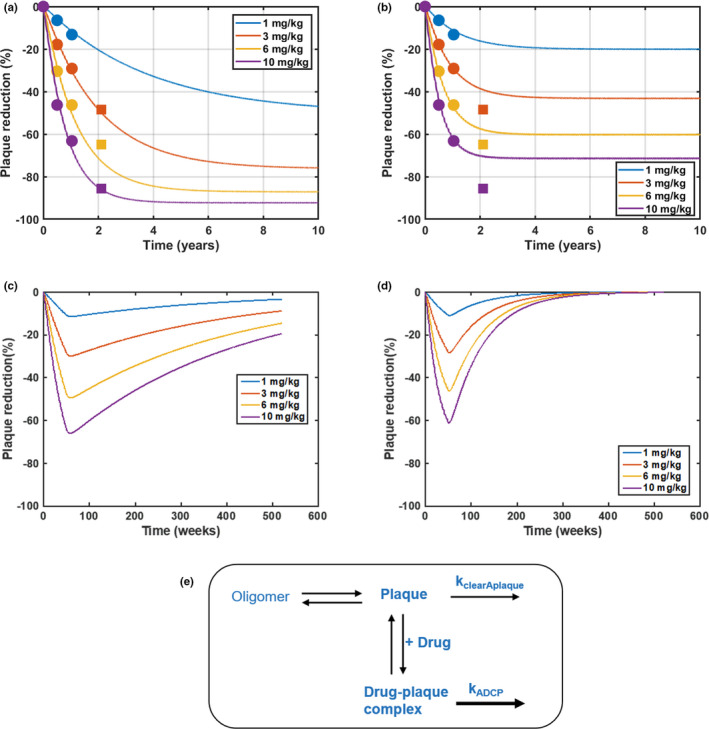
Model predictions and analysis of the effect of aducanumab on plaque reduction in the long term. Simulations of plaque reduction with 10‐year treatment of aducanumab dosing from 1 to 10 mg/kg every 4 weeks (q4w) with a nominal parameter set (slower endogenous turnover) (a) and an alternative parameter set (faster endogenous turnover) (b). The simulations are overlaid with 2‐year standard uptake value ratio data (dot symbols indicate placebo‐controlled period, and square symbols indicate long‐term extension [LTE]) from a phase Ib multiple‐ascending dose study with aducanumab from 1 to 10 mg/kg every 4 weeks (q4w). Note that LTE data for the 1 mg/kg group are not shown here as patients in 1 mg/kg switched to 3 mg/kg in LTE. Model predictions of plaque recovery after the 1‐year treatment of aducanumab dosing from 1 to 10 mg/kg q4w with a nominal parameter set (slower endogenous turnover) (c) and an alternative parameter set (faster endogenous turnover) (d). A schematic to illustrate plaque kinetics in the model (e). kADCP, drug‐induced clearance rate of plaque; kclearAplaque, endogenous clearance rate of plaque
Sensitivity analysis of the model was implemented to identify key parameters impacting plaque reduction with aducanumab treatment over 10 years. Figure S4 shows the results for the sensitive parameters including those related to drug brain penetration, drug binding to plaque, and drug‐induced ADCP as well as the endogenous plaque turnover rate. Almost all of them except the endogenous plaque turnover rate affect both the initial slope and the steady state of plaque reduction. In contrast, the endogenous plaque turnover rate has a minimal influence on the initial slope, but has a significant impact on plaque reduction at steady state, suggesting that this parameter is not constrained by the 1‐year SUVR data.
To explore the impact of this parameter, model calibration was performed again by deliberately fixing the value of the endogenous clearance rate at fivefold from its nominal value and adjusting additional parameters (Table S3) so that the model maintained fitting to all data described in Table S1 including the SUVR data up to 1 year. Fivefold was chosen to ensure the apparent change of plaque kinetics. This new parameter set was called an alternative parameter set with a faster endogenous plaque turnover rate. In the absence of therapeutic, it takes approximately 25 years versus approximately 5 years for plaque to reach steady state prior to treatment in the model with the nominal parameter set (the final model) compared with the alternative parameter set, respectively.
Although the two parameter sets yield similar SUVR changes up to 1 year, they resulted in different plaque reduction with an extended treatment period of aducanumab. Figure 4a,b shows the simulations of plaque reduction with 10‐year treatment overlaid with 2‐year SUVR data. The model with the nominal parameter set predicted SUVR data accurately at Year 2, whereas the model with the alternative parameter set did not. Moreover, at the same dose, the model predicted a larger plaque reduction at steady state with the slower plaque turnover rate compared with the faster plaque turnover rate, which are attributed to several reasons. As illustrated in Figure 4e, the plaque concentration at steady state prior to treatment results from a balance of oligomer aggregation and plaque clearance. With aducanumab binding to plaque and inducing ADCP, it increases plaque clearance, which shifts the steady‐state plaque concentration to a lower level, resulting in plaque reduction from baseline. The plaque reduction at steady state is determined by the difference between the endogenous clearance rate and the drug‐induced clearance rate of plaque. Because the drug‐induced clearance rate must remain the same to capture 1‐year SUVR data (Figure 4a,b), slower endogenous clearance leads to a larger difference of the two rates and hence more plaque reduction with long‐term treatment. In addition, the simulations of plaque reduction with 1‐year treatment followed by 9‐year recovery showed that the slower plaque turnover rate leads to slower recovery (Figure 4c,d), which suggested that the SUVR data after treatment discontinuation can inform this key parameter.
Although plaque accumulation is one of the significant characteristics of AD, evidence indicates that soluble Aβ oligomers are also neurotoxic species in AD. 38 However, currently it is challenging to measure oligomeric species in humans directly. Therefore, the model was leveraged to predict the oligomer changes with 10‐year treatment of aducanumab. The model assumed that aducanumab can clear soluble oligomer through the ADCP process with the same reaction rates as those for plaque. The model predicted a dose‐dependent reduction of oligomer with 1–10 mg/kg q4w doses of aducanumab (Figure 5). However, because of the faster endogenous turnover of oligomer compared with plaque, the percentage reduction of oligomer from baseline at steady state was less than that of plaque at the same dose. Here again, the endogenous turnover rate influenced the reduction at steady state in oligomeric species.
FIGURE 5.

Model predictions of the effect of aducanumab on soluble oligomer in the long term. Simulations of soluble oligomer reduction with 10‐year treatment of aducanumab dosing from 1 to 10 mg/kg every 4 weeks (q4w) with a nominal parameter set (slower endogenous turnover) (a) and an alternative parameter set (faster endogenous turnover) (b). Color “band” reflects the fluctuation of concentration profiles attributed to a relatively fast rebound of soluble oligomer with q4w dosing
Finally, the calibrated and validated model was used to explore alternative dosing regimens; i.v. dosing at a higher level, but less frequently than 10 mg/kg q4w, including 20 mg every 8 weeks, 30 mg/kg every 12 weeks, and 60 mg/kg every 24 weeks, were simulated for 10 years and shown to have similar plaque reduction (Figure 6). This suggested that different combinations of dosing frequency and dose level that lead to equivalent total dose resulted in similar plaque reduction. The results are attributed to the drug‐induced plaque clearance being slower than the drug PK; therefore, the plaque reduction with aducanumab is mostly determined by the total dose (or the area under the curve [AUC] of drug exposure) regardless of dosing regimens.
FIGURE 6.

Model predictions of plaque reduction with aducanumab dosing regimens that have an equivalent total dose. Simulations of plaque reduction with 10‐year treatment of aducanumab with 10 mg/kg every 4 weeks (Q4W), 20 mg/kg every 8 weeks (Q8W), 30 mg/kg every 12 weeks (Q12W), and 60 mg/kg every 24 weeks (Q24W), which have an equivalent total dose. Plaque reduction profiles with these dosing regimens overlap with each other
DISCUSSION
In this work, we developed a QSP model for Aβ kinetics and the mechanism of action of aducanumab, which adequately described the observed PK and PD data in clinical trials and the literature data of the Aβ pathway. The model was able to predict the plaque reduction as measured by Aβ PET SUVR with longer treatment duration and with dose titration, which were not used for model calibration. The validated model was used to predict the drug effect on Aβ plaques and oligomers with various dosing regimens. The model suggested that increasing the dose from 1 to 10 mg/kg q4w of aducanumab not only leads to faster plaque reduction but also results in larger plaque reduction at steady state. Moreover, the total dose (or AUC of drug exposure) determines the plaque reduction with aducanumab, which is mostly attributed to the drug‐induced plaque clearance being much slower than the drug PK. This finding provides a base for dose adjustment for individual patients in the future.
Following the sensitivity analysis of the model, we identified that the endogenous plaque turnover rate is a key parameter for predicting plaque reduction with long‐term treatment of aducanumab. It should be noted that this sensitivity analysis is one‐at‐a‐time local sensitivity analysis, and the results can be further verified by global sensitivity analysis. Despite this limitation, the further analysis of this parameter showed that even though relative short‐term SUVR data such as 1‐year data did not yield accurate estimation of this parameter, SUVR data from longer treatment or the recovery phase could be informative. This also suggested that individual variability in plaque endogenous turnover rate might impact the long‐term treatment effects with aducanumab or other anti‐Aβ therapeutics. As natural plaque clearance is mediated via phagocytosis, 39 potentially the differences in the number or effectiveness of microglial cells among patients could contribute to this variability.
We modeled Aβ aggregation processes as Aβ transport between different pools. Other complex models exist in the literature to describe Aβ aggregation, 22 , 40 but they heavily rely on measurements from in vitro settings, which might not translate to in vivo settings. One could think that the microscopic processes described in these models lead to the distribution of Aβ into the three pools described in our model. Our approach circumvents the need to model different sizes of oligomers and plaques but still accounts for mass balance and different time scales for soluble Aβ species and plaque, allowing us to understand their responses with therapeutics. On the other hand, not modeling the detailed aggregation processes, including nucleation and elongation, is a limitation of this model. In addition to inducing ADCP, aducanumab has been shown to prevent secondary nucleation and inhibition of oligomer formation. 12 Without these microscopic processes specifically incorporated in the model, we might underestimate the effect of aducanumab on oligomer reduction. Meanwhile, inhibition of oligomers reduces the plaque formation. With this mechanism, the rate of plaque reduction is driven by its endogenous clearance rate. On the contrary, the ADCP mechanism reduces plaque by accelerating the clearance. Based on our model simulations, the endogenous clearance is much slower than the plaque reduction observed with aducanumab, suggesting that ADCP is likely to drive the main effect of aducanumab on plaque reduction at least in the early years of treatment.
Currently, we combined Aβ1‐40 and Aβ1‐42 into a single pool for the following reasons: (1) our goal is to understand Aβ kinetics and the effects of aducanumab on macroscopic level; (2) in vitro binding data and plasma Aβ data with aducanumab indicate that aducanumab does not differentially bind Aβ1‐40 and Aβ1‐42 11 ; and (3) Aβ1‐40 and Aβ1‐42 dynamics in CSF measured by SILK experiments are similar. 35 For future work, the current model can be refined to describe Aβ1‐40 and Aβ1‐42 separately. The growing body of evidence suggests that Aβ1‐42 is more prone to aggregation and is the primary component of amyloid plaques, although Aβ1‐40 is more abundant in CSF and plasma. 29 , 31 Therefore, it is possible that Aβ1‐40 and Aβ1‐42 kinetics could be affected differently with therapeutics in CSF 41 and brain ISF despite their similar response in plasma. Moreover, it might be important to model Aβ1‐40 and Aβ1‐42 separately for the disease progression, as natural history data suggest that they change differently over time. 28
The endogenous plaque clearance was assumed to be very slow in the model based on natural history studies showing that SUVR increases over 2 decades before it reaches the steady state. 27 However, the current model was not developed to capture the disease onset or progression, which can be an area of future model development. Another potential area for future investigation would be to link biomarkers such as plaque reduction in the current model to cognitive function change so that the model can make predictions on clinical endpoints. Removal of Aβ plaque with aducanumab has been shown to impact tau in CSF and the brain, 42 which might contribute to clinical improvement in patients with AD. Therefore, expanding the model to include tau mechanisms in the future could help evaluate the interaction between the two pathways and the potential clinical benefit for combination therapy.
In conclusion, a QSP model including biology of the target pathway and mechanisms of action of the drug can be a powerful translational tool to incorporate in preclinical and early clinical data to guide later stage clinical development. The Aβ–aducanumab QSP model provided a priori predictions on SUVR changes with new dosing regimens beyond the current treatment duration, and the effects of aducanumab on soluble oligomer which is currently challenging to measure in humans.
CONFLICT OF INTEREST
L.L., C.S., T.B., K.M., R.R., and I.N. are current Biogen employees and own Biogen stock. F.H., J.F.A., and J.M.B. are current employees of Applied BioMath. C.Y. is a current Takeda employee and owns Takeda stock. L.L. and C.Y. were also former employees of Applied BioMath.
AUTHOR CONTRIBUTIONS
L.L. wrote the manuscript. C.S., J.M.B., and J.F.A. designed the research. L.L., F.H., and C.Y. performed the research. L.L., F.H., C.Y., T.B., K.M., R.R., and I.N. analyzed the data.
Supporting information
Table S1‐S3‐Figure S1‐S4
Supplementary Material
Supplementary Material
Supplementary Material
ACKNOWLEDGMENT
We thank the Biogen team for reviewing and providing feedback on the manuscript.
Lin L, Hua F, Salinas C, et al. Quantitative systems pharmacology model for Alzheimer’s disease to predict the effect of aducanumab on brain amyloid. CPT Pharmacometrics Syst Pharmacol. 2022;11:362‐372. doi: 10.1002/psp4.12759
Funding information
This work was sponsored by Biogen
REFERENCES
- 1. Alzheimer's Association . 2019 Alzheimer's disease facts and figures. Alzheimers Dement. 2019;15(3):321‐387. [Google Scholar]
- 2. Ittner LM, Götz J. Amyloid‐β and tau—a toxic pas de deux in Alzheimer's disease. Nat Rev Neurosci. 2011;12(2):67‐72. [DOI] [PubMed] [Google Scholar]
- 3. Bejanin A, Schonhaut DR, La Joie R, et al. Tau pathology and neurodegeneration contribute to cognitive impairment in Alzheimer’s disease. Brain. 2017;140(12):3286‐3300. [DOI] [PMC free article] [PubMed] [Google Scholar]
- 4. Iaccarino L, Tammewar G, Ayakta N, et al. Local and distant relationships between amyloid, tau and neurodegeneration in Alzheimer's Disease. Neuroimage Clin. 2018;17:452‐464. [DOI] [PMC free article] [PubMed] [Google Scholar]
- 5. Whitwell JL, Graff‐Radford J, Tosakulwong N, et al. Imaging correlations of tau, amyloid, metabolism, and atrophy in typical and atypical Alzheimer's disease. Alzheimers Dement. 2018;14(8):1005‐1014. [DOI] [PMC free article] [PubMed] [Google Scholar]
- 6. Hardy J, Selkoe D. The amyloid hypothesis of Alzheimer's disease: progress and problems on the road to therapeutics. Science. 2002;297(5580):353‐356. [DOI] [PubMed] [Google Scholar]
- 7. Aisen PS, Cummings J, Jack CR, et al. On the path to 2025: understanding the Alzheimer’s disease continuum. Alzheimer's Research Therapy. 2017;9(1):1‐10. [DOI] [PMC free article] [PubMed] [Google Scholar]
- 8. McKhann GM, Knopman DS, Chertkow H, et al. The diagnosis of dementia due to Alzheimer's disease: recommendations from the National Institute on Aging‐Alzheimer's Association workgroups on diagnostic guidelines for Alzheimer's disease. Alzheimers Dement. 2011;7(3):263‐269. [DOI] [PMC free article] [PubMed] [Google Scholar]
- 9. Villemagne VL, Burnham S, Bourgeat P, et al. Amyloid β deposition, neurodegeneration, and cognitive decline in sporadic Alzheimer's disease: a prospective cohort study. Lancet Neurol. 2013;12(4):357‐367. [DOI] [PubMed] [Google Scholar]
- 10. Cummings J, Lee G, Ritter A, Sabbagh M, Zhong K. Alzheimer's disease drug development pipeline: 2019. Alzheimers Dement. 2019;5:272‐293. [DOI] [PMC free article] [PubMed] [Google Scholar]
- 11. Sevigny J, Chiao P, Bussière T, et al. The antibody aducanumab reduces Aβ plaques in Alzheimer’s disease. Nature. 2016;537(7618):50‐56. [DOI] [PubMed] [Google Scholar]
- 12. Linse S, Scheidt T, Bernfur K, et al. Kinetic fingerprints differentiate the mechanisms of action of anti‐Aβ antibodies. Nat Struct Mol Biol. 2020;1‐9. [DOI] [PubMed] [Google Scholar]
- 13. Arndt JW, Qian F, Smith BA, et al. Structural and kinetic basis for the selectivity of aducanumab for aggregated forms of amyloid‐β. Sci Rep. 2018;8(1):1‐16. [DOI] [PMC free article] [PubMed] [Google Scholar]
- 14. ADUHELM (aducanumab‐avwa) [prescribing information]. Biogen Inc.; 2021. [Google Scholar]
- 15. Haeberlein SB, von Hehn C, Tian Y, et al. Emerge and Engage topline results: Phase 3 studies of aducanumab in early Alzheimer’s disease: developments in clinical trials and cognitive assessment. Alzheimers Dement. 2020;16:e047259. [Google Scholar]
- 16. Apgar JF, Tang J‐P, Singh P, et al. Quantitative systems pharmacology model of hUGT1A1‐modRNA Encoding for the UGT1A1 enzyme to treat Crigler‐Najjar syndrome type 1. CPT: Pharmacometrics Syst Pharmacol. 2018;7(6):404‐412. [DOI] [PMC free article] [PubMed] [Google Scholar]
- 17. Bai JP, Earp JC, Pillai VC. Translational quantitative systems pharmacology in drug development: from current landscape to good practices. AAPS J. 2019;21(4):72. [DOI] [PubMed] [Google Scholar]
- 18. Stroh M, Sagert J, Burke JM, et al. Quantitative systems pharmacology model of a masked, tumor‐activated antibody. CPT: Pharma Syst Pharmacol. 2019;8(9):676‐684. [DOI] [PMC free article] [PubMed] [Google Scholar]
- 19. Knight‐Schrijver V, Chelliah V, Cucurull‐Sanchez L, Le Novere N. The promises of quantitative systems pharmacology modelling for drug development. Computat Struct Biotechnol J. 2016;14:363‐370. [DOI] [PMC free article] [PubMed] [Google Scholar]
- 20. Clausznitzer D, Pichardo‐Almarza C, Relo AL, et al. Quantitative systems pharmacology model for alzheimer disease indicates targeting sphingolipid dysregulation as potential treatment option. CPT: Pharm Syst Pharmacol. 2018;7(11):759‐770. [DOI] [PMC free article] [PubMed] [Google Scholar]
- 21. Ferl GZ, Fuji RN, Atwal JK, Sun T, Ramanujan S, Quartino AL. Mechanistic modeling of soluble Aβ dynamics and target engagement in the brain by anti‐Aβ mAbs in Alzheimer’s disease. Curr Alzheimer Res. 2020;17(4):393‐406. [DOI] [PubMed] [Google Scholar]
- 22. Karelina T, Demin O Jr, Demin O, Duvvuri S, Nicholas T. Studying the progression of amyloid pathology and its therapy using translational longitudinal model of accumulation and distribution of amyloid beta. CPT: Pharm Syst Pharmacol. 2017;6(10):676‐685. [DOI] [PMC free article] [PubMed] [Google Scholar]
- 23. Madrasi K, Das R, Mohmmadabdul H, et al. Systematic in silico analysis of clinically tested drugs for reducing amyloid‐beta plaque accumulation in Alzheimer's disease. Alzheimers Dement. 2021;17(9):1487‐1498. [DOI] [PMC free article] [PubMed] [Google Scholar]
- 24. O'Brien RJ, Wong PC. Amyloid precursor protein processing and Alzheimer's disease. Annu Rev Neurosci. 2011;34:185‐204. [DOI] [PMC free article] [PubMed] [Google Scholar]
- 25. Zhang X, Fu Z, Meng L, He M, Zhang Z. The early events that initiate β‐amyloid aggregation in Alzheimer’s disease. Front Aging Neurosci. 2018;10:359. [DOI] [PMC free article] [PubMed] [Google Scholar]
- 26. Landau SM, Breault C, Joshi AD, et al. Amyloid‐β imaging with Pittsburgh compound B and florbetapir: comparing radiotracers and quantification methods. J Nucl Med. 2013;54(1):70‐77. [DOI] [PMC free article] [PubMed] [Google Scholar]
- 27. Jack CR, Wiste HJ, Lesnick TG, et al. Brain β‐amyloid load approaches a plateau. Neurology. 2013;80(10):890‐896. [DOI] [PMC free article] [PubMed] [Google Scholar]
- 28. Bateman RJ, Xiong C, Benzinger TLS, et al. Clinical and biomarker changes in dominantly inherited Alzheimer's disease. N Engl J Med. 2012;367:795‐804. [DOI] [PMC free article] [PubMed] [Google Scholar]
- 29. Ferrero J, Williams L, Stella H, et al. First‐in‐human, double‐blind, placebo‐controlled, single‐dose escalation study of aducanumab (BIIB037) in mild‐to‐moderate Alzheimer's disease. Alzheimers Dement. 2016;2(3):169‐176. [DOI] [PMC free article] [PubMed] [Google Scholar]
- 30. Fukumoto H, Tokuda T, Kasai T, et al. High‐molecular‐weight β‐amyloid oligomers are elevated in cerebrospinal fluid of Alzheimer patients. FASEB J. 2010;24(8):2716‐2726. [DOI] [PubMed] [Google Scholar]
- 31. Sauvée M, DidierLaurent G, Latarche C, Escanyé M‐C, Olivier J‐L, Malaplate‐Armand C. Additional use of Aβ₄₂/Aβ₄₀ ratio with cerebrospinal fluid biomarkers P‐tau and Aβ₄₂ increases the level of evidence of Alzheimer's disease pathophysiological process in routine practice. J Alzheimer's Dis. 2014;41(2):377‐386. [DOI] [PubMed] [Google Scholar]
- 32. Savage MJ, Kalinina J, Wolfe A, et al. A sensitive aβ oligomer assay discriminates Alzheimer's and aged control cerebrospinal fluid. J Neurosci. 2014;34(8):2884‐2897. [DOI] [PMC free article] [PubMed] [Google Scholar]
- 33. Bao F, Wicklund L, Lacor PN, Klein WL, Nordberg A, Marutle A. Different β‐amyloid oligomer assemblies in Alzheimer brains correlate with age of disease onset and impaired cholinergic activity. Neurobiol Aging. 2012;33(4):825.e1‐825.e13. [DOI] [PubMed] [Google Scholar]
- 34. Hellström‐Lindahl E, Viitanen M, Marutle A. Comparison of Aβ levels in the brain of familial and sporadic Alzheimer's disease. Neurochem Int. 2009;55(4):243‐252. [DOI] [PMC free article] [PubMed] [Google Scholar]
- 35. Mawuenyega KG, Sigurdson W, Ovod V, et al. Decreased clearance of CNS β‐amyloid in Alzheimer’s disease. Science. 2010;330(6012):1774. [DOI] [PMC free article] [PubMed] [Google Scholar]
- 36. Kumar Kandadi Muralidharan XT, Kowalski KG, Rajagovindan R, He P, Lin L, Nestorov P. Population pharmacokinetic standard uptake value ratio relationships of aducanumab, an amyloid plaque removing agent in patients with Alzheimer’s disease. CPT: Pharmacometrics Syst Pharmacol. 2022;1(11):7–19. [DOI] [PMC free article] [PubMed] [Google Scholar]
- 37. Viglietta V, O’Gorman J & Williams L et al. Titration dosing of aducanumab: Results of a 12‐month interim analysis from a randomized, double‐blind, placebo‐controlled phase 1b study (PRIME) in patients with prodromal or mild alzheimer’s disease. Neurology. 2017;S7:003. [Google Scholar]
- 38. Jin M, Shepardson N, Yang T, Chen G, Walsh D, Selkoe DJ. Soluble amyloid β‐protein dimers isolated from Alzheimer cortex directly induce Tau hyperphosphorylation and neuritic degeneration. Proc Natl Acad Sci. 2011;108(14):5819‐5824. [DOI] [PMC free article] [PubMed] [Google Scholar]
- 39. Lai AY, McLaurin J. Clearance of amyloid‐β peptides by microglia and macrophages: the issue of what, when and where. Future Neurol. 2012;7(2):165‐176. [DOI] [PMC free article] [PubMed] [Google Scholar]
- 40. Dayeh MA, Livadiotis G, Elaydi S. A discrete mathematical model for the aggregation of β‐Amyloid. PLoS One. 2018;13(5):e0196402. [DOI] [PMC free article] [PubMed] [Google Scholar]
- 41. Biogen and FDA . Combined FDA and Applicant (Biogen) Peripheral and Central Nervous System Drugs Advisory Committee Briefing Document. 2020. Accessed January 21, 2022. https://www.fda.gov/media/143502/download
- 42. Budd‐Haeberlein S, Von Hein C, Tian Y, Chalkias S & Muralidharan K EMERGE and ENGAGE topline results: two phase 3 studies to evaluate aducanumab in patients with early Alzheimer’s disease. Paper presented at: Clinical Trials on Alzheimer’s Disease Conference; 2019. December 04–07, 2019; San Diego, CA.
Associated Data
This section collects any data citations, data availability statements, or supplementary materials included in this article.
Supplementary Materials
Table S1‐S3‐Figure S1‐S4
Supplementary Material
Supplementary Material
Supplementary Material