

Abstract
Introduction
Racial disparities in Alzheimer's disease (AD) and all‐cause dementia (DEMENTIA) incidence may exist differentially among men and women, with unknown mechanisms.
Methods
A retrospective cohort study examining all‐cause and AD dementia incidence was conducted linking Third National Health and Nutrition Examination Survey (NHANES III) to Centers for Medicare & Medicaid Services Medicare data over ≤26 years of follow‐up (1988 to 2014). Cox regression and generalized structural equation models (GSEMs) were constructed among men and women ≥60 years of age at baseline (N = 4592). Outcomes included onset ages of all‐cause and AD dementia, whereas the main exposures were race/ethnicity contrasts (RACE_ETHN). Potential mediators) included socio‐economic status (SES), lifestyle factors (dietary quality [DIET] nutritional biomarkers [NUTR], physical activity [PA], social support [SS], alcohol [ALCOHOL], poor health [or HEALTH], poor cognitive performance [or COGN]. In addition to RACE_ETHN, the following were exogenous covariates in the GSEM and potential confounders in Cox models: age, sex, urban‐rural, household size, and marital status.
Results
Non‐Hispanic Black (NHB) women had a higher risk of DEMENTIA versus non‐Hispanic White (NHW) women in GSEM, consistent with Cox models (age‐adjusted model: hazard ratio [HR] = 1.34, 95% confidence interval [CI]: 1.10 to 1.61). The total effect of this RACE_ETHN contrast in women was explained by four main pathways: (1) RACE_ETHN→ poor cognitive performance (COGN, +) → DEMENTIA (+); (2) RACE_ETHN → SES (−) → COGN (−) → DEMENTIA (+); (3) RACE_ETHN → SES (−) → physical activity (PA, +) → COGN (−) → DEMENTIA (+); and (4) RACE_ETHN → SES (−) → DIET (+) → COGN (−) → DEMENTIA (+). A reduced AD risk in Mexican American (MA) women versus NHW women upon adjustment for SES and downstream factors (HR = 0.53, 95% CI: 0.35 to 0.80). For the non‐White versus NHW contrast in incident DEMENTIA, pathways involved lower SES, directly increasing cognitive deficits (or indirectly through lifestyle factors), which then directly increases DEMENTIA .
Discussion
Socioeconomic and lifestyle factors explaining disparities between NHB and NHW in dementia onset among women are important to consider for future observational and intervention studies.
Keywords: aging, Alzheimer's disease, dementia, modifiable risk factors, racial disparities, structural equations modeling
1. BACKGROUND
Dementia prevalence among older adults (≥60 years) is estimated at ≈4.7% globally, 1 with 60% to 80% caused by Alzheimer's disease (AD). 1 AD, a multi‐factorial neurodegenerative disorder, manifests as a progressive decline in episodic memory and other domains of cognition. 2 In developed countries, AD is considered a principal cause for disability 3 and health care burden in old age. 4
Approximately 5 million US adults ≥65 years of age currently have AD, with an expected rise to 13.9 million by 2060. 5 Modifiable and non‐modifiable risk and protective factors have been studied in relation to AD and all‐cause dementia (DEMENTIA). Although genetics explains a small fraction, ≈50% of Late Onset Alzheimer's Disease (LOAD) risk is explained by education, smoking, physical inactivity, depression, mid‐life obesity, hypertension, and type 2 diabetes. 6 Among US middle‐aged and older adults, large racial and gender disparities prevail in those risk factors. 7 , 8 , 9
Notwithstanding methodological issues behind race/ethnicity definitions, these constructs may reflect environmental risk factors affecting AD‐related gene expression and cardiometabolic disorders. 10 Mid‐life obesity was associated with incident AD among women, 11 and non‐Hispanic Black (NHB) women bear the greatest burden of the obesity epidemic, in contrast to non‐Hispanic White (NHW) women. 12 The ethnic elderly population is rising with increased life expectancy, accentuating AD‐related health care needs 13 and longer survival in AD reported among NHBs/Hispanics versus NHWs. 14 Medicare data show that women's AD prevalence exceeds that of men, with older NHBs having higher AD prevalence compared to NHWs, Hispanics falling in mid‐range, and the lowest prevalence among Asians/Pacific Islanders. 5
Whether AD/DEMENTIA onset times are earlier among minority groups compared to NHW overall, and in a sex‐specific manner, remains uncertain, with related mediating pathways unexplored. We use the Third National Health and Nutrition Examination Survey (NHANES III) data linked to Medicare data to examine racial and ethnic disparities in AD/DEMENTIA incidence while investigating disparities through pathways incorporating socio‐economic, lifestyle, and health‐ and cognition‐related factors among older men and women.
2. METHODS
2.1. Database
NHANES is a series of cross‐sectional surveys providing nationally representative data on US population health and nutritional status using a stratified, multi‐stage probability cluster design sampling methodology. NHANES consists of in‐home interviews on basic health and demographics followed by in‐depth examinations in mobile examination centers (MECs). 15 Appendix I details Centers for Medicaid & Medicare (CMS)‐Medicare and National Death Index (NDI) linkage methodologies. The institutional review board of the National Institute on Aging, Intramural Research Program approved this study for ethical treatment of participants.
2.2. Study sample
Figure S1 details participant selection and numbers of incident AD and DEMENTIA cases. We selected NHANES III (1988 to 1994) participants ≥60 years of age, with complete data on cognitive performance tests, CMS‐Medicare data, with HMO exclusion. Thus, of the initial 33 199 participants (aged 1 to 90 years) recruited in NHANES III (1988 to 1994), our final sample consisted of 4592 participants. No other exclusions were applied because of multiple imputation (% missing <10% beyond cognitive performance test exclusion).
RESEARCH IN CONTEXT
Systematic Review: Among US middle‐aged and older adults, racial and gender disparities prevail in dementia risk factors. 7 , 8 , 9 , 10 It is uncertain whether Alzheimer's disease (AD) or all‐cause dementia occur earlier among minority groups compared to non‐Hispanic Whites (NHWs) overall in a sex‐specific manner and through which mediating pathways.
Interpretation: In a retrospective cohort study linking Third National Health and Nutrition Examination Survey (NHANES III) to Medicare claims data over ≤26 years of follow‐up, we constructed Cox regression and generalized structural equation models (GSEMs) among individuals ≥60 years at baseline (N = 4592). Non‐Hispanic Black (NHB) women were at greater dementia risk than NHW women (hazard ratio = 1.34, 95% confidence interval [CI]: 1.10 to 1.61), a total effect explained by four pathways: socio‐economic status, diet, physical activity, and cognition among mediators.
Future directions: Socio‐economic and lifestyle factors explaining disparities between NHB and NHW in dementia onset among women are important to consider for future observational and intervention studies.
2.2.1. Incident AD and DEMENTIA
We defined AD and DEMENTIA diagnoses using detailed information obtained from the CMS Chronic Condition Data Warehouse Categories. AD was diagnosed using International Classification of Diseases, Ninth Revision (ICD‐9) code 331.0. DEMENTIA was defined with ≥1 codes of 331.0 and several others listed in Appendix I. Age, used as the underlying time scale, was calculated with earliest occurrence starting from MEC examination age using exact dates. The follow‐up period was 1999 to 2014 for pre‐estimated earliest occurrence date, readily provided for 21 chronic conditions. 16 For the non–pre‐estimated data of earliest occurrence and using raw CMS linkage data, we utilized the same algorithm to estimate AD or all‐cause dementia's earliest diagnosis date to cover the missing period of 1991 to 1998. 17 This produced a full follow‐up period from January 1, 1988 to January 1, 2014, with incident outcomes potentially occurring starting from January 1, 1991 and censoring due to death occurring at any time after the examination until January 1, 2014. Thus, the maximum follow‐up time was ≈26 years.
2.2.2. Exposure and effect modifier
Key study exposures were racial/ethnic contrasts (RACE_ETHN), with NHW as the common referent in most analyses. The other categories were "non‐Hispanic Black" (NHB), "Mexican American" (MA) and "Other race/ethnicities" (OTHER). "Non‐White" grouped all three of these groups, namely NHB, MA and OTHER. Race/ethnicity and sex were self‐identified; the latter was the main effect modifier.
2.3. Mediators
2.3.1. Socio‐economic status
Socio‐economic status (SES) combined continuous poverty income ratio (PIR) and education (years) into a single z‐score, taking the average of education and PIR z‐score, after a principal components analysis (PCA) was conducted.
2.3.2. Lifestyle factors
Lifestyle factors included the constructs of smoking amount and history (“SMOKING),” amount of alcohol consumed (“ALCOHOL),” diet quality (“DIET”), nutritional biomarkers (“NUTR”), physical activity (“PA”) and social support (“SS”) (Appendix II). Their operationalization was similar to SES, whereby positively correlated measured variables within each construct, based on PCA, were combined, taking the mean of respective standardized z‐scores. In NHANES III, 24‐hour dietary recall interviews were conducted by the MEC staff using the interactive Dietary Data Collection systems. Upon estimation of nutrient intakes using an NHANES III database, 18 two measures of diet quality were derived: 1995‐Healthy Eating Index (1995‐HEI) 19 and mean adequacy ratio score (MAR). 20 , 21 “DIET” combined those two total scores, using averaging of z‐scores, while “NUTR” combined serum folate, vitamin A, vitamin E, and total carotenoids. Alcohol use (grams/day) consisted of one item from NHANES III 24‐hour dietary recall, which was z‐scored (ALCOHOL). “PA” combined three items comparing activity to past year, age peers, and self, 10 years ago, respectively; SMOKING was measured with two items, reflecting number and years of cigarettes smoked; “SS” with five items, combined into one z‐score, reflecting the frequency of five types of contacts: (1) telephone with family, friends, or neighbors; (2) getting together with friends or relatives; (3) visit with neighbors; (4) attending church or religious services; and (5) attending meetings at clubs or organizations.
2.3.3. Poor health construct
The construct of “HEALTH” was operationalized with four ordinal or continuous items, namely self‐rated health, co‐morbidity index, body mass index (BMI, weight/height‐squared, kg/m2), and the allostatic load (AL) score, coded to reflect poorer health with higher score (average of 4 z‐scores). Components of the “HEALTH” factor are detailed in Appendix II. 22
2.3.4. Cognitive performance tests and poor cognition (COGN) summary PCA score
A battery of cognitive performance test scores was available in an NHANES III sub‐sample ages ≥ 60 years. Four test scores were combined into a summary PCA score, reflecting poorer performance with higher score (COGN). Tests used are Word recall, Story recall, Math/arithmetic test (Serial 3′s), from which four scores were derived (Appendix III).
2.3.5. Covariates
Exogenous covariates were defined as variables predicting both mediators and final outcomes in all generalized structural equation models (GSEMs). Those included continuous baseline age (y), sex (in unstratified models), marital status (1 = Never married, 2 = Married, 3 = Divorced, 4 = Widowed, 5 = Other), household size, and urban‐rural residence (1 = Urban, 2 = Rural). These covariates were also included among potentially confounding covariates in Cox proportional hazards models and as exogenous variables in GSEMs.
2.4. Statistical methods
We used Stata 16.0 (StataCorp, College Station, TX). 23 All analyses accounted for sampling design complexity 24 by incorporating sampling weights, primary sampling units, and strata. We used multivariate imputation by chained equations 25 for all covariates except for cognitive performance and socio‐demographics. Population means, proportions, and regression coefficients were estimated using survey (svy) commands and standard errors (SE) with Taylor series linearization. 24 Most analyses (except for “non‐Whites” to NHW contrast) were stratified by sex. Comparison across race/ethnicity groups were made using svy:reg and svy:mlogit commands, comparing means and proportions of key variables.
We defined time‐to‐event (in years) from age at entry ≥60 years (ie, delayed entry) until age of exit when event of interest or censoring (death or end of follow‐up) occurred. Incidence rates (IRs, with 95% CIs) of DEMENTIA and AD were computed across race/ethnicity groups by sex. Nested and sex‐stratified Cox proportional hazards (PH) models for these two outcomes were conducted on imputed data whereby socio‐demographic, SES, lifestyle, health, and cognitive performance factors were entered consecutively in five models. Heterogeneity of race effects by sex was also tested. Mediating effects were examined using discrete‐time survival analysis within a GSEM framework, accounting for sampling design complexity within imputed data, a method deemed optimal for causal mediation in survival analysis. 26 Within GSEM, Logit AD or DEMENTIA hazards were final outcomes in person‐period data, namely 5‐year periods from age at entry until exit, with ≤6 age periods (65 to 70 years to 85+ years [referent category]). The GSEMs tested mediating pathways between RACE_ETHN (NHB vs NHW; MA vs NHW; MA vs NHB; non‐White vs NHW) and the main outcomes (Logit(Hazards) for incident AD and/or DEMENTIA), in a structured manner, adjusting for exogenous socio‐demographic variables. For simplicity, only DEMENTIA was modeled against non‐White versus NHW. The main pathways dictate that the SES z‐score can predict six constructs, namely “ALCOHOL,” “DIET,” “NUTR,” “PA,” “SMOKING,” and “SS,” each of which predicted the “HEALTH” standardized z‐score. The latter was allowed to predict “COGN” (higher z‐score → poorer performance), which was hypothesized to directly influence AD/DEMENTIA risk. It is important to note that other pathways were also allowed, including those between endogenous variables and between RACE_ETHN and each endogenous variable (Figure 1).
FIGURE 1.
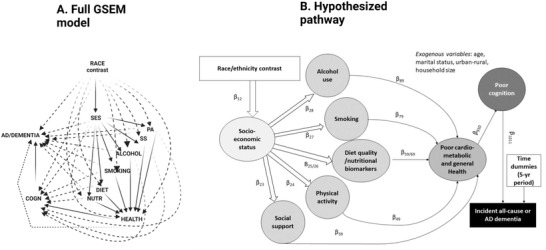
Full generalized structural equation model (GSEM) and hypothesized pathway. AD = Alzheimer's disease; ALCOHOL = alcohol consumption, z‐score; COGN = cognitive performance principal component variable (four measured variables); DIET/NUTR = diet and nutritional biomarkers z‐score variable (two dietary quality measures and four nutritional biomarkers); HEALTH = health‐related factors as mean of z‐scores for allostatic load, self‐rated health, co‐morbidity index and body mass index; LIFESTYLE = lifestyle‐related factors composed of social support, physical activity, diet/nutritional biomarkers, smoking, and alcohol consumption using means of z‐scores for related measured variables; MA = Mexican American; NHANES III = Third National Health and Nutrition Examination Survey; NHB = non‐Hispanic Black; NHW = non‐Hispanic White; PA = physical activity z‐score variable (three measured variables); RACE_ETHN = racial/ethnic contrast; SES = socio‐economic status mean of z‐scores composed of poverty income ratio and education (years); SMOKING = smoking z‐score variable (two measured variables); SS = social support z‐score variable (five measured variables). See Methods section for more details. Notes: Plain arrows are statistically significant associations (P < 0.05) within the hypothesized pathway; dashed arrows are statistically significant associations (P < 0.05) outside the hypothesized pathway
GSEM was conducted by averaging results across five imputations, using Rubin's rule. 27 From these results, direct effects are presented in a structured manner to represent the main pathway, direct effects into final AD/DEMENTIA outcomes, relationships between endogenous variables outside the main pathway, and direct effects of RACE_ETHN outside the main pathway. Several indirect effects were also estimated by multiplying and adding effects going from race/ethnicity into the final outcome and passing through each serial mediator. 28 Specifically, six specific pathways were tested, allowing for all direct effects: (A) RACE_ETHN → SES → AD/DEMENTIA OUTCOMES; (B) RACE_ETHN → SES →LIFESTYLE → AD/DEMENTIA OUTCOMES; (C) RACE_ETHN → SES → LIFESTYLE → HEALTH → AD/DEMENTIA OUTCOMES; (D) RACE_ETHN → SES → LIFESTYLE → HEALTH → POOR COGNITIVE PERFORMANCE (COGN) → AD/DEMENTIA OUTCOMES; (E) RACE_ETHN→SES→COGN→AD/DEMENTIA; and (F) RACE_ETHN→SES→LIFESTYLE→COGN→DEMENTIA, with (D) hypothesized to be the main pathway. For each RACE_ETHN, those pathways were tested by sex, and the total effect (RACE_ETHN→ AD/DEMENTIA OUTCOME) was determined in a model where only exogenous variables included. Those same total/indirect effects were tested overall in another GSEM (DEMENTIA) with “non‐White versus NHW” contrast, adjusting for age, sex, and other exogenous covariates, combining indirect effects across imputations using Rubin's rule. 27 Type I error was set at 0.05.
3. RESULTS
In this sample of older adults (≥60 years), DEMENTIA had an IR of 26.9 failures/1000 person‐years (P‐Y) with a 95% CI: 25.3 to 28.7. NHB women had the highest IR of 33.5 failures/1000 P‐Y (95% CI: 29.0 to 38.7), resulting in an expected median survival age, whereby the cumulative survival function is 0.50, which is 3.9 years younger than among NHW (87.4 years with interquartile range [IQR]: 80 to 95 year vs 90.9 years with IQR: 83.9 to 96.7). For AD, the overall IR was 12.9 failures/1000 P‐Y (95% CI: 11.9 to 14.0) ( Figure S2 ). Overall, a final sample of N = 4592 (Table 1 ; n = 2230 men and n = 2362 women) represented a population of 35 551 772 individuals aged ≥60 years, with 86% estimated as NHW, ≈8% as NHB, ≈2% as MA, and ≈4% as others (see Appendix IV ), with notable differences indicating lower SES, poorer diet quality, cognition, and health among others, in minority groups compared with NHW men and women.
TABLE 1.
Baseline characteristics of selected participants by race/ethnicity among older men and women (≥60 years)
| Men | Women | |||||||
|---|---|---|---|---|---|---|---|---|
| Selected participant characteristics | NHW | NHB | MA | Other b | NHW | NHB | MA | Other |
| Weighted population % | 86.3% | 7.7% | 2.3% | 3.7% | 85.5% | 8.1% | 2.0% | 4.4% |
| Socio‐demographic characteristics | ||||||||
| Age (years) | 70.1 ± 0.2 | 69.5 ± 0.5 | 68.2 ± 0.5** | 68.6 ± 0.7* | 71.5 ± 0.4 | 69.9 ± 0.5* | 67.9 ± 0.5*** | 67.9 ± 0.6*** |
| Urban/rural area of residence | ||||||||
| Urban | 40.6 ± 5.1 | 52.3 ± 5.8 | 46.6 ± 5.2 | 85.7 ± 7.7** | 38.6 ± 0.1 | 50.8 ± 0.1 | 53.5 ± 0.1** | 78.9 ± 0.1** |
| Rural | 59.4 ± 5.1 | 47.7 ± 5.8 | 53.4 ± 5.2 | 14.3 ± 7.7** | 61.4 ± 0.1 | 49.2 ± 0.1 | 46.5 ± 0.1 | 21.1 ± 0.1 |
| Household size | 2.07 ± 0.02 | 2.48 ± 0.09*** | 3.26 ± 0.10*** | 3.00 ± 0.23*** | 1.77 ± 0.04 | 2.42 ± 0.09*** | 3.11 ± 0.16*** | 2.68 ± 0.26** |
| Marital status | ||||||||
| Never married | 3.5 ± 0.7 | 4.9 ± 1.0 | 2.1 ± 0.8 | 1.9 ± 1.4 | 3.9 ± 0.6 | 3.7 ± 0.7 | 3.6 ± 1.0 | 13.5 ± 5.7 |
| Married | 79.9 ± 1.1 | 60.2 ± 2.2** | 79.6 ± 2.0 | 75.2 ± 8.5 | 48.4 ± 1.8 | 26.5 ± 2.5 | 48.8 ± 3.4 | 33.8 ± 7.8* |
| Divorced | 4.8 ± 0.7 | 9.3 ± 1.5 | 4.0 ± 1.0 | 6.2 ± 3.6 | 6.4 ± 0.8 | 9.5 ± 2.0 | 7.4 ± 1.8 | 18.1 ± 4.2 |
| Widowed | 9.5 ± 0.8 | 16.9 ± 2.0 | 8.7 ± 1.8 | 8.6 ± 6.4 | 39.6 ± 1.8 | 52.5 ± 2.8 | 34.8 ± 3.3 | 26.5 ± 4.8** |
| Other | 2.3 ± 0.4 | 8.6 ± 1.4** | 5.5 ± 1.4* | 8.0 ± 6.0 | 1.7 ± 0.3 | 7.7 ± 1.7*** | 5.4 ± 1.6* | 8.2 ± 2.8 |
| Socio‐economic status | ||||||||
| Poverty income ratio | 3.39 ± 0.10 | 1.90 ± 0.10*** | 1.91 ± 0.11*** | 2.57 ± 0.33* | 2.91 ± 0.09 | 1.65 ± 0.10*** | 1.56 ± 0.08*** | 2.09 ± 0.23*** |
| Education, years | 11.7 ± 0.2 | 8.5 ± 0.3*** | 5.7 ± 0.3*** | 9.8 ± 0.9 | 11.5 ± 0.1 | 9.5 ± 0.3*** | 5.6 ± 0.3*** | 9.0 ± 0.5*** |
| SES z‐score | +0.51 ± 0.05 | −0.27 ± 0.05*** | −0.59 ± 0.06*** | +0.07 ± 0.19* | +0.35 ± 0.04 | −0.23 ± 0.05*** | −0.70 ± 0.04*** | −0.16 ± 0.10*** |
| Dietary quality | ||||||||
| 1995‐HEI total score | 66.7 ± 0.6 | 58.2 ± 0.7*** | 63.6 ± 0.7** | 72.8 ± 2.0** | 70.6 ± 0.4 | 64.9 ± 0.6*** | 66.9 ± 0.9*** | 70.5 ± 1.7 |
| MAR total score | 77.3 ± 0.6 | 65.4 ± 0.9*** | 70.4 ± 0.9*** | 74.8 ± 2.3 | 72.0 ± 0.7 | 63.1 ± 0.8*** | 65.1 ± 1.1*** | 68.6 ± 1.6* |
| DIET z‐score | +0.21 ± 0.03 | −0.44 ± 0.04*** | −0.10 ± 0.04*** | +0.36 ± 0.12 | +0.20 ± 0.03 | −0.27 ± 0.04*** | −0.14 ± 0.06*** | +0.09 ± 0.09 |
| Nutritional biomarkers | ||||||||
| Folate, ng/mL | 8.83 ± 0.26 | 6.12 ± 0.23*** | 6.32 ± 0.35*** | 8.17 ± 1.13 | 10.4 ± 0.4 | 7.1 ± 0.4*** | 7.3 ± 0.5*** | 9.3 ± 1.0 |
| Vitamin A, μg/dL | 65.9 ± 0.9 | 63.2 ± 1.20 | 59.3 ± 1.1*** | 62.8 ± 2.50 | 63.5 ± 0.5 | 61.7 ± 1.0*** | 55.4 ± 1.3 | 60.2 ± 2.6 |
| Total carotenoids, μg/dL | 76.3 ± 1.2 | 82.1 ± 2.3* | 79.6 ± 3.9 | 88.0 ± 8.2 | 90.0 ± 1.7 | 98.5 ± 3.5* | 91.3 ± 3.6 | 109.8 ± 6.9 |
| Vitamin E, μg/dL | 1325 ± 22 | 1128 ± 35*** | 1205 ± 24.6** | 1444 ± 182 | 1523 ± 17.0 | 1264 ± 28.5*** | 1355 ± 33.9*** | 1486 ± 129 |
| NUTR z‐score | −0.007 ± 0.025 | −0.190 ± 0.036*** | −0.218 ± 0.047*** | +0.042 ± 0.159 | +0.17 ± 0.03 | −0.03 ± 0.03*** | −0.11 ± 0.05*** | +0.18 ± 0.13 |
| Physical activity | ||||||||
| 0 = Less, 1 = Same, 2 = more | ||||||||
| Compare activity for past mo to past y | ||||||||
| Less | 21.0 ± 1.2 | 21.4 ± 2.1 | 19.3 ± 3.1 | — c | 25.4 ± 1.5 | 26.6 ± 2.3 | 32.0 ± 3.3 | 32.2 ± 6.9 |
| Same | 69.4 ± 1.7 | 71.5 ± 2.0 | 71.7 ± 3.1 | — c | 64.1 ± 1.6 | 65.4 ± 2.2 | 61.6 ± 3.4* | 57.3 ± 7.5 |
| More | 9.6 ± 1.2 | 7.2 ± 1.7 | 9.0 ± 2.0 | — c | 10.5 ± 1.0 | 8.0 ± 1.4 | 6.4 ± 1.5 | 10.5 ± 4.4 |
| Active compared with men/women your age | ||||||||
| Less | 16.2 ± 1.4 | 21.1 ± 1.9 | 21.7 ± 2.6 | 15.6 ± 6.1 | 15.1 ± 1.3 | 26.7 ± 2.6 | 29.8 ± 2.9 | 25.6 ± 5.8 |
| Same | 38.7 ± 1.7 | 45.8 ± 2.9 | 47.6 ± 3.2 | 39.6 ± 10.5 | 42.4 ± 1.6 | 46.0 ± 2.5** | 39.2 ± 3.6*** | 35.6 ± 6.9 |
| More | 45.0 ± 1.9 | 33.1 ± 2.3** | 30.7 ± 3.0** | 44.8 ± 12.5 | 42.5 ± 1.7 | 27.3 ± 2.2*** | 31.0 ± 3.2*** | 38.7 ± 6.8 |
| Active now compared with self 10 y ago | ||||||||
| Less | 64.6 ± 1.6 | 61.4 ± 2.8 | 64.0 ± 3.0 | 54.8 ± 7.1 | 64.4 ± 2.0 | 68.7 ± 2.3 | 70.0 ± 3.2 | 62.8 ± 5.6 |
| Same | 30.0 ± 1.7 | 25.2 ± 2.5 | 27.9 ± 2.5 | 22.5 ± 6.5 | 28.6 ± 1.5 | 18.6 ± 2.0** | 26.5 ± 3.1 | 27.0 ± 4.2 |
| More | 5.3 ± 0.9 | 13.3 ± 1.9*** | 8.0 ± 1.7 | 22.7 ± 8.3** | 7.0 ± 1.1 | 12.7 ± 1.5* | 3.4 ± 0.8** | 10.2 ± 5.2 |
| PA z‐score | +0.08 ± 0.02 | +0.04 ± 0.05 | +0.01 ± 0.05 | +0.10 ± 0.17 | +0.06 ± 0.03 | −0.08 ± 0.04*** | −0.18 ± 0.05*** | −0.02 ± 0.11 |
| Smoking | ||||||||
| No. cigarettes/day | 8.88 ± 0.49 | 7.34 ± 0.38* | 5.82 ± 0.53*** | 6.74 ± 2.37 | 4.53 ± 0.32 | 2.80 ± 0.34 | 1.64 ± 0.30 | 2.44 ± 0.65 |
| Years smoked cigarettes | 11.5 ± 0.7 | 12.6 ± 0.8 | 9.7 ± 1.1 | 9.2 ± 4.2 | 6.18 ± 0.48 | 4.48 ± 0.65 | 3.22 ± 0.54*** | 4.28 ± 1.37 |
| SMOKING z‐score | +0.40 ± 0.05 | +0.35 ± 0.05 | +0.16 ± 0.06** | +0.20 ± 0.27 | −0.02 ± 0.03 | −0.19 ± 0.04** | −0.30 ± 0.03*** | −0.22 ± 0.08* |
| Alcohol consumption (g/d) | +8.52 ± 1.16 | 7.11 ± 1.12 | 5.58 ± 0.80* | 10.1 ± 4.51 | 3.05 ±0.45 | 0.93 ± 0.23*** | 1.15 ± 0.34** | 0.83 ± 0.62** |
| ALCOHOL z‐score | +0.33 ± 0.09 | +0.23 ± 0.08 | +0.12 ± 0.06* | +0.45 ± 0.33 | −0.07 ± 0.03 | −0.22 ± 0.02** | −0.21 ± 0.03** | −0.23 ± 0.05 |
| Social support | ||||||||
| (1) In a typical week, how many times do you talk on the telephone with family, friends, or neighbors? | 7.3 ± 0.4 | 9.6 ± 1.0* | 4.4 ± 0.4*** | 5.3 ± 1.1 | 13.2 ± 0.5 | 16.9 ± 1.3* | 9.8 ± 0.9*** | 10.0 ± 2.2 |
| (2) How often do you get together with friends or relatives; I mean things like going out together or visiting in each other's homes? (per year) | 113.4 ± 6.6 | 134.8 ± 7.7 | 105.7 ± 12.5* | 101.5 ± 26.8 | 136.4 ± 9.0 | 134.3 ± 7.6 | 120.1 ± 12.5 | 107.2 ± 10.5* |
| (3) About how often do you visit with any of your other neighbors, either in their homes or in your own? (per year) | 76.2 ± 4.4 | 93.9 ± 8.7 | 58.8 ± 6.5 | 77.9 ± 24.2 | 91.4 ± 7.7 | 88.7 ± 10.9 | 44.4 ± 7.8*** | 98.3 ± 31.0 |
| (4) How often do you attend church or religious services? (per year) | 37.3 ± 2.4 | 38.4±2.6 | 37.9 ± 5.8 | 45.4 ± 13.1 | 43.4 ± 2.2 | 55.1 ± 3.4** | 52.4 ± 5.3 | 73.5 ± 21.9 |
| (5) Altogether, how often do you attend meetings of the clubs or organizations (per year) | 14.9 ± 1.1 | 10.4 ± 1.4* | 7.1 ± 3.7 | 18.5 ± 12.0 | 16.7 ± 1.4 | 16.0 ± 2.1 | 4.3 ± 1.5*** | 8.1 ± 2.1** |
| SS z‐score | −0.08 ± 0.02 | −0.02 ± 0.03* | −0.18 ± 0.05 | −0.07 ± 0.10 | +0.08 ± 0.02 | +0.16 ± 0.04 | −0.08 ± 0.03*** | +0.06 ± 0.10 |
| Health‐related factors | ||||||||
| Self‐rated health | ||||||||
| Excellent/Very Good | 39.5 ± 2.1 | 23.0 ± 2.0 | 21.0 ± 2.8 | 26.2 ± 6.9 | 40.9 ± 1.6 | 17.8 ± 1.6 | 11.3 ± 2.0 | 30.4 ± 6.2 |
| Good | 33.3 ± 1.5 | 34.2 ± 3.4** | 35.5 ± 3.6** | 39.7 ± 10.0 | 33.0 ± 1.1 | 31.3 ± 2.4*** | 27.8 ± 3.5*** | 32.2 ± 6.0 |
| Fair/Poor | 27.3 ± 1.6 | 42.8 ± 3.7*** | 43.5 ± 2.4*** | 34.1 ± 6.1 | 26.2 ± 1.2 | 51.0 ± 3.0*** | 61.0 ± 4.0*** | 37.3 ± 6.5 |
| Co‐morbidity index | 1.45 ± 0.06 | 1.18 ± 0.04*** | 1.00 ± 0.06*** | 1.26 ± 0.16 | 1.79 ± 0.10 | 1.65 ± 0.06 | 1.37 ± 0.07*** | 1.34 ± 0.14** |
| Allostatic load, AL score | 2.73 ± 0.07 | 3.05 ± 0.08** | 3.00 ± 0.07** | 2.53 ± 0.24 | 2.62±0.06 | 3.21±0.09*** | 3.03 ± 0.08*** | 2.62±0.15 |
| BMI | 27.01 ± 0.14 | 26.44 ± 0.29 | 27.02 ± 0.23 | 26.44 ± 1.01 | 26.7 ± 0.2 | 29.9 ± 0.5*** | 28.7 ± 0.5*** | 26.7 ± 0.4 |
| HEALTH z‐score | −0.098 ± 0.026 | −0.020 ± 0.028* | −0.025 ± 0.026 | −0.139±0.085 | −0.078 ± 0.02 | 0.30 ± 0.04*** | 0.21 ± 0.04*** | −0.10 ± 0.05 |
| Cognitive performance test scores and index | ||||||||
| WR‐CORR, (× ‐1) | −5.54 ± 0.03 | −5.06 ± 0.07*** | −5.40 ± 0.05* | −5.64 ± 0.12 | −5.61 ± 0.02 | −5.15 ± 0.06*** | −5.46 ± 0.05** | −5.58 ± 0.11 |
| WR‐TRIALS | +0.06 ± 0.01 | +0.07 ± 0.02 | +0.09 ± 0.02 | — c | 0.029 ± 0.004 | 0.079 ± 0.020* | 0.085 ± 0.020** | 0.008 ± 0.007* |
| SR‐CORR, (× ‐1) | −4.14 ± 0.05 | −3.39 ± 0.11*** | −3.38 ± 0.10*** | −3.77±0.18* | −4.26 ± 0.05 | −3.56 ± 0.09*** | −3.13 ± 0.08*** | −3.52±0.16*** |
| MATH‐INC | 0.42 ± 0.03 | 1.28 ± 0.11*** | 1.02 ± 0.17** | 0.71 ± 0.43 | 0.66 ± 0.05 | 1.79 ± 0.11*** | 1.73 ± 0.12*** | 0.91 ± 0.29 |
| COGN PCA score | −0.38 ± 0.04 | +0.39 ± 0.12*** | +0.15 ± 0.09*** | −0.33 ± 0.21 | −0.44 ± 0.03 | +0.44 ± 0.10*** | +0.39 ± 0.08*** | −0.15 ± 0.16 |
| Cumulative incidence of AD and all‐cause dementia, % | ||||||||
| AD dementia | 13.9 ± 1.2 | 15.1 ± 1.5 | 13.4 ± 2.5 | — c | 19.7 ± 1.3 | 21.3 ± 2.2 | 16.9 ± 2.0 | 26.9 ± 5.2 |
| All‐cause dementia | 28.0 ± 1.4 | 29.2 ± 2.0 | 27.4 ± 3.2 | 23.3 ± 5.0 | 37.3 ± 1.5 | 40.2 ± 2.1 | 33.8 ± 2.6 | 40.4 ± 5.9 |
NHANES III, 1988‐1994 (unweighted N = 4592; weighted N = 35,551,773) a
Abbreviations: AD = Alzheimer's Disease; ALCOHOL = alcohol consumption, z‐score; COGN = cognitive performance principal component variable (four measured variables); DIET/NUTR = diet and nutritional biomarkers z‐score variable (two dietary quality measures and four nutritional biomarkers); HEALTH = health‐related factors as mean of z‐scores for allostatic load, self‐rated health, co‐morbidity index and body mass index; LIFESTYLE = lifestyle‐related factors composed of social support, physical activity, diet/nutritional biomarkers, smoking and alcohol consumption using means of z‐scores for related measured variables; MA = Mexican American; N = number of participants; NHANES III = Third National Health and Nutrition Examination Survey; NHB = non‐Hispanic Black; NHW = non‐Hispanic White; PA = physical activity z‐score variable (three measured variables); PSU = Primary Sampling Unit; RACE_ETHN = racial/ethnic contrast; SEM = Standard Error of the Mean; SEP = Standard Error of the Proportion; SES = socio‐economic status mean of z‐scores composed of poverty income ratio and education (years); SMOKING = smoking z‐score variable (two measured variables); SR‐CORR = Story Recall test, correct items; SS = social support z‐score variable (five measured variables); WR‐CORR = Word Recall Test, Correct Items; WR‐TRIALS = Word Recall Test, number of trials.
Values are weighted means ± SEM or percent ± SEP, considering sampling design complexity (PSU and strata), across 5 imputations with 10 iterations.
Design‐based F‐test accounting for design complexity in terms of sampling weights, PSU and stratum, using multinomial logit models for categorical variables and linear regression for continuous variables, taking NHW as the referent category.
Other ethnicity among men was not presented for specific categorical variables, including AD dementia cumulative incidence (%), due to disclosure risk.
P < .05.
P < .01.
P < .001.
For null hypothesis of no difference between racial/ethnic groups, taking NHW as the referent category, based on linear and multinomial logit models with race/ethnicity as the only categorical variable for continuous and categorical study characteristic, respectively, taking into account sampling design complexity.
Among men (Table 2 ), and unlike among women, the other race/ethnicity group had reduced DEMENITA risk compared with NHW men in all models (Model 5: HR = 0.38, 95% CI: 0.22 to 0.66, P < .001). Upon adjustment for SES and subsequently for other factors, MA women had a reduced AD risk compared with NHW women (Model 5: HR = 0.53, 95% CI: 0.35 to 0.80, P = .005). In contrast, for DEMENTIA, NHB had an increased risk compared with NHW men and women, although only in Model 1 (men: HR = 1.31, 95% CI: 1.05 to 1.62, P = .020; women: HR = 1.34, 95% CI: 1.10 to 1.61, P = .005). This association was significantly attenuated with the addition of SES (P > .05).
TABLE 2.
Racial/ethnic disparities in incident all‐cause and Alzheimer's Disease dementia among older men and women (≥60 years)
| NHB versus NHW | MA versus NHW | Other versus NHW | ||||
|---|---|---|---|---|---|---|
| Loge(HR) | (SE) | Loge(HR) | (SE) | Loge(HR) | (SE) | |
| All‐cause dementia | ||||||
| Men | ||||||
| Model 1 | +0.27 | (0.11)* | −0.07 | (0.20) | −0.71 | (0.24)** b |
| Model 2 | +0.07 | (0.13) | −0.39 | (0.24) | −0.97 | (0.26)** b |
| Model 3 | −0.01 | (0.14) | −0.37 | (0.24) | −1.08 | (0.31)***b |
| Model 4 | −0.04 | (0.14) | −0.37 | (0.24) | −1.02 | (0.29) ** b |
| Model 5 | −0.21 | (0.15) | −0.45 | (0.26) | −0.96 | (0.28)***b |
| Women | ||||||
| Model 1 | +0.29 | (0.10) ** | +0.01 | (0.14) | +0.04 | (0.23) b |
| Model 2 | +0.16 | (0.11) | −0.20 | (0.16) | −0.07 | (0.25) b |
| Model 3 | +0.16 | (0.12) | −0.19 | (0.17) | −0.04 | (0.26) b |
| Model 4 | +0.13 | (0.12) | −0.20 | (0.17) | −0.03 | (0.26) b |
| Model 5 | +0.03 | (0.12) | −0.30 | (0.17) | −0.06 | (0.25) b |
| Alzheimer's disease dementia | ||||||
| Men | ||||||
| Model 1 | +0.25 | (0.17) | −0.16 | (0.29) | −1.2 | (0.66) b |
| Model 2 | −0.03 | (0.19) | −0.58 | (0.37) | −1.7 | (0.68) b |
| Model 3 | −0.18 | (0.23) | −0.55 | (0.37) | −1.9 | (0.76) b |
| Model 4 | −0.20 | (0.23) | −0.55 | (0.37) | −1.8 | (0.74) b |
| Model 5 | −0.45 | (0.26) | −0.64 | (0.40) | −1.6 | (0.68) b |
| Women | ||||||
| Model 1 | +0.22 | (0.14) | −0.18 | (0.16) | +0.20 | (0.26) b |
| Model 2 | +0.03 | (0.17) | −0.46 | (0.20) * | +0.02 | (0.33) b |
| Model 3 | −0.04 | (0.18) | −0.48 | (0.21) * | +0.01 | (0.32) b |
| Model 4 | −0.07 | (0.17) | −0.48 | (0.21) * | +0.01 | (0.32) b |
| Model 5 | −0.20 | (0.17) | −0.63 | (0.21) ** | −0.02 | (0.31) |
Unweighted N = 4592; Weighted N = 35551773): Cox proportional hazards models; NHANES III, 1988–1994 a
Abbreviations: AD = Alzheimer's Disease; ALCOHOL = alcohol consumption, z‐score; COGN = cognitive performance principal component variable (four measured variables); DIET/NUTR = diet and nutritional biomarkers z‐score variable (two dietary quality measures and four nutritional biomarkers); HEALTH = health‐related factors as mean of z‐scores for allostatic load, self‐rated health, co‐morbidity index and body mass index; HR = hazard ratio; LCL = Lower Confidence Limit; LIFESTYLE = lifestyle‐related factors composed of social support, physical activity, diet/nutritional biomarkers, smoking and alcohol consumption using means of z‐scores for related measured variables; MA = Mexican American; N = number of participants; NHANES III = Third National Health and Nutrition Examination Survey; NHB = non‐Hispanic Black; PSU = Primary Sampling Unit; NHW = non‐Hispanic White; PA = physical activity z‐score variable (three measured variables); RACE_ETHN = racial/ethnic contrast; SE = Standard Error; SES = socio‐economic status mean of z‐scores composed of poverty income ratio and education (years); SMOKING = smoking z‐score variable (two measured variables); SS = social support z‐score variable (five measured variables); UCL = Upper Confidence Limit. See Methods section for more details.
Values are β ± SE (Loge(HR)), considering sampling design complexity (PSU and strata), across 5 imputations with 10 iterations. HR and its 95% CI can be estimated as follows: HR = exp(Loge(HR)); LCL95pct = exp(LogeHR)‐1.96*SE); UCL95pct = exp(Loge(HR)+1.96*SE).
Model 1: adjusted for age; Model 2: adjusted for age and other demographic factors (household size, marital status, urban‐rural area of residence) and SES score; Model 3: Model 2 further adjusted for lifestyle‐related factors (average of z‐scores of measured variables for SMOKING, ALCOHOL, DIET, NUTR, SS, and PA); Model 4: Model 3 + health‐related factors (HEALTH score); Model 5: Full model: Model 4 + cognitive test PCA score. Findings from “other ethnicity” among men was not presented due to small number of events for AD and disclosure risk.
P < .05 for sex × RACE_ETHN interaction in unstratified model.
P < .05.
P < .01.
P < .001.
for null hypothesis of Loge(HR) = 0.
Based on Tables S1 ‐ S3 and Figure 2 (GSEM models for racial disparities by sex), only one total effect (TE) was statistically significant, which was that for NHB versus NHW women contrast for DEMENTIA (TE = +0.288 ± 0.117, P = 0.018), suggesting greater hazard of all‐cause dementia among NHB women compared to NHW women. This greater risk was explained by the following pathways: (1) NHB versus NHW→ poor cognitive performance (COGN, +) → DEMENTIA (+); (2) NHB versus NHW→ SES (−)→COGN (−)→DEMENTIA (+); (3) NHB versus NHW→ SES (−) → LIFESTYLE (mainly physical activity (PA, +) → COGN (−) → DEMENTIA (+); (4) NHB versus NHW → SES (−) → LIFESTYLE (mainly DIET (+)) → COGN (−) → DEMENTIA (+), three of which (ie 2, 3, and 4) were formally tested and found statistically significant (P < .05 for indirect effect [IE]). Although other racial contrasts per gender/outcome failed to show significant TEs. Figure 2 indicates that the hypothesized pathway yielded poor fit to the data. In fact, direct effects (P < .05) were detected between SES, LIFESTYLE factors (eg, PA and SS), and each of the two outcomes in some contrasts, whereas in others, COGN was not associated with final outcomes. It is notable that there was no direct association between HEALTH and COGN in all contrasts. TE of being non‐White versus NHW (Figure 3 and Table 3 ) was not statistically significant for DEMENTIA. Several significant pathways were uncovered for this race/ethnicity contrast, which were comparable to those uncovered for NHB versus NHW among women contrast, highlighting the central role played by SES as a potential mediator in racial disparities in dementia risk, overall.
FIGURE 2.
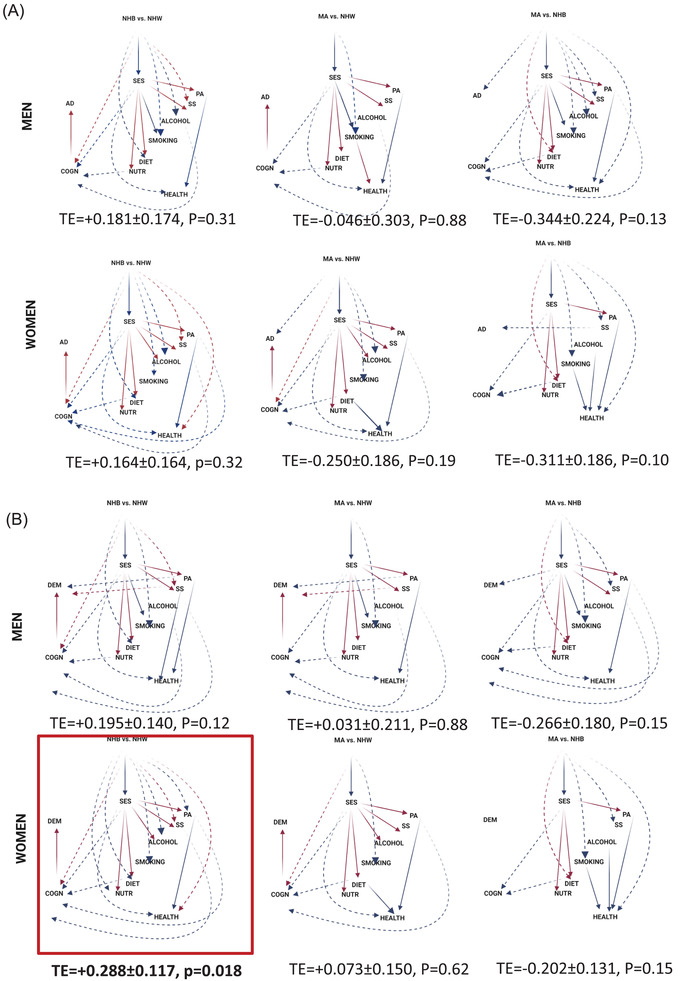
Generalized structural equation model (GSEM) findings for three race/ethnicity contrasts among men and women, NHANES III (1988‐1994): Final eligible sample (N = 4592). AD = Alzheimer's Disease; ALCOHOL = alcohol consumption, z‐score; COGN = Cognitive performance principal component variable (four measured variables); DIET/NUTR = diet and nutritional biomarkers z‐score variable (two dietary quality measures and four nutritional biomarkers); HEALTH = health‐related factors as mean of z‐scores for allostatic load, self‐rated health, co‐morbidity index and body mass index; LIFESTYLE = lifestyle‐related factors composed of social support, physical activity, diet/nutritional biomarkers, smoking and alcohol consumption using means of z‐scores for related measured variables; MA = Mexican American; N = Number of participants; NHANES III = Third National Health and Nutrition Examination Survey; NHB = non‐Hispanic Black; NHW = non‐Hispanic White; PA = physical activity z‐score variable (three measured variables); RACE_ETHN = racial/ethnic contrast; SES = socio‐economic status mean of z‐scores composed of poverty income ratio and education (years); SMOKING = smoking z‐score variable (two measured variables); SS = social support z‐score variable (five measured variables); TE = total effect; See Methods section for more details. Notes: Plain arrows are statistically significant associations (P < .05) within the hypothesized pathway; dashed arrows are statistically significant associations (P < .05) outside the hypothesized pathway; red arrows indicate positive (+) associations; blue arrows indicate inverse (−) associations
FIGURE 3.
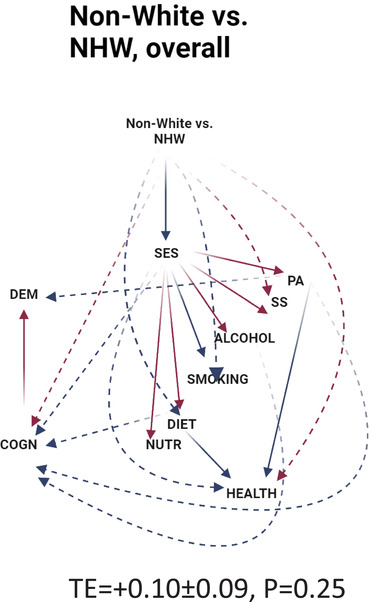
Generalized structural equation model (GSEM) findings for non‐White versus NHW racial/ethnic contrast versus DEMENTIA, NHANES III (1988‐1994): Final eligible sample (N = 4592). ALCOHOL = alcohol consumption, z‐score; COGN = cognitive performance principal component variable (four measured variables); DIET/NUTR = diet and nutritional biomarkers z‐score variable (two dietary quality measures and four nutritional biomarkers); HEALTH = health‐related factors as mean of z‐scores for allostatic load, self‐rated health, co‐morbidity index, and body mass index; LIFESTYLE = lifestyle‐related factors composed of social support, physical activity, diet/nutritional biomarkers, smoking, and alcohol consumption using means of z‐scores for related measured variables; MA = Mexican American; N = number of participants; N' = number of observations; NHANES III = Third National Health and Nutrition Examination Survey; NHB = non‐Hispanic Black; NHW = non‐Hispanic White; PA = physical activity z‐score variable (three measured variables); RACE_ETHN = racial/ethnic contrast; SES = socio‐economic status mean of z‐scores composed of poverty income ratio and education (years); SMOKING = smoking z‐score variable (two measured variables); SS = social support z‐score variable (five measured variables); TE = total effect; see Methods section for more details. Notes: Plain arrows are statistically significant associations (P < 0.05) within the hypothesized pathway; dashed arrows are statistically significant associations (P < 0.05) outside the hypothesized pathway; red arrows indicate positive (+) associations; blue arrows indicate inverse (−) associations
TABLE 3.
Direct effects of modifiable risk factors and cognitive performance from race/ethnicity (non‐White vs NHW) to incident all‐cause dementia among older adults (Agebase: 60+ years)
| (N' = 14 879) | ||
|---|---|---|
| Unweighted N' (both phases) | β | (SE), p |
| Main pathway | ||
| RACE_ETHN→SES (β12) | −0 .662 *** | (0.043), P < 0.001 |
| SES→SS (β23) | +0.066 ** | (0.019), P = 0.001 |
| SES→PA(β24) | +0.139 *** | (0.024), P < 0.001 |
| SES→DIET(β25) | +0.245 *** | (0.025), P < 0.001 |
| SES → NUTR (β26) | +0.137 *** | (0.021), P < 0.001 |
| SES → SMOKING (β27) | −0.088 ** | (0.027), P = 0.003 |
| SES → ALCOHOL (β28) | +0.072 * | (0.030), P = 0.019 |
| SS → HEALTH (β39) | −0.013 | (0.023), P = 0.56 |
| PA → HEALTH (β49) | −0.226 *** | (0.019), P < 0.001 |
| DIET → HEALTH (β59) | −0.034 * | (0.016), P = 0.042 |
| NUTR → HEALTH (β69) | +0.007 | (0.020), P = 0.74 |
| SMOKING → HEALTH (β79) | +0.025 | (0.016), P = 0.13 |
| ALCOHOL → HEALTH (β89) | −0.024 | (0.012), P = 0.058 |
| HEALTH → COGN (β910) | −0.013 | (0.030), P = 0.67 |
| COGN → DEMENTIA (β1011) | +0.153 *** | (0.022), P < 0.001 |
| Selected direct effects on final outcomes | ||
| RACE_ETHN→DEMENTIA (β111) | −0.088 | (0.094), P = 0.36 |
| SES → DEMENTIA (β211) | −0.059 | (0.070), P = 0.41 |
| SS → DEMENTIA (β311) | −0.015 | (0.072), P = 0.84 |
| PA → DEMENTIA (β411) | −0.160 ** | (0.058), P = 0.008 |
| DIET → DEMENTIA (β511) | −0.052 | (0.052), P = 0.32 |
| NUTR → DEMENTIA (β611) | −0.019 | (0.060), P = 0.75 |
| SMOKING → DEMENTIA (β711) | +0.010 | (0.065), P = 0.88 |
| ALCOHOL→ DEMENTIA (β811) | +0.010 | (0.037), P = 0.80 |
| HEALTH → DEMENTIA (β911) | −0.009 | (0.073), P = 0.99 |
| Other effects between endogenous variables | ||
| SES→HEALTH (β29) | −0.103 *** | (+0.021), P < 0.001 |
| SES→COGN (β210) | −0.323 *** | (0.030), P < 0.001 |
| SS→COGN (β310) | −0.074 * | (0.029), P = 0.015 |
| PA→COGN (β410) | −0.077 * | (0.030), P = 0.012 |
| DIET→COGN (β510) | −0.078 ** | (0.024), P = 0.003 |
| NUTR→COGN (β610) | −0.050 | (0.032), P = 0.12 |
| SMOKING→COGN (β710) | −0.007 | (0.022), P = 0.76 |
| ALCOHOL→COGN (β810) | −0.032 * | (0.013), P = 0.019 |
| Other direct effects of race | ||
| RACE_ETHN→SS (β13) | +0.101 * | (0.048), P = 0.042 |
| RACE_ETHN→PA(β14) | +0.002 | (0.054), P = 0.97 |
| RACE_ETHN→DIET(β15) | −0.149 ** | (0.050), P = 0.005 |
| RACE_ETHN→NUTR(β16) | −0.032 | (0.046), P = 0.49 |
| RACE_ETHN→SMOKING(β17) | −0.269 ** | (0.028), P = 0.002 |
| RACE_ETHN→ALCOHOL(β18) | −0.130 | (0.082), P = 0.12 |
| RACE_ETHN→HEALTH(β19) | +0.087 ** | (0.029), P = 0.005 |
| RACE_ETHN→COGN(β110) | +0.418 *** | (0.063), P < 0.001 |
| Selected Indirect effects | ||
| RACE_ETHN → SES → DEMENTIA (βA) | ||
| 1 | +0.0329 | (0.0458) |
| 2 | +0.0409 | (0.0456) |
| 3 | +0.0434 | (0.0460) |
| 4 | +0.0411 | (0.0461) |
| 5 | +0.0354 | (0.0462) |
| Rubin's rule | +0.0396 | (0.0459) |
| RACE_ETHN → SES → LIFESTYLE → DEMENTIA (βB) | ||
| 1 | +0.0273 | (0.0097) |
| 2 | +0.0241 | (0.0098) |
| 3 | +0.0272 | (0.0097) |
| 4 | +0.0264 | (0.0103) |
| 5 | +0.0233 | (0.0098) |
| Rubin's rule | +0.0263 * | (0.0099) |
| RACE_ETHN → SES → LIFESTYLE → HEALTH → DEMENTIA (βC) | ||
| 1 | −0.00021 | (0.0021) |
| 2 | −0.00021 | (0.0021) |
| 3 | −0.00029 | (0.0020) |
| 4 | −0.00039 | (0.0022) |
| 5 | −0.00014 | (0.0021) |
| Rubin's rule | −0.00028 | (0.0021) |
| RACE_ETHN → SES → LIFESTYLE → HEALTH → COGN → DEMENTIA (βD) | ||
| 1 | −0.00006 | (0.00013) |
| 2 | −0.00006 | (0.00013) |
| 3 | −0.00005 | (0.00013) |
| 4 | −0.00007 | (0.00014) |
| 5 | −0.00006 | (0.00013) |
| Rubin's rule | −0.00006 | (0.00013) |
| RACE_ETHN → SES → LIFESTYLE→ COGN → DEMENTIA (βE) | ||
| 1 | +0.0045 | (0.0008) |
| 2 | +0.0042 | (0.0008) |
| 3 | +0.0043 | (0.0008) |
| 4 | +0.0046 | (0.0009) |
| 5 | +0.0043 | (0.0008) |
| Rubin's rule | +0.0044 *** | (0.0008) |
| RACE_ETHN → SES → COGN → DEMENTIA (βF) | ||
| 1 | +0.032 | (0.005) |
| 2 | +0.034 | (0.006) |
| 3 | +0.033 | (0.006) |
| 4 | +0.032 | (0.005) |
| 5 | +0.033 | (0.006) |
| Rubin's rule | +0.033 *** | (0.006) |
| TOTAL EFFECT OF RACE_ETHN | +0.10 | (0.09), P = .25 |
NHANES III, 1988–1994 a
Abbreviations: AD = Alzheimer's disease; ALCOHOL = alcohol consumption, z‐score; COGN = cognitive performance principal component variable (four measured variables); DIET/NUTR = diet and nutritional biomarkers z‐score variable (two dietary quality measures and four nutritional biomarkers); HEALTH = Health‐related factors as mean of z‐scores for allostatic load, self‐rated health, co‐morbidity index, and body mass index; LIFESTYLE = lifestyle‐related factors composed of social support, physical activity, diet/nutritional biomarkers, smoking and alcohol consumption using means of z‐scores for related measured variables; MA = Mexican American; N = number of participants; N' = number of observations; NHANES III = Third National Health and Nutrition Examination Survey; NHB = non‐Hispanic Black; NHW = non‐Hispanic White; PA = physical activity z‐score variable (three measured variables); RACE_ETHN = racial/ethnic contrast; SES = socio‐economic status mean of z‐scores composed of poverty income ratio and education (years); SMOKING = smoking z‐score variable (two measured variables); SS = Social Support z‐score variable (five measured variables). See Methods section for more details.
Values are path coefficients β ± SE or non‐linear combinations of path coefficients to compute selected indirect effects, considering sampling design complexity (PSU and strata), across 5 imputations with 10 iterations. For indirect effects, 1 through 5 represent estimates for each extracted imputation. Rubin's rule refers to pooled estimate across the 5 imputations using Rubin's rule for point estimates and standard errors. →DEMENTIA or →AD associations are interpreted as Logit(HR) of these incident outcomes per unit exposure, as are total effects of RACE_ETHN.
P < .05.
P < .01.
P < .001.
for null hypothesis of β = 0.
4. DISCUSSION
We examined racial/ethnic differences in AD and DEMENTIA incidence among a nationally representative sample of US men and women. We observed differences in onset age of DEMENTIA and AD across groups defined by race/ethnicity and sex that could be explained by pathways involving socio‐economic, lifestyle, and cognitive ability factors in a sex‐specific manner. By testing mediation models in a discrete‐time analytic framework, we observed significant total effect indicating greater DEMENTIA risk among NHB women compared with NHW women, which was explained primarily by pathways including SES, PA, DIET, and COGN as key mediators. Reduced AD risk in MA women versus NHW women was observed after adjustment for SES and downstream factors (HR = 0.53, 95% CI: 0.35 to 0.80). For non‐White versus NHW contrast in incident DEMENTIA, pathways involved lower SES increasing cognitive deficits, which directly increases DEMENTIA, or indirectly through lifestyle factors (eg, DIET and PA).
Although our main finding was among women for the all‐cause dementia outcome and contrasting NHB versus NHW, other GSEM findings highlight the potential pathways between SES and dementia across gender groups for each outcome of interest, since race is an exogenous variable in all of these equations and was strongly associated with SES when NHW was considered as the referent category. Nevertheless, our findings varied when contrasting NHB versus NHW women as opposed to MA women versus NHW women, with the first being directly related to all‐cause dementia and the latter being inversely related to AD dementia. The first finding suggests that cardio‐metabolic risk factors or their associated lifestyle factors may be at play in explaining these differences, and that an excess risk for incidence in all‐cause dementia is mainly driven by increased risk in vascular or mixed dementia differences among NHB women compared with NHW women.
Observed racial disparities could be attributable to other structural mechanisms. Recent work by Milani et al. 29 found that demographic subgroups including non‐Hispanic Black, male, and lower educated adults had less AD‐specific knowledge relative to their White, female, and higher educated counterparts. Lower awareness of AD/DEMENTIA pathology may result in the underdiagnoses in medical claims in these demographic subgroups observed in recent observational studies. 30 It is notable that differential disparities in misdiagnosis of dementia across racial/ethnic subgroups may bias the extent of health disparities. A recent study compared the risk of dementia under‐ and over‐diagnosis in clinical settings across racial/ethnic groups from 2000 to 2010, using an algorithm with similar sensitivity and specificity across racial groups and comparing it to diagnosis through linkage with Medicare in the Health and Retirement Study, another nationally representative sample of older adults. 31 The results show that NHB older adults had double the risk of under‐diagnosis as their NHW counterparts, 31 suggesting that NHW older adults are diagnosed closer to their onset times than their NHB counterparts, leading to underestimated disparities in dementia rates.
Racial/ethnic and gender disparities in DEMENTIA and AD onset via direct and indirect pathways have been established. 7 There is a limited but growing body of research attributing racial/ethnic disparities in differences to clinical biomarkers. Comparable levels of white matter hyperintensity (WMH) volume had stronger, adverse association with cognitive decline among African Americans relative to Whites, based on a recent prospective cohort study. 32
Differences in socio‐economic, lifestyle, and health‐related factors across racial/ethnic and gender subgroups may explain disparities in cognitive health observed in the literature and in this study. One study examined racial/ethnic and gender disparities in domain‐specific cognitive decline. Adjustment for potentially mediating factors altered disparities in cognitive trajectories across subgroups 33 with respect to memory decline when comparing NHW with NHB women. This is consistent with our findings of racial/gender contrasts and the role played by baseline cognitive performance and SES. Another study implicated poor cognitive performance as a possible mechanism for higher AD risk among black adults. 34
Few studies examining associations between race/ethnicity and gender with DEMENTIA or AD have tested mediation hypotheses with linkage to medical claims data. As noted, several risk factors for DEMENTIA and AD are patterned by race/ethnicity and gender including psychosocial and behavioral health, obesity, and other cardiometabolic conditions, and socioeconomic well‐being. 7 , 8 , 9 However, we found that health‐related factors, including the allostatic load , were not on the pathway between RACE_ETHN and DEMENTIA/AD outcomes, but rather had common antecedent LIFESTYLE factors (eg, PA and DIET). This finding deviates from our main hypothesized pathway of RACE_ETHN → SES → LIFESTYLE → HEALTH → COGN→ AD/DEMENTIA.
Noteworthy is the mediating effect of nutritional biomarkers, particularly among men, and that of diet quality among women. In fact, several antioxidant vitamins, including vitamins A and E, as well as carotenoids and folate were previously found to directly impact brain function. 35 , 36 , 37 , 38 , 39 A recent trial (VITACOG) carried out among patients with mild cognitive Impairment indicated that brain gray matter regions vulnerable to AD (eg, medial temporal lobe) benefited from high‐dose B vitamin supplementation by slowing 2‐year brain atrophy rates, an effect detected only among hyperhomocysteinemic individuals. 36 The trial also suggested that B vitamin supplementation can stabilize executive function and reduce decline in global cognition, and episodic and semantic memory. 38 Moreover, among carotenoids, lutein or lutein + zeaxanthin may have beneficial cognitive effects in older men and women as indicated by a recent randomized controlled trial. 39 More generally, a recent study examining multiple nutritional biomarkers, including plasma n‐3 fatty acids, 25‐hydroxyvitamin D, and homocysteine found that participants presenting without nutritional risk factors exhibited cognitive enhancement (0.03 standard units [SU]/y), whereas each nutritional risk index (NRI) point increase associated with an incremental acceleration cognitive decline (NRI1, reduced n‐3 fatty acids: β = −0.04 SU/y, P = .03; NRI2, reduced 25‐hydroxyvitamin D: β = −0.08 SU/y, P = .0001; and NRI‐3, elevated homocysteine: β = −0.11 SU/y, P = .0008). 40 A recent study examining gender and race differences in the association between diet quality and cognition using more recent waves of NHANES (2011‐2014), found that a 1 unit increase in the Mediterranean Diet Score (MeDi) was associated with a 0.039 (95% CI: 0.016 to 0.062) higher global cognitive z‐score, with the effect being stronger among NHW and in men. 41 Conversely, we found that diet quality is a stronger mediating factor in women than in men for racial disparities in dementia, particularly for the NHB versus NHW contrast.
Another key mediator uncovered in our GSEMs is PA, a factor positively affecting brain health. 42 Neuroimaging studies on humans show brain atrophy with age that is mitigated in older adults who exercise. 43 Exercise promotes neurogenesis in aged mice by stimulating mitochondrial regeneration and expression of vascular endothelial growth factor (VEGF‐A), a growth factor supporting neuron proliferation. 44 Brain‐derived neurotrophic factor (BDNF), a key mediator in brain connectivity and plasticity, both supports growth and differentiation of new neurons and protects existing ones. 45 Exercise in mice increases brain BDNF levels ubiquitously, including with cognition‐related regions. 45 Although BDNF plays a critical role in AD, controversial findings from human and animal studies question its precise role. 46
This study has several strengths. First, the large sample size sufficiently powered our analyses to detect mediation effects in demographic subgroups. Using a nationally representative sample with Medicare linkage enabled us to combine respond information along with medical diagnoses. Studies strictly using claims data rely on accurate demographic reporting during patient encounters 47 and may exclude micro‐level non‐medical information. Classifying respondents with cognitive impairment using cognitive tasks may be biased due to varying thresholds among demographic subgroups with different educational attainment and literacy. Limitations include residual confounding, measurement error, and potential selection bias due missing data on cognitive performance.
This work builds on the existing literature by identifying mediating factors between race/ethnicity and time to incident DEMENTIA and AD, overall and by gender. Socio‐economic and lifestyle factors including diet and physical activity explaining disparities between NHB and NHW in dementia onset among women are important to consider for future observational and intervention studies.
DISCLAIMER
The views expressed in this article are those of the authors and do not necessarily reflect the official policy or position of CDC/NCHS or Fort Belvoir Community Hospital, the Defense Health Agency, Department of Defense, or the U.S. Government. Reference to any commercial products within this publication does not create or imply any endorsement by Fort Belvoir Community Hospital, the Defense Health Agency, Department of Defense, or U.S. Government.
CONFLICTS OF INTEREST
None declared.
AUTHOR CONTRIBUTIONS
May A. Beydoun: Study concept, plan of analysis, data management, statistical analysis, literature search and review, write‐up of the manuscript, revision of the manuscript; Jordan Weiss: Plan of analysis, assistance with statistical analysis, literature search and review, write‐up of parts of the manuscript, revision of the manuscript; Hind A. Beydoun: Plan of analysis, literature search and review, write‐up of parts of the manuscript, revision of the manuscript; Marie T. Fanelli‐Kuczmarski: Plan of analysis, literature search and review, write‐up of parts of the manuscript, revision of the manuscript; Sharmin Hossain: Literature search and review, write‐up of parts of the manuscript, revision of the manuscript; Ziad W. El‐Hajj: Literature search and review, write‐up of parts of the manuscript, revision of the manuscript; Michele K. Evans: Data acquisition, write‐up of parts of the manuscript, revision of the manuscript; Alan B. Zonderman: Data acquisition, plan of analysis, write‐up of parts of the manuscript, revision of the manuscript.
Supporting information
Supporting Information
Supporting Information
Supporting Information
ACKNOWLEDGMENTS
The authors would like to thank the NHANES staff, investigators and participants and the intramural research program of the National Institute on Aging, National Institutes of Health (NIA/NIH/IRP) internal reviewers of this manuscript. We also would like to thank Mr. Negasi Beyene from Centers for Disease Control and Prevention, National Center for Health Statistics (CDC/NCHS), in Hyattsville, MD, for assistance with the statistical analysis process at the Research Data Center (RDC) in Rockville, MD. Finally, we would like to thank Mr. Ray Kuntz, Agency for Healthcare Research and Quality (AHRQ), for supervising the data analysis process at the RDC. This research was supported entirely by the Intramural Research Program of the National Institutes of Health (NIH), National Institute on Aging (Z01‐AG000513).
Beydoun MA, Weiss J, Beydoun HA, et al. Pathways explaining racial/ethnic disparities in incident all‐cause and Alzheimer's disease dementia among older US men and women. Alzheimer's Dement. 2022;8:e12275. 10.1002/trc2.12275
May A. Beydoun had full access to the data used in this manuscript and completed all the statistical analyses.
REFERENCES
- 1. Sosa‐Ortiz AL, Acosta‐Castillo I, Prince MJ. Epidemiology of dementias and Alzheimer's disease. Arch Med Res. 2012;43:600‐608. [DOI] [PubMed] [Google Scholar]
- 2. Lindeboom J, Weinstein H. Neuropsychology of cognitive ageing, minimal cognitive impairment, Alzheimer's disease, and vascular cognitive impairment. Eur J Pharmacol. 2004;490:83‐86. [DOI] [PubMed] [Google Scholar]
- 3. Helmer C, Pasquier F, Dartigues JF. Epidemiology of Alzheimer disease and related disorders. Med Sci. 2006;22:288‐296. [DOI] [PubMed] [Google Scholar]
- 4. Honjo K, van Reekum R, Verhoeff NP. Alzheimer's disease and infection: do infectious agents contribute to progression of Alzheimer's disease?. Alzheimers Dement. 2009;5:348‐360. [DOI] [PubMed] [Google Scholar]
- 5. Matthews KA, Xu W, Gaglioti AH, et al. Racial and ethnic estimates of Alzheimer's disease and related dementias in the United States (2015‐2060) in adults aged >/= 65 years. Alzheimers Dement. 2019;15:17‐24. [DOI] [PMC free article] [PubMed] [Google Scholar]
- 6. Barnes DE, Yaffe K. The projected effect of risk factor reduction on Alzheimer's disease prevalence. Lancet Neurol. 2011;10:819‐828. [DOI] [PMC free article] [PubMed] [Google Scholar]
- 7. Babulal GM, Quiroz YT, Albensi BC, et al. Perspectives on ethnic and racial disparities in Alzheimer's disease and related dementias: update and areas of immediate need. Alzheimers Dement. 2019;15:292‐312. [DOI] [PMC free article] [PubMed] [Google Scholar]
- 8. Glymour MM, Manly JJ. Lifecourse social conditions and racial and ethnic patterns of cognitive aging. Neuropsychol Rev. 2008;18:223‐254. [DOI] [PubMed] [Google Scholar]
- 9. Vasquez E, Botoseneanu A, Bennett JM, Shaw BA. Racial/ethnic differences in trajectories of cognitive function in older adults. J Aging Health. 2016;28:1382‐1402. [DOI] [PubMed] [Google Scholar]
- 10. Griffith DM, Griffith PA. Commentary on "Perspective on race and ethnicity in Alzheimer's disease research". Alzheimers Dement. 2008;4:239‐241. [DOI] [PubMed] [Google Scholar]
- 11. Beydoun MA, Lhotsky A, Wang Y, et al. Association of adiposity status and changes in early to mid‐adulthood with incidence of Alzheimer's disease. Am J Epidemiol. 2008;168:1179‐1189. [DOI] [PMC free article] [PubMed] [Google Scholar]
- 12. Beydoun MA, Wang Y. Gender‐ethnic disparity in BMI and waist circumference distribution shifts in US adults. Obesity (Silver Spring). 2009;17:169‐176. [DOI] [PMC free article] [PubMed] [Google Scholar]
- 13. Hart VR, Gallagher‐Thompson D, Davies HD, DiMinno M, Lessin PJ. Strategies for increasing participation of ethnic minorities in Alzheimer's Disease Diagnostic Centers: a multifaceted approach in California. Gerontologist. 1996;36:259‐262. [DOI] [PubMed] [Google Scholar]
- 14. Mehta KM, Yaffe K, Perez‐Stable EJ, et al. Race/ethnic differences in AD survival in US Alzheimer's Disease Centers. Neurology. 2008;70:1163‐1170. [DOI] [PMC free article] [PubMed] [Google Scholar]
- 15. Center for Disease Control and Prevention (CDC) . The Third National Health and Nutrition Examination Survey (NHANES III 1988–94) Reference Manuals and Reports (CD‐ROM). Centers for Disease Control and Prevention; 1996. [Google Scholar]
- 16. Centers for Medicare and Medicaid . CMS Chronic Condition Data Warehouse Condition Categories. Centers for Medicare and Medicaid; 2010. [Google Scholar]
- 17. Center for Disease Control and Prevention . NHANES and CMS Linked Data Overview. Center for Disease Control and Prevention; 2012. [Google Scholar]
- 18. Human Nutrition Information Service UDoA . Survey Nutrient Database for NHANES III, Phase I. Human Nutrition Information Service; 1993. [Google Scholar]
- 19. McCullough ML, Feskanich D, Rimm EB, et al. Adherence to the dietary guidelines for Americans and risk of major chronic disease in men. Am J Clin Nutr. 2000;72:1223‐1231. [DOI] [PubMed] [Google Scholar]
- 20. Beydoun MA, Fanelli‐Kuczmarski MT, Allen A, et al. Monetary value of diet is associated with dietary quality and nutrient adequacy among urban adults, differentially by sex, race and poverty status. PLoS One. 2015;10:e0140905. [DOI] [PMC free article] [PubMed] [Google Scholar]
- 21. Kuczmarski MF, Mason MA, Allegro D, Zonderman AB, Evans MK. Diet quality is inversely associated with C‐reactive protein levels in urban, low‐income African‐American and white adults. J Acad Nutr Dietetics. 2013;113:1620‐1631. [DOI] [PMC free article] [PubMed] [Google Scholar]
- 22. Seeman T, Merkin SS, Crimmins E, Koretz B, Charette S, Karlamangla A. Education, income and ethnic differences in cumulative biological risk profiles in a national sample of US adults: nHANES III (1988‐1994). Soc Sci Med. 2008;66:72‐87. [DOI] [PMC free article] [PubMed] [Google Scholar]
- 23. STATA . Statistics/Data Analysis: Release 16.0. Stata Corporation; 2019. [Google Scholar]
- 24. NCHS . Office of Analysis and Epidemiology, Public‐use Third National Health and Nutrition Examination Survey Linked Mortality File. NCHS; 2010. [Google Scholar]
- 25. Lee KJ, Carlin JB. Multiple imputation for missing data: fully conditional specification versus multivariate normal imputation. Am J Epidemiol. 2010;171:624‐632. [DOI] [PubMed] [Google Scholar]
- 26. Thorpe RJ Jr, Koster A, Bosma H, et al. Racial differences in mortality in older adults: factors beyond socioeconomic status. Ann Behav Med. 2012;43:29‐38. [DOI] [PMC free article] [PubMed] [Google Scholar]
- 27. Marshall A, Altman DG, Holder RL, Royston P. Combining estimates of interest in prognostic modelling studies after multiple imputation: current practice and guidelines. BMC Med Res Methodol. 2009;9:57. [DOI] [PMC free article] [PubMed] [Google Scholar]
- 28. Ditlevsen S, Christensen U, Lynch J, Damsgaard MT, Keiding N. The mediation proportion: a structural equation approach for estimating the proportion of exposure effect on outcome explained by an intermediate variable. Epidemiology. 2005;16:114‐120. [DOI] [PubMed] [Google Scholar]
- 29. Milani SA, Lloyd S, Cottler LB, Striley CW. Racial and ethnic differences in Alzheimer's disease knowledge among community‐dwelling middle‐aged and older adults in Florida. J Aging Health. 2019;32(7‐8):564‐572. [DOI] [PMC free article] [PubMed] [Google Scholar]
- 30. Chen Y, Tysinger B, Crimmins E, Zissimopoulos JM. Analysis of dementia in the US population using Medicare claims: insights from linked survey and administrative claims data. Alzheimers Dement (N Y). 2019;5:197‐207. [DOI] [PMC free article] [PubMed] [Google Scholar]
- 31. Gianattasio KZ, Prather C, Glymour MM, Ciarleglio A, Power MC. Racial disparities and temporal trends in dementia misdiagnosis risk in the United States. Alzheimers Dement (N Y). 2019;5:891‐898. [DOI] [PMC free article] [PubMed] [Google Scholar]
- 32. Howell JC, Watts KD, Parker MW, et al. Race modifies the relationship between cognition and Alzheimer's disease cerebrospinal fluid biomarkers. Alzheimers Res Ther. 2017;9:88. [DOI] [PMC free article] [PubMed] [Google Scholar]
- 33. Avila JF, Vonk JMJ, Verney SP, et al. Sex/gender differences in cognitive trajectories vary as a function of race/ethnicity. Alzheimers Dement. 2019;15:1516‐1523. [DOI] [PMC free article] [PubMed] [Google Scholar]
- 34. Weuve J, Barnes LL, Mendes de Leon CF, et al. Cognitive aging in Black and White Americans: cognition, cognitive decline, and incidence of Alzheimer disease dementia. Epidemiology. 2018;29:151‐159. [DOI] [PMC free article] [PubMed] [Google Scholar]
- 35. Zeng J, Chen L, Wang Z, et al. Marginal vitamin A deficiency facilitates Alzheimer's pathogenesis. Acta Neuropathol. 2017;133:967‐982. [DOI] [PubMed] [Google Scholar]
- 36. Douaud G, Refsum H, de Jager CA, et al. Preventing Alzheimer's disease‐related gray matter atrophy by B‐vitamin treatment. Proc Natl Acad Sci U S A. 2013;110:9523‐9528. [DOI] [PMC free article] [PubMed] [Google Scholar]
- 37. Shahar S, Lee LK, Rajab N, et al. Association between vitamin A, vitamin E and apolipoprotein E status with mild cognitive impairment among elderly people in low‐cost residential areas. Nutr Neurosci. 2013;16:6‐12. [DOI] [PubMed] [Google Scholar]
- 38. de Jager CA, Oulhaj A, Jacoby R, Refsum H, Smith AD. Cognitive and clinical outcomes of homocysteine‐lowering B‐vitamin treatment in mild cognitive impairment: a randomized controlled trial. Int J Geriatr Psychiatry. 2012;27:592‐600. [DOI] [PubMed] [Google Scholar]
- 39. Johnson EJ, McDonald K, Caldarella SM, Chung HY, Troen AM, Snodderly DM. Cognitive findings of an exploratory trial of docosahexaenoic acid and lutein supplementation in older women. Nutr Neurosci. 2008;11:75‐83. [DOI] [PubMed] [Google Scholar]
- 40. Bowman GL, Dodge HH, Guyonnet S, et al. A blood‐based nutritional risk index explains cognitive enhancement and decline in the multidomain Alzheimer's prevention trial. Alzheimers Dement (N Y). 2019;5:953‐963. [DOI] [PMC free article] [PubMed] [Google Scholar]
- 41. Gu Y, Guo J, Moshfegh AJ. Race/ethnicity and gender modify the association between diet and cognition in U.S. older adults: National Health and Nutrition Examination Survey 2011–2014. Alzheimers Dement (N Y). 2021;7:e12128. [DOI] [PMC free article] [PubMed] [Google Scholar]
- 42. Hillman CH, Erickson KI, Kramer AF. Be smart, exercise your heart: exercise effects on brain and cognition. Nat Rev Neurosci. 2008;9:58‐65. [DOI] [PubMed] [Google Scholar]
- 43. Colcombe SJ, Erickson KI, Raz N, et al. Aerobic fitness reduces brain tissue loss in aging humans. J Gerontol A Biol Sci Med Sci. 2003;58:176‐180. [DOI] [PubMed] [Google Scholar]
- 44. E L, Burns JM, Swerdlow RH. Effect of high‐intensity exercise on aged mouse brain mitochondria, neurogenesis, and inflammation. Neurobiol Aging. 2014;35:2574‐2583. [DOI] [PMC free article] [PubMed] [Google Scholar]
- 45. Cotman CW, Berchtold NC. Exercise: a behavioral intervention to enhance brain health and plasticity. Trends Neurosci. 2002;25:295‐301. [DOI] [PubMed] [Google Scholar]
- 46. Caffino L, Mottarlini F, Fumagalli F. Born to protect: leveraging BDNF against cognitive deficit in Alzheimer's disease. CNS Drugs. 2020;34:281‐297. [DOI] [PubMed] [Google Scholar]
- 47. Douglas MD, Dawes DE, Holden KB, Mack D. Missed policy opportunities to advance health equity by recording demographic data in electronic health records. Am J Public Health. 2015;105:S380‐S388. [DOI] [PMC free article] [PubMed] [Google Scholar]
Associated Data
This section collects any data citations, data availability statements, or supplementary materials included in this article.
Supplementary Materials
Supporting Information
Supporting Information
Supporting Information