Abstract
Harmonization and traceability are related metrological principles that are indispensable to assuring measurement comparability across different biomonitoring studies. The Children’s Health Exposure Analysis Resource (CHEAR) was established in 2015 with six laboratories providing environmental exposure measurements on biospecimens. To ensure harmonization across studies for trace elements, CHEAR used a multi-faceted approach that included: 1) an initial interlaboratory validation exercise based on the analysis of certified blood and urine reference materials; 2) frequent participation in an established interlaboratory proficiency program for trace elements; and 3) analysis of a common pool of well-characterized biological reference materials with each analytical batch. Method accuracy and precision were established for each laboratory via analysis of NIST SRM 955c Toxic Elements in Caprine Blood, SRM 2668 Toxic Elements in Frozen Human Urine and SRM 3668 Mercury, Perchlorate, and Iodide in Frozen Human Urine. The differences among the six laboratories for As, Cd, Hg, and Mn in urine and Cd, Hg, and Pb in whole blood were judged to be fit-for-purpose. Interlaboratory performance over a 5-year period demonstrated an improvement in performance, such that for 2018–2019, >99% of challenges for urine As, Cd, Hg, and Mn, and 95% for whole blood Cd, Hg, Pb, and Mn, were found to be satisfactory. The CHEAR common reference materials were analyzed by at least 5 laboratories for 22 elements in urine and 13–14 elements in whole blood, thus providing a rich source of data to assess intra- and inter-run performance. The suite of trace elements with assigned values in both blood and urine matrices are more comprehensive than similar reference materials from other sources, and is reflective of the concentrations necessary to support biomonitoring studies. While some areas for future improvement were identified, significant progress was made to improve harmonization of trace element measurements in biological matrices among the CHEAR network labs.
Keywords: Harmonization, biomonitoring, trace elements, proficiency testing, external quality assessment, children’s health
1. Introduction
Harmonization and traceability are essential metrological principles, indispensable to the interdisciplinary field of environmental chemistry and human health. Use of unreliable laboratory data in epidemiological studies can lead to erroneous findings at the individual cohort level, the sum of which could result in a lack of consensus in the literature and challenges in interpretation and conclusions thereof. High-quality analytical data are even more important when informing public health policies that may affect children’s health. Thus, analytical chemists working on human health studies have an obligation to 1) develop and validate methods based on sound metrological principles to the highest standard practical; 2) scrutinize the data generated before reporting results; and 3) collaborate with the end-users through the publication process for contextualization and articulating the limitations of the data being reported.
Harmonization has been defined as data that are “comparable, irrespective of the measurement procedure used and where and/or when a measurement is made.”(Plebani, 2016) In the broadest sense, harmonization includes considerations for sample collection, shipping conditions, preparation, analysis, reporting, and review of all associated data; thus the measurement itself is only one facet to consider.(Plebani, 2013) The concept of harmonization is especially important for biological samples in clinical patient testing models, where physicians order patient testing for screening/diagnosis and the lack of harmonization has clear clinical repercussions.(Greenberg, 2014) Interlaboratory agreement can be assessed and promoted in round-robins, external quality assessment (EQA) schemes, proficiency testing (PT), or by splitting samples between labs performing the same test(s). For trace elements, the determination of blood Pb has long been the standard for defining quality specifications for clinical testing purposes, and thus has established regulations defining “acceptable” between-lab variation, which have been updated over the last four decades. However, quality specifications for other trace elements are less well established; many PT and EQA schemes today include a number of trace elements that have been added over time as technologies and lab capabilities have improved. The need to achieve a consensus and harmonization among different trace element PT/EQA schemes resulted in the formation of the Occupational and Environmental Laboratory Medicine (OELM) network more than 20 years ago, which serves as a model for international harmonization of clinical measurements. (Taylor et al., 2006)
Traceability has been defined as “the establishment of one or more relationships to well-stated references or standards.”(Taverniers et al., 2004) The highest-order metrological standard is the Système Internationale (SI) unit. The definitions for seven basic units are maintained at the Bureau International des Poids et Mesure (BIPM, France), including mass (kg) and amount (mol). Primary reference materials (RMs) are maintained at various National Metrological Institutes (NMIs) and are certified against SI units with a statement of uncertainty. Matrix-based certified reference materials (CRMs) and Standard Reference Materials® (SRMs) are characterized against the primary reference standard (with a statement of uncertainty). Within a laboratory, appropriate CRMs/SRMs can be used to characterize an in-house quality control material (QCM), which is subsequently analyzed alongside all routine samples. The Joint Committee of Traceability in Laboratory Medicine (JCTLM), an international consortium that includes the BIPM, was established in 2002 to promote the standardization of clinical laboratory testing (https://www.bipm.org/en/committees/jc/jctlm/). The JCTLM includes a Non-Electrolyte Metals Review Team that reviews nominations for CRMs and reference procedures intended for use in trace element analysis in clinical matrices.
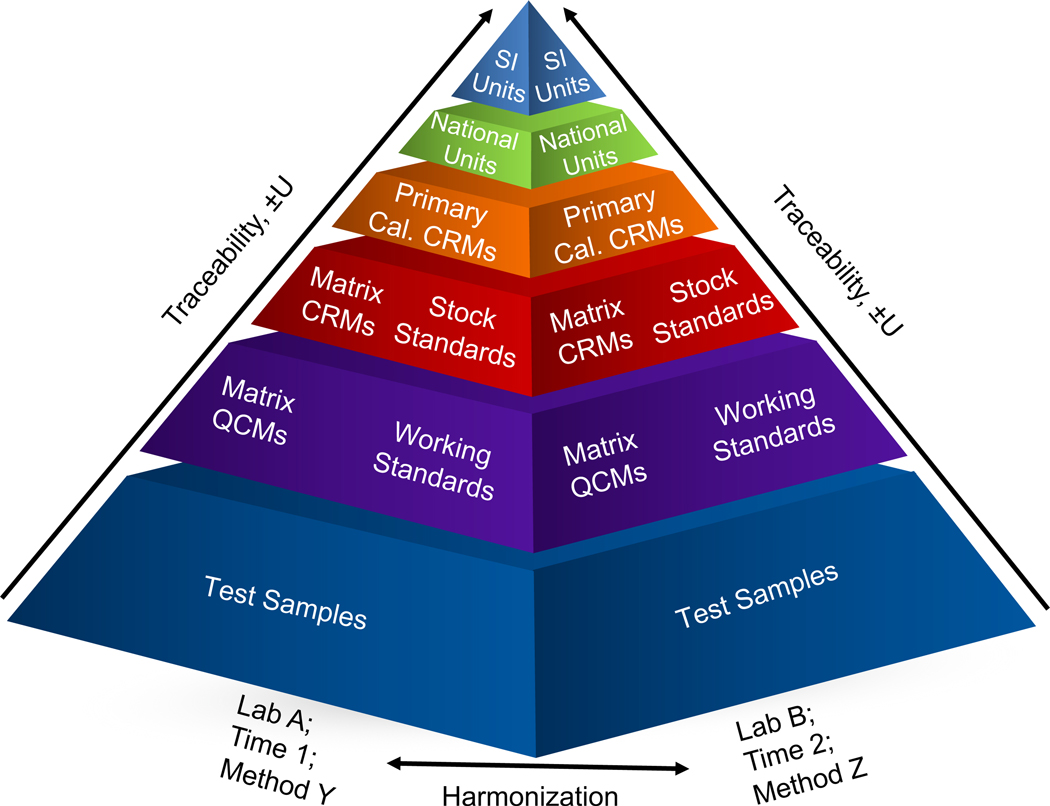
As illustrated in Fig. 1, traceability and harmonization are interrelated. Assuming that each laboratory has established a chain of traceability, typically via calibration standards, and an independent verification such as SRMs, CRMs, QCMs, or sample spikes, it is reasonable to deduce the measurements generated by the laboratories should be harmonized within some degree of uncertainty. The use of EQA and/or other periodic checks represents opportunities to verify that deduction and to improve harmonization where possible.
Figure 1.
The pyramid of traceability shows the metrological order linking test samples back to the SI units. Two pyramids are shown that represent variables: measurements made in different laboratories, using different methodologies, differences in time, or any combination thereof. When each measurement is traceable, the measurements should be harmonized with one another, within some degree of uncertainty.
In this report, we focus on efforts to achieve measurement harmonization and traceability within the Children’s Health Exposure Analysis Resource (CHEAR), which was funded by the US National Institutes of Health (NIH) through the National Institute for Environmental Health Sciences (NIEHS). CHEAR was established in 2015 and included a network of six laboratories (labs), a Coordinating Center (CC), and a Data Center (DC). More detailed information about the CHEAR program can be found elsewhere. (Balshaw et al., 2017; Wright et al., 2018) One of the major goals of the CHEAR program was to establish a repository of exposure and outcome data, combinable across different children’s studies. Thus, achieving harmonization of the laboratory data is absolutely essential and the steps taken towards that goal are the subject of this report. While trace element measurements for CHEAR encompasses more than 20 elements in various biological matrices, this report focuses on As, Cd, Hg, and Mn in urine and Cd, Hg, Mn, and Pb whole blood because of their importance to human health in the respective matrices. Complete datasets for many other elements are available as Electronic Supplementary Information (ESI), as noted in the relevant sections. Specifically, this report discusses: 1) the initial validation studies conducted with matrix appropriate SRMs; 2) laboratory performance in the New York State Department of Health’s (NYS DOH) Biomonitoring PT Program for Trace Elements; and 3) the production and characterization of common CHEAR QC pools (i.e., CHEAR RMs).
2. Methods
2.1. Initial validation studies
All six CHEAR labs obtained National Institute of Standards and Technology (NIST) Standard Reference Material (SRM) 955c Toxic Elements in Caprine Blood, SRM 2668 Toxic Elements in Frozen Human Urine and SRM 3668 Mercury, Perchlorate, and Iodide in Frozen Human Urine (NIST, Gaithersburg, MD). Table 1 lists the six CHEAR laboratories in alphabetical order, including the lab name and primary scientist(s) responsible for the data included in this report. Each CHEAR lab was asked to analyze the aforementioned SRMs in triplicate in 3 independent runs and report the results via template back to the coordinating laboratory at the Wadsworth Center. The results were compiled into a report that included each individual lab-mean; the expanded uncertainty (ULAB) for each mean value was calculated using the following equation: (Sharpless et al., 2008)
| Eqn. 1 |
where u is the standard uncertainty, k is the coverage factor (2 to represent a 95% confidence interval), SD is the standard deviation of the participant-reported replicate values, n is the number of measurements performed (3), and UCRM is the expanded uncertainty reported on the certificate of analysis (CoA) by NIST.(Sharpless et al., 2008) These data were graphed using Prism (7.0, GraphPad Software, San Diego, CA) software and a report was distributed to each of the CHEAR laboratories. Data for Level 1 from SRMs 2668/3668 and Levels 1 and 2 from SRM 955c are reported in section 3.1 as examples that highlight several key elements of concern at biomonitoring concentrations.
Table 1.
CHEAR Laboratories that contributed data to the initial validation with NIST SRMs and the NYS PT Program.
| CHEAR Laboratory | City, State | Principal scientist(s) |
|---|---|---|
| Michigan CHEAR Laboratory Hub | Ann Arbor, MI | John Meeker, Scott Clipper |
| Minnesota CHEAR Exposure Assessment Hub | Minneapolis, MN | Lisa Peterson, Carin Huset |
| Mount Sinai CHEAR Network Lab Hub | New York, NY | Robert Wright, Chitra Amarasiriwardena |
| National Exposure Assessment Laboratory at Emory | Atlanta, GA | Gary Miller, Dana Barr |
| RTI CHEAR Exposure Assessment Hub | Research Triangle Park, NC | Timothy Fennell, Keith Levine |
| Wadsworth Center’s CHEAR | Albany, NY | Patrick Parsons, Christopher Palmer |
2.2. New York State Department of Health’s Biomonitoring PT Program for Trace Elements
The NYS DOH PT Program for Blood Lead was launched in the early 1970s as a regulatory tool to support childhood lead poisoning prevention programs. Over the subsequent four decades, the PT program expanded to include As, Cd, Hg, and Pb in whole blood and urine, and Al, Cu, Se, and Zn in serum. In 2015, the PT program transitioned from mandatory participation for regulatory purposes to a voluntary model to support biomonitoring measurements. An expanded suite of elements was developed at very low concentrations for biomonitoring purposes that included: As, Be, Ba, Cd, Hg, Mn, Pb, Tl, and U in urine; As, Cd, Cr, Co, Hg, Mn, and Pb in whole blood; and Al, Cu, Se, and Zn in serum. In 2017, Co and Cr were added to the list of elements in urine and serum that could be graded based on consensus criteria proposed by the OELM network. The PT program also receives and compiles data for up to an additional 25 elements in urine, whole blood, and serum. This provides a more complete characterization of the PT materials. However, these additional data are provided for informational purposes only, without formal grading. The availability of the informational data is used to evaluate potential additions to the graded element panels, including appropriate quality specifications.
The NYS Biomonitoring PT program includes 3 challenges per year with 5 samples per matrix per event. The Program typically enrolls 25–30 participant laboratories annually that include: US state public health laboratories, US federal laboratories (Centers for Disease Control and Prevention (CDC), and the Department of Defense), laboratories associated with 3 other trace element PT/EQA scheme organizers, international labs, and several others including the CHEAR laboratories. Although all six of the CHEAR labs participated initially with Event #1, 2016, one discontinued after Event #2, 2016. Data from that lab are included in this report where available. For the purposes of this study, all data reported by CHEAR and non-CHEAR labs are included for completeness; however, the focus is on performance of the CHEAR labs.
Definitions. Pass/Fail:
A result reported for a PT challenge sample can be graded as a pass (or fail) based on the quality specifications established for a given element and matrix. Quality specifications are the criteria used to define the acceptable range based on the analyte concentration and matrix; the quality specifications used by the NYS Biomonitoring PT Program are derived from established sources, including the OELM. Satisfactory/Unsatisfactory: Performance on a specific PT event may be judged satisfactory if the participant achieves a score of 80% or better, i.e., achieving a “pass” for at least 4 out of 5 challenge samples. Successful/Unsuccessful: Successful PT status is achieved when a laboratory maintains satisfactory performance on two out of three consecutive PT events; for the purposes of this report, PT status was evaluated on a calendar basis. This approach is consistent with the requirements for laboratory performance prescribed under the US Clinical Laboratory Improvement Amendments of 1988.(CLIA, 1988)
2.3. CHEAR Reference Materials
Two pools of urine (designated as “low” and “high”) were prepared by the NYS DOH’s Wadsworth Center for analysis along with batches of CHEAR project samples analyzed for trace elements. Urine was collected from anonymous volunteer donors into polyethylene containers and stored at 4°C. Collection of urine for quality assurance purposes was considered exempt by the NYS DOH Institutional Review Board (IRB, protocol 03–045). Following collection, urine was acidified to 1% (v/v) with double-distilled nitric acid and mixed with a sulfamic acid preservative solution, which contained 200 mg/mL sulfamic acid and 10% (v/v) Triton-X 100™, to yield a final concentration of 1% (v/v) to stabilize Hg. Urine pools were stored frozen at – 80°C and subsequently thawed to room temperature; precipitated salts were removed via centrifugation. Supernatants were combined to create two separate pools, and precipitates discarded. Each urine pool was analyzed by inductively coupled plasma mass spectrometry (ICPMS) to estimate endogenous trace element concentrations; each of the two pools were individually supplemented with single element standards to produce “low” and “high” concentrations appropriate for biomonitoring purposes. Up to 25 elements were supplemented in each urine pool including: Al, As, Ba, Be, Cd, Co, Cr, Cs, Cu, Hg, Mn, Mo, Ni, Pb, Pt, Sb, Se, Sn, Sr, Te, Tl, U, V, W, and Zn (High Purity Standards, North Charleston, SC). Supplemented pools were stirred overnight to ensure thorough mixing prior to aliquoting 10 mL into 13-mL polypropylene vials (Sarstedt, Nümbrecht, Germany). Individual samples were stored frozen at – 80°C. Approximately 30 samples from each pool were thawed and distributed in the NYS Biomonitoring PT Program as part of Event #3, 2017, and labelled as UE17–14 and UE17–15 for the low and high pools, respectively. The remaining samples were stored frozen at –80 °C until requested by a CHEAR laboratory. Target values were assigned for 15 elements in each level based on the robust mean of 10 to 21 laboratories participating in Event #3, 2017. The robust mean was calculated based on Algorithm A as described by ISO 13528 (ISO-13528:2015(E), 2015). Target values were assigned for an additional 7 elements but calculated as the arithmetic mean of data reported by 5 to 9 participants.
Human whole blood preserved with K2EDTA in standard blood bags (“units”) were purchased from ZenBio, Inc. (Research Triangle Park, NC). A matching blood sample was provided with each unit in a standard evacuated blood tube for analysis by ICP-MS to assess endogenous levels of key trace elements; these data were used to determine which units of whole blood to combine to produce the low versus the high pools. The company certifies that the blood material was tested and found “non-reactive” for HBsAg, HBV DNA, HIV-1,2 Ab, HIV-1 RNA, HCVAb, HCV RNA, and STS. Each unit of whole blood was filtered into a polypropylene container through cheesecloth to remove particulates. Each of the two blood pools was supplemented with up to 22 elements using single-element stock solutions at concentrations appropriate for biomonitoring: As, Ba, Be, Cd, Co, Cr, Cu, Hg, Mn, Mo, Ni, Pb, Pt, Sb, Se, Sn, Ti, Tl, U, V, W, and Zn (High Purity Standards, North Charleston, SC). Whole blood pools were thoroughly mixed overnight prior to aliquoting 2 mL into polypropylene vials (Nalgene cryovials, Thermo Fisher Scientific, Waltham, MA). Individual samples were stored at –80°C. Approximately 30 samples of each pool were thawed and distributed in the NYS Biomonitoring PT Program as part of Event #3, 2017, labelled as BE17–11 and BE17–13 for the low and high levels, respectively. The remaining vials were stored frozen until requested by a CHEAR laboratory. Target values were assigned for 4 elements in each level based on the robust mean of 12–17 laboratories participating in Event #3, 2017. Target values for an additional 9 elements were calculated as the arithmetic mean of data reported by 5–9 labs.
3. Results and Discussion
3.1. Initial validation study: NIST SRMs
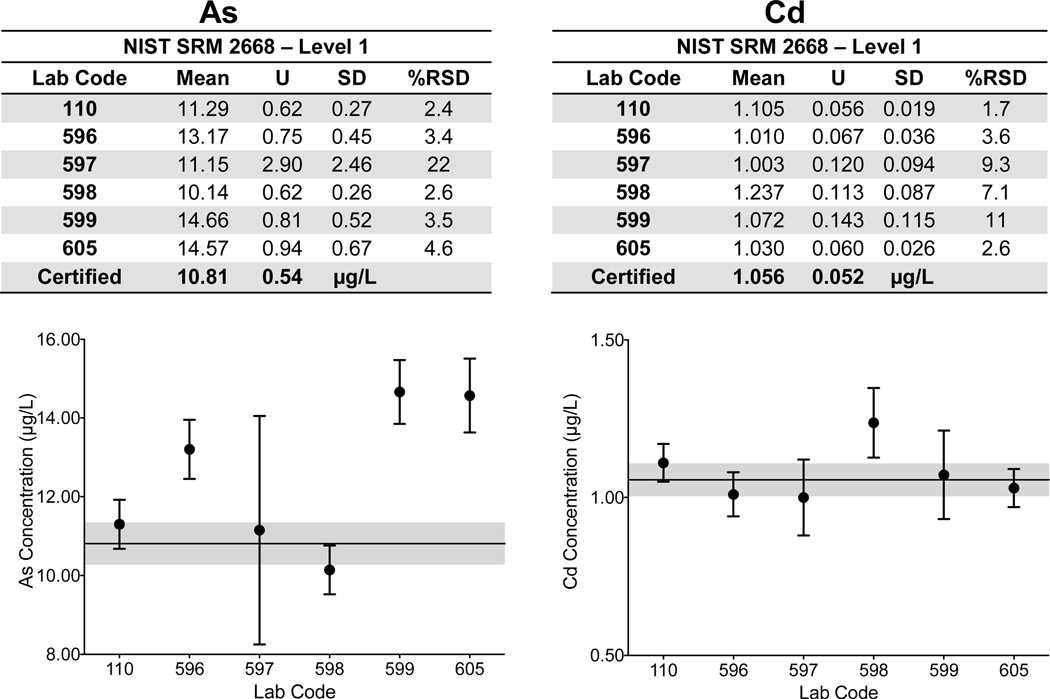
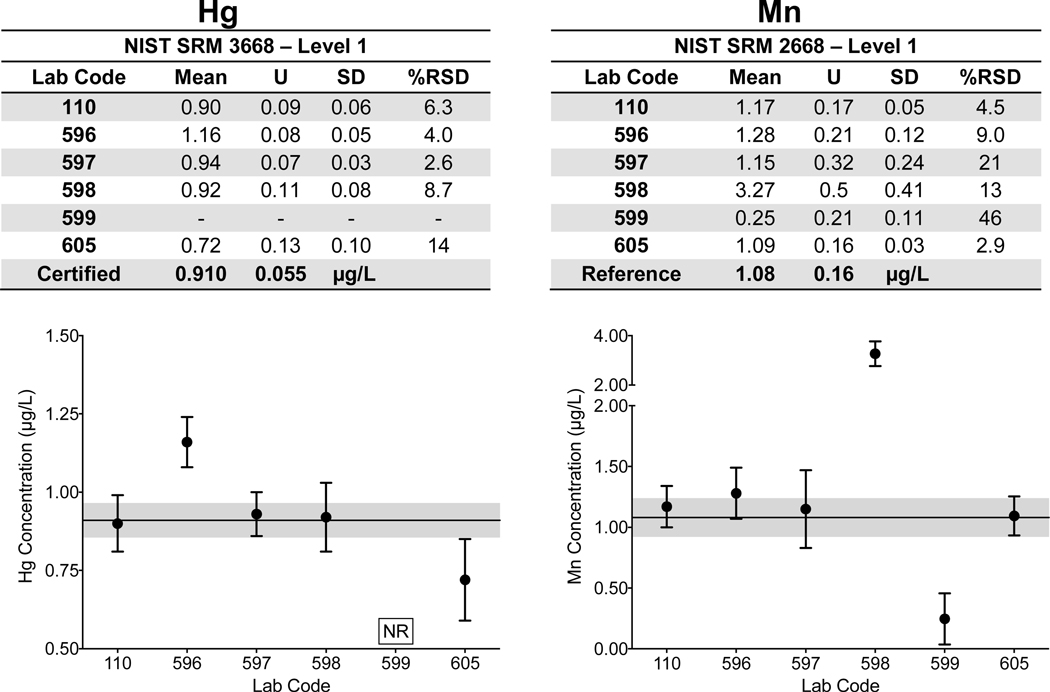
Urine. Laboratory-specific mean, ULAB, SD, and %RSD are shown in Fig 2a–d for As, Cd, and Mn in Level 1 of NIST SRM 2668 Toxic Elements in Frozen Human Urine and Hg in Level 1 of NIST SRM 3668 Mercury, Perchlorate, and Iodine in Frozen Human Urine. The NIST certified value (As, Cd, Hg) or reference (Mn) value and associated U are also reported. The data for each element shown in Fig 2a–d depict the lab-reported mean ±ULAB for each of the six labs; the NIST certified/reference value is represented by the solid black line, while the gray area denotes the NIST ±USRM and quality specification for the NYS Biomonitoring PT Program are represented by the dashed black lines. Corresponding data for each of the other elements with certified or reference values in SRMs 2668/3668 are available in ESI Fig 1 with the exception of I, for which only one CHEAR laboratory reported data for.
Figure 2.
Lab-reported mean, ULAB, SD, and %RSD are shown by lab code alongside the NIST certified or reference value (black line) and associated USRM (gray area) for As (2a), Cd (2b), Hg (2c), and Mn (2d) in Level 1 of NIST SRM 2668 Toxic Elements in Frozen Human Urine and NIST SRM 3668 Mercury, Perchlorate, and Iodine in Frozen Human Urine. The acceptable range as defined by quality specifications used for PT purposes are represented as dashed black lines.
Within-laboratory precision based on triplicate analyses of SRMs 2668/3668 varied among the six laboratories and for each of the elements reported: 2.4% – 22% RSD for As (10.81 μg/L); 1.7% – 11% RSD for Cd (1.056 μg/L); 2.6% – 14% for Hg (0.91μg/L); and 2.9% – 46% for Mn (1.08 μg/L). Poorer precision (>20% RSD) was evident for Mn reported by two labs (597 and 599) and for one lab reporting As (597). Some CHEAR labs demonstrated better accuracy and precision for urine As in NIST SRM 2668 than did others, i.e., they reported mean values that were closer to the assigned value, and their within-lab uncertainty overlapped the SRM expanded uncertainty. However, all of the CHEAR labs exhibited acceptable performance when evaluated against the quality specifications used for PT purposes (±6 μg/L). Thus, it is important to interpret those data based on whether it is deemed ‘fit-for-purpose’. Similarly, accuracy and precision for urine Cd was excellent, and deemed fit-for-purpose for all six labs. Only five of the CHEAR labs reported measuring Hg in SRM 3668. Accuracy and precision for urine Hg was fit-for-purpose for all 5 labs. However, only four had acceptable accuracy for Mn in urine while two reported values that were three times larger than, and four times smaller than the reference value, respectively. Both were outside of the PT quality specifications set for urine Mn at this concentration (±0.55 μg/L).
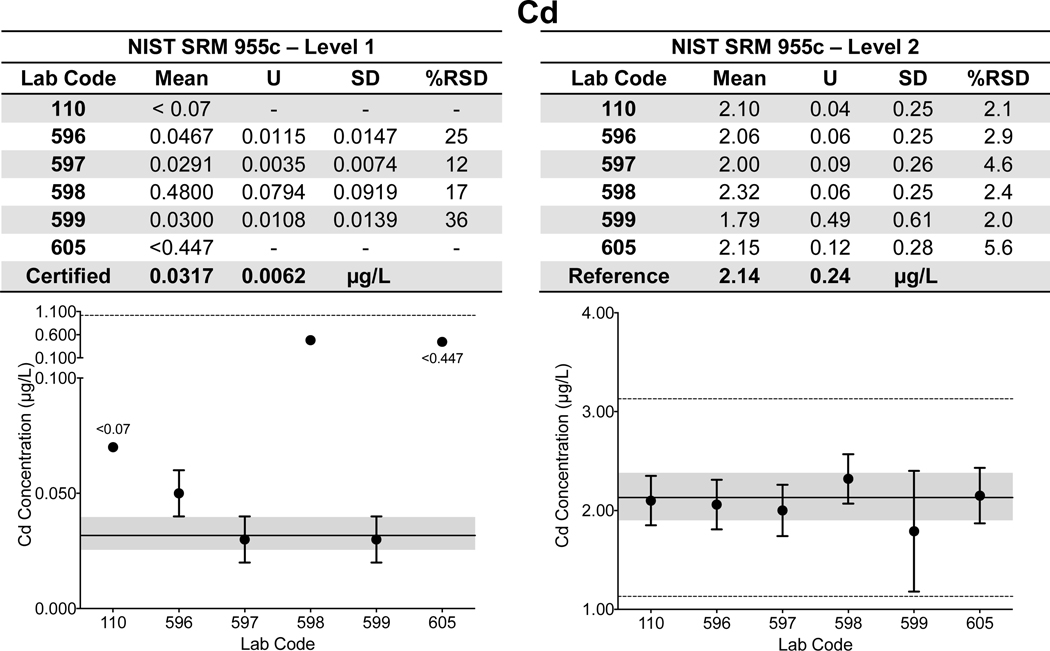
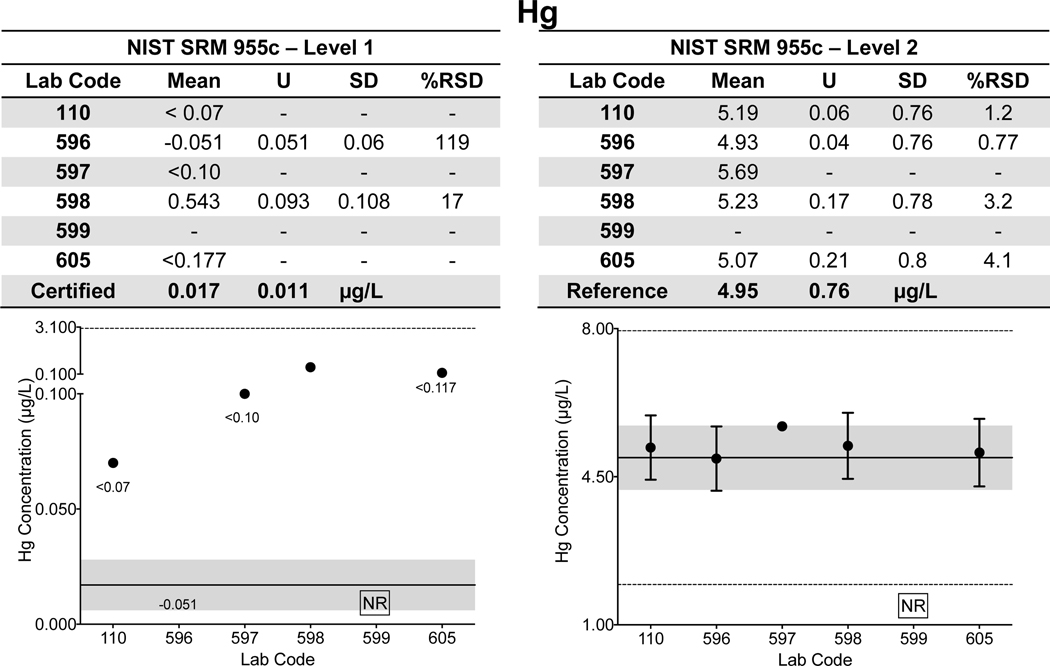
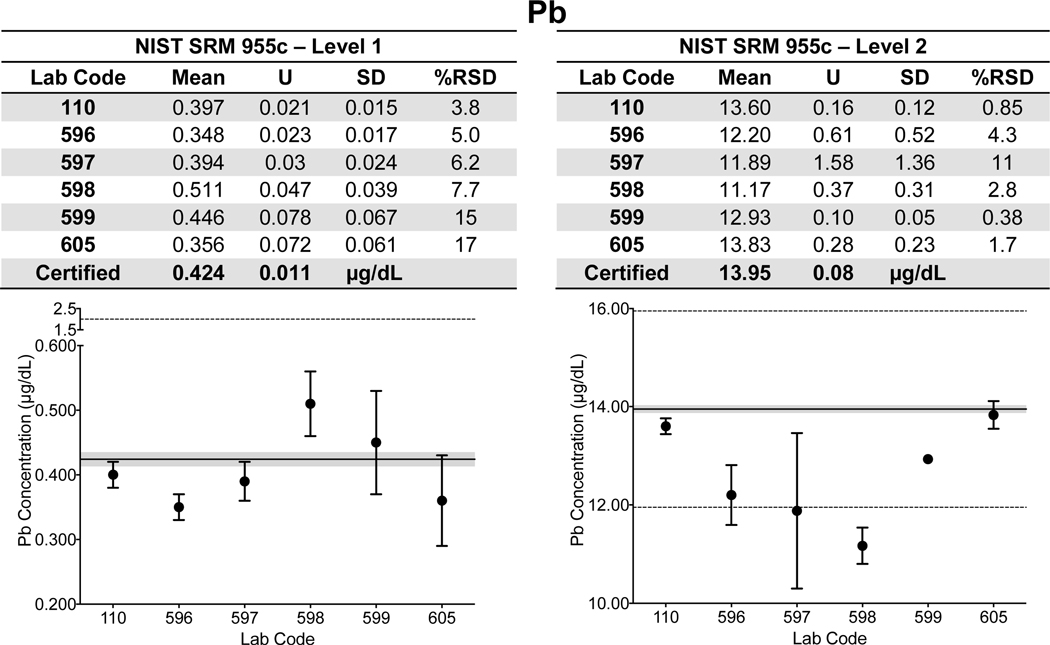
Whole Blood. Lab-specific mean, expanded uncertainty (ULAB), SD, and %RSD for Cd, Hg, and Pb in both Level 1 and 2 of NIST SRM 955c Toxic Elements in Caprine Blood are shown tabulated and plotted in Fig. 3 a–c. NIST assigned values are also provided in Fig. 3 a–c and are denoted as a solid black line with the gray area representing NIST ±USRM. Data for whole blood As in SRM 955c is shown in ESI Fig 1q. Note that the information in Fig. 3 a–c and ESI Fig 1q was based on the information provided on the CoA in 2016; the CoA was updated earlier this year to include certified values for Level 2 for Cd (2.16 ± 0.22 μg/L) and total Hg (5.42 ± 0.66 μg/L). Data for SRM 955c Level 1 are shown in Fig. 3 a–c for completeness, however, Cd and Hg were either not detectable or not reported by a number of labs. Accuracy and precision for Cd and Hg in Level 2 of SRM 955c were acceptable for all labs. Within-lab precision for blood Pb in SRM 955c varied from 3.8% – 17% RSD in Level 1 (0.424 μg/dL) and 0.38% – 11% RSD in Level 2 (13.95 μg/dL). Accuracy for blood Pb in SRM 955c Level 1 was better than ±0.1 μg/dL for all CHEAR labs but varied from <1% to as much as 13.9% for Level 2. For Level 2, one CHEAR lab would have been “graded” as unsatisfactory based on the PT criteria, while another would have been marginal. The reason(s) for poorer performance at elevated blood Pb levels is unclear, but it was also evident with the PT challenges, and is discussed in more detail in section 3.2.
Figure 3.
Lab-reported mean, ULAB, SD, and %RSD are shown by lab code alongside the NIST certified or reference value (black line) and associated USRM (gray area) for Cd (3a), Hg (3b), and Pb (3c) in Levels 1 and 2 of NIST SRM 955c Toxic Elements in Caprine Blood. The acceptable range as defined by quality specifications used for PT purposes are represented as dashed black lines.
3.2. Ongoing assessment in the New York State Biomonitoring PT Program for Trace Elements
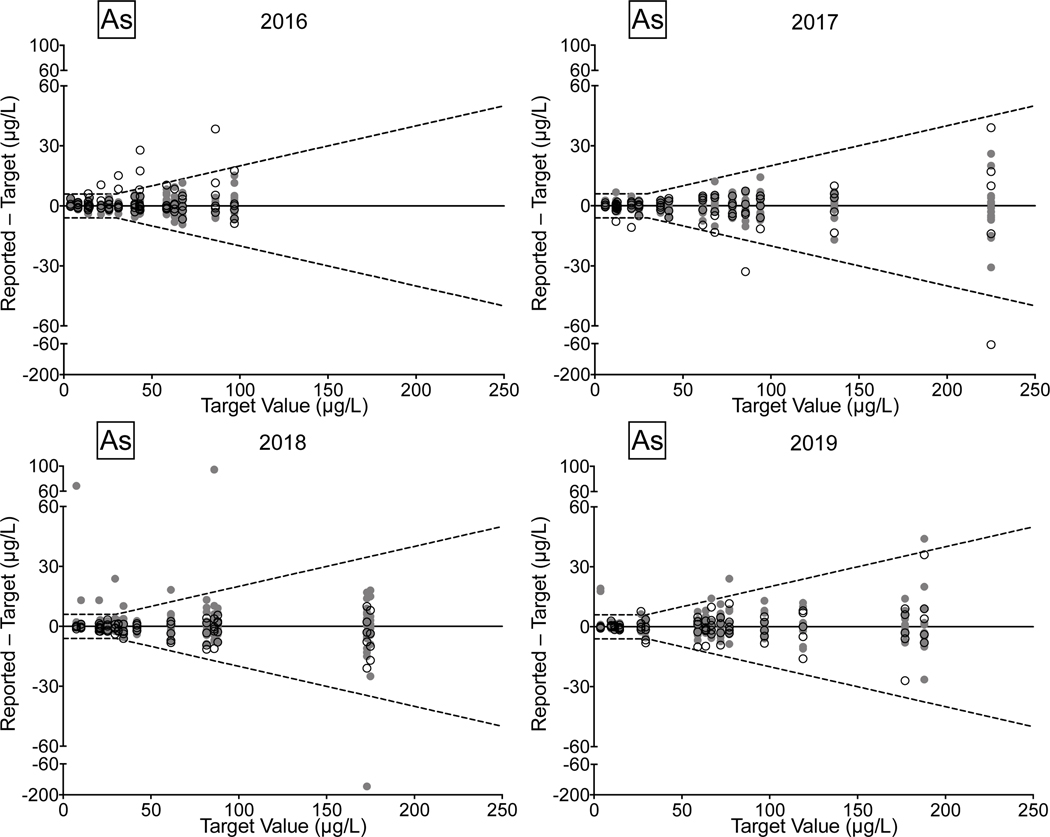
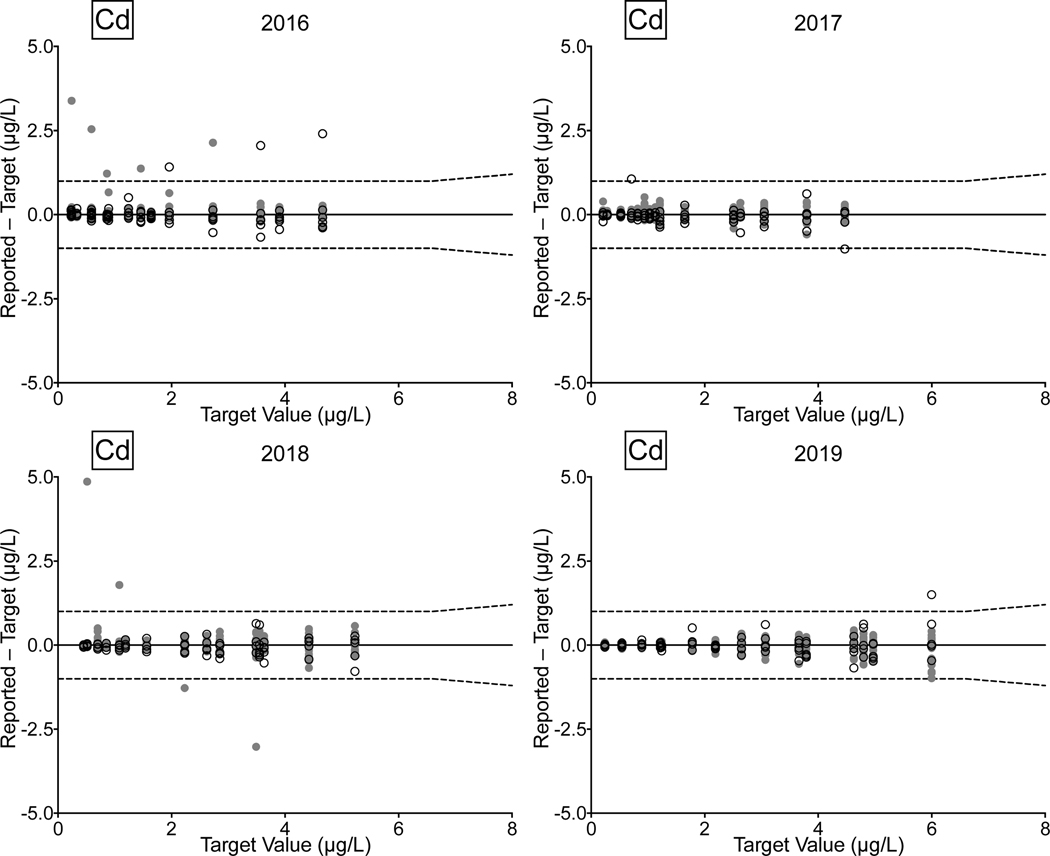
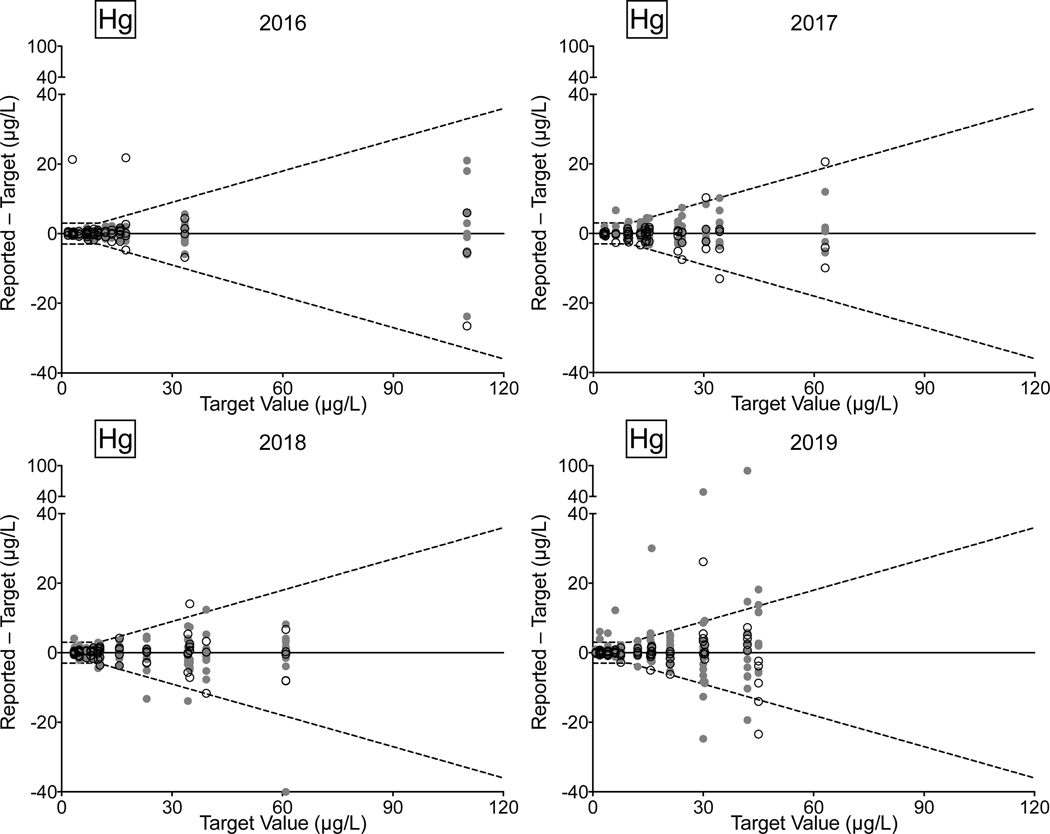
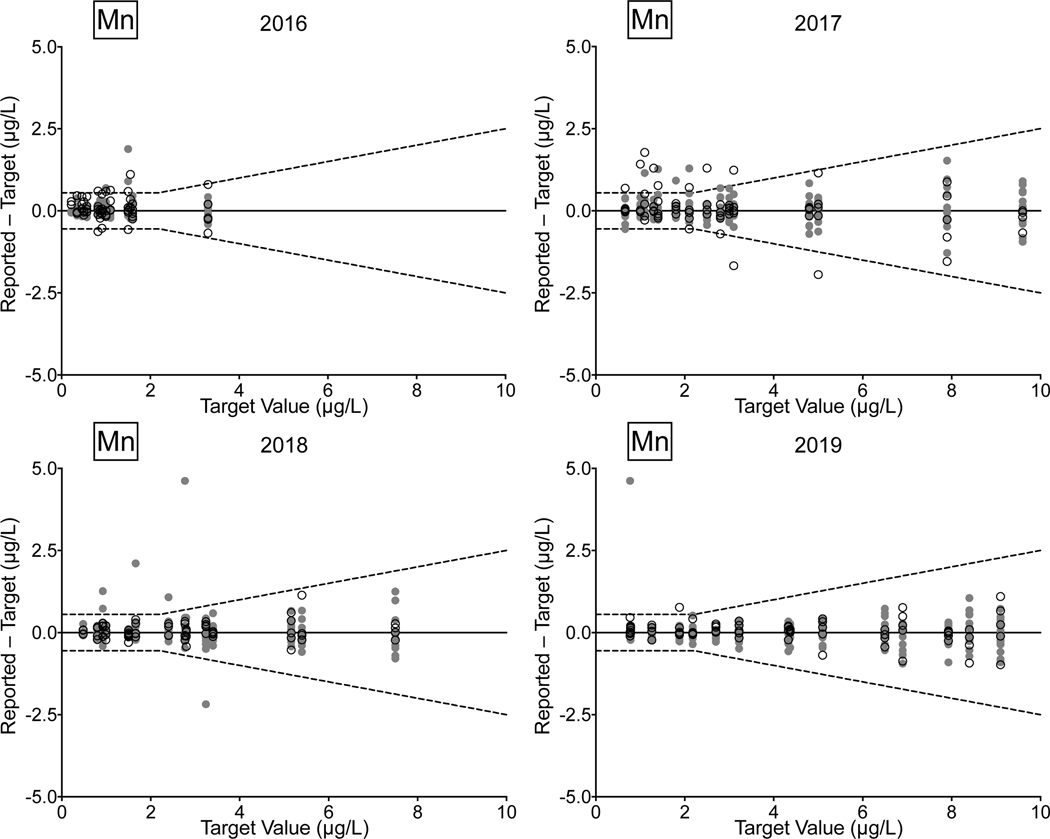
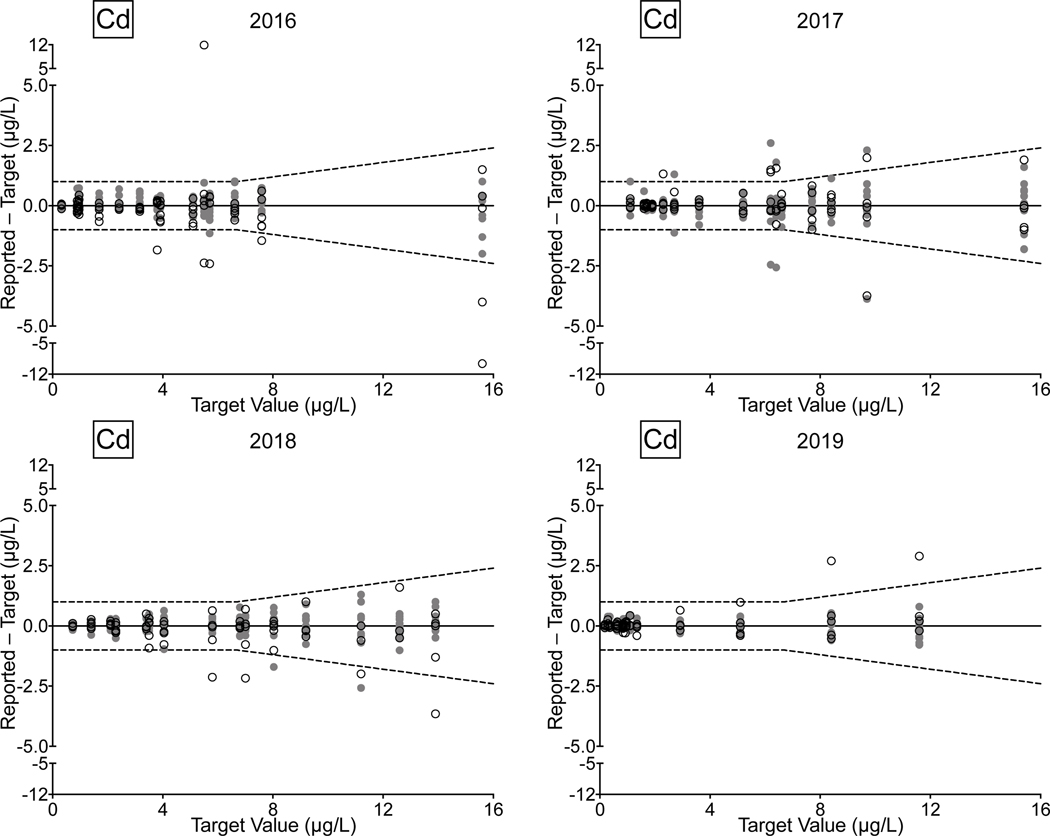
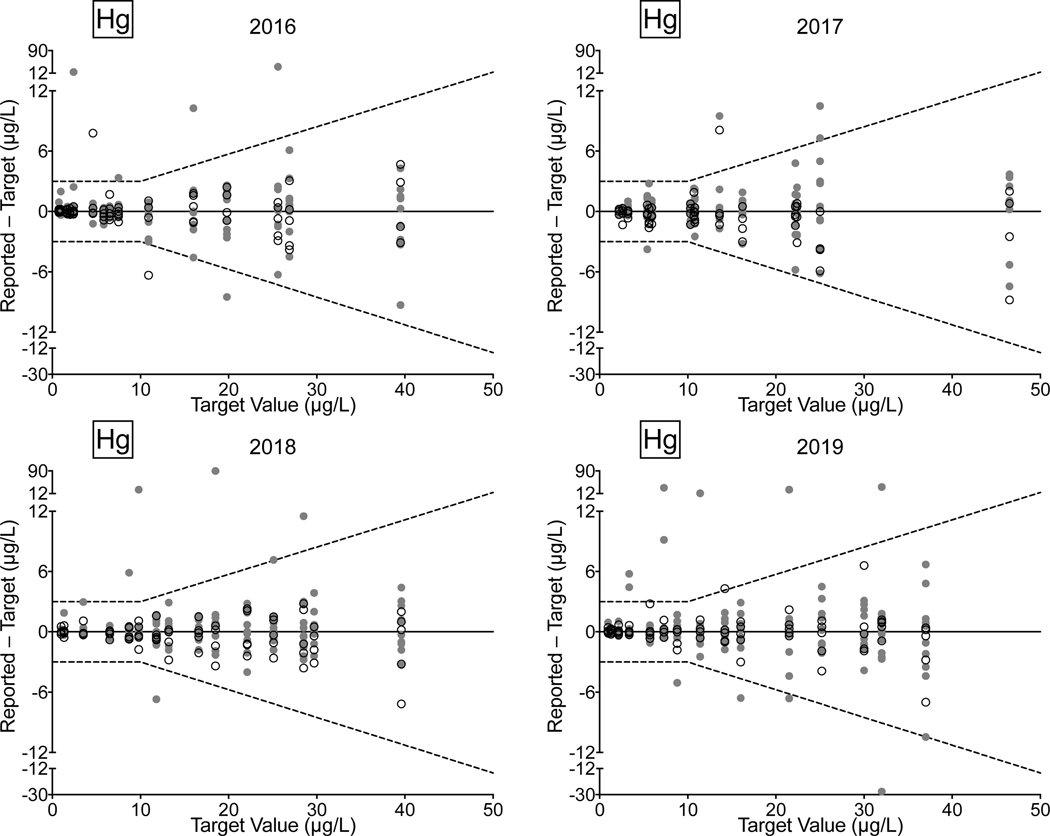
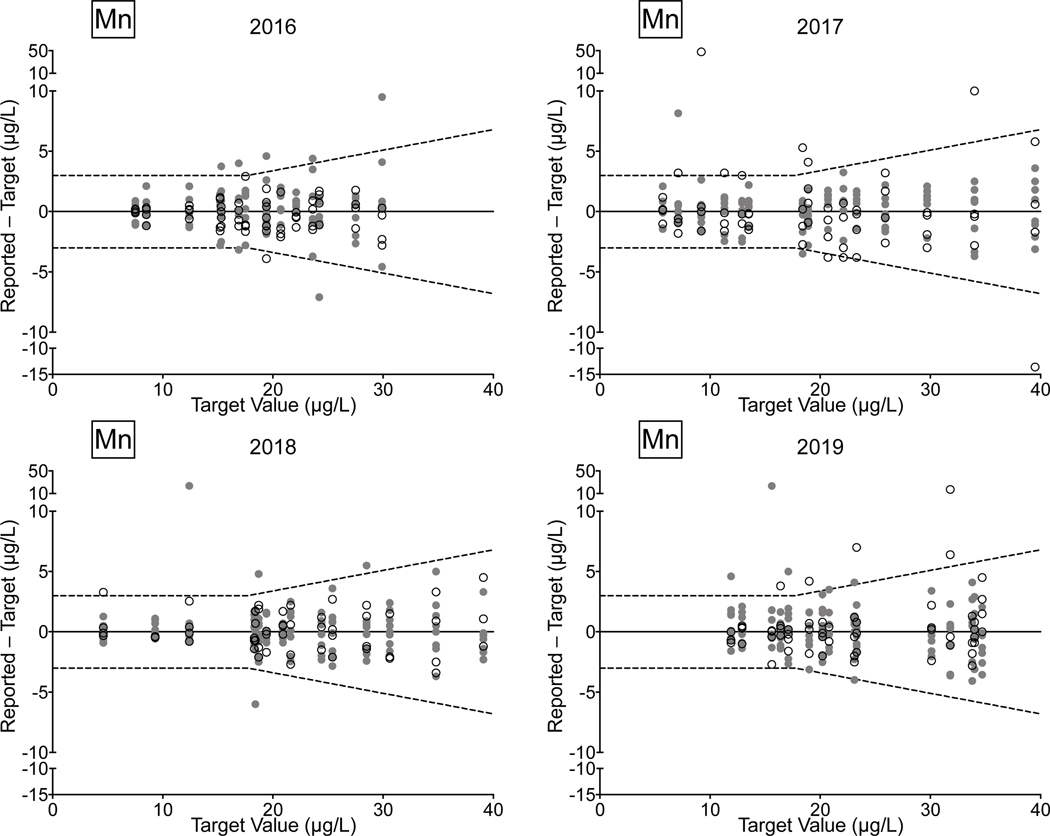
Urine. Between 2016 and 2019, there were 78/81 (96%) successful PTs, 220/236 (93%) satisfactory events, and 1,128/1,180 (96%) acceptable PT results for the CHEAR network for the elements As, Cd, Hg, and Mn in urine. Overall performance for these elements clearly improved between 2018 and 2019, with all of the CHEAR labs earning a successful PT score, and with >99% of PT events graded as satisfactory, and where 98% of PT sample responses were deemed acceptable. CHEAR laboratory performance data covering a four-year period from 2016 to 2019 are shown in Fig 4 for urinary levels of (a) As, (b) Cd, (c) Hg, and (d) Mn. The data are based on 12 consecutive PT events and are depicted as difference plots, i.e., the differences between the lab-reported values and assigned values are plotted as a function of increasing element concentration. Open circles denote values reported by the CHEAR lab group while gray circles represent other participants. Data for other elements (Ba, Be, Co, Cr, Pb, Tl, U) reported in urine are available in ESI Fig 2 (a–g); data for Co and Cr were graded as of 2017, thus only three years of those data are available (2017–2019).
Figure 4.
Performance in the NYS Biomonitoring PT Program is shown for As (4a), Cd (4b), Hg (4c), and Mn (4d) in urine over four years of participation (2016–2019) as a function of target value. The solid line represents no difference between the lab-reported value and the assigned value, while the dashed lines show ± quality specifications for each analyte. CHEAR data are shown as open black circles; other participant data are shown as gray circles.
Performance data for As, Cd, and Mn in urine clearly show improvement over the four-year period. In 2018 and 2019, the few failed PT samples reported by CHEAR labs were very close to the acceptable criteria, compared with 2016 and 2017, where failed responses were both more numerous in quantity and much further from the target value. For urine Hg the trend is complicated by inconsistent participation – one CHEAR lab began reporting data in Event #2, 2017 and accounted for all of the unacceptable PT responses in 2017 (n=4) and 2018 (n=2); another lab did not report data for Hg in Events 2 and 3 in 2017 but had an otherwise satisfactory performance. In 2019, four of the unacceptable PT responses for urine Hg were reported by a single lab; however, that same lab participated in all challenges with satisfactory performance in 2016, 2017, and 2018.
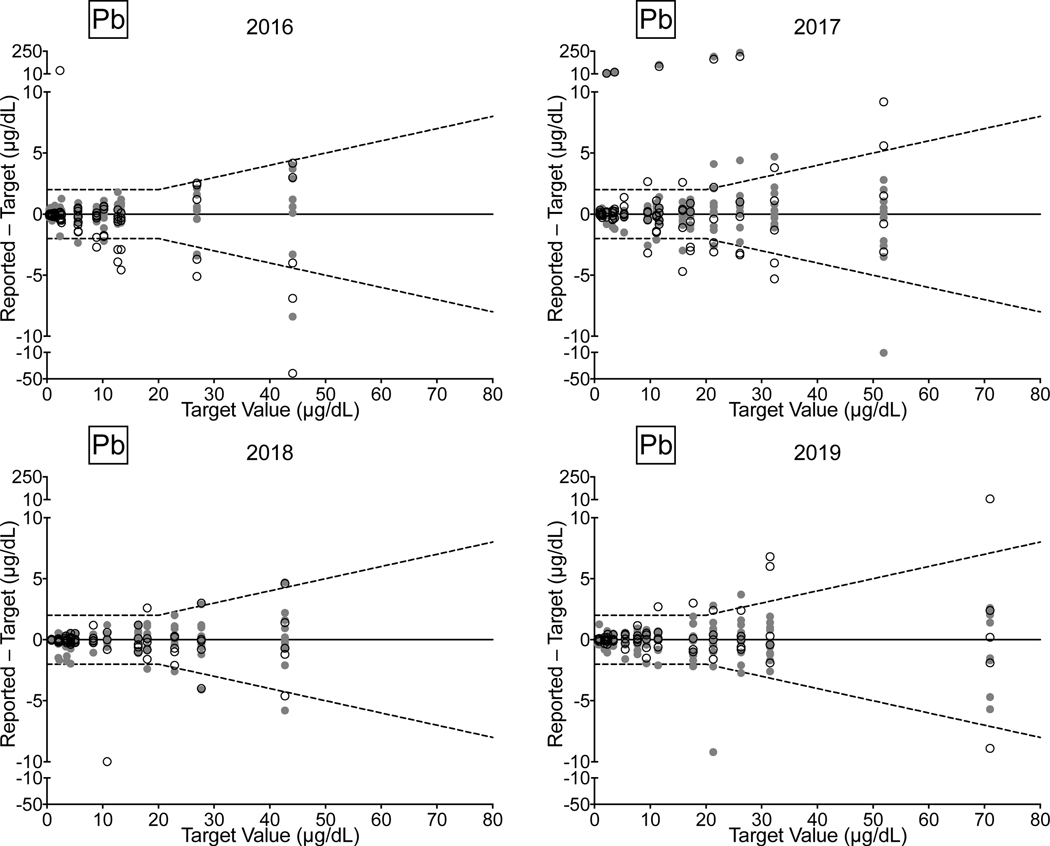
Whole Blood. CHEAR lab performance for whole blood Cd, Hg, Mn, and Pb from 2016–2019 comprised: 72/77 (94%) successful PTs, 199/224 (89%) satisfactory events, and 1,037/1,120 (93%) acceptable PT responses. Overall, the CHEAR network improved from 2018–2019, where all achieved successful PTs for Cd, Hg, Mn, and Pb; 95% of the events indicated satisfactory performance, and 95% of CHEAR responses fell within the acceptable range. CHEAR laboratory performance data covering a four-year period from 2016 to 2019 are shown in Fig 5 for (a) Cd, (b) Hg, (c) Mn, and (d) Pb in blood. The data are based on 12 consecutive PT events and shown as difference plots, i.e., the differences between the lab-reported values and assigned values are plotted as a function of increasing element concentration. Open circles denote values reported by the CHEAR lab group while gray circles represent other participants. Data for other elements (As, Co, and Cr) reported in whole blood are available in ESI Fig 2 (h–j).
Figure 5.
Performance in the NYS Biomonitoring PT Program is shown for Cd (5a), Hg (5b), Pb (5c), and Mn (5d) in whole blood over four years of participation (2016–2019) as a function of target value. The solid line represents no difference between the lab-reported value and the assigned value, while the dashed lines show ± quality specifications for each analyte. CHEAR data are shown as open black circles; other participant data are shown as gray circles.
Performance improvement is evident across the four-year period for Cd and Mn; though for the latter, one lab did have an anomalous unsatisfactory event in 2019 resulting from reporting 4/5 samples outside the acceptable range. In 2016, whole blood Hg performance was reasonable and remained satisfactory in 2017, 2018, and 2019. The exception is blood Pb, where a number of unacceptable results were reported, especially in 2017 where four CHEAR labs reported unacceptable results on 21 (28%) PT samples. Thereafter, blood Pb performance improved in both 2018 and 2019 by comparison.
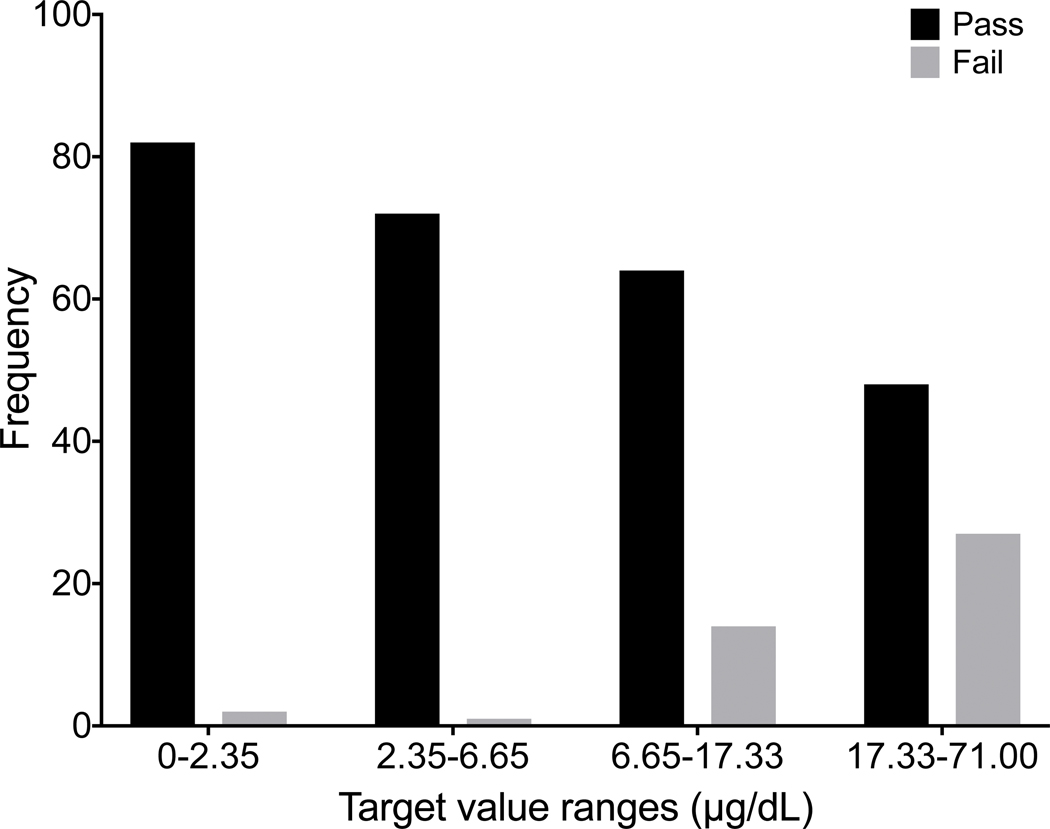
As noted in the initial validation study based on SRM 955c (Toxic metals in caprine blood), CHEAR laboratory performance at higher blood lead concentrations was poorer compared to lower levels. The PT data for blood lead also reflect poorer performance at higher concentrations. The inverse relationship between blood Pb concentration and CHEAR lab performance was confirmed using a Pearson’s two-tailed correlation test, resulting in a highly significant (p<0.0001) r = −0.679. Assigned values for blood Pb from all four years (n=60) were divided into quartiles and performance, expressed as number of acceptable (black) and unacceptable (gray) responses from the CHEAR group, are plotted as a histogram (Fig. 6). It is evident from Fig. 6 that blood lead performance is poorer at concentrations between 6.65 μg/dL and 17.33 μg/dL relative to concentrations below 6.65 μg/dL, and is further diminished at concentrations above 17.33 μg/dL. The diminished performance at elevated blood lead levels is surprising and the reason(s) are unclear but may include the tighter (relative) quality specification (±10%) applied above 20 μg/dL. It is important to note that the current US federal regulatory requirements for blood lead PT program is considerably less stringent (±4 μg/dL, or ±10%, whichever is greater) than that recommended for biomonitoring purposes and applied in the NYS PT program. Yet the current US federal regulatory requirements for blood lead PT were set almost 30 years ago, and are currently under review with a proposal to tighten them to ±2 μg/dL, or ±10%, whichever is greater.(Public Health, 2019) These proposed regulatory criteria are identical to the current quality specifications used by the NYS Biomonitoring PT program and are consistent with recommendations from consensus organizations such as the Clinical Laboratory Standards Institute (CLSI).(CLSI, 2013) Whatever the reason(s), the analysis for blood lead has been historically challenging and one that has received considerable attention from the clinical laboratory community. (Murphy et al., 2009; Parsons, 1992; Parsons et al., 2001)
Figure 6.
Number of passed (black bar) and failed samples (gray bar) as a function of Pb target concentration across the four-year period for the CHEAR laboratories.
3.3. CHEAR Reference Materials
The assigned value ±URM, SD, quality specification, and number of labs that reported data (n) for the low- and high-level urine CHEAR RMs is provided in Table 2. The concentrations for As, Ba, and Cs are in line with the geometric mean and 95th percentile data reported as part of the National Health and Nutrition Examination Survey (NHANES) for the 2011–2016 cycle. For other NHANES elements, there was a compromise between biomonitoring concentrations and method LOD and thence LOQ. The low level CHEAR RM was consistent with, or lower than, NIST SRM 2668/3668 Level 1 for As, Ba, Be, Cd, Co, Cr, Cs, Cu, Mn, Mo, Pb, Pt, Sb, Sn, Tl, U, V, and W. The high level CHEAR RM was lower than Level 2 of SRMs 2668/3668 for all elements except Hg, again to reflect biomonitoring rather than occupational exposures. The concentration of Hg in UE17–15 H was intended to reflect individuals with fish consumption or exposure from amalgams. The CHEAR RM also provides information on Se and Zn, which were not characterized in the NIST SRMs but are of interest in biomonitoring studies as essential nutrient elements. The CoA for this material includes informational values for Ag, Al, B, Bi, Fe, I, Li, Mg, Sr, Te, Th, and Ti, and is provided in ESI 3 for the CHEAR urine RMs.
Table 2.
Assigned value, expanded uncertainty (U), standard deviation, and n for 22 trace elements in CHEAR Urine Reference Materials UE17–14 L and UE17–15 H. For those elements that are also graded in the New York State Biomonitoring PT Program for Trace Elements, the quality specifications are given; for other (ungraded) elements ±2SD is shown. All values are reported in μg/L.
| UE17-14 L | ||||
|---|---|---|---|---|
|
| ||||
| Element | Assigned Value ± U | SD | Quality Specification | n |
| As | 12.0 ± 0.4 | 1.1 | ± 6.0 | 21 |
| Ba | 1.6 ± 0.1 | 0.1 | ± 1.0 | 13 |
| Be | 0.50 ± 0.01 | 0.02 | ± 1.00 | 11 |
| Cd | 0.71 ± 0.03 | 0.07 | ± 1.00 | 19 |
| Co | 0.91 ± 0.05 | 0.11 | ± 1.50 | 14 |
| Cr | 2.3 ± 0.1 | 0.2 | ± 3.0 | 12 |
| Hg | 3.3 ± 0.2 | 0.4 | ± 3.0 | 15 |
| Mn | 1.1 ± 0.1 | 0.2 | ± 0.55 | 16 |
| Pb | 1.40 ± 0.04 | 0.10 | ± 1.00 | 18 |
| Tl | 0.310 ± 0.002 | 0.005 | ± 0.200 | 14 |
| U | 0.027 ± 0.001 | 0.003 | ± 0.030 | 16 |
|
| ||||
| Element | Assigned Value ± U | SD | 2 SD | n |
|
| ||||
| Cs | 7.5 ± 0.2 | 0.3 | ± 0.6 | 10 |
| Cu | 18 ± 1 | 2 | ± 4 | 10 |
| Mo | 97 ± 1 | 3 | ± 6 | 14 |
| Ni | 8.3 ± 0.6 | 0.9 | ± 1.8 | 9 |
| Pt | 0.23 ± 0.03 | 0.04 | ± 0.08 | 6 |
| Sb | 0.64 ± 0.03 | 0.05 | ± 0.10 | 11 |
| Se | 50 ± 3 | 4 | ± 8 | 7 |
| Sn | 2.5 ± 0.2 | 0.3 | ± 0.6 | 7 |
| V | 1.3 ± 0.1 | 0.2 | ± 0.4 | 6 |
| W | 0.57 ± 0.03 | 0.04 | ± 0.08 | 8 |
| Zn | 868 ± 35 | 56 | ± 112 | 9 |
| UE17–15 H | ||||
|---|---|---|---|---|
|
| ||||
| Element | Assigned Value ± U | SD | Quality Specification | n |
| As | 68 ± 2 | 4 | ± 14 | 21 |
| Ba | 5.9 ± 0.2 | 0.4 | ± 1.2 | 13 |
| Be | 1.30 ± 0.04 | 0.09 | ± 1.00 | 12 |
| Cd | 1.2 ± 0.1 | 0.2 | ± 1.0 | 20 |
| Co | 2.4 ± 0.1 | 0.1 | ± 1.5 | 15 |
| Cr | 9.1 ± 0.3 | 0.6 | ± 3.0 | 12 |
| Hg | 24.1 ± 0.7 | 1.6 | ± 7.20 | 15 |
| Mn | 2.1 ± 0.1 | 0.3 | ± 0.55 | 16 |
| Pb | 5.1 ± 0.1 | 0.3 | ± 1.0 | 18 |
| Tl | 0.75 ± 0.01 | 0.02 | ± 0.20 | 14 |
| U | 0.063 ± 0.001 | 0.003 | ± 0.030 | 16 |
|
| ||||
| Element | Assigned Value ± U | SD | 2 SD | n |
|
| ||||
| Cs | 15.0 ± 0.3 | 0.5 | ± 1.0 | 10 |
| Cu | 103 ± 4 | 8 | ± 16 | 10 |
| Mo | 284 ± 4 | 9 | ± 18 | 14 |
| Ni | 13.7 ± 0.6 | 0.9 | ± 1.8 | 9 |
| Pt | 1.18 ± 0.04 | 0.05 | ± 0.10 | 6 |
| Sb | 1.27 ± 0.04 | 0.07 | ± 0.14 | 11 |
| Se | 150 ± 10 | 13 | ± 26 | 7 |
| Sn | 12.2 ± 0.8 | 1.1 | ± 2.2 | 7 |
| V | 6.0 ± 0.6 | 0.7 | ± 1.4 | 6 |
| W | 1.26 ± 0.03 | 0.05 | ± 0.10 | 9 |
| Zn | 1359 ± 37 | 55 | ± 110 | 8 |
The assigned value ±URM, SD, quality specification, and number of labs that reported data (n) for the low- and high-level whole blood CHEAR RMs are provided in Table 3. These blood materials have assigned target values for 14 elements, compared with the more limited panel of NHANES and values available for NIST SRM 955c or the newer NIST SRM 1401 Trace Metals in Frozen Human Blood. CHEAR RM target values were consistent with the NHANES population data for Cd, Hg, Mn, Pb, and Se; however, Level 1 was somewhat higher than the geometric mean for Cd and Hg to compromise for method LODs. The whole blood CHEAR RMs are more reflective of biomonitoring than 1) SRM 955c for As, Cd, Hg, Mn, Pb and Se, and 2) SRM 1401 for Mn. Target values for Co and Cr are similar between the CHEAR RMs and SRM 1401 at both concentrations. The CoA includes informational values for Ag, Be, Bi, Cs, I, Li, Mg, Mo, Ni, Pt, Sn, Sr, Te, Th, Ti, U, and W in the CHEAR whole blood RMs, and is provided in ESI 4.
Table 3.
Assigned value, expanded uncertainty (U), standard deviation, and n for 13 and 14 trace elements in CHEAR Whole Blood Reference Materials BE17–11 L and BE17–13 H, respectively. For those elements that are also graded in the New York State Biomonitoring PT Program for Trace Elements, the quality specifications are given; for other (ungraded) elements ±2SD is shown. All values are reported in μg/L, except for blood Pb*, which is given in μg/dL.
| BE17-11 L | ||||
|---|---|---|---|---|
|
| ||||
| Element | Assigned Value ± U | SD | Quality Specification | n |
| As | 7.0 ± 1.0 | 1.0 | ± 6.0 | 7 |
| Cd | 1.1 ± 0.1 | 0.1 | ± 1.0 | 16 |
| Co | 5.8 ± 0.3 | 0.5 | ± 1.5 | 8 |
| Cr | 2.7 ± 0.7 | 1.0 | ± 2.0 | 8 |
| Hg | 5.9 ± 0.3 | 0.6 | ± 3.0 | 15 |
| Mn | 7.1 ± 0.5 | 1.0 | ± 3.0 | 12 |
| Pb* | 0.97 ± 0.04 | 0.10 | ± 2.0 | 17 |
|
| ||||
| Element | Assigned Value ± U | SD | 2 SD | n |
|
| ||||
| Ba | 3.9 ± 0.3 | 0.3 | ± 0.6 | 5 |
| Cu | 976 ± 113 | 118 | ± 236 | 5 |
| Se | 199 ± 17 | 23 | ± 46 | 7 |
| Tl | 0.69 ± 0.03 | 0.04 | ± 0.08 | 6 |
| V | 2.3 ± 0.1 | 0.2 | ± 0.4 | 5 |
| Zn | 5,480 ± 646 | 678 | ± 1,356 | 5 |
| BE17-13 H | ||||
|---|---|---|---|---|
|
| ||||
| Element | Assigned Value ± U | SD | Quality Specification | n |
| As | 25.0 ± 3.0 | 5.0 | ± 6.0 | 8 |
| Cd | 6.2 ± 0.2 | 0.4 | ± 1.0 | 16 |
| Co | 11 ± 1 | 2 | ± 2.0 | 9 |
| Cr | 11.4 ± 0.4 | 0.6 | ± 2.3 | 7 |
| Hg | 22.2 ± 0.5 | 1.1 | ± 6.7 | 15 |
| Mn | 18.9 ± 0.7 | 1.4 | ± 3.2 | 12 |
| Pb* | 5.3 ± 0.1 | 0.3 | ± 2.0 | 17 |
|
| ||||
| Element | Assigned Value ± U | SD | 2 SD | n |
|
| ||||
| Ba | 12.0 ± 1.0 | 1.0 | ± 2.0 | 5 |
| Cu | 1834 ± 197 | 207 | ± 414 | 5 |
| Se | 325 ± 34 | 46 | ± 92 | 7 |
| Sb | 2.8 ± 0.3 | 0.3 | ± 0.6 | 6 |
| Tl | 2.2 ± 0.1 | 0.2 | ± 0.4 | 6 |
| V | 5.7 ± 0.4 | 0.4 | ± 0.8 | 5 |
| Zn | 8,534 ± 1,052 | 1,104 | ± 2,208 | 5 |
The CHEAR RMs in urine and whole blood were produced specifically to meet the needs of the CHEAR program for biomonitoring studies, where a large panel of trace elements is measured. Metrologically, these materials fill a gap at the network level, above an internal QCM but below a CRM or SRM and are consistent with the definition for RMs as defined in the International Vocabulary of Metrology (VIM). CHEAR labs included these RMs along with project samples in CHEAR projects that had been approved for trace element analyses. One to two RM samples from both levels were included by the CHEAR laboratory in each batch of 50 samples analyzed. These RMs were in addition to any blind QC samples inserted by the PI and internal QC materials, included per the lab’s standard operating procedures. Table 4 lists those projects supported by CHEAR where the urine RMs were analyzed along with project samples. CHEAR had only one project that requested trace element analyses in whole blood and that project was completed prior to the production of the CHEAR RM materials. The trace element data for project samples and the CHEAR RMs analyzed as part of the CHEAR projects listed in Table 4 will be available after an embargo period in the data repository: https://cheardatacenter.mssm.edu/search.asp. The RMs can be used to: 1) promote harmonization across the CHEAR studies; and 2) provide feedback about method performance within the CHEAR projects.
Table 4.
CHEAR Urine Reference material usage by CHEAR labs.
| Project ID | Principal Investigator | CHEAR Lab^ | Number of Project Samples | Analytes Reported |
|---|---|---|---|---|
| CHEAR Projects | ||||
| 2016–1461 | Irva Hertz-Picciotto | WCCHEAR | 701 | As, Be, Cd, Mo, Tl, U |
| 2017–1598 | Jefferey Krischer | MSSM | 1,125 | As, Ba, Cd, Co, Cs, Cu, Hg* Mg, Mn, Mo, Pb, Sb, Se, Tl, V, Zn |
| 2017–1977 | Karin Michels | MSSM | 1,130 | As, Ba, Cd, Co, Cr, Cs, Cu, Mg, Mn, Mo, Ni, Pb, Sb, Se, Tl, V, Zn |
| 2018–2517 | Kestutis Bendinskas | WCCHEAR | 320 | As, Ba, Be, Co, Cs, Mn, Mo, Sb, Sn, Tl, U, W |
| Pilot & Feasibility (P&F) Program Project | ||||
| 2018-PF05 | Jean Kerver | MSSM | 26 | As, Ba, Cd, Co, Cs, Cu, Hg*, Mg, Mn, Mo, Pb, Sb, Se, Tl, V, Zn |
| Environmental Influences on Child Health Outcomes (ECHO) Program Project | ||||
| UG3–102 | Nigel Paneth | WCCHEAR | 240 | As, Ba, Cd, Co, Cr, Cs, Hg, Mn, Mo, Pb, Sb, Sn, Tl, U, W |
WC-CHEAR: Wadsworth Center’s Children’s Health Exposure Assessment Resource (WCCHEAR); MSSM: Mount Sinai CHEAR Network Laboratory Hub
Trace element determination was by ICP-MS, except for Hg, which was measured by DMA.
3.4. Role of CRMs, RMs, PT, and QCMs in harmonization and traceability
Method validation against matrix-based CRMs is the ‘gold-standard’ to verify measurement traceability and establish accuracy within a single laboratory.(Thompson et al., 2002) According to the International Vocabulary of Metrology (VIM, 2012), a CRM is defined as a “reference material, accompanied by documentation issued by an authoritative body and providing one or more specified property values with associated uncertainties and traceabilities, using valid procedures.” (VIM, 2012). Analysis of CRMs can be used to assess accuracy and precision among different methods, between laboratories, and monitor performance over time. In contrast, the VIM defines an RM as a “material, sufficiently homogeneous and stable with reference to specified properties, which has been established to be fit for its intended use in measurement or in examination of nominal properties.” (VIM, 2012). NIST SRM 955c and SRM 2668 are examples of matrix-based CRMs, while the CHEAR RMs described in this study are consistent with the VIM definition of an RM.
Proficiency testing (PT) is one aspect of external quality assessment (EQA) and is based on the analysis of unknown samples, analyzed by multiple laboratories. The data are reported back to the PT/EQA program organizer for target value assignment and graded based on established, analyte-specific, quality specifications. It is important to note that PT is a cross-sectional snapshot of interlaboratory comparability and is not necessarily a metric for accuracy, or ‘trueness’, nor does it establish traceability without additional characterization. However, a time series of PT challenges can reveal a laboratory’s consistent performance. Common QCMs (e.g., the CHEAR RMs) produced within a network can be characterized to provide a robust target value and subsequently analyzed with each batch of ongoing projects. This approach promotes harmonization and feedback if reported values are inconsistent with the assigned target values and acceptable statistical range; such use of QCMs preserves the limited supply of CRMs, that are produced and certified by NMIs. Thus, CRMs, RMs, PT, and laboratory-produced QCMs are complementary tools that promote laboratory harmonization; each of these tools were utilized by the CHEAR program. These strategies were used in tandem with a project-specific QC plan that included the laboratory’s internal QCMs, sample spikes, blind duplicates of samples, and/or samples that were analyzed by a non-CHEAR laboratory to assess comparability.
The initial validation study conducted for CHEAR, and based on NIST SRMs, revealed some disparities in accuracy and precision among the laboratories for some analytes of interest. A review of these data led to corrective actions, where indicated, and a focus group was established thereafter to discuss common analytical challenges and potential solutions. Ongoing assessment in the NYS PT Program for Biomonitoring Trace Elements has been an invaluable resource to assess, address, and improve harmonization 1) among the CHEAR labs and 2) harmonization of CHEAR with the broader biomonitoring community. The initial validation and follow-up discussions were concurrent with the first PT challenges in 2016, where many unsatisfactory events were observed, as described in the results section. Performance was closely monitored throughout 2016; in 2017 the laboratory quality assurance working group moved to share protocols, set up trainings and an internship, and met regularly as a group. As a result of these collective efforts, PT performance improved in 2018 and 2019 compared with 2016 and 2017.
4. Conclusions and Future Directions
The work reported here accomplished three critical pieces of strong harmonization within a network of laboratories dedicated to children’s health research: 1) traceability was verified, precision was assessed, and accuracy was evaluated for 4 elements in whole blood and 20 elements in urine using matrix-based CRMs; 2) harmonization was assessed for up to 25 elements in urine and whole blood 3x per year using the NYS Biomonitoring PT Program for Trace Elements; 3) matrix-appropriate RMs were prepared and characterized for 13–14 elements in whole blood and 22 elements in urine. Significant progress was accomplished to improve harmonization of trace element measurements in clinical matrices among the CHEAR network labs. Improvement in harmonization is clear from the initial validation based on NIST SRMs through the ongoing PT challenges. The production of CHEAR RMs, which were designed specifically for biomonitoring purposes will allow an assessment of harmonization and provide important feedback for a large panel of trace elements reported for the CHEAR projects. The work described here, which was completed as part of the CHEAR program, demonstrated ongoing improvement with harmonization and measurement traceability among the CHEAR laboratories. While the CHEAR program formally ended in 2019, it was replaced with the Human Health Exposure Analysis Resource (HHEAR), which is also funded by NIH. The HHEAR program expands beyond children’s environmental exposure studies to include all life stages. Several of former CHEAR laboratories transitioned into HHEAR laboratories, with a focus on targeted analyses, and continue to benefit from the harmonization efforts described in work reported here. This includes continued participation in the NYS DOH Biomonitoring PT program for Trace Elements as well as analysis of the CHEAR RMs. The harmonization efforts reported for CHEAR (and continuing under HHEAR) are considered fit-for-purpose, especially for epidemiological research studies. However, some deficiencies were identified that will need to be addressed for HHEAR. These include root cause analysis for 1) poorer performance for blood Pb levels above 10 μg/dL; and 2) improving the scope and performance for essential trace elements in serum/plasma. The development of a common (“core”) panel of trace elements measured by matrix would open up comparability across health studies with multiple health outcomes. Finally, an in-depth review of the CHEAR RMs and other QC data that were analyzed and reported with project data will be possible as additional projects are completed and made available in the data repository.
Supplementary Material
Harmonization challenges for trace element laboratories conducting biomonitoring
Trace element proficiency testing program designed for biomonitoring laboratories
Biomonitoring reference materials developed for trace elements in blood and urine
Long term performance of trace element laboratories in biomonitoring studies
6. Acknowledgements
Research reported in this publication was supported by the National Institutes of Health under award numbers U2C ES026542–02 (PJP); U24 ES026539 (LM) and 5 U2C ES026561 (CA). The content is solely the responsibility of the authors and does not necessarily represent the official views of the National Institutes of Health.
We acknowledge the following NIH-funded CHEAR laboratories for their contributions to trace element harmonization: Emory’s CHEAR lab hub, Emory University, Atlanta, GA, USA; Michigan’s CHEAR lab hub, University of Michigan at Ann Arbor, MI, USA; Mount Sinai CHEAR lab hub, Icahn School of Medicine at Mount Sinai, New York, NY, USA; RTI CHEAR lab hub, RTI International, Research Triangle Park, NC, USA; Minnesota CHEAR lab hub, University of Minnesota, Minneapolis, MN, USA; and the Wadsworth Center’s CHEAR lab hub, New York State Department of Health, Albany, NY, USA. We also thank the staff of the New York State Biomonitoring PT Program, and each of the participant labs that contributed PT data.
We are indebted to Dr. Yuxia Cui and Dr. David Balshaw (Exposure, Response, and Technology Branch Division of Extramural Research and Training, National Institute of Environmental Health Sciences) for many helpful discussions.
Footnotes
Declaration of Interest: None.
Declaration of interests
The authors declare that they have no known competing financial interests or personal relationships that could have appeared to influence the work reported in this paper.
Publisher's Disclaimer: This is a PDF file of an unedited manuscript that has been accepted for publication. As a service to our customers we are providing this early version of the manuscript. The manuscript will undergo copyediting, typesetting, and review of the resulting proof before it is published in its final form. Please note that during the production process errors may be discovered which could affect the content, and all legal disclaimers that apply to the journal pertain.
7. References
- Balshaw DM, Collman GW, Gray KA, & Thompson CL (2017). The children’s health exposure analysis resource: Enabling research into the environmental influences on children’s health outcomes. Current Opininion Pediatrics, 29(3), 385–389. doi: 10.1097/mop.0000000000000491 [DOI] [PMC free article] [PubMed] [Google Scholar]
- CLIA. The public health and welfare, 42 C.F.R. § 263 (1988). [Google Scholar]
- CLIA. The public health and welfare, 42 C.F.R. Part 494 Subpart 1 (§ 493.901 Approval of proficiency testing programs.) (2019). [Google Scholar]
- CLSI. (2013). C40-a2 measurement procedures for the determination of lead concentrations in blood and urine. [Google Scholar]
- Greenberg N. (2014). Update on current concepts and meanings in laboratory medicine — standardization, traceability and harmonization. Clinica Chimica Acta, 432, 49–54. doi: 10.1016/j.cca.2013.12.045 [DOI] [PubMed] [Google Scholar]
- ISO-13528:2015(E). (2015). Statistical methods for use in proficiency testing by interlaboratory comparison. Geneva, Switzerland. [Google Scholar]
- Murphy KE, Guthrie WF, Vetter TW, Turk GC, Palmer CD, Lewis ME, Geraghty CM, & Parsons PJ (2009). Comparison of clinical methods with isotope dilution inductively coupled plasma mass spectrometry for the new standard reference material 955c lead in caprine blood. Journal of Analytical Atomic Spectrometry, 24(9), 1170–1178. doi: 10.1039/b903060c [DOI] [Google Scholar]
- Parsons PJ (1992). Monitoring human exposure to lead - an assessment of current laboratory performance for the determination of blood lead. Environmental Research, 57(2), 149–162. [DOI] [PubMed] [Google Scholar]
- Parsons PJ, Reilly AA, Esernio-Jenssen D, Werk LN, Mofenson HC, Stanton NV, & Matte TD (2001). Evaluation of blood lead proficiency testing: Comparison of open and blind paradigms. Clinical Chemistry, 47(2), 322–330. [PubMed] [Google Scholar]
- Plebani M. (2013). Harmonization in laboratory medicine: The complete picture. Clinical Chemistry and Laboratory Medicine, 51(4), 741–751. doi: 10.1515/cclm-2013-0075 [DOI] [PubMed] [Google Scholar]
- Plebani M. (2016). Harmonization of clinical laboratory information - current and future strategies. Electornic Journal of the International Federation of Clinical Chemistry and Laboratory Medicine, 27(1), 15–22. [PMC free article] [PubMed] [Google Scholar]
- Sharpless K, & Duewer D. (2008). Standard reference materials for analysis of dietary supplements. Journal of AOAC International, 91, 1298–1302. [PubMed] [Google Scholar]
- Taverniers I, De Loose M, & Van Bockstaele E. (2004). Trends in quality in the analytical laboratory. I. Traceability and measurement uncertainty of analytical results. Trends in Analytical Chemistry, 23(7), 480–490. doi: 10.1016/S0165-9936(04)00733-2 [DOI] [Google Scholar]
- Taylor A, Angerer J, Arnaud J, Claeys F, Jones RL, Mazarrasa O, Mairiaux E, Menditto A, Parsons PJ, Patriarca M, Pineau A, Valkonen S, Weber J-P, & Weykamp C. (2006). Occupational and environmental laboratory medicine: A network of EQAS organisers. Accreditation and Quality Assurance, 11(8–9), 435–439. doi 10.1007/s00769-006-0108-x [DOI] [Google Scholar]
- Thompson M, Ellison Stephen LR, & Wood R. (2002). Harmonized guidelines for single-laboratory validation of methods of analysis (International Union of Pure and Applied Chemistry technical report). Pure and Applied Chemistry, 74(5), 835. doi: 10.1351/pac200274050835 [DOI] [Google Scholar]
- VIM. International vocabulary of metrology — Basic and general concepts and associated terms (VIM 3rd edition). JCGM 200:2012. (JCGM 200:2008 with minor corrections) https://www.bipm.org/utils/common/documents/jcgm/JCGM_200_2012.pdf [Google Scholar]
- Wright RO, Teitelbaum S, Thompson C, & Balshaw D. (2018). The child health exposure analysis resource as a vehicle to measure environment in the environmental influences on child health outcomes program. Current Opinion in Pediatrics, 30(2), 285–291. doi: 10.1097/mop.0000000000000601 [DOI] [PMC free article] [PubMed] [Google Scholar]
Associated Data
This section collects any data citations, data availability statements, or supplementary materials included in this article.


