

Abstract
Background
Liver transplantation is an established treatment option for end‐stage liver failure. To date, no consensus has been reached on the use of immunosuppressive T‐cell antibody induction for preventing rejection after liver transplantation.
Objectives
To assess the benefits and harms of immunosuppressive T‐cell specific antibody induction compared with placebo, no induction, or another type of T‐cell specific antibody induction for prevention of acute rejection in liver transplant recipients.
Search methods
We searched The Cochrane Hepato‐Biliary Group Controlled Trials Register, the Cochrane Central Register of Controlled Trials (CENTRAL), MEDLINE, EMBASE, Science Citation Index Expanded, and the World Health Organization (WHO) International Clinical Trials Registry Platform (ICTRP) until September 2013.
Selection criteria
Randomised clinical trials assessing immunosuppression with T‐cell specific antibody induction compared with placebo, no induction, or another type of antibody induction in liver transplant recipients. Our inclusion criteria stated that participants within each included trial should have received the same maintenance immunosuppressive therapy. We planned to include trials with all of the different types of T‐cell specific antibodies that are or have been used for induction (ie., polyclonal antibodies (rabbit of horse antithymocyte globulin (ATG), or antilymphocyte globulin (ALG)), monoclonal antibodies (muromonab‐CD3, anti‐CD2, or alemtuzumab), and interleukin‐2 receptor antagonists (daclizumab, basiliximab, BT563, or Lo‐Tact‐1)).
Data collection and analysis
We used RevMan analysis for statistical analysis of dichotomous data with risk ratio (RR) and of continuous data with mean difference (MD), both with 95% confidence intervals (CIs). We assessed the risk of systematic errors (bias) using bias risk domains with definitions. We used trial sequential analysis to control for random errors (play of chance). We presented outcome results in a summary of findings table.
Main results
We included 19 randomised clinical trials with a total of 2067 liver transplant recipients. All 19 trials were with high risk of bias. Of the 19 trials, 16 trials were two‐arm trials, and three trials were three‐arm trials. Hence, we found 25 trial comparisons with antibody induction agents: interleukin‐2 receptor antagonist (IL‐2 RA) versus no induction (10 trials with 1454 participants); monoclonal antibody versus no induction (five trials with 398 participants); polyclonal antibody versus no induction (three trials with 145 participants); IL‐2 RA versus monoclonal antibody (one trial with 87 participants); and IL‐2 RA versus polyclonal antibody (two trials with 112 participants). Thus, we were able to compare T‐cell specific antibody induction versus no induction (17 trials with a total of 1955 participants). Overall, no difference in mortality (RR 0.91; 95% CI 0.64 to 1.28; low‐quality of evidence), graft loss including death (RR 0.92; 95% CI 0.71 to 1.19; low‐quality of evidence), and adverse events ((RR 0.97; 95% CI 0.93 to 1.02; low‐quality evidence) outcomes was observed between any kind of T‐cell specific antibody induction compared with no induction when the T‐cell specific antibody induction agents were analysed together or separately. Acute rejection seemed to be reduced when any kind of T‐cell specific antibody induction was compared with no induction (RR 0.85, 95% CI 0.75 to 0.96; moderate‐quality evidence), and when trial sequential analysis was applied, the trial sequential monitoring boundary for benefit was crossed before the required information size was obtained. Furthermore, serum creatinine was statistically significantly higher when T‐cell specific antibody induction was compared with no induction (MD 3.77 μmol/L, 95% CI 0.33 to 7.21; low‐quality evidence), as well as when polyclonal T‐cell specific antibody induction was compared with no induction, but this small difference was not clinically significant. We found no statistically significant differences for any of the remaining predefined outcomes — infection, cytomegalovirus infection, hepatitis C recurrence, malignancy, post‐transplant lymphoproliferative disease, renal failure requiring dialysis, hyperlipidaemia, diabetes mellitus, and hypertension — when the T‐cell specific antibody induction agents were analysed together or separately. Limited data were available for meta‐analysis on drug‐specific adverse events such as haematological adverse events for antithymocyte globulin. No data were found on quality of life.
When T‐cell specific antibody induction agents were compared with another type of antibody induction, no statistically significant differences were found for mortality, graft loss, and acute rejection for the separate analyses. When interleukin‐2 receptor antagonists were compared with polyclonal T‐cell specific antibody induction, drug‐related adverse events were less common among participants treated with interleukin‐2 receptor antagonists (RR 0.23, 95% CI 0.09 to 0.63; low‐quality evidence), but this was caused by the results from one trial, and trial sequential analysis could not exclude random errors. We found no statistically significant differences for any of the remaining predefined outcomes: infection, cytomegalovirus infection, hepatitis C recurrence, malignancy, post‐transplant lymphoproliferative disease, renal failure requiring dialysis, hyperlipidaemia, diabetes mellitus, and hypertension. No data were found on quality of life.
Authors' conclusions
The effects of T‐cell antibody induction remain uncertain because of the high risk of bias of the randomised clinical trials, the small number of randomised clinical trials reported, and the limited numbers of participants and outcomes in the trials. T‐cell specific antibody induction seems to reduce acute rejection when compared with no induction. No other clear benefits or harms were associated with the use of any kind of T‐cell specific antibody induction compared with no induction, or when compared with another type of T‐cell specific antibody. Hence, more randomised clinical trials are needed to assess the benefits and harms of T‐cell specific antibody induction compared with placebo, and compared with another type of antibody, for prevention of rejection in liver transplant recipients. Such trials ought to be conducted with low risks of systematic error (bias) and low risk of random error (play of chance).
Plain language summary
Antibody induction versus placebo, no induction, or another type of antibody induction for liver transplant recipients
Background Antibodies against T‐cells are used to induce immunosuppression after liver transplantation. These antibodies are intended to reduce rejection of the transplanted liver and are given within the first two weeks after transplantation. Furthermore, these antibodies may allow for delayed introduction of calcineurin inhibitors to protect kidney function.
Different types of antibodies have been used: interleukin‐2 receptor antagonists (BT563, daclizumab, or basiliximab), monoclonal antibodies specific for the CD3 receptor (muromonab‐CD3) or the CD52 surface protein (alemtuzumab), or polyclonal antibodies of horse or rabbit (antithymocyte globulin (ATG) or antilymphocyte globulin (ALG)). The benefits and harms of these antibodies are unclear.
This systematic review aimed to evaluate the use of antibodies against T‐cells after liver transplantation. The question is whether T‐cell antibody induction has a role after liver transplantation, and which antibody works best with the least number of adverse events.
Aim We wanted to discover whether antibody induction therapy was better or worse than therapy without T‐cell specific antibodies for induction of immunosuppression after liver transplantation, and whether one type of antibody is better than another type of antibody. We systematically searched medical databases and found 19 randomised clinical trials including 25 comparisons that investigated the use of different types of T‐cell specific antibodies in 2067 patients after they had received their liver transplant. All of these trials had high risk of bias (that is, risk of overestimation of benefits and underestimation of harms). We compared randomised clinical trials assessing T‐cell specific antibody induction versus no T‐cell specific antibody induction or versus another type of T‐cell specific antibody induction. These trials assessed interleukin‐2 receptor antagonists versus no antibody induction (1454 patients, 10 trials); monoclonal T‐cell specific antibody versus no antibody induction (398 patients, five trials); polyclonal T‐cell specific antibody versus no T‐cell specific antibody induction (145 patients, three trials); interleukin‐2 receptor antagonist versus monoclonal T‐cell specific antibody induction (87 patients, one trial); and interleukin‐2 receptor antagonist versus polyclonal T‐cell specific antibody induction (112 patients, two trials).
Results From our results we were unable to determine the effects of antibody induction on mortality, graft loss including death, adverse events, infection, CMV infection, hepatitis C recurrence, malignancy, post‐transplant lymphoproliferative disease, renal failure requiring dialysis, hyperlipidaemia, diabetes mellitus, or hypertension for any of the comparisons. Acute rejection may be reduced when any kind of T‐cell specific antibody induction was compared with no induction and when trial sequential analysis, which we used to control for random errors, was applied. Furthermore, serum creatinine was statistically significantly higher in the T‐cell specific antibody induction group compared with the no induction group, as well as in the polyclonal T‐cell specific antibody induction group compared with the no induction group.
Conclusion The effects of T‐cell antibody induction remain uncertain because of high risk of bias of the randomised clinical trials, the small number of randomised clinical trials reported, and the limited numbers of participants and outcomes in the trials. T‐cell specific antibody induction seems to reduce acute rejection when compared with no induction. No other clear benefits or harms were associated with the use of any kind of T‐cell specific antibody induction compared with no induction, or when compared with another type of T‐cell specific antibody. Hence, more randomised clinical trials are needed to assess the benefits and harms of T‐cell specific antibody induction compared with placebo, and compared with another type of antibody, for prevention of rejection in liver transplant recipients. Such trials ought to be conducted with low risk of systematic error (bias) and low risk of random error (play of chance).
Summary of findings
Summary of findings for the main comparison. T‐cell antibody induction compared to placebo/no intervention for liver transplant recipients.
| T‐cell antibody induction compared to placebo/no intervention for liver transplant recipients | ||||||
| Patient or population: liver transplant recipients Settings: hospital Intervention: T‐cell antibody induction Comparison: placebo or no intervention | ||||||
| Outcomes | Illustrative comparative risks* (95% CI) | Relative effect (95% CI) | No. of participants (studies) | Quality of the evidence (GRADE) | Comments | |
| Assumed risk | Corresponding risk | |||||
| Placebo/no intervention | T‐cell antibody induction | |||||
| Mortality Mortality at latest follow‐up Follow‐up: 3‐60 months | Study population | RR 0.91 (0.64‐1.28) | 1853 (16 studies) | ⊕⊕⊕⊝ low1,2 |
||
| 142 per 1000 | 129 per 1000 (91‐181) | |||||
| Low | ||||||
| 106 per 1000 | 96 per 1000 (68‐136) | |||||
| Graft loss including death Graft loss including death at latest follow‐up Follow‐up: 3‐60 months | Study population | RR 0.92 (0.71‐1.19) | 1749 (14 studies) | ⊕⊕⊕⊝ low1,2 | ||
| 187 per 1000 | 172 per 1000 (133‐223) | |||||
| Low | ||||||
| 137 per 1000 | 126 per 1000 (97‐163) | |||||
| Acute rejection Number of participants who experienced at least 1 episode with acute rejection at latest follow‐up Follow‐up: 3‐60 months | Study population | RR 0.85 (0.75‐0.96) | 1918 (16 studies) | ⊕⊕⊕⊝ moderate1 | ||
| 407 per 1000 | 346 per 1000 (305‐390) | |||||
| Low | ||||||
| 402 per 1000 | 342 per 1000 (302‐386) | |||||
| *The basis for the assumed risk (e.g., the median control group risk across studies) is provided in footnotes. The corresponding risk (and its 95% confidence interval) is based on the assumed risk in the comparison group and the relative effect of the intervention (and its 95% CI). CI: Confidence interval; RR: Risk ratio. | ||||||
| GRADE Working Group grades of evidence. High quality: Further research is very unlikely to change our confidence in the estimate of effect. Moderate quality: Further research is likely to have an important impact on our confidence in the estimate of effect and may change the estimate. Low quality: Further research is very likely to have an important impact on our confidence in the estimate of effect and is likely to change the estimate. Very low quality: We are very uncertain about the estimate. | ||||||
1All trials were with 'high risk of bias' as assessed with the Cochrane risk of bias tool.
2Most trials had small sample sizes and small numbers of events; this is why we rated down for 'imprecision.'
Background
Description of the condition
Liver transplantation is an established treatment option for end‐stage liver failure in selected patients and results in improved quality and quantity of life (Pillai 2009; Dienstag 2012). Annually more than 650 liver transplantations are performed in the United Kingdom (Transplant Activity Report 2009), and more than 6000 liver transplantations are performed in the United States (OPTN 2009). Currently, liver transplant recipients have one‐year survival greater than 90% and five‐year survival greater than 75% (Perera 2009).
Description of the intervention
As the result of immunological rejection of the liver, liver transplant recipients are at risk of increased morbidity and reduced survival compared to the general population (Lechler 2005; Flechner 2008).
Maintenance immunosuppressive therapy in liver transplantation often involves three types of drugs directed against the T‐cell activation and proliferation cascade: antiproliferative agents (mycophenolate mofetil, azathioprine), calcineurin inhibitors (tacrolimus, cyclosporine), and steroids (prednisolone) (Pillai 2009). In addition, mammalian target of rapamycin (sirolimus and everolimus) inhibitors have been used to prevent rejection (Perera 2009).
The right combination and dose of these drugs have been the focus of much debate, especially as calcineurin inhibitors are nephrotoxic and prolonged use of corticosteroids causes several complications (Flechner 2008; Sgourakis 2009). No combination of these maintenance immunosuppressive agents can completely prevent acute and chronic rejection and graft failure without causing toxic adverse effects (Flechner 2008; Perera 2009; Pillai 2009; Sgourakis 2009; Penninga 2012).
Antibodies specific for T‐lymphocytes have also been used to prevent rejection, so called 'induction therapy' (Moser 2002). The primary aim of T‐cell specific antibody induction is to reduce the number of circulating T‐lymphocytes in the first days after transplantation, before the full effect of calcineurin inhibitor treatment is obtained, and thus to diminish the number of acute rejections that occur during the first months after transplantation (Moser 2002; Iversen 2009). In addition, it has been suggested that temporary manipulation of the immune system with the use of induction therapy to create 'acceptance of the graft' might allow for long‐term reduction of maintenance immunosuppressive treatment (Chen 2006; Chatenoud 2008). The use of induction antibodies in some liver transplant recipients obviates the need for immunosuppression entirely ('tolerance induction') (Marcos 2004; Starzl 2008), and whilst complete cessation of maintenance immunosuppression is rare, dose reduction of maintenance calcineurin therapy has been reported (Starzl 2003).
T‐cell specific antibody induction is started in the perioperative phase (just before, during or immediately after transplantation), before or at the same time as maintenance immunosuppressive therapy, and is typically used for a short time to avoid the risks of severe infection and sepsis (Boillot 2009; Iversen 2009). Use of T‐cell specific antibody induction allows for delayed introduction, or dose reduction, of primarily calcineurin inhibitors, and is used especially in transplant recipients with renal dysfunction (Iversen 2009; Neuberger 2009).
To date, several T‐cell specific antibody induction agents have been used: polyclonal antibodies of horse or rabbit (antithymocyte globulin (ATG), or antilymphocyte globulin (ALG)); or one of the monoclonal agents specific for the CD3 receptor (muromonab‐CD3), the CD2 receptor (anti‐CD2), the interleukin‐2 receptor (IL‐2R; daclizumab, basiliximab, BT563, or Lo‐Tact‐1), or the CD52 surface protein (alemtuzumab) of T‐cells (Iversen 2009; Pillai 2009). Currently only antithymocyte globulin, basiliximab, and alemtuzumab are commercially available.
How the intervention might work
Acute rejection affects between 20% and 30% of liver transplant recipients (FK506 1994a; FK506 1994b; O'Grady 2002). Clinical presentation of acute rejection consists of acute liver dysfunction (enzyme and coagulation abnormalities), and the diagnosis is confirmed by liver biopsy (Adams 1992). Occasionally, the dysfunction remains subclinical and may be recognised only on biopsy performed for other reasons. Either way, the sequelae of acute rejection may include resolution with effective treatment, or graft loss followed by re‐transplantation, chronic organ dysfunction, or both, followed by re‐transplantation, or death of a patient.
T‐cell specific antibody induction therapy is intended to reduce rejection. ATG, ALG, muromonab‐CD3, and alemtuzumab all tend to remove the functional T‐cell population from the circulation, thereby causing profound immunosuppression (Moser 2002; Magliocca 2006). The interleukin‐2 receptor antagonists (IL‐2RAs) have been developed to increase the specificity of immunosuppression, thereby avoiding the toxicity of over‐immunosuppression. These antagonists exert their effects by binding to the alpha subunit of the interleukin‐2 receptor found only on activated T‐cells. Blockade of the interleukin‐2 receptor results in prevention of interleukin‐2–stimulated clonal expression of the T‐cell (Neuhaus 1993; Moser 2002; Iversen 2009).
Why it is important to do this review
In contrast to other solid organ transplants, a vast majority of early acute rejection episodes in liver transplant recipients are successfully reversed with no long‐term sequelae (chronic rejection 2%) (Wiesner 2003). However, graft losses due to acute rejection still occur, emphasising the need for continued improvement in immunosuppression. This review aimed to examine the potential of T‐cell antibody induction in liver transplant recipients compared with placebo, no induction, or another type of T‐cell specific antibody induction. Another systematic review has assessed the use of T‐cell specific antibody induction compared with corticosteroid induction for liver transplant recipients (Penninga 2014). Furthermore, the use of T‐cell specific antibody induction has been assessed for heart, lung, and kidney transplant recipients in Cochrane systematic reviews (Webster 2010; Penninga 2013; Penninga 2013a).
The use of T‐cell specific antibody induction is increasing. To date, 26% of liver transplant recipients receive induction therapy (OPTN 2009). As with maintenance immunosuppressive treatment, T‐cell specific antibody induction is discussed intensely, and no consensus exists on the use of immunosuppressive T‐cell specific antibody induction therapy after liver transplantation. The benefits and harms of T‐cell specific antibody induction are unclear, and studies have shown conflicting results (Moser 2002; Boillot 2009; Neuberger 2009; Pillai 2009).
We have found two published meta‐analyses on interleukin‐2 receptor antagonist therapy for liver transplant recipients (Wang 2010; Goralczyk 2011). However, they did not assess the benefits and harms of all types of antibodies that are or have been used in liver transplant recipients, as we aimed to do with this systematic review. The meta‐analysis by Goralczyk 2011 also contains non‐randomised studies on interleukin‐2 receptor antagonists, and this increases the risk of biased results. The meta‐analysis by Wang 2010 includes studies on interleukin‐2 receptor antagonists, in which concomitant immunosuppression is different in the trial groups. This makes it difficult to assess the role of T‐cell antibody induction when compared with placebo, no induction, or another type of antibody induction for prevention of acute rejection in liver transplant recipients. This is why we attempted to assess the benefits and harms of any types of antibodies used in liver transplant recipients, and included trials in which concomitant immunosuppressive treatment was to be similar within trials. Furthermore, we assessed both risk of bias (systematic errors) and risk of play of chance (random errors) of the randomised clinical trials that we identified and analysed.
Objectives
To assess the benefits and harms of immunosuppressive T‐cell specific antibody induction compared with placebo, no induction, or another type of T‐cell specific antibody induction for prevention of acute rejection in liver transplant recipients.
Methods
Criteria for considering studies for this review
Types of studies
We included all randomised clinical trials on children and adults, investigating T‐cell specific antibody induction versus placebo, no induction, or another type of antibody induction in liver transplant recipients. We considered publications on quasi‐randomised and observational studies, if identified by the search, for their report on harms.
We excluded trials with antibodies directed against co‐stimulation (LEA29Y) or B‐cells (rituximab), or with broad cellular and humoral targets (intravenous immunoglobulin (IVIG)).
Types of participants
We included recipients of liver transplants independent of the type of graft (live donor, cadaveric, split, whole, domino) and the age of the recipient. No lower or upper age limit was applied in our trial search. Previous transplant recipients were also included.
Types of interventions
Trials investigating any type of T‐cell specific antibody induction compared with placebo, no intervention, or another type of antibody in any dose or duration.
Accordingly, T‐cell specific antibody induction could include:
interleukin‐2 receptor antagonists (BT563, Lo‐Tact‐1, daclizumab, or basiliximab);
monoclonal antibody (muromonab‐CD3 (orthoclone, OKT3) or anti‐CD2);
polyclonal antibody (antithymocyte globulin (ATG) or antilymphocyte globulin (ALG)); or
alemtuzumab (Campath‐1H).
We required that concomitant immunosuppressive agents were similar within the groups of a trial.
Types of outcome measures
Primary outcomes
Mortality.
Graft loss (including death).
Acute rejection (clinical) (Banff 1997).
Quality of life.
Secondary outcomes
Adverse events. Serious adverse events were defined according to the International Conference on Harmonisation (ICH) Guidelines for Good Clinical Practice as any untoward medical occurrence that at any dose resulted in death, was life threatening, required inpatient hospitalisation or prolongation of existing hospitalisation, or resulted in persistent or significant disability or incapacity, or was a congenital anomaly/birth defect, or any medical event that might have jeopardised the participant, or required intervention to prevent it (ICH‐GCP 1997). All other adverse events (i.e., any medical occurrence not necessarily having a causal relationship with the treatment but causing a dose reduction or discontinuation of treatment) were considered as non‐serious.
Infection.
Cytomegalovirus (CMV) infection.
Hepatis C virus recurrence.
Malignancy.
Post‐transplantation lymphoproliferative disorder.
Renal function (renal failure requiring dialysis, glomerular filtration rate, and serum creatinine).
Diabetes mellitus.
Hypertension.
Hyperlipidaemia.
Search methods for identification of studies
Electronic searches
We searched The Cochrane Hepato‐Biliary Group Controlled Trials Register (Gluud 2014), the Cochrane Central Register of Controlled Trials (CENTRAL), MEDLINE, EMBASE, and Science Citation Index Expanded (Royle 2003). In addition, we searched the World Health Organization (WHO) International Clinical Trials Registry Platform (www.who.int/ictrp). We have provided the search strategies used, along with the time spans of the searches, in Appendix 1. The last search was performed 30 September 2013.
Searching other resources
We reviewed the reference lists of transplant surgery textbooks, review articles, and relevant trials, as well as US Food and Drug Administration (FDA) and European Medicines Agency (EMA) drug approval reviews, and we contacted the principal authors of identified trials. We also contacted pharmaceutical companies to request data from unpublished randomised clinical trials.
Data collection and analysis
We performed the review according to the recommendations of The Cochrane Collaboration (Higgins 2011) and The Cochrane Hepato‐Biliary Module (Gluud 2014). We used Review Manager 5.2 to perform statistical analyses (RevMan 2012), as well as trial sequential analysis software (CTU 2011).
Selection of studies
We used the search strategies described in Appendix 1 to obtain titles and abstracts of studies that could be relevant for the review. Two review authors (LP and AW) independently assessed trial eligibility. We listed excluded studies along with the reasons for exclusion. We resolved disagreements by discussion or in consultation with a third review author (CG). We contacted authors of the trials when information about methodology or data were unclear or missing.
Data extraction and management
Two review authors (LP and AW) extracted trial data independently, using standard data extraction forms (Moher 2009; Higgins 2011). Trials reported in non–English language journals were planned to be translated before assessment. When more than one publication of a study was found, we grouped reports together, and we marked as primary the publication with the most complete data. To extract data on relevant outcomes if reported only once in multiple publications of a trial, we used an earlier version of the trial report, and we have marked it as the primary reference. We provided information about this in the 'Notes' section of the Characteristics of included studies. We highlighted discrepancies between published versions when identified. We contacted trial authors in writing to obtain further information not reported in the publications, and we included in the review any relevant information obtained in this manner. We resolved disagreements by consultation with all review authors. From each trial, we extracted the following information: first author, country of origin, trial design, inclusion and exclusion criteria, number of participants, participant characteristics, trial drugs (dose, administration), duration, all other additional immunosuppressive therapy, follow‐up period, primary and secondary outcomes, adverse events, and participants lost to follow‐up.
Assessment of risk of bias in included studies
We followed the instructions given in the Cochrane Handbook for Systematic Reviews of Interventions (Higgins 2011) and the Cochrane Hepato‐Biliary Group Module (Gluud 2014). On the basis of empirical evidence (Schulz 1995; Moher 1998; Kjaergard 2001; Wood 2008; Lundh 2012; Savović 2012; Savović 2012a), we used the following domains with definitions for evaluation of the risk of bias in all included review trials.
Allocation sequence generation
Low risk of bias: Sequence generation was achieved using computer random number generation or a random number table. Drawing lots, tossing a coin, shuffling cards, and throwing dice are adequate if performed by an independent person not otherwise involved in the trial.
Uncertain risk of bias: The method of sequence generation was not specified.
High risk of bias: The sequence generation method was not random.
Allocation concealment
Low risk of bias: Participant allocations could not have been foreseen in advance of, or during, enrolment. Allocation was controlled by a central and independent randomisation unit. The allocation sequence was unknown to the investigators (e.g., the allocation sequence was hidden in sequentially numbered, opaque, and sealed envelopes).
Uncertain risk of bias: The method used to conceal the allocation was not described, so intervention allocations may have been foreseen in advance of, or during, enrolment.
High risk of bias: The allocation sequence was likely to be known to the investigators who assigned the participants.
Blinding of participants and personnel
Low risk of bias: Blinding of participants and personnel was performed adequately.
Uncertain risk of bias: Information was insufficient to permit assessment of whether blinding of participants and personnel was likely to induce bias on the results.
High risk of bias: No blinding or incomplete blinding of participants and personnel was provided.
Blinding of outcome assessors
Low risk of bias: Assessment of outcomes was not likely to be influenced by lack of blinding.
Uncertain risk of bias: Information was insufficient to permit assessment of whether blinding of outcome assessors was likely to induce bias on the results.
High risk of bias: Assessment of outcomes was likely to be influenced by lack of blinding.
Incomplete outcome data
Low risk of bias: Missing data were unlikely to make treatment effects depart from plausible values. Sufficient methods, such as multiple imputation, have been employed to handle missing data.
Uncertain risk of bias: Information was insufficient to permit assessment of whether missing data in combination with the method used to handle missing data was likely to induce bias on the results.
High risk of bias: Results were likely to be biased as the result of missing data.
Selective outcome reporting
‐ Low risk of bias: All outcomes were predefined and reported, or all clinically relevant and reasonably expected outcomes were reported.
Uncertain risk of bias: It is unclear whether all predefined and clinically relevant and reasonably expected outcomes were reported.
High risk of bias: One or more clinically relevant and reasonably expected outcomes were not reported, and data on these outcomes were likely to have been recorded.
For a trial to be assessed with low risk of bias in the selective outcome reporting domain, the trial should have been registered on the www.clinicaltrials.gov website or on a similar register, or a protocol should have been provided (e.g., published in a paper journal). In the case when the trial was run and published during the years when trial registration was not required, we would carefully scrutinise all publications reporting on the trial to identify the trial objectives and outcomes. If usable data on all outcomes specified in the trial objectives are provided in the results section of the publication, the trial can be considered with low risk of bias in the selective outcome reporting domain.
Other bias
Low risk of bias: The trial appears to be free of other components that could put it at risk of bias.
Uncertain risk of bias: The trial may or may not be free of other components that could put it at risk of bias.
High risk of bias: Other factors in the trial could put it at risk of bias (e.g., for‐profit involvement, authors have conducted trials on the same topic).
When the risk of bias in a trial was judged as 'low' in all listed bias risk domains, the trial was assessed as a trial with low risk of bias. If the risk of bias was judged as 'uncertain' or 'high', the trial was assessed as a trial with high risk of bias. Thus, we planned to divide the trials into two groups: trials with low risk of bias and trials with high risk of bias.
When information was not available in a trial publication, we contacted the trial authors to assess the risk of bias correctly.
Measures of treatment effect
For dichotomous outcomes, we expressed the results as risk ratios (RRs) with 95% confidence intervals (CIs). When continuous scales of measurement were used in trials to assess the effects of treatment, we used mean differences (MDs), and when different scales were used, we used standardised mean differences (SMDs) (Thompson 2002).
Dealing with missing data
When confronted with missing data, we did the following. We contacted the trial investigators to request missing data. When this approach failed, we made explicit the assumptions of any methods used to cope with missing data, for example, we assumed that the data were missing at random, or that missing values had a particular value, such as a poor outcome. In these situations, we also aimed to perform sensitivity analyses to assess how sensitive results were to reasonable changes in the assumptions that we made. Finally, in the discussion section, we addressed the potential impact of all 'missing data' situations on the findings of the review.
Assessment of heterogeneity
We analysed heterogeneity using a Chi2 test on N‐1 degrees of freedom, with a P value of 0.10 used for statistical significance. The degree of heterogeneity observed in the results was quantified using the I2 statistic, which can be interpreted as the percentage of variation observed between trials attributable to between‐study differences rather than to sampling error (chance) (Higgins 2002).
Assessment of reporting biases
We considered reporting biases (e.g., publication, time lag, multiple publication) during data analysis and interpretation. As we identified 19 randomised clinical trials, we tested for publication bias using funnel plots (Egger 1997; Macaskill 2001), bearing in mind that publication bias does not necessarily cause asymmetry, and that asymmetry may have causes other than publication bias.
Data synthesis
Meta‐analysis
We analysed the data using both random‐effects and fixed‐effect model meta‐analysis to ensure robustness of the results. In cases of significant differences in the results that the two models had produced, we provided both sets of results. When the difference in results was not statistically significant, we presented only the results of the random‐effects model (Higgins 2002).
Trial sequential analysis
We applied trial sequential analysis (CTU 2011; Thorlund 2011a) because cumulative meta‐analyses are at risk of producing random errors as the result of sparse data and repetitive testing of accumulating data (Brok 2008; Wetterslev 2008; Thorlund 2009; Wetterslev 2009). To minimise random errors, we calculated the required information size (i.e., the number of participants needed in a meta‐analysis to detect or reject a certain intervention effect). The information size calculation should also account for the diversity present in the meta‐analysis (Wetterslev 2008; Thorlund 2011).
In our meta‐analysis, the required information size was based on the assumption of a relative risk reduction of 20%. The underlying assumption of trial sequential analysis is that testing for significance may be performed each time a new trial is added to the meta‐analysis. We added trials according to the year of publication, and when more than one trial was published in a year, we added trials alphabetically according to the last name of the first author. On the basis of the required information size and risks for type I (5%) and type II (20%) errors, we constructed trial sequential monitoring boundaries. These boundaries determine the statistical inference that one may draw regarding a cumulative meta‐analysis that has not reached the required information size; if a trial sequential boundary for benefit or harm was crossed before the required information size was reached, firm evidence may perhaps be established, and further trials may turn out to be superfluous. On the other hand, if a trial sequential boundary for futility is not surpassed, it is most probably necessary to continue doing trials to detect or reject a particular intervention effect (Brok 2008; Wetterslev 2008; Thorlund 2009; Wetterslev 2009; Thorlund 2011a; Penninga 2014a).
Subgroup analysis and investigation of heterogeneity
We planned subgroup analyses for the following.
Individual antibody preparation compared to the other classes of antibody preparation (interleukin‐2 receptor antagonists compared to polyclonal antibodies, etc.).
Antibody preparation compared to different formulation of same class of antibody preparation (basiliximab compared to daclizumab, etc.).
Adult compared to paediatric participants, as differences in immunology might be expected (Seyfert‐Margolis 2010).
Early (at time of transplantation) versus delayed (five or more days after transplantation) start of calcineurin inhibitor (Neuberger 2009).
Trials with low risk of bIas compared to trials with high risk of bias.
Recipients with hepatitis C virus infection compared to recipients without hepatitis C virus infection.
Sensitivity analysis
Zero‐event trials
Review Manager 5 software is unable to handle trials with zero events in both intervention groups when meta‐analyses are performed as RRs or odds ratios (ORs). As it seems unjustified and unreasonable to exclude zero‐event trials (Keus 2009), potentially creating the risk of inflating the magnitude of pooled treatment effects, we also performed a random‐effects meta‐analysis with empirical continuity correction of 0.01 in trials with zero events (Sweeting 2004).
Summary of findings table
We employed the GRADE approach to interpret findings (Langendam 2013), and the GRADE profiler (GRADEPRO) allowed us to import data from Review Manager 5.2 to create a summary of findings table. This table provides outcome‐specific information concerning the overall quality of evidence from studies included in the comparison, the magnitude of effect of the interventions examined, and the sum of available data on the outcomes that we considered, given our trial sequential analyses.
Results
Description of studies
Results of the search
Our predefined search identified 1277 references (Figure 1). Sixty‐four references were found in additional sources. Exclusion of duplicates and irrelevant references left 19 randomised clinical trials published in a total of 52 publications (40 peer‐reviewed journal articles and 12 conference abstracts) (see Characteristics of included studies; Characteristics of excluded studies). Thirteen of the trials were published only in peer‐reviewed journals (Cosimi 1990; Mc Diarmid 1991; Farges 1994; Nashan 1996; Otto 1996; Reding 1996; Langrehr 1998; Bogetti 2005; Lerut 2005; Yoshida 2005; Schmeding 2007; Neuberger 2009; Calmus 2010). Three of the trials were published as both peer‐reviewed journal articles and conference abstracts (Langrehr 1997; Neuhaus 2002; Boillot 2009), and three were published only as conference abstracts (Yan 2004; Fasola 2005; Eghtesad 2011).
1.
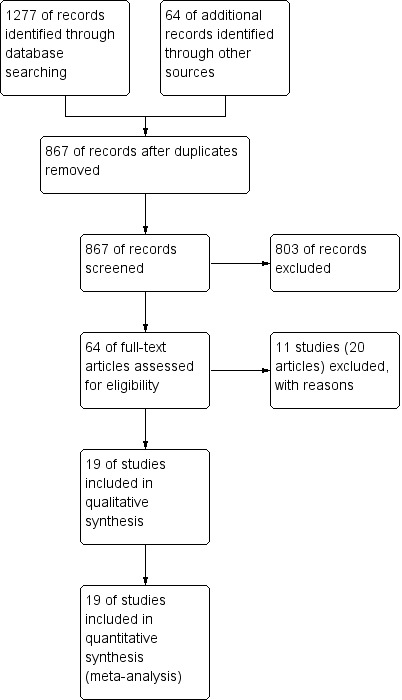
Study flow diagram.
Included studies
We included 19 randomised trials, of which 16 trials were two‐arm trials and three were three‐arm trials. The 19 trials included a total of 2067 participants, in whom T‐cell specific antibody induction was compared as follows: T‐cell specific antibody induction versus no induction was compared in 17 trials with a total of 1955 participants; interleukin‐2 receptor antagonist (IL‐2 RA) versus no induction in 10 trials with a total of 1454 participants; monoclonal antibody versus no induction in five trials with a total of 398 participants; polyclonal antibody versus no induction in three with a total of 145 participants; IL2‐RA versus monoclonal antibody in one trial with 87 participants; and IL‐2 RA versus polyclonal antibody in two trials with a total of 112 participants,
In total, interleukin‐2 receptor antagonists were studied in 12 trials (three trials studied basiliximab (Neuhaus 2002; Yan 2004; Schmeding 2007); four trials studied daclizumab (Fasola 2005; Yoshida 2005; Neuberger 2009; Calmus 2010); four trials studied BT563 (Nashan 1996; Otto 1996; Langrehr 1997; Langrehr 1998); and one trial studied LO‐Tact‐1 (Reding 1996)). Monoclonal antibodies were studied in five trials (muromonab‐CD3 was studied in four trials (Cosimi 1990; Mc Diarmid 1991; Farges 1994; Reding 1996), and LO‐CD2a was studied in one trial (Lerut 2005)). Polyclonal antibodies were studied in five trials (Nashan 1996; Langrehr 1997; Bogetti 2005; Boillot 2009; Eghtesad 2011). All five trials studying polyclonal antibodies used antithymocyte globulin raised in rabbits (Nashan 1996; Langrehr 1997; Bogetti 2005; Boillot 2009; Eghtesad 2011).
Six of the 19 trials were multicenter trials (Cosimi 1990; Farges 1994; Neuhaus 2002; Yoshida 2005; Neuberger 2009; Calmus 2010), and 13 were single‐centre trials (Mc Diarmid 1991; Nashan 1996; Otto 1996; Reding 1996; Langrehr 1997; Langrehr 1998; Yan 2004; Bogetti 2005; Fasola 2005; Lerut 2005; Schmeding 2007; Boillot 2009; Eghtesad 2011).
In 16 trials, the population consisted of adult participants (Cosimi 1990; Nashan 1996; Otto 1996; Langrehr 1997; Langrehr 1998; Neuhaus 2002; Yan 2004; Bogetti 2005; Fasola 2005; Lerut 2005; Yoshida 2005; Schmeding 2007; Boillot 2009; Neuberger 2009; Calmus 2010; Eghtesad 2011), and in three trials, both adult and paediatric participants were included (Mc Diarmid 1991; Farges 1994; Reding 1996). None of the trials included exclusively paediatric patients.
Mean age of the treatment groups was reported in 14 trials, and mean age in the different trials ranged from 39 to 55 years in the trials with adult participants (Cosimi 1990; Nashan 1996; Otto 1996; Langrehr 1997; Langrehr 1998; Neuhaus 2002; Yan 2004; Bogetti 2005; Fasola 2005; Lerut 2005; Schmeding 2007; Boillot 2009; Neuberger 2009; Calmus 2010).
Mean age of participants in the different intervention groups within the single trials was similar (Cosimi 1990; Farges 1994; Nashan 1996; Otto 1996; Reding 1996; Langrehr 1997; Neuhaus 2002; Yan 2004; Bogetti 2005; Fasola 2005; Lerut 2005; Yoshida 2005; Schmeding 2007; Boillot 2009; Neuberger 2009; Calmus 2010), except maybe for two trials, in which participants treated with T‐cell specific antibody induction had a lower mean age (Mc Diarmid 1991; mean age muromonab‐CD3 group 32 years, and control group 41 years; Langrehr 1998; mean age BT563 group 42 years, and control group 54 years).
Most of the included trials studied liver transplant recipients transplanted for various indications (Cosimi 1990; Mc Diarmid 1991; Farges 1994; Nashan 1996; Otto 1996; Reding 1996; Langrehr 1997; Langrehr 1998; Neuhaus 2002; Yan 2004; Bogetti 2005; Lerut 2005; Yoshida 2005; Schmeding 2007; Boillot 2009; Neuberger 2009; Calmus 2010; Eghtesad 2011), and one trial exclusively included participants transplanted for hepatitis C (Fasola 2005).
In 12 trials, the transplanted livers were exclusively obtained from deceased (cadaveric) donors (Cosimi 1990; Mc Diarmid 1991; Nashan 1996; Reding 1996; Langrehr 1997; Langrehr 1998; Neuhaus 2002; Yan 2004; Bogetti 2005; Yoshida 2005; Boillot 2009; Eghtesad 2011). In four trials, the transplanted livers were obtained from both living donors and deceased donors (Lerut 2005; Schmeding 2007; Neuberger 2009; Calmus 2010), and one of these four trials reported that transplanted livers were obtained from both brain‐dead deceased donors and non–heart‐beating donors (Neuberger 2009). Three trials did not report on the type of donor used (Farges 1994; Otto 1996; Fasola 2005).
Participant follow‐up in the 19 trials ranged from three months to five years. Participant follow‐up was three months in three trials (Yan 2004; Bogetti 2005; Eghtesad 2011), 12 months in seven trials (Farges 1994; Nashan 1996; Otto 1996; Neuhaus 2002; Fasola 2005; Yoshida 2005; Neuberger 2009), 18 months in one trial (Cosimi 1990), two years in three trials (Mc Diarmid 1991; Reding 1996; Calmus 2010), three years in three trials (Langrehr 1997; Langrehr 1998; Schmeding 2007), and five years in two trials (Lerut 2005; Boillot 2009).
Baseline immunosuppression
As described in our protocol, we required that maintenance immunosuppressive treatment was the same within all trials. Hence, we excluded from the meta‐analysis one treatment arm in one three‐armed trial, as differences in concomitant Immunosuppressive treatment within the trial were observed (Neuberger 2009). All trials reported on maintenance Immunosuppressive treatment, and this varied between trials.
All participants were treated with a calcineurin inhibitor, which in nine trials was tacrolimus (Bogetti 2005; Fasola 2005; Lerut 2005; Yoshida 2005; Schmeding 2007; Boillot 2009; Neuberger 2009; Calmus 2010; Eghtesad 2011), and in 10
trials was cyclosporine (Cosimi 1990; Mc Diarmid 1991; Farges 1994; Nashan 1996; Otto 1996; Reding 1996; Langrehr 1997; Langrehr 1998; Neuhaus 2002; Yan 2004). Delayed start of calcineurin treatment in the T‐cell specific antibody induction group arm of the trial was applied in six trials (Mc Diarmid 1991; Farges 1994; Yoshida 2005; Neuberger 2009; Calmus 2010; Eghtesad 2011).
Triple‐drug maintenance immunosuppression was administered in 15 trials (Cosimi 1990; Mc Diarmid 1991; Farges 1994; Otto 1996; Reding 1996; Langrehr 1997; Langrehr 1998; Yan 2004; Fasola 2005; Yoshida 2005; Schmeding 2007; Boillot 2009; Neuberger 2009; Calmus 2010; Eghtesad 2011), and double‐drug maintenance immunosuppression was given in four trials (Nashan 1996; Neuhaus 2002; Bogetti 2005; Lerut 2005). No trials applied single‐drug maintenance immunosuppression.
Corticosteroids were administered in all 19 trials (Cosimi 1990; Mc Diarmid 1991; Farges 1994; Nashan 1996; Otto 1996; Reding 1996; Langrehr 1997; Langrehr 1998; Neuhaus 2002; Yan 2004; Bogetti 2005; Fasola 2005; Lerut 2005; Yoshida 2005; Schmeding 2007; Boillot 2009; Neuberger 2009; Calmus 2010; Eghtesad 2011). An antiproliferative agent was used in 15 of 19 trials. Of these 15 trials, seven trials used azathioprine (Cosimi 1990; Mc Diarmid 1991; Farges 1994; Otto 1996; Reding 1996; Langrehr 1997; Langrehr 1998) and 8 trials used mycophenolate mofetil (Yan 2004; Fasola 2005; Yoshida 2005; Schmeding 2007; Boillot 2009; Neuberger 2009; Calmus 2010; Eghtesad 2011) as the antiproliferative agent.
Excluded studies
We excluded nine studies after we had read the full text of the article. These studies were randomised clinical trials, but they did not assess T‐cell specific antibody induction versus placebo, no induction, or another type of T‐cell specific antibody induction. We describe the reasons for exclusion in Characteristics of excluded studies.
Risk of bias in included studies
Trial methodology was inadequately reported in most of the included trials (Figure 2; Figure 3). All 19 trials were considered to be trials with high risk of bias, as one or more of the bias components were unclear because of incomplete reporting or high risk of bias (Cosimi 1990; Mc Diarmid 1991; Farges 1994; Nashan 1996; Otto 1996; Reding 1996; Langrehr 1997; Langrehr 1998; Neuhaus 2002; Yan 2004; Bogetti 2005; Fasola 2005; Lerut 2005; Yoshida 2005; Schmeding 2007; Boillot 2009; Neuberger 2009; Calmus 2010; Eghtesad 2011).
2.
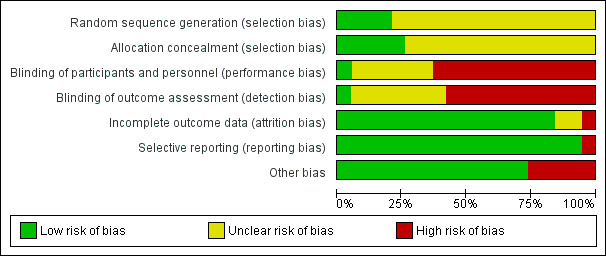
Risk of bias graph: review authors' judgements about each risk of bias item presented as percentages across all included studies.
3.
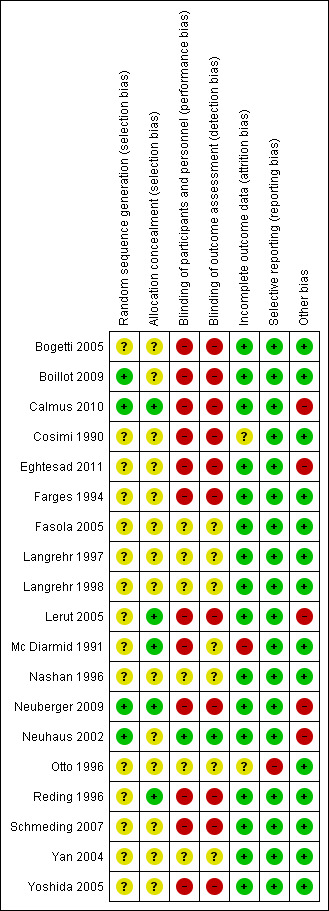
Risk of bias summary: review authors' judgements about each risk of bias item for each included study.
Allocation
Generation of the allocation sequence was adequately reported in four trials (Neuhaus 2002; Boillot 2009; Neuberger 2009; Calmus 2010) and was not adequately reported in 15 trials (Cosimi 1990; Mc Diarmid 1991; Farges 1994; Nashan 1996; Otto 1996; Reding 1996; Langrehr 1997; Langrehr 1998; Yan 2004; Bogetti 2005; Fasola 2005; Lerut 2005; Yoshida 2005; Schmeding 2007; Eghtesad 2011).
The method of allocation concealment was adequate in five trials (Mc Diarmid 1991; Reding 1996; Lerut 2005; Neuberger 2009; Calmus 2010), and it was not adequately reported in 14 trials (Cosimi 1990; Farges 1994; Nashan 1996; Otto 1996; Langrehr 1997; Langrehr 1998; Neuhaus 2002; Yan 2004; Bogetti 2005; Fasola 2005; Yoshida 2005; Schmeding 2007; Boillot 2009; Eghtesad 2011).
Blinding
Only one of the trials both reported accurately on blinding and applied adequate blinding methods (Neuhaus 2002). One trial reported that it was 'double‐blinded,' but no other information was given (Yan 2004). One trial reported that it was placebo‐controlled, but no other information was given (Langrehr 1998). One trial was partially blinded, as the pathologists who examined the liver biopsy specimens were blinded to the study drug assignment (Mc Diarmid 1991). Three trials did not report on blinding (Nashan 1996; Langrehr 1997; Fasola 2005), and 12 trials were not blinded (Cosimi 1990; Farges 1994; Otto 1996; Reding 1996; Bogetti 2005; Lerut 2005; Yoshida 2005; Schmeding 2007; Boillot 2009; Neuberger 2009; Calmus 2010; Eghtesad 2011).
Incomplete outcome data
In 17 trials, either no data were missing or missing data were adequately addressed, and it was unlikely that the missing data influenced outcome results (Farges 1994; Nashan 1996; Otto 1996; Reding 1996; Langrehr 1997; Langrehr 1998; Neuhaus 2002; Yan 2004; Bogetti 2005; Fasola 2005; Lerut 2005; Yoshida 2005; Schmeding 2007; Boillot 2009; Neuberger 2009; Calmus 2010; Eghtesad 2011). In one trial, missing data were inadequately addressed, and it was unclear whether this influenced outcome results (Cosimi 1990). In one trial, participants who died or lost their graft within seven days after transplantation were excluded from the analysis by the review authors, and the number of participants excluded was unclear (Mc Diarmid 1991).
Selective reporting
We had access to a limited number of trial protocols; however, all but one trial reported expected clinical outcome measures or outcome measures as specified in the methods section of the article (Otto 1996).
Other potential sources of bias
Five of the 19 trials reported that they were industry sponsored or industry affiliated (Neuhaus 2002; Lerut 2005; Neuberger 2009; Calmus 2010; Eghtesad 2011). For fourteen trials, no other components were detected that could put the trial at risk of bias (Cosimi 1990; Mc Diarmid 1991; Farges 1994; Nashan 1996; Otto 1996; Reding 1996; Langrehr 1997; Langrehr 1998; Yan 2004; Bogetti 2005; Fasola 2005; Yoshida 2005; Schmeding 2007; Boillot 2009).
Effects of interventions
See: Table 1
Any kind of T‐cell specific antibody induction versus no induction
Seventeen trials with 1955 allocated participants compared any kind of T‐cell specific antibody induction versus no T‐cell specific antibody induction (Cosimi 1990; Mc Diarmid 1991; Farges 1994; Nashan 1996; Otto 1996; Reding 1996; Langrehr 1997; Langrehr 1998; Neuhaus 2002; Yan 2004; Bogetti 2005; Fasola 2005; Lerut 2005; Yoshida 2005; Schmeding 2007; Boillot 2009; Neuberger 2009; Calmus 2010; Eghtesad 2011).
Mortality
Sixteen trials with a total of 1853 participants (Analysis 1.1) reported adequately on mortality, and overall no significant difference in mortality was found between any kind of T‐cell specific antibody induction compared with no induction (118/963 (12%) versus 126/889 (14%); RR 0.91, 95% CI 0.64 to 1.28). Trial sequential analysis showed that trial sequential monitoring boundaries were not crossed by the cumulative Z‐curve, and the required information size of 7684 participants was not obtained (Figure 4).
1.1. Analysis.
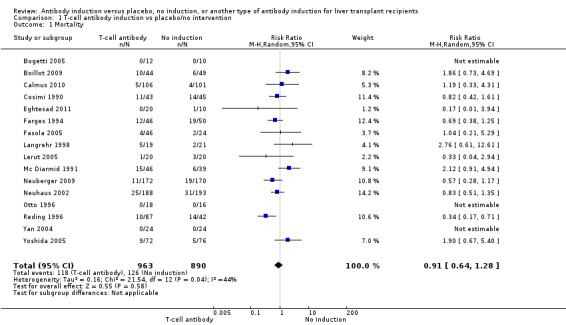
Comparison 1 T‐cell antibody induction vs placebo/no intervention, Outcome 1 Mortality.
4.
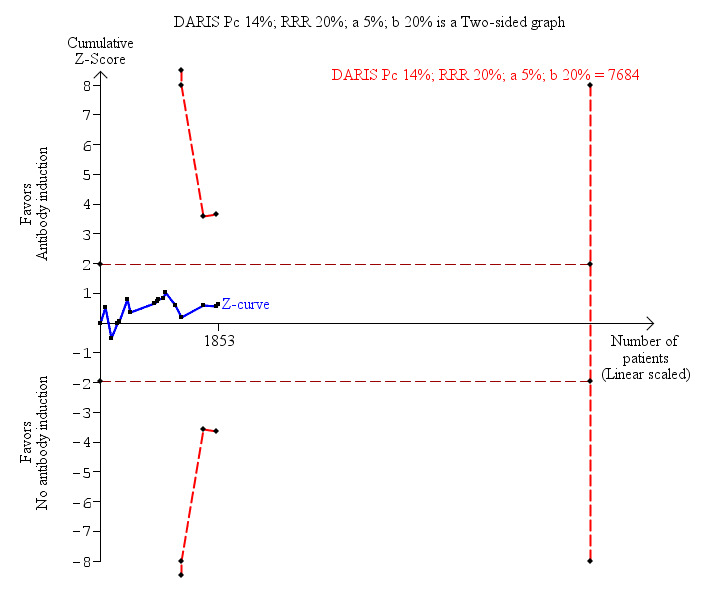
Antibody induction versus no antibody induction; mortality: trial sequential analysis of the effect of antibody induction versus no antibody induction on mortality based on 16 trials with 1853 participants. The diversity adjusted required information size (DARIS) of 7684 participants was calculated on the basis of type I error of 5%, type II error of 20%, and risk reduction of 20%, and information size was adjusted for diversity (43%). The cumulative Z‐curve does not cross trial sequential monitoring boundaries, and required information size was not reached.
Graft loss including death
Fourteen trials with a total of 1749 participants (Analysis 1.2) reported on graft loss, and overall no significant difference in graft loss was found when any kind of T‐cell specific antibody induction was compared with no induction (156/899 (17%) versus 158/850 (19%); RR 0.92, 95% CI 0.71 to 1.19). Trial sequential analysis showed that trial sequential monitoring boundaries were not crossed by the cumulative Z‐curve, and the required information size of 4427 participants was not obtained (Figure 5).
1.2. Analysis.
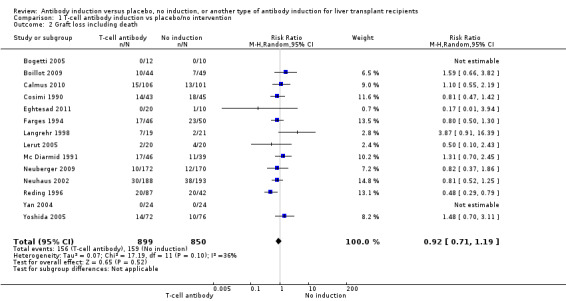
Comparison 1 T‐cell antibody induction vs placebo/no intervention, Outcome 2 Graft loss including death.
5.
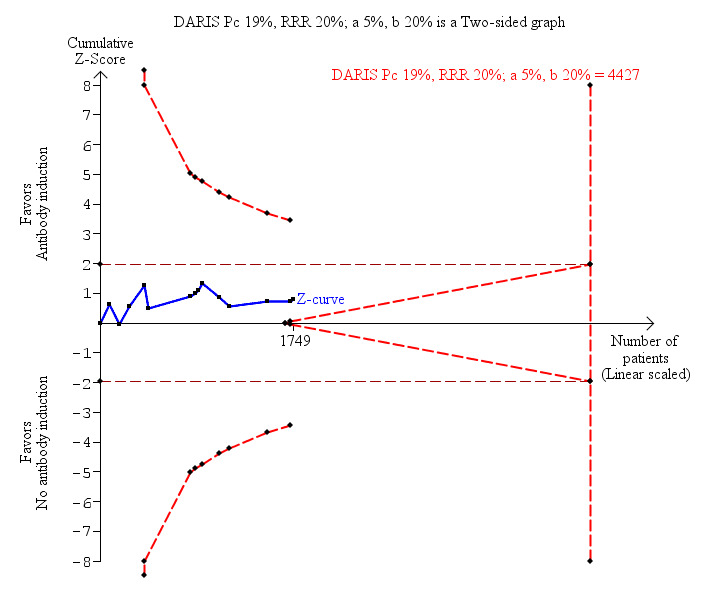
Antibody induction versus no antibody induction; graft loss including death: trial sequential analysis of the effect of antibody induction versus no antibody induction on graft loss including death based on 14 trials with 1749 participants. The diversity adjusted required information size (DARIS) of 4427 participants was calculated on the basis of type I error of 5%, type II error of 20%, and risk reduction of 20%, and information size was adjusted for diversity (30%). The cumulative Z‐curve does not cross trial sequential monitoring boundaries, and required information size was not reached.
Acute rejection
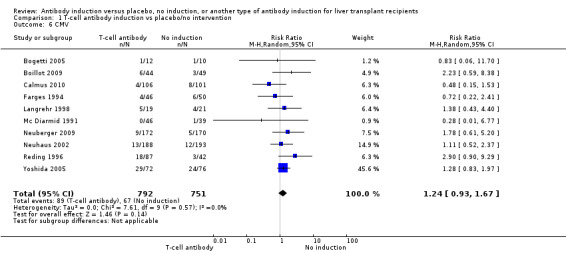
Acute rejection, defined as the number of participants who experienced at least one episode of rejection, was reported in 16 trials with a total of 1918 participants (Analysis 1.3), and acute rejection was significantly less frequent when any kind of T‐cell specific antibody induction was compared with no induction (353/996 (35%) versus 375/922 (41%); RR 0.85, 95% CI 0.75 to 0.96) when the random‐effects model was applied. This difference was confirmed when the fixed‐effect model was applied (RR 0.83, 95% CI 0.75 to 0.93). Furthermore, trial sequential analysis showed that the required information size of 1272 participants was obtained, and that the trial sequential monitoring boundary was crossed by the cumulative Z‐curve before the required information size was reached (Figure 6).
1.3. Analysis.
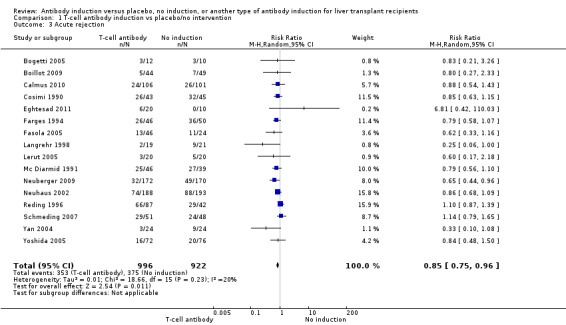
Comparison 1 T‐cell antibody induction vs placebo/no intervention, Outcome 3 Acute rejection.
6.
Antibody induction versus no antibody induction; acute rejection: trial sequential analysis of the effect of antibody induction versus no antibody induction on acute rejection based on 16 trials with 1918 participants. The diversity adjusted required information size (DARIS) of 1272 participants was calculated on the basis of type I error of 5%, type II error of 20%, and risk reduction of 20%, and information size was adjusted for diversity (15%). The cumulative Z‐curve does cross trial sequential monitoring boundaries, and the required information size was reached.
Quality of life
None of the trials reported on quality of life.
Adverse events
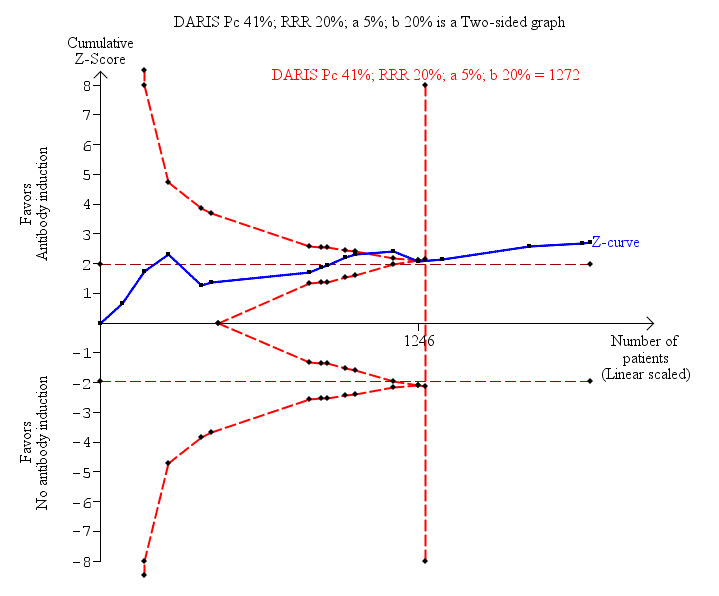
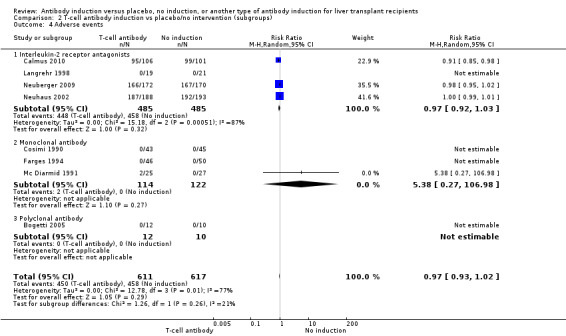
Eight trials with 1228 participants reported on drug‐associated adverse events (Analysis 1.4), and overall no significant difference in reported drug‐associated adverse events was found when any kind of T‐cell specific antibody induction was compared with no induction (450/611 (74%) versus 458/617 (74%); RR 0.97, 95% CI 0.93 to 1.02). However definitions of drug‐associated adverse events varied widely between trials. Some trials reported almost no adverse events, and in other trials, adverse events were reported for almost every participant. Trial sequential analysis showed that trial sequential monitoring boundaries were not crossed by the cumulative Z‐curve, and the required information size of 2494 participants was not obtained.
1.4. Analysis.
Comparison 1 T‐cell antibody induction vs placebo/no intervention, Outcome 4 Adverse events.
Infection
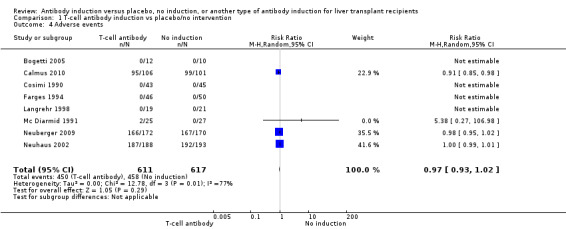
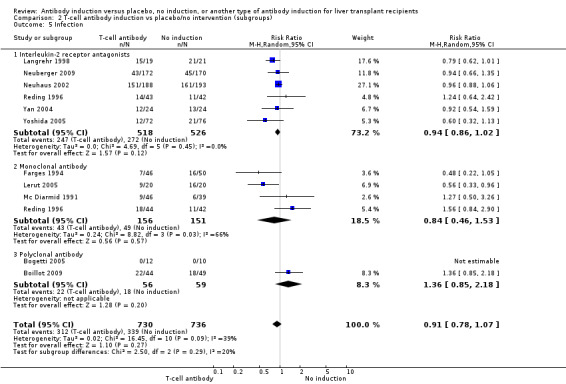
Infection, defined as the number of participants who experienced at least one episode of infection, was reported in 11 trials with a total of 1424 participants (Analysis 1.5), and no significant difference was found when any kind of T‐cell specific antibody induction was compared with no induction (312/730 (43%) versus 328/694 (47%); RR 0.90, 95% CI 0.76 to 1.06). Trial sequential analysis showed that trial sequential monitoring boundaries were not crossed by the cumulative Z‐curve, and the required information size of 3509 participants was not obtained.
1.5. Analysis.
Comparison 1 T‐cell antibody induction vs placebo/no intervention, Outcome 5 Infection.
Cytomegalovirus infection
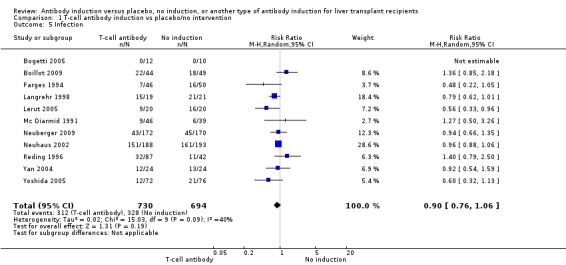
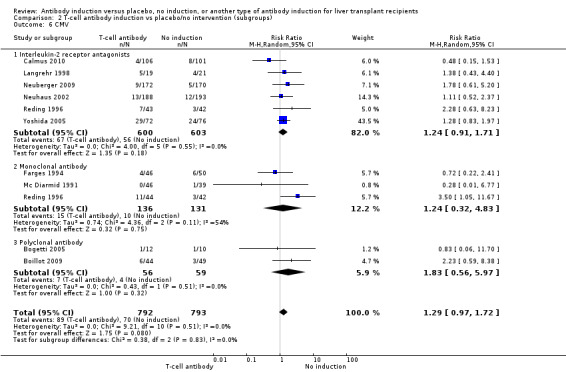
Cytomegalovirus infection was reported in 10 trials with a total of 1543 participants (Analysis 1.6); no significant difference was found when any kind of T‐cell specific antibody induction was compared with no induction (89/792 (11%) versus 67/751 (9%); RR 1.24, 95% CI 0.93 to 1.67). Trial sequential analysis showed that trial sequential monitoring boundaries were not crossed by the cumulative Z‐curve, and the required information size of 7214 participants was not obtained.
1.6. Analysis.
Comparison 1 T‐cell antibody induction vs placebo/no intervention, Outcome 6 CMV.
Hepatitis C recurrence
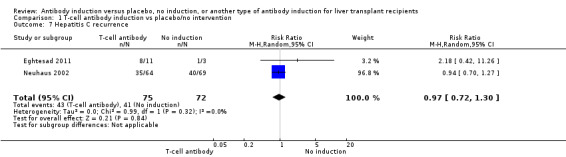
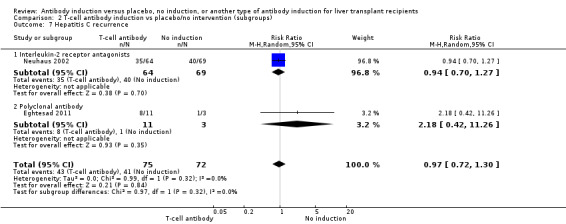
Hepatitis C recurrence was reported in two trials with 147 participants (Analysis 1.7), and no significant difference was found in the number of participants diagnosed with hepatitis C virus recurrence when any kind of T‐cell specific antibody induction was compared with no induction (43/75 (57%) versus 41/72 (57%); RR 0.97, 95% CI 0.72 to 1.30). Trial sequential analysis showed that trial sequential monitoring boundaries were not crossed by the cumulative Z‐curve, and the required information size of 604 participants was not obtained.
1.7. Analysis.
Comparison 1 T‐cell antibody induction vs placebo/no intervention, Outcome 7 Hepatitis C recurrence.
Cancer
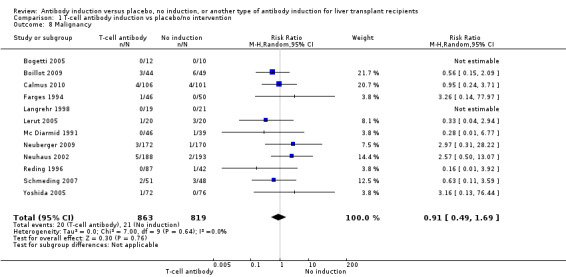
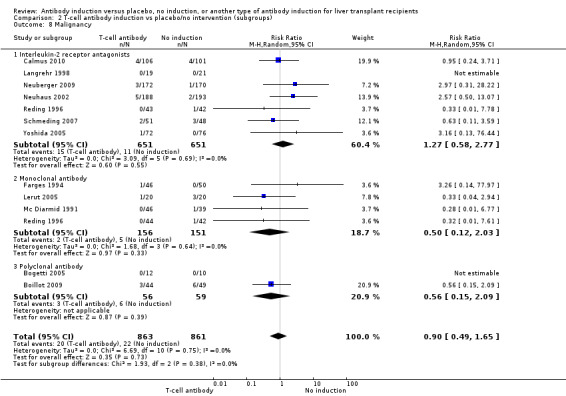
Cancer was reported in 12 trials with 1682 participants (Analysis 1.8), and no significant difference was found in the number of participants diagnosed with cancer when T‐cell specific antibody induction was compared with no induction (20/863 (2%) versus 21/819 (3%); RR 0.91, 95% CI 0.49 to 1.69). Trial sequential analysis showed that trial sequential monitoring boundaries were not crossed by the cumulative Z‐curve, and the required information size of 22,911 participants was not obtained.
1.8. Analysis.
Comparison 1 T‐cell antibody induction vs placebo/no intervention, Outcome 8 Malignancy.
Post‐transplant lymphoproliferative disorder
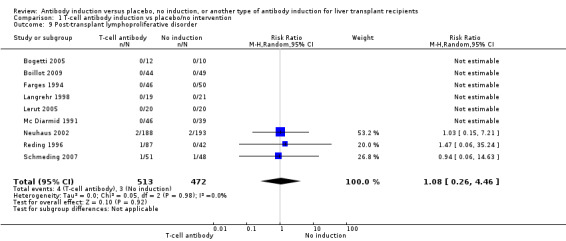
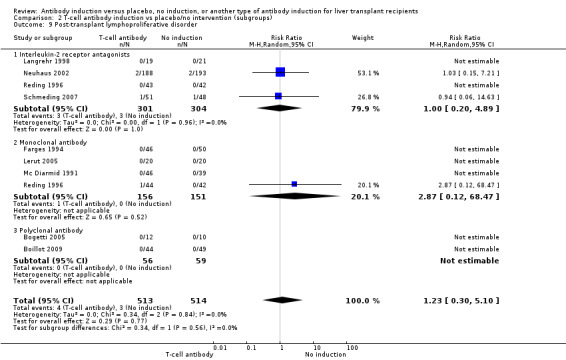
Post‐transplant lymphoproliferative disorder was reported in nine trials with 985 participants (Analysis 1.9), and no significant difference was found in the number of participants diagnosed with post‐transplant lymphoproliferative disorder when any kind of T‐cell specific antibody induction was compared with no induction (4/513 (1%) versus 3/472 (1%); RR 1.08, 95% CI 0.26 to 4.46). Trial sequential analysis showed that trial sequential monitoring boundaries were not crossed by the cumulative Z‐curve, and the required information size of 70,005 participants was not obtained.
1.9. Analysis.
Comparison 1 T‐cell antibody induction vs placebo/no intervention, Outcome 9 Post‐transplant lymphoproliferative disorder.
Kidney function
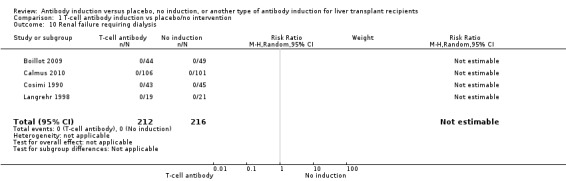
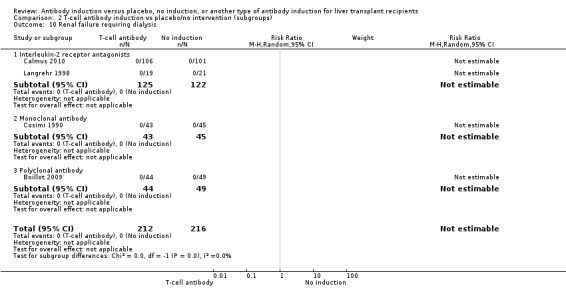
Kidney failure requiring long‐term haemodialysis was reported in four trials with a total of 428 participants (Analysis 1.10), and in none of the groups any of the participants needed long‐term haemodialysis (0/212 (0%) versus 0/216 (0%)).
1.10. Analysis.
Comparison 1 T‐cell antibody induction vs placebo/no intervention, Outcome 10 Renal failure requiring dialysis.
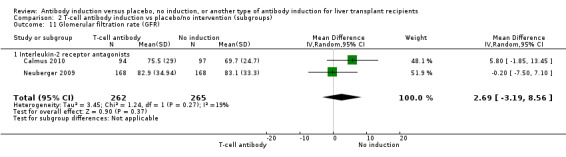
Estimated glomerular filtration rate (GFR) was adequately reported in two trials with 527 participants. In both trials, GFR was calculated by the Cockcroft‐Gault formula (Analysis 1.11), and no difference in glomerular filtration rate was found between the groups (MD 2.69 mL/min, 95% CI ‐3.19 to 8.56). In both of these trials, delayed start of calcineurin inhibitor was applied in the induction arm of the trial.
1.11. Analysis.
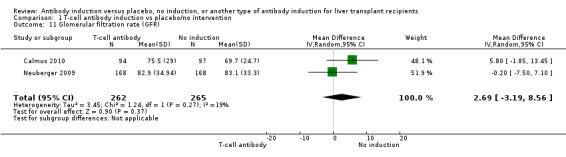
Comparison 1 T‐cell antibody induction vs placebo/no intervention, Outcome 11 Glomerular filtration rate (GFR).
Serum creatinine (µmol/L) was reported in seven trials with a total of 881 participants (Analysis 1.12), and serum creatinine was statistically significant higher when T‐cell specific antibody induction was compared with no induction (MD 3.77 µmol/L, 95% CI 0.33 to 7.21).
1.12. Analysis.
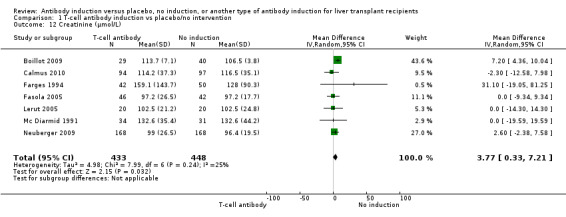
Comparison 1 T‐cell antibody induction vs placebo/no intervention, Outcome 12 Creatinine (µmol/L).
Hyperlipidaemia
Hyperlipidaemia was reported in two trials with 549 participants (Analysis 1.13), and no significant difference was found in the number of participants diagnosed with hyperlipidaemia when any kind of T‐cell specific antibody induction was compared with no induction (25/278 (9%) versus 24/271 (9%); RR 1.00, 95% CI 0.59 to 1.69). Trial sequential analysis showed that trial sequential monitoring boundaries were not crossed by the cumulative Z‐curve, and the required information size of 7214 participants was not obtained.
1.13. Analysis.
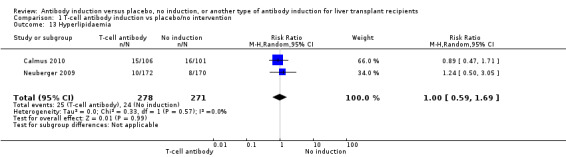
Comparison 1 T‐cell antibody induction vs placebo/no intervention, Outcome 13 Hyperlipidaemia.
Diabetes mellitus
Diabetes mellitus was reported in four trials with 741 participants (Analysis 1.14), and no significant difference was found in the number of participants diagnosed with new‐onset diabetes mellitus when any kind of T‐cell specific antibody induction was compared with no induction (94/373 (25%) versus 103/368 (28%); RR 0.91, 95% CI 0.72 to 1.14). Trial sequential analysis showed that trial sequential monitoring boundaries were not crossed by the cumulative Z‐curve, and the required information size of 1888 participants was not obtained.
1.14. Analysis.
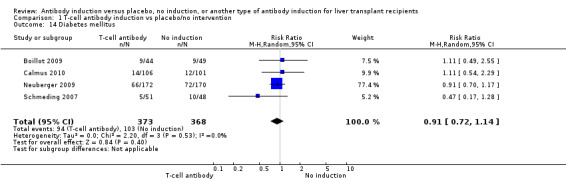
Comparison 1 T‐cell antibody induction vs placebo/no intervention, Outcome 14 Diabetes mellitus.
Hypertension
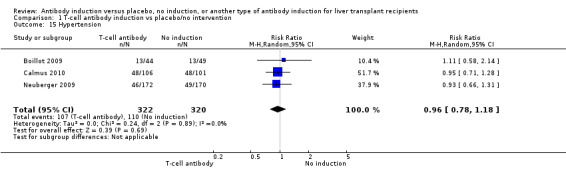
Hypertension was reported in three trials with 642 participants (Analysis 1.15), and no significant difference was found in the number of participants treated for hypertension when any kind of T‐cell specific antibody induction was compared with no induction (107/322 (33%) versus 110/320 (34%); RR 0.96, 95% CI 0.78 to 1.18). Trial sequential analysis showed that trial sequential monitoring boundaries were not crossed by the cumulative Z‐curve, and the required information size of 1442 participants was not obtained.
1.15. Analysis.
Comparison 1 T‐cell antibody induction vs placebo/no intervention, Outcome 15 Hypertension.
Interleukin‐2 receptor antagonist versus no induction
Ten trials with a total of 1454 allocated participants compared interleukin‐2 receptor antagonist induction versus no T‐cell specific antibody induction (Otto 1996; Reding 1996; Langrehr 1998; Neuhaus 2002; Yan 2004; Fasola 2005; Yoshida 2005; Schmeding 2007; Neuberger 2009; Calmus 2010)
Mortality
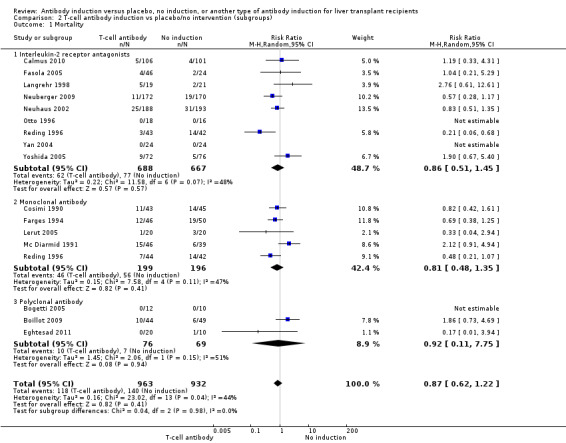
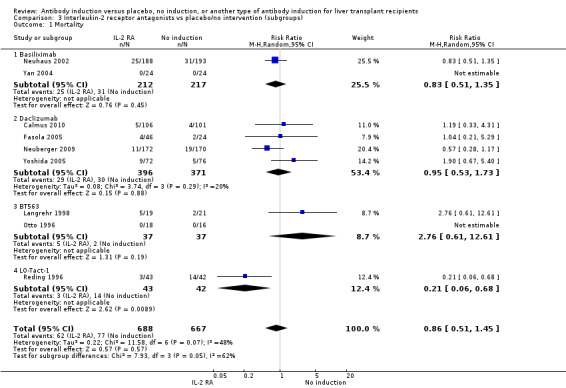
Mortality was reported in nine trials with a total of 1355 participants (Analysis 2.1), and overall, no significant difference in mortality was found when interleukin‐2 receptor antagonist induction was compared with no induction (62/688 (9%) versus 77/667 (12%); RR 0.86, 95% CI 0.51 to 1.45). Trial sequential analysis showed that trial sequential monitoring boundaries were not crossed by the cumulative Z‐curve, and the required information size of 15,844 participants was not obtained.
2.1. Analysis.
Comparison 2 T‐cell antibody induction vs placebo/no intervention (subgroups), Outcome 1 Mortality.
Graft loss including death
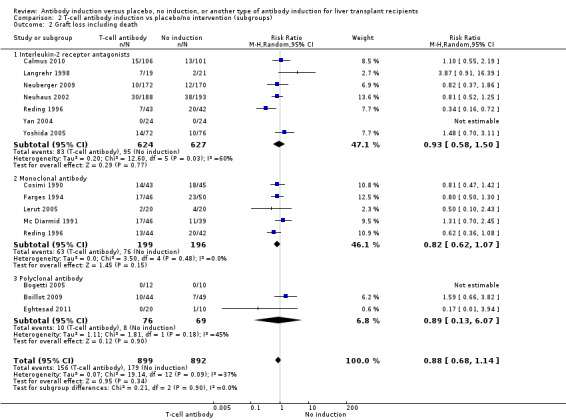
Graft loss was reported in seven trials with a total of 1251 participants (Analysis 2.2), and overall no significant difference in graft loss was found when interleukin‐2 receptor antagonist induction was compared with no induction (83/624 (13%) versus 95/627 (15%); RR 0.93, 95% CI 0.58 to 1.50). Trial sequential analysis showed that trial sequential monitoring boundaries were not crossed by the cumulative Z‐curve, and the required information size of 11,091 participants was not obtained.
2.2. Analysis.
Comparison 2 T‐cell antibody induction vs placebo/no intervention (subgroups), Outcome 2 Graft loss including death.
Acute rejection
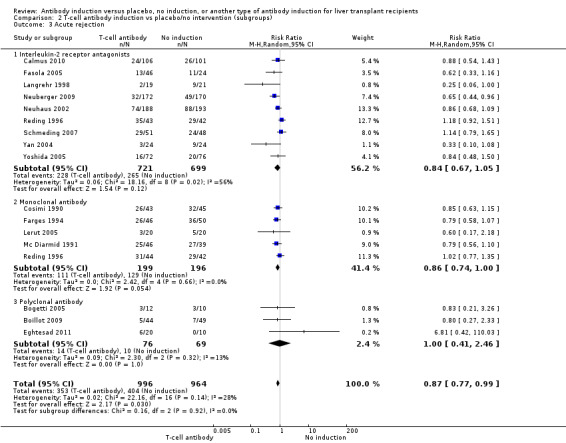
Acute rejection, defined as the number of participants who experienced at least one episode of rejection, was reported in nine trials with a total of 1420 participants (Analysis 2.3), and acute rejection was not significantly different in participants treated with interleukin‐2 receptor antagonist induction compared with no induction (228/721 (32%) versus 265/699 (38%); RR 0.84, 95% CI 0.67 to 1.05) when the random‐effects model was applied. However when the fixed‐effect model was used, acute rejection was significantly less frequent in participants treated with interleukin‐2 receptor antagonist induction compared with no induction (RR 0.83, 95% CI 0.73 to 0.96). Trial sequential analysis showed that trial sequential monitoring boundaries were not crossed by the cumulative Z‐curve, and the required information size of 3626 participants for acute rejection was not obtained.
2.3. Analysis.
Comparison 2 T‐cell antibody induction vs placebo/no intervention (subgroups), Outcome 3 Acute rejection.
Quality of life
None of the ten trials reported on quality of life.
Adverse events
Four of the trials with a total of 970 participants reported on the total number of participants experiencing any drug‐associated adverse event, and overall no significant difference was found between interleukin‐2 receptor antagonist induction compared with no induction (448/485 (92%) versus 458/485 (94%); RR 0.97, 95% CI 0.92 to 1.03) (Analysis 2.4) when the random‐effects model was applied. However, when the fixed‐effect model was used, adverse events were significantly less frequent among participants treated with interleukin‐2 receptor antagonist induction compared with no induction (RR 0.97, 95% CI 0.95 to 0.99). However, definitions of drug‐associated adverse events varied widely between trials. Hence, in early trials, in almost none of the participants were adverse events reported, but in more recent trials, adverse events were reported for almost every participant.
2.4. Analysis.
Comparison 2 T‐cell antibody induction vs placebo/no intervention (subgroups), Outcome 4 Adverse events.
Infection
Infection, defined as the number of participants who experienced at least one episode of infection, was reported in six trials with a total of 1044 participants (Analysis 2.5), and no significant difference in infection was found when interleukin‐2 receptor antagonist induction was compared with no induction (247/518 (48%) versus 272/526 (52%); RR 0.94, 95% CI 0.86 to 1.02). Trial sequential analysis showed that the required information size of 723 participants was obtained. Furthermore, the monitoring boundary (area of futility) was crossed before the required information size was reached, hence we can reject a 20% intervention effect regarding infection.
2.5. Analysis.
Comparison 2 T‐cell antibody induction vs placebo/no intervention (subgroups), Outcome 5 Infection.
Cytomegalovirus infection
Cytomegalovirus infection was reported in six trials with a total of 1203 participants (Analysis 2.6), and no significant difference in cytomegalovirus infection was found when interleukin‐2 receptor antagonist induction was compared with no induction (67/600 (11%) versus 56/603 (9%); RR 1.24, 95% CI 0.91 to 1.71). Trial sequential analysis showed that trial sequential monitoring boundaries were not crossed by the cumulative Z‐curve, and the required information size of 7701 participants was not obtained.
2.6. Analysis.
Comparison 2 T‐cell antibody induction vs placebo/no intervention (subgroups), Outcome 6 CMV.
Hepatitis C recurrence
Hepatitis C recurrence was reported in one trial with 133 participants transplanted for hepatitis C virus infection (Analysis 2.7), and no significant difference was found in the number of participants diagnosed with hepatitis C virus recurrence when interleukin‐2 receptor antagonist induction was compared with no induction (35/64 (55%) versus 40/69 (58%); RR 0.94, 95% CI 0.70 to 1.27). This was confirmed when Fisher's exact test was applied (P value 0.72).Trial sequential analysis showed that trial sequential monitoring boundaries were not crossed by the cumulative Z‐curve, and the required information size of 1291 participants was not obtained.
2.7. Analysis.
Comparison 2 T‐cell antibody induction vs placebo/no intervention (subgroups), Outcome 7 Hepatitis C recurrence.
Cancer
Cancer was reported in seven trials with 1302 participants (Analysis 2.8), and no significant difference was found in the number of participants diagnosed with cancer when interleukin‐2 receptor antagonist induction was compared with no induction (15/651 (2%) versus 11/651 (2%); RR 1.27, 95% CI 0.58 to 2.77). Trial sequential analysis showed that trial sequential monitoring boundaries were not crossed by the cumulative Z‐curve, and the required information size of 34,685 participants was not obtained.
2.8. Analysis.
Comparison 2 T‐cell antibody induction vs placebo/no intervention (subgroups), Outcome 8 Malignancy.
Post‐transplant lymphoproliferative disorder
Post‐transplant lymphoproliferative disorder was reported in four trials with 605 participants (Analysis 2.9), and no significant difference was found in the number of participants diagnosed with post‐transplant lymphoproliferative disorder when interleukin‐2 receptor antagonist induction was compared with no induction (3/301 (1%) versus 3/304 (1%); RR 1.00, 95% CI 0.20 to 4.89). Trial sequential analysis showed that trial sequential monitoring boundaries were not crossed by the cumulative Z‐curve, and the required information size of 70,005 participants was not obtained.
2.9. Analysis.
Comparison 2 T‐cell antibody induction vs placebo/no intervention (subgroups), Outcome 9 Post‐transplant lymphoproliferative disorder.
Kidney function
Renal failure requiring long‐term dialysis was reported in two trials with a total of 247 participants, and no participants suffered from renal failure requiring long‐term dialysis in either the interleukin‐2 receptor antagonist induction group or the 'no induction' group (0/125 (0%) versus 0/122 (0%) (Analysis 2.10).
2.10. Analysis.
Comparison 2 T‐cell antibody induction vs placebo/no intervention (subgroups), Outcome 10 Renal failure requiring dialysis.
Estimated glomerular filtration rate (GFR) was reported adequately in two trials with 527 participants. In both trials, GFR was calculated by the Cockcroft‐Gault formula (Analysis 2.11), and no difference in glomerular filtration rate was found between the groups (MD 2.69 mL/min, 95% CI ‐3.19 to 8.56). In both of these trials, delayed start of calcineurin inhibitor was applied in the induction arm of the trial.
2.11. Analysis.
Comparison 2 T‐cell antibody induction vs placebo/no intervention (subgroups), Outcome 11 Glomerular filtration rate (GFR).
Serum creatinine (µmol/L) was reported in three trials with a total of 615 participants (Analysis 2.12), and no statistically significant difference in serum creatinine was found when interleukin‐2 receptor antagonist induction was compared with no induction (MD 1.36 µmol/L, 95% CI ‐2.68 to 5.40).
2.12. Analysis.
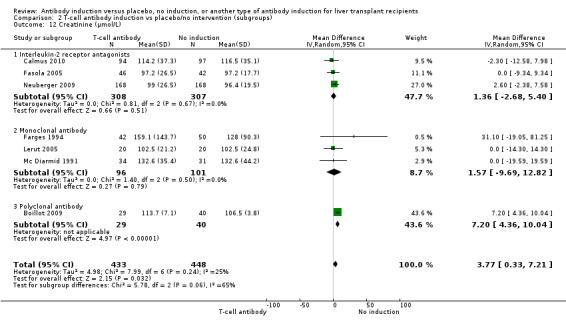
Comparison 2 T‐cell antibody induction vs placebo/no intervention (subgroups), Outcome 12 Creatinine (µmol/L).
Hyperlipidaemia
Post‐transplant hyperlipidaemia was reported in two trials with 549 participants (Analysis 2.13), and no significant difference was found in the number of participants diagnosed with hyperlipidaemia when interleukin‐2 receptor antagonist induction was compared with no induction (25/278 (9%) versus 24/271 (9%); RR 1.00, 95% CI 0.59 to 1.69). Trial sequential analysis showed that trial sequential monitoring boundaries were not crossed by the cumulative Z‐curve, and the required information size of 7214 participants was not obtained.
2.13. Analysis.

Comparison 2 T‐cell antibody induction vs placebo/no intervention (subgroups), Outcome 13 Hyperlipidaemia.
Diabetes mellitus
Diabetes mellitus was reported in three trials with 648 participants (Analysis 2.14), and no significant difference was found in the number of participants diagnosed with new‐onset diabetes mellitus when interleukin‐2 receptor antagonist induction was compared with no induction (85/329 (26%) versus 94/319 (29%); RR 0.89, 95% CI 0.71 to 1.13). Trial sequential analysis showed that trial sequential monitoring boundaries were not crossed by the cumulative Z‐curve, and the required information size of 1801 participants was not obtained.
2.14. Analysis.
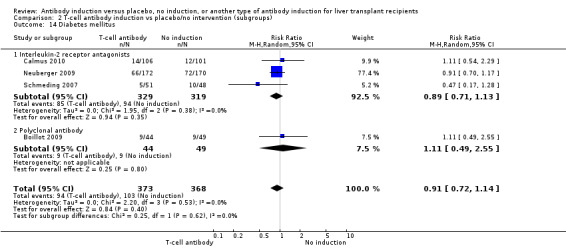
Comparison 2 T‐cell antibody induction vs placebo/no intervention (subgroups), Outcome 14 Diabetes mellitus.
Hypertension
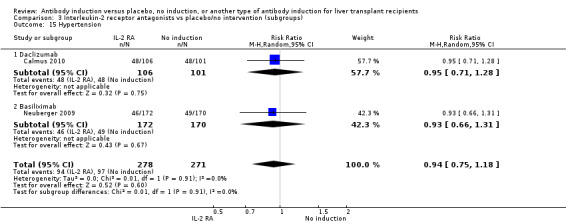
Hypertension was reported in two trials with 549 participants (Analysis 2.15), and no significant difference was found in the number of participants treated for hypertension when interleukin‐2 receptor antagonist induction was compared with no induction (94/278 (34%) versus 97/271 (36%); RR 0.94, 95% CI 0.75 to 1.18). Trial sequential analysis showed that trial sequential monitoring boundaries were not crossed by the cumulative Z‐curve, and the required information size of 1327 participants was not obtained.
2.15. Analysis.
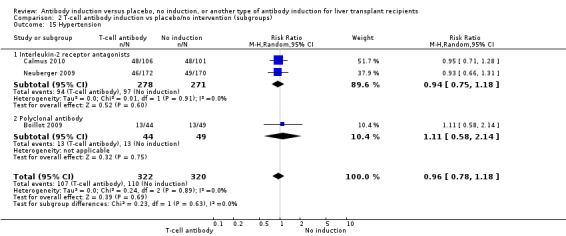
Comparison 2 T‐cell antibody induction vs placebo/no intervention (subgroups), Outcome 15 Hypertension.
Subgroup analyses
We performed subgroup analyses on the type of interleukin‐2 receptor antagonist applied (i.e., BT563, daclizumab, or basiliximab) when compared with no induction( Analysis 3.1‐ Analysis 3.15). Tests for subgroup differences between the different types of interleukin‐2 receptor antagonists when compared with placebo were not statistically significantly different for all outcomes, except for the outcome 'graft loss including death,' for which a statistically significant difference was found (P value 0.009). This difference between type of interleukin‐2 receptor antagonist applied is caused by the interleukin‐2 receptor antagonist LO‐Tact‐1, which caused significantly less graft loss compared with placebo in a single trial (RR 0.34, 95% CI 0.16 to 0.72).
3.1. Analysis.
Comparison 3 Interleukin‐2 receptor antagonists vs placebo/no intervention (subgroups), Outcome 1 Mortality.
3.15. Analysis.
Comparison 3 Interleukin‐2 receptor antagonists vs placebo/no intervention (subgroups), Outcome 15 Hypertension.
Monoclonal T‐cell specific antibody induction versus no induction
Five trials with a total of 398 allocated participants compared monoclonal T‐cell specific antibody induction versus no T‐cell specific antibody induction (Cosimi 1990; Mc Diarmid 1991; Farges 1994; Reding 1996; Lerut 2005). Four trials studied muromonab‐CD3 (358 participants) (Cosimi 1990; Mc Diarmid 1991; Farges 1994; Reding 1996), and one trial studied anti‐CD2 (40 participants) (Lerut 2005).
Mortality
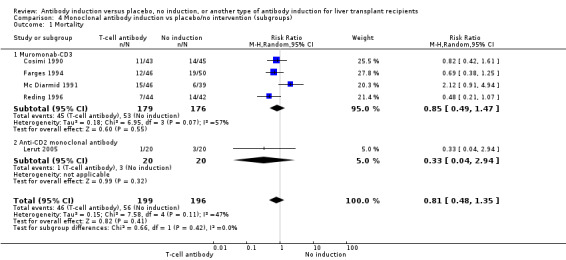
Mortality was reported in five trials with a total of 395 participants (Analysis 4.1), and no significant difference in mortality was found when monoclonal T‐cell specific antibody induction was compared with no induction (46/199 (23%) versus 56/196 (29%); RR 0.81, 95% CI 0.48 to 1.35) Trial sequential analysis showed that trial sequential monitoring boundaries were not crossed by the cumulative Z‐curve, and the required information size of 4632 participants was not obtained.
4.1. Analysis.
Comparison 4 Monoclonal antibody induction vs placebo/no intervention (subgroups), Outcome 1 Mortality.
Graft loss including death
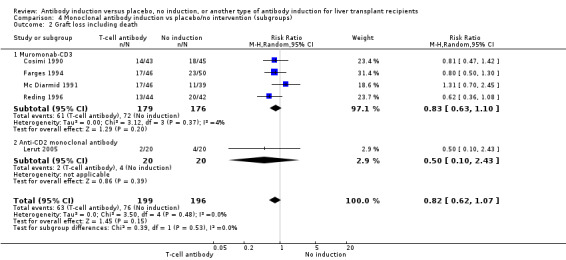
Graft loss was reported in five trials with a total of 395 participants (Analysis 4.2), and overall, no significant difference in graft loss was found when monoclonal T‐cell specific antibody induction was compared with no induction (63/199 (32%) versus 76/196 (39%); RR 0.82, 95% CI 0.62 to 1.07). Trial sequential analysis showed that trial sequential monitoring boundaries were not crossed by the cumulative Z‐curve, and the required information size of 1224 participants was not obtained.
4.2. Analysis.
Comparison 4 Monoclonal antibody induction vs placebo/no intervention (subgroups), Outcome 2 Graft loss including death.
Acute rejection
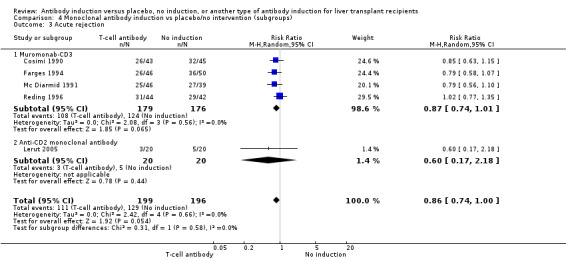
Acute rejection, defined as the number of participants who experienced at least one episode of rejection, was reported in five trials with a total of 395 participants (Analysis 4.3), and acute rejection was not statistically significantly different in participants treated with monoclonal T‐cell specific antibody induction compared with no induction (111/199 (56%) versus 129/196 (66%); RR 0.86, 95% CI 0.74 to 1.00). Trial sequential analysis showed that trial sequential monitoring boundaries were not crossed by the cumulative Z‐curve, and the required information size of 766 participants for acute rejection was not obtained.
4.3. Analysis.
Comparison 4 Monoclonal antibody induction vs placebo/no intervention (subgroups), Outcome 3 Acute rejection.
Quality of life
None of the trials reported on quality of life.
Adverse events
Three of the trials with a total of 236 participants (Analysis 4.4) reported on the total number of participants experiencing any drug‐associated adverse event, and overall no significant difference was found when monoclonal T‐cell specific antibody induction was compared with no induction (2/114 (2%) versus 0/122 (0%); RR 5.38, 95% CI 0.27 to 106.98).
4.4. Analysis.
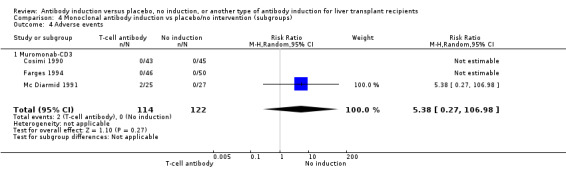
Comparison 4 Monoclonal antibody induction vs placebo/no intervention (subgroups), Outcome 4 Adverse events.
Infection
Infection, defined as the number of participants who experienced at least one episode of infection, was reported in four trials with a total of 306 participants (Analysis 4.5), and no significant difference was found when monoclonal T‐cell specific antibody induction was compared with no intervention (43/156 (28%) versus 49/151 (32%); RR 0.84, 95% CI 0.46 to 1.53). Trial sequential analysis showed that trial sequential monitoring boundaries were not crossed by the cumulative Z‐curve, and the required information size of 4702 participants was not obtained.
4.5. Analysis.
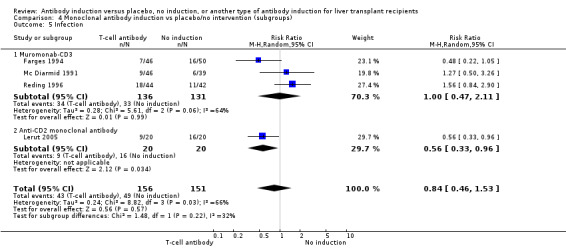
Comparison 4 Monoclonal antibody induction vs placebo/no intervention (subgroups), Outcome 5 Infection.
Cytomegalovirus infection
Cytomegalovirus infection was reported in three trials with a total of 267 participants (Analysis 4.6), and no significant difference was found when monoclonal T‐cell specific antibody induction was compared with no induction (15/136 (11%) versus 10/131 (8%); RR 1.24, 95% CI 0.32 to 4.83). Trial sequential analysis showed that trial sequential monitoring boundaries were not crossed by the cumulative Z‐curve, and the required information size of 22,654 participants was not obtained.
4.6. Analysis.
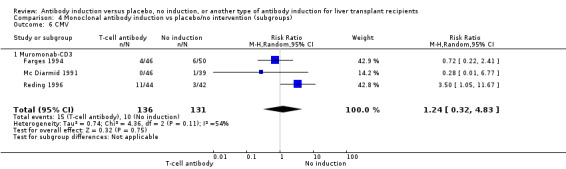
Comparison 4 Monoclonal antibody induction vs placebo/no intervention (subgroups), Outcome 6 CMV.
Hepatitis C recurrence
None of the trials reported on hepatitis C recurrence among participants transplanted for hepatitis C.
Cancer
Cancer was reported in four trials with 307 participants (Analysis 4.7), and no significant difference was found in the number of participants diagnosed with cancer when monoclonal T‐cell specific antibody induction was compared with no induction (2/156 (1%) versus 5/151 (3%); RR 0.50, 95% CI 0.12 to 2.03). Trial sequential analysis showed that trial sequential monitoring boundaries were not crossed by the cumulative Z‐curve, and the required information size of 22,911 participants was not obtained.
4.7. Analysis.
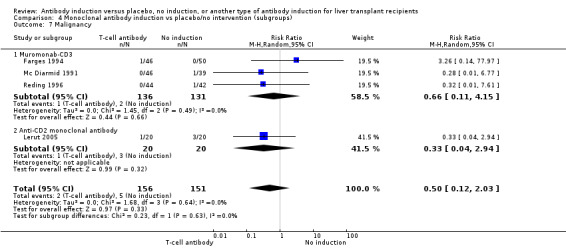
Comparison 4 Monoclonal antibody induction vs placebo/no intervention (subgroups), Outcome 7 Malignancy.
Post‐transplant lymphoproliferative disorder
Post‐transplant lymphoproliferative disorder was reported in four trials with 307 participants (Analysis 4.8), and no significant difference was found in the number of participants diagnosed with post‐transplant lymphoproliferative disorder when monoclonal T‐cell specific antibody induction was compared with no induction (1/156 (1%) versus 0/151 (0%); RR 2.87, 95% CI 0.12 to 68.47). Trial sequential analysis showed that trial sequential monitoring boundaries were not crossed by the cumulative Z‐curve, and the required information size of 70,005 participants was not obtained.
4.8. Analysis.
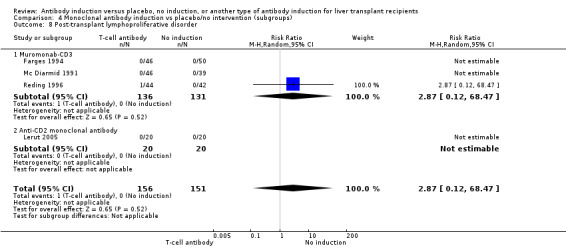
Comparison 4 Monoclonal antibody induction vs placebo/no intervention (subgroups), Outcome 8 Post‐transplant lymphoproliferative disorder.
Kidney function
Renal failure requiring long‐term dialysis was reported in one trial with 88 participants, and no participants suffered from renal failure requiring long‐term dialysis in the monoclonal T‐cell specific antibody induction group or the 'no induction' group (0/43 (0%) versus 0/45 (0%)) (Analysis 4.10).
4.10. Analysis.
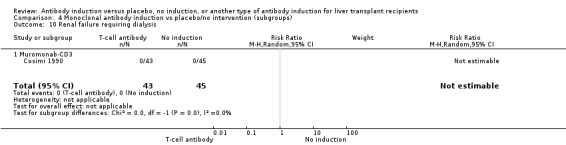
Comparison 4 Monoclonal antibody induction vs placebo/no intervention (subgroups), Outcome 10 Renal failure requiring dialysis.
None of the trials reported on glomerular filtration rate (GFR).
Serum creatinine (µmol/L) was reported in three trials with a total of 197 participants (Analysis 4.9), and no statistically significant difference in serum creatinine was found when monoclonal T‐cell specific antibody induction was compared with no induction (MD 1.57 µmol/L, 95% CI ‐9.69 to 12.82).
4.9. Analysis.
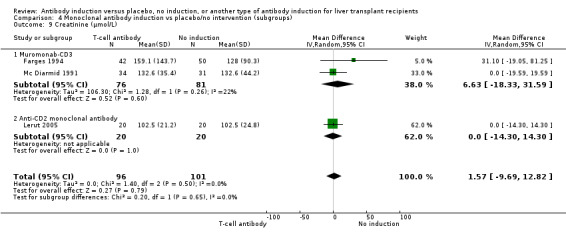
Comparison 4 Monoclonal antibody induction vs placebo/no intervention (subgroups), Outcome 9 Creatinine (µmol/L).
Hyperlipidaemia, diabetes mellitus, and hypertension
None of the trials reported on post‐transplant hyperlipidaemia, diabetes mellitus, or hypertension.
Subgroup analyses
We performed subgroup analyses on the type of monoclonal antibody applied (i.e., muromonab‐CD3, anti‐CD2) when compared with no induction (Analysis 4.1 to Analysis 4.10). For all outcomes, tests for subgroup differences between the different types of monoclonal antibodies when compared with placebo were not statistically significant (P value > 0.05).
Polyclonal T‐cell specific antibody induction versus no induction
Three trials with 145 allocated participants compared polyclonal T‐cell specific antibody induction versus no antibody induction, and in all three trials, the polyclonal T‐cell specific antibody studied was rabbit antithymocyte globulin (Bogetti 2005; Boillot 2009; Eghtesad 2011).
Mortality
Mortality was reported in all three trials with a total of 145 participants (Analysis 2.1), and overall no significant difference in mortality was found when polyclonal T‐cell specific antibody induction was compared with no induction (10/76 (13%) versus 7/69 (10%); RR 0.92, 95% CI 0.11 to 7.75). Trial sequential analysis showed that trial sequential monitoring boundaries were not crossed by the cumulative Z‐curve, and the required information size of 6429 participants was not obtained.
Graft loss including death
Graft loss was reported in all three trials with a total of 145 participants (Analysis 2.2), and overall no significant difference in graft loss was found when polyclonal T‐cell specific antibody induction was compared with no induction (10/76 (13%) versus 8/69 (12%); RR 0.89, 95% CI 0.13 to 6.07). Trial sequential analysis showed that trial sequential monitoring boundaries were not crossed by the cumulative Z‐curve, and the required information size of 5251 participants was not obtained.
Acute rejection
Acute rejection, defined as the number of participants who experienced at least one episode of rejection, was reported in three trials with a total of 145 participants (Analysis 2.3), and acute rejection was not statistically significantly different in participants treated with polyclonal T‐cell specific antibody induction compared with no induction (14/76 (18%) versus 10/69 (14%); RR 1.00, 95% CI 0.41 to 2.46). Trial sequential analysis showed that trial sequential monitoring boundaries were not crossed by the cumulative Z‐curve, and the required information size of 4410 participants was not obtained.
Quality of life
None of the three trials reported on quality of life.
Adverse events
One of the trials reported that no other drug‐associated adverse events had occurred in any of the treatment groups (Analysis 2.4).
Infection
Infection, defined as the number of participants who experienced at least one episode of infection, was reported in two trials with a total of 115 participants (Analysis 2.5), and no significant difference was found when polyclonal antibody was compared with no induction (22/56 (39%) versus 18/59 (31%); RR 1.36, 95% CI 0.85 to 2.18). Trial sequential analysis showed that trial sequential monitoring boundaries were not crossed by the cumulative Z‐curve, and the required information size of 1643 participants was not obtained.
Cytomegalovirus infection
Cytomegalovirus infection was reported in two trials with a total of 115 participants (Analysis 2.6), and no significant difference was found when polyclonal T‐cell specific antibody induction was compared with no induction (7/56 (13%) versus 4/59 (7%); RR 1.83, 95% CI 0.56 to 5.97). Trial sequential analysis showed that trial sequential monitoring boundaries were not crossed by the cumulative Z‐curve, and the required information size of 9466 participants was not obtained.
Hepatitis C recurrence
Hepatitis C recurrence was reported in one trial with 14 participants transplanted for hepatitis C virus infection (Analysis 2.7), and no significant difference was found in the number of participants diagnosed with hepatitis C virus recurrence when polyclonal T‐cell specific antibody induction was compared with no induction (8/11 (73%) versus 1/3 (33%); RR 2.18, 95% CI 0.42 to 11.26). This was confirmed when Fisher's exact test was applied (P value 0.51). Trial sequential analysis showed that trial sequential monitoring boundaries were not crossed by the cumulative Z‐curve, and the required information size of 2733 participants was not obtained.
Cancer
Cancer was reported in two trials with 115 participants (Analysis 2.8), and no significant difference was found in the number of participants diagnosed with cancer when polyclonal T‐cell specific antibody induction was compared with no induction (3/56 (5%) versus 6/59 (10%); RR 0.56, 95% CI 0.15 to 2.09). Trial sequential analysis showed that trial sequential monitoring boundaries were not crossed by the cumulative Z‐curve, and the required information size of 6429 participants was not obtained.
Post‐transplant lymphoproliferative disorder
Post‐transplant lymphoproliferative disorder was reported in two trials with 115 participants (Analysis 2.9), and no participants were diagnosed with post‐transplant lymphoproliferative disorder in either the 'polyclonal T‐cell specific antibody induction' group or the 'no induction' group (0/56 (0%) versus 0/59 (0%)).
Kidney function
Renal failure requiring long‐term dialysis was reported in one trial with 93 participants, and no participants suffered from renal failure requiring long‐term dialysis in either the polyclonal T‐cell specific antibody induction group or the 'no induction' group (0/44 (0%) versus 0/49 (0%)) (Analysis 2.10).
None of the trials reported on glomerular filtration rate.
Serum creatinine (µmol/L) was reported in one trial with 69 participants (Analysis 2.12), and serum creatinine was statistically significant higher when polyclonal T‐cell specific antibody induction was compared with no induction (MD 7.20 µmol/L, 95% CI 4.36 to 10.04).
Hyperlipidaemia
None of the trials reported on hyperlipidaemia.
Diabetes mellitus
Diabetes mellitus was reported in one trial with 93 participants (Analysis 2.14), and no significant difference was found in the number of participants diagnosed with new‐onset diabetes mellitus when polyclonal T‐cell specific antibody induction was compared with no induction (9/44 (20%) versus 9/49 (18%); RR 0.91, 95% CI 0.72 to 1.14). This was confirmed when Fisher's exact test was applied (P value 1). Trial sequential analysis showed that trial sequential monitoring boundaries were not crossed by the cumulative Z‐curve, and the required information size of 4313 participants was not obtained.
Hypertension
Hypertension was reported in one trial with 93 participants (Analysis 2.15), and no significant difference was found in the number of participants treated for hypertension when polyclonal T‐cell specific antibody induction was compared with no induction (13/44 (30%) versus 13/49 (27%); RR 1.11, 95% CI 0.58 to 2.14). This was confirmed when Fisher's exact test was applied (P value 0.82). Trial sequential analysis showed that trial sequential monitoring boundaries were not crossed by the cumulative Z‐curve, and the required information size of 2909 participants was not obtained.
Subgroup analyses
We planned to perform subgroup analyses on the type of polyclonal T‐cell antibody applied (i.e., antilymphocyte globulin compared to antithymocyte globulin, and rabbit antithymocyte globulin compared to horse antithymocyte globulin) when compared with no induction. We were not able to perform these analyses, as rabbit antithymocyte globulin was the interventional drug in all trials.
Interleukin‐2 receptor antagonist versus monoclonal T‐cell specific antibody induction
One comparison in one trial with 87 allocated participants compared interleukin‐2 receptor antagonists versus muromonab‐CD3 (Reding 1996).
Mortality
Mortality was reported (Analysis 7.1), and no significant difference in mortality was found when interleukin‐2 receptor antagonist induction was compared with muromonab‐CD3 induction (3/43 (7%) versus 9/44 (20%); RR 0.34, 95% CI 0.10 to 1.18). This was confirmed when Fisher's exact test was applied (P value 0.11). Trial sequential analysis showed that trial sequential monitoring boundaries were not crossed by the cumulative Z‐curve, and the required information size of 2897 participants was not obtained,
7.1. Analysis.
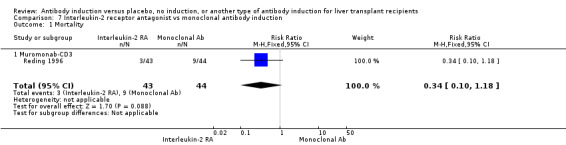
Comparison 7 Interleukin‐2 receptor antagonist vs monoclonal antibody induction, Outcome 1 Mortality.
Graft loss including death
Graft loss was reported (Analysis 7.2), and overall no significant difference in graft loss was found when interleukin‐2 receptor antagonist induction was compared with muromonab‐CD3 induction (7/43 (16%) versus 12/44 (27%); RR 0.60, 95% CI 0.26 to 1.37). This was confirmed when Fisher's exact test was applied (P value 0.30). Trial sequential analysis showed that trial sequential monitoring boundaries were not crossed by the cumulative Z‐curve, and the required information size of 1981 participants was not obtained,
7.2. Analysis.
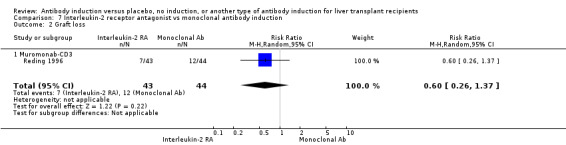
Comparison 7 Interleukin‐2 receptor antagonist vs monoclonal antibody induction, Outcome 2 Graft loss.
Acute rejection
Acute rejection, defined as the number of participants who experienced at least one episode of rejection, was reported (Analysis 7.3), and overall no significant difference in acute rejection was found when interleukin‐2 receptor antagonist induction was compared with muromonab‐CD3 induction (35/43 (81%) versus 31/44 (70%); RR 1.16, 95% CI 0.91 to 1.47). This was confirmed when Fisher's exact test was applied (P value 0.31).Trial sequential analysis showed that trial sequential monitoring boundaries were not crossed by the cumulative Z‐curve, and the required information size of 1644 participants for acute rejection was not obtained.
7.3. Analysis.
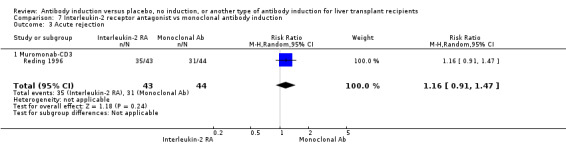
Comparison 7 Interleukin‐2 receptor antagonist vs monoclonal antibody induction, Outcome 3 Acute rejection.
Quality of life
The trial did not report on quality of life.
Adverse events
The trial did not report on the total number of participants experiencing any drug‐associated adverse event.
Infection
Infection, defined as the number of participants who experienced at least one episode of infection, was reported (Analysis 7.4), and no significant difference was found between participants treated with interleukin‐2 receptor antagonist induction and muromonab‐CD3 induction (14/43 (33%) versus 18/44 (41%); RR 0.80, 95% CI 0.46 to 1.39). This was confirmed when Fisher's exact test was applied (P value 0.51). Trial sequential analysis showed that trial sequential monitoring boundaries were not crossed by the cumulative Z‐curve, and the required information size of 1509 participants for acute rejection was not obtained.
7.4. Analysis.
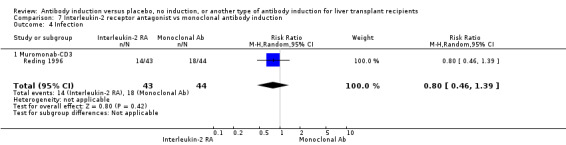
Comparison 7 Interleukin‐2 receptor antagonist vs monoclonal antibody induction, Outcome 4 Infection.
Cytomegalovirus infection
Cytomegalovirus infection was reported (Analysis 7.5), and no significant difference was found when participants treated with interleukin‐2 receptor antagonist induction were compared with those treated with muromonab‐CD3 induction (7/43 (16%) versus 11/44 (25%); RR 0.65, 95% CI 0.28 to 1.52). This was confirmed when Fisher's exact test was applied (P value 0.43). Trial sequential analysis showed that trial sequential monitoring boundaries were not crossed by the cumulative Z‐curve, and the required information size of 2190 participants was not obtained.
7.5. Analysis.
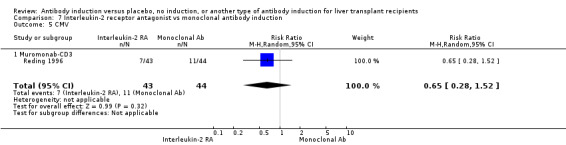
Comparison 7 Interleukin‐2 receptor antagonist vs monoclonal antibody induction, Outcome 5 CMV.
Hepatitis C recurrence
The only included trial did not report on hepatitis C recurrence.
Cancer
Cancer was reported (Analysis 7.6), and no participants in either the interleukin‐2 receptor antagonist group or the monoclonal T‐cell specific antibody induction group were diagnosed with cancer (0/43 (0%) versus 0/44 (0%)).
7.6. Analysis.
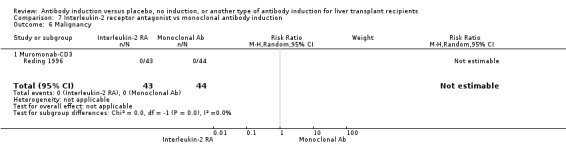
Comparison 7 Interleukin‐2 receptor antagonist vs monoclonal antibody induction, Outcome 6 Malignancy.
Post‐transplant lymphoproliferative disorder
Post‐transplant lymphoproliferative disorder was reported (Analysis 7.7), and no significant difference was found in the number of participants diagnosed with post‐transplantation lymphoproliferative disorder when interleukin‐2 receptor antagonist induction was compared with muromonab‐CD3 induction (1/43 (2%) versus 1/44 (2%); RR 1.02, 95% CI 0.07 to 15.84). This was confirmed when Fisher's exact test was applied (P value 1).
7.7. Analysis.
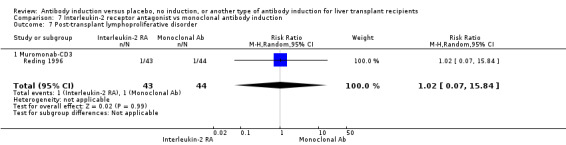
Comparison 7 Interleukin‐2 receptor antagonist vs monoclonal antibody induction, Outcome 7 Post‐transplant lymphoproliferative disorder.
Kidney function, hyperlipidaemia, diabetes mellitus, and hypertension
The only included trial did not report on kidney function, hyperlipidaemia, diabetes mellitus, and hypertension.
Subgroup analyses
As only one trial compared interleukin‐2 antagonists versus monoclonal T‐cell specific antibody induction, no subgroup analyses were performed.
Interleukin‐2 receptor antagonist versus polyclonal T‐cell specific antibody induction
Two trials with a total of 112 allocated participants compared interleukin‐2 receptor antagonists versus polyclonal T‐cell specific antibody induction (Nashan 1996; Langrehr 1997). Both trials compared the interleukin‐2 receptor antagonist BT563 versus the polyclonal antibody rabbit antithymocyte globulin (Nashan 1996; Langrehr 1997)
Mortality
Mortality was reported in both trials with a total of 112 participants (Analysis 8.1), and overall no significant difference in mortality was found when interleukin‐2 receptor antagonist induction was compared with polyclonal T‐cell specific antibody induction (7/55 (13%) versus 6/57 (11%); RR 1.22, 95% CI 0.44 to 3.38). Trial sequential analysis showed that trial sequential monitoring boundaries were not crossed by the cumulative Z‐curve, and the required information size of 5787 participants was not obtained.
8.1. Analysis.

Comparison 8 Interleukin‐2 receptor antagonist vs polyclonal T‐cell specific antibody induction, Outcome 1 Mortality.
Graft loss including death
Graft loss was reported in two trials with a total of 112 participants (Analysis 8.2), and overall no significant difference in graft loss was found when interleukin‐2 receptor antagonist induction was compared with polyclonal T‐cell specific antibody induction (9/55 (16%) versus 8/57 (14%); RR 1.18, 95% CI 0.50 to 2.80). Trial sequential analysis showed that trial sequential monitoring boundaries were not crossed by the cumulative Z‐curve, and the required information size of 4410 participants was not obtained.
8.2. Analysis.
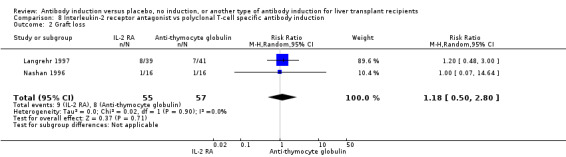
Comparison 8 Interleukin‐2 receptor antagonist vs polyclonal T‐cell specific antibody induction, Outcome 2 Graft loss.
Acute rejection
Acute rejection, defined as the number of participants who experienced at least one episode of rejection, was reported in two trials with a total of 112 participants (Analysis 8.3), and acute rejection was not significantly different in participants treated with interleukin‐2 receptor antagonist induction compared with polyclonal T‐cell specific antibody induction (8/55 (15%) versus 24/57 (42%); RR 0.35, 95% CI 0.11 to 1.10) when the random‐effects model was applied. However, when the fixed‐effect model was applied, acute rejection was significantly less frequent among participants treated with interleukin‐2 receptor antagonist induction compared with polyclonal T‐cell specific antibody induction (RR 0.36, 95% CI 0.18 to 0.71). Trial sequential analysis showed that trial sequential monitoring boundaries were not crossed by the cumulative Z‐curve, and the required information size of 2197 participants for acute rejection was not obtained.
8.3. Analysis.
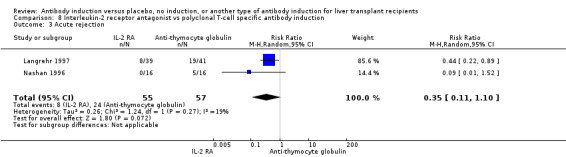
Comparison 8 Interleukin‐2 receptor antagonist vs polyclonal T‐cell specific antibody induction, Outcome 3 Acute rejection.
Quality of life
None of the trials reported on quality of life.
Adverse events
One of the trials with a total of 80 participants reported on the number of participants affected by at least one drug‐associated adverse event (Analysis 8.4). Adverse events were less frequent among participants treated with interleukin‐2 receptor antagonist induction compared with polyclonal T‐cell specific antibody induction (4/39 (10%) versus 18/41 (44%); RR 0.23, 95% CI 0.09 to 0.63). This was confirmed when Fisher's exact test was applied (P value < 0.001). These adverse events included hypertension, tachyarrhythmia, fever, leukopenia, bronchospasms, and diarrhoea, but they were not specified by treatment group. Severe side effects necessitating cessation of T‐cell specific antibody induction were not observed. Trial sequential analysis showed that trial sequential monitoring boundaries were not crossed by the cumulative Z‐curve, and the required information size of 970 participants for adverse events was not obtained.
8.4. Analysis.
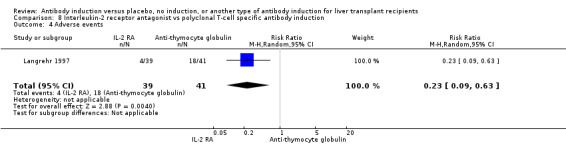
Comparison 8 Interleukin‐2 receptor antagonist vs polyclonal T‐cell specific antibody induction, Outcome 4 Adverse events.
Infection
Infection, defined as the number of participants who experienced at least one episode of infection, was reported in two trials with a total of 112 participants (Analysis 8.5) and no differences in infection occurred among participants treated with interleukin‐2 receptor antagonist induction compared with polyclonal T‐cell specific antibody induction (25/55 (45%) versus 36/57 (53%); RR 0.56, 95% CI 0.15 to 2.08) when the random‐effects model was applied. However, when the fixed‐effect model was used, infection occurred significantly less frequent in participants treated with interleukin‐2 receptor antagonist induction compared with polyclonal antibody induction (RR 0.73, 95% CI 0.53 to 0.99). Trial sequential analysis showed that trial sequential monitoring boundaries were not crossed by the cumulative Z‐curve, and the required information size of 7324 participants was not obtained.
8.5. Analysis.
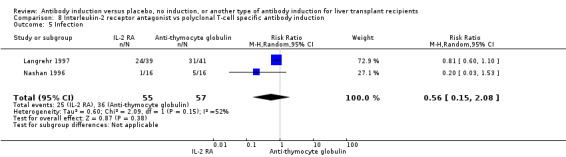
Comparison 8 Interleukin‐2 receptor antagonist vs polyclonal T‐cell specific antibody induction, Outcome 5 Infection.
Cytomegalovirus infection
Cytomegalovirus infection was reported in both trials with a total of 112 participants (Analysis 8.6), and no significant difference was found between participants treated with interleukin‐2 receptor antagonist induction and those treated with polyclonal T‐cell specific antibody induction (9/55 (16%) versus 12/57 (21%); RR 0.82, 95% CI 0.39 to 1.71). Trial sequential analysis showed that trial sequential monitoring boundaries were not crossed by the cumulative Z‐curve, and the required information size of 2729 participants was not obtained.
8.6. Analysis.
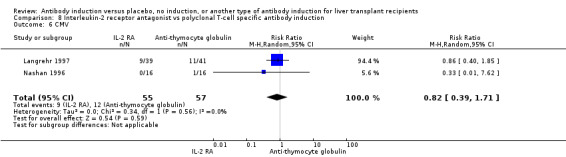
Comparison 8 Interleukin‐2 receptor antagonist vs polyclonal T‐cell specific antibody induction, Outcome 6 CMV.
Hepatitis C recurrence
None of the trials reported on hepatitis C recurrence in participants transplanted for hepatitis C.
Cancer
Cancer was reported in both trials with 112 participants (Analysis 8.7), and no participants in either the interleukin‐2 receptor antagonist group or the polyclonal T‐cell specific antibody induction group were diagnosed with cancer (0/55 (0%) versus 0/57 (0%)).
8.7. Analysis.
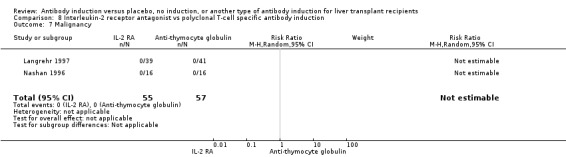
Comparison 8 Interleukin‐2 receptor antagonist vs polyclonal T‐cell specific antibody induction, Outcome 7 Malignancy.
Post‐transplant lymphoproliferative disorder
Post‐transplant lymphoproliferative disorder was reported in both trials with a total of 112 participants (Analysis 8.8), and no significant difference was found when interleukin‐2 receptor antagonist induction was compared with polyclonal T‐cell specific antibody induction (1/55 (2%) versus 0/57 (0%); RR 3.15, 95% CI 0.13 to 75.08). Trial sequential analysis showed that trial sequential monitoring boundaries were not crossed by the cumulative Z‐curve, and the required information size of 54,322 participants was not obtained.
8.8. Analysis.
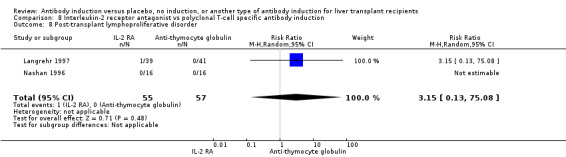
Comparison 8 Interleukin‐2 receptor antagonist vs polyclonal T‐cell specific antibody induction, Outcome 8 Post‐transplant lymphoproliferative disorder.
Kidney function
Renal failure requiring long‐term dialysis was reported in one trial with 80 participants, and no participants suffered from renal failure requiring long‐term dialysis when interleukin‐2 receptor antagonist induction was compared with polyclonal T‐cell specific antibody induction (0/39 (0%) versus 0/41 (0%) (Analysis 8.9).
8.9. Analysis.

Comparison 8 Interleukin‐2 receptor antagonist vs polyclonal T‐cell specific antibody induction, Outcome 9 Renal failure requiring dialysis.
Neither of the two trials reported on glomerular filtration rate or serum creatinine.
Hyperlipidaemia, diabetes mellitus, and hypertension
Neither of the trials reported on hyperlipidaemia, diabetes mellitus, or hypertension.
Subgroup analyses
As both trials studied the interleukin‐2 receptor antagonist BT563 and the polyclonal antibody rabbit antithymocyte globulin, no subgroup analyses were performed.
Zero event trial correction
Trials with zero events in both intervention groups were found in several of the analyses. For all of these analyses, a random‐effects meta‐analysis with empirical continuity correction of 0.01 was applied (Thorlund 2011a). This correction of zero‐event trials resulted in none of the analyses yielding statistically significantly different results (i.e., all statistically significant differences in results between the groups remained statistically significantly different after zero‐event trial correction, and all non–statistically significant differences in results between the groups remained non–statistically significantly different after zero‐event trial correction).
Subgroup analyses
As reported above, we performed subgroup analyses on the type of interleukin‐2 receptor antagonist and monoclonal antibody applied.
We performed subgroup analyses for trials with early initiation of calcineurin inhibitor versus delayed initiation of calcineurin inhibitor when any kind of T‐cell specific antibody induction was compared with no T‐cell specific antibody induction. No statistically significant subgroup differences (P value < 0.05) were found for any of the outcomes (Analysis 6.1 through Analysis 6.15) when trials with early initiation of calcineurin inhibitors were compared with trials with delayed initiation of calcineurin inhibitors.
6.1. Analysis.
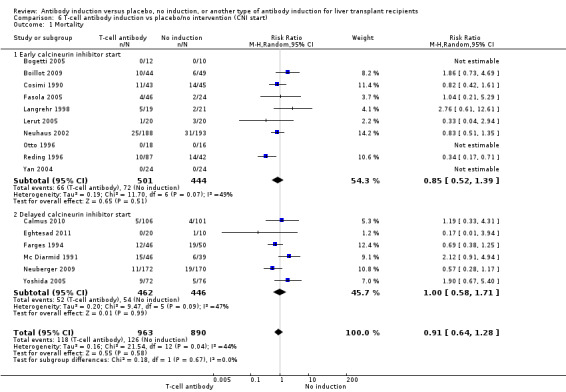
Comparison 6 T‐cell antibody induction vs placebo/no intervention (CNI start), Outcome 1 Mortality.
6.15. Analysis.
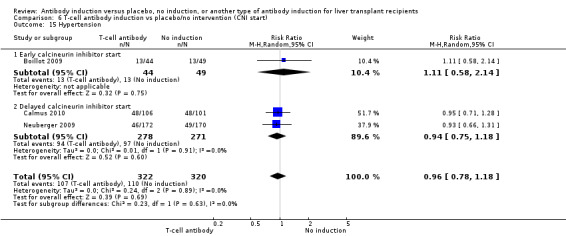
Comparison 6 T‐cell antibody induction vs placebo/no intervention (CNI start), Outcome 15 Hypertension.
We were not able to perform our predefined subgroup analysis on adult versus paediatric participants, as none of the trials reported specifically on results for paediatric participants.
We were not able to perform our predefined subgroup analysis on trials with low risk of bias compared with trials with high risk of bias, as none of the trials included in the review was with 'low risk of bias.'
We performed subgroup analyses for trials with exclusively hepatitis C–positive recipients compared with trials that included participants transplanted for various indications. No statistically significant subgroup differences (P value < 0.05) were found for any of the outcomes (Analysis 5.1 through Analysis 5.14) between trials with hepatitis C–positive recipients and trials that included participants transplanted for other indications when interleukin‐2 receptor antagonist induction was compared with no induction.
5.1. Analysis.
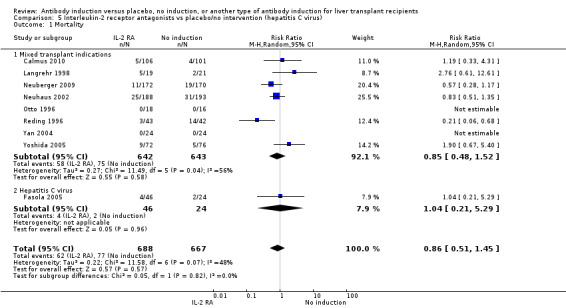
Comparison 5 Interleukin‐2 receptor antagonists vs placebo/no intervention (hepatitis C virus), Outcome 1 Mortality.
5.14. Analysis.
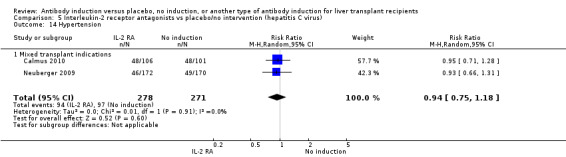
Comparison 5 Interleukin‐2 receptor antagonists vs placebo/no intervention (hepatitis C virus), Outcome 14 Hypertension.
Adverse events reported in non‐randomised studies
Our search was designed to identify randomised clinical trials. However, the search also included a lot of references on quasi‐ or non‐randomised studies. In these studies, we have searched for adverse events which were different in nature or number from the adverse events reported in the randomised clinical trials included in the meta‐analysis.
We did not find information on adverse events in the non‐randomised studies which were different in nature or number, and have now reported this in the review.
Discussion
Summary of main results
We identified 19 randomised trials including 16 two‐arm trials and three three‐arm trials for a total of 25 comparisons and 2067 participants assessing the effects of different types of T‐cell antibody induction for liver transplant recipients. All trials had high risk of bias. Our meta‐analysis assessed mortality, graft loss including death, acute rejection, quality of life, adverse events, infection, cytomegalovirus infection, hepatitis C virus recurrence, malignancy, post‐transplantation lymphoproliferative disease, renal failure requiring dialysis, glomerular filtration rate, serum creatinine, hyperlipidaemia, diabetes mellitus, and hypertension. We compared any kind of T‐cell specific antibody induction versus no induction, interleukin‐2 receptor antagonists versus no induction, monoclonal antibody versus no induction, polyclonal antibody versus no induction, interleukin‐2 receptor antagonists versus monoclonal T‐cell specific antibody induction, and interleukin‐2 receptor antagonists versus polyclonal T‐cell specific antibody induction.
Overall, acute rejection seemed to be reduced when any kind of T‐cell antibody induction was compared with no induction, and trial sequential analysis showed that the cumulative Z‐score crossed the monitoring boundary for benefit before the required information size was reached. Acute rejection seemed also to be reduced when interleukin‐2 receptor antagonists were compared with no induction when the fixed‐effect model, but not the random‐effects model, was applied. Furthermore, serum creatinine was statistically significantly higher when T‐cell specific antibody induction was compared with no induction, as well as when polyclonal T‐cell specific antibody induction was compared with no induction, but this difference appeared not to be clinically relevant.
When interleukin‐2 receptor antagonists were compared with polyclonal T‐cell specific antibody induction, adverse events were less common among participants treated with interleukin‐2 receptor antagonists, but trial sequential analysis could not exclude random errors. Also infection was less common in the interleukin‐2 receptor antagonist group when the fixed‐effect model, but not the random‐effects model, was applied.
We found no statistically significant differences regarding the other outcomes in any of the analyses. Thus, we have no evidence for an increase or decrease in risk of mortality, infection, cytomegalovirus infection, hepatitis C virus recurrence, malignancy, or post‐transplantation lymphoproliferative disease associated with the use of T‐cell specific antibody induction. Further, trial sequential analysis showed that we could reject a 20% relative risk
reduction in malignancy when T‐cell specific antibody induction was compared with no induction.
Overall completeness and applicability of evidence
This systematic review examined the evidence from 19 included randomised clinical trials including 16 two‐arm trials and three three‐arm trials for the use of T‐cell specific antibody induction compared with placebo, no induction, or another type of T‐cell specific antibody induction in liver transplant recipients. We could not obtain data regarding all of our predefined outcomes, as the identified trials did not report on all of them.
Almost all trials reported on mortality, graft loss, and acute rejection. Most trials reported on infection, cytomegalovirus infection, malignancy, and post‐transplant lymphoproliferative disorder. None of the trials reported on quality of life, and only a few trials reported on renal failure and function, with few and conflicting results. Limited data were available on drug‐specific adverse events such as cytokine release syndrome for muromonab‐CD3 and haematological adverse events for antithymocyte globulin.
Not all currently available types of T‐cell specific antibody induction have been studied in randomised clinical trials. Alemtuzumab for induction after liver transplantation has been introduced during the past decade, and it is now used in approximately 2% of all liver transplant recipients (OPTN 2009). However, we could identify no evidence from randomised clinical trials regarding alemtuzumab. Furthermore, the use of antithymocyte globulin for induction after liver transplantation has been six‐doubled during the past decade, although few randomised clinical trials have been conducted to study antithymocyte globulin in liver transplantation.
Quality of the evidence
Our review findings and interpretations suffer from serious limitations ensuing from the quality and quantity of the the randomised clinical trials included in our review. The number of trials that could be included under the different review comparisons was small; in addition few of these trials provided data on the outcomes of interest. This, in turn, leads to imprecision of our results that is to be observed in the wide confidence intervals around the estimate of effect. In addition, not all participants included in the randomised clinical trials could be considered true representatives of the general patient population. Only a few trials included participants who received an organ from a living or 'donation after cardiac' (DCD) donor, and none of these trials reported separately on outcomes for these participants. Data from paediatric participants were also very limited. Furthermore, donor age and recipient age have increased over the past decade.
Follow‐up in the included randomised clinical trials was between three months and five years. Thus, we have no evidence on the long‐term (longer than five years) benefits and harms of T‐cell specific antibody induction by outcome. Long‐term effects would be relevant in particular for outcomes like mortality, graft loss, infection, hepatitis C virus recurrence, and cancer.
We explored the presence of statistical heterogeneity by using the Chi2 test and measured the quantity of heterogeneity using the I² test (Higgins 2002). The Chi2 test has low power in the situation of a meta‐analysis when trials have small sample sizes or are few in number, as in this review. This means that although a statistically significant result may indicate a problem with heterogeneity, a non‐significant result must not be taken as evidence of homogeneity. To reflect our concern with heterogeneity, we performed both fixed‐effect and random‐effects model meta‐analyses. We reported both models when differences were found. Indeed, unlike the random‐effects model meta‐analysis, our review showed some significant results when the fixed‐effect model was applied.
Risk of bias is known to impact the estimated intervention effect, with trials with high risk of bias tending to overestimate beneficial intervention effects while underestimating harmful intervention effects (Schulz 1995; Moher 1998; Kjaergard 2001; Wood 2008; Lundh 2012; Savović 2012; Savović 2012a). Of the 19 included trials, four trials (21%) reported adequate generation of the allocation sequence, five (26%) reported adequate allocation concealment, two (11%) were blinded, one (5%) was blinded to the pathologist who examined the liver biopsies for rejection, 17 (89%) adequately addressed incomplete outcome data, 18 (95%) reported on reasonably expected outcome measures, and 14 (74%) appeared to be free of other components that could put the trial at risk of bias. Thus, all trials were considered with high risk of bias. Therefore, the estimated intervention effect may possibly be due to systematic errors.
Potential biases in the review process
We conducted the review according to the recommendations provided in the Cochrane Handbook for Systematic Reviews of Interventions (Higgins 2011).
We followed our peer‐reviewed and prepublished protocol with predefined participants, interventions, comparisons, and outcomes to avoid biases during the review preparation; we performed a comprehensive and extensive literature search to identify published and unpublished studies, followed our prespecified inclusion and exclusion criteria, and conducted the meta‐analysis using available data or based on intention‐to‐treat when possible.
Our review meta‐analysis includes more trials than are included in other meta‐analyses on this topic (Wang 2010; Goralczyk 2011), thus decreasing possible bias in the available evidence. We could have missed unpublished reports of small studies or of studies with negative results. However, this bias is difficult to avoid.
In addition, we conducted trial sequential analysis (Wetterslev 2008; CTU 2011; Thorlund 2011a), which deals with the risk of random error, found especially among data coming from small trials, as this is also the case in our review (Wetterslev 2008).
Agreements and disagreements with other studies or reviews
Data from the United Network for Organ Sharing database which includes nearly 17,000 adult liver transplant recipients from January 2002 through December 2007, showed no difference in patient and graft survival and serum creatinine when patients who had received antithymocyte globulin alone, antithymocyte globulin combined with corticosteroids, daclizumab alone, or corticosteroids alone were assessed (Uemura 2011). Among hepatitis C–infected recipients, both graft survival and participant survival were significantly decreased among those who had received antithymocyte globulin combined with corticosteroids compared with daclizumab alone and corticosteroids alone (Uemura 2011). Given the observational nature of the data, these findings should be interpreted with caution, because they are not adjusted for age, centre, or other potentially confounding factors. This increase in mortality and graft loss found in the registry (Uemura 2011) could not be confirmed in our meta‐analysis, although only a few randomised trials with small numbers of participants studying antithymocyte globulin have been performed.
Our search strategy also retrieved studies that were excluded after the publication had been read in full (Characteristics of excluded studies). These studies were randomised clinical trials that investigated T‐cell specific antibody induction versus corticosteroid induction. The trial comparison has, however, been assessed in another review (Penninga 2014). In the latter review, we observed no clear benefits or harms associated with the use of T‐cell specific antibody induction compared with corticosteroid induction, apart from the fact that T‐cell specific antibody induction, which seemed to reduce diabetes mellitus, also seemed to reduce cytomegalovirus infection when compared with corticosteroid induction (Penninga 2014). For some of the analyses, the number of trials investigating the use of T‐cell specific antibody induction versus corticosteroid induction after liver transplantation was small, and participant numbers and outcomes were limited. Furthermore, the included trials were heterogeneous in nature and had applied different T‐cell specific antibodies. Moreover, all trials were with high risk of bias. Hence, we concluded that more randomised clinical trials are needed to assess the benefits and harms of T‐cell specific antibody induction compared with corticosteroid induction for liver transplant recipients.
We assessed trials on antibody induction versus corticosteroid induction for harmful effects associated with the use of T‐cell specific antibody induction. In these trials, we found no evidence for any apparent adverse events that were different in incidence or nature from those reported in the randomised trials included in the present review.
Two non‐Cochrane meta‐analyses on interleukin‐2 receptor antagonist therapy for liver transplant recipients have been published so far (Wang 2010; Goralczyk 2011). However, they did not assess the harms and benefits of all types of antibodies that are or have been used in liver transplant recipients, as we did in the present systematic review. The meta‐analysis of Goralczyk 2011 also contains non‐randomised studies on interleukin‐2 receptor antagonists, and this increases the risk of biased results. Furthermore, both meta‐analyses analysed studies using concomitant immunosuppression that was different in the trial groups (Wang 2010; Goralczyk 2011). This makes it difficult to assess the effects of T‐cell specific antibody induction therapy on outcomes. This is why our review attempted to assess the benefits and harms of T‐cell specific antibody induction compared with placebo, no induction or another in liver transplant recipients receiving similar maintenance immunosuppression. Furthermore, we assessed both risk of bias (systematic errors) and risk of random errors (play of chance) in the randomised clinical trials that we identified. This makes it difficult to assess the effects of T‐cell specific antibody induction therapy on outcomes. Overall, the meta‐analysis of Goralczyk 2011 found a decrease in acute rejection and diabetes mellitus in participants receiving interleukin‐2 receptor antagonists, although no difference in mortality and graft loss was observed, and investigators found better renal function in trials that applied delayed start of calcineurin inhibitor in the interleukin‐2 receptor antagonist arm of the trial. Wang 2010 found a decrease in acute rejection episodes and diabetes mellitus at one year after transplantation for daclizumab, but not for basiliximab (Wang 2010). In accordance with these meta‐analyses, we found no difference in mortality, graft survival, or other outcomes associated with the use of interleukin‐2 receptor antagonists. We also found a significant decrease in acute rejection when T‐cell specific antibody induction was compared with no induction. The improvement in renal function associated with a delayed start of calcineurin inhibitor could not be confirmed in our review.
Traditionally, immunosuppressive treatment for liver transplantation has gained much experience from knowledge regarding renal transplantation. A Cochrane review including 71 studies with a total of 10,537 participants has been performed to study the use of interleukin‐2 receptor antagonists in kidney transplant recipients (Webster 2010). In this Cochrane review, interleukin‐2 receptor antagonists compared with placebo reduced graft loss including death with a functioning graft by 25% at six months and one year, but not beyond these time points (Webster 2010). Furthermore, in kidney transplant recipients, interleukin‐2 receptor antagonists compared with placebo reduced biopsy‐proven acute rejection (RR 0.75, 95% CI 0.58 to 0.98) and cytomegalovirus disease (RR 0.81, 95% CI 0.68 to 0.97) (Webster 2010). When IL‐2 RAs were compared with antithymocyte globulin in kidney transplant recipients, biopsy‐proven acute rejection at one year was increased in the interleukin‐2 receptor antagonist group by 30%, but malignancies (RR 0.25, 95% CI 0.07 to 0.87) and cytomegalovirus disease (RR 0.68, 95% CI 0.50 to 0.97) were reduced when interleukin‐2 receptor antagonists were compared with antithymocyte globulin (Webster 2010). Hence, the benefits of interleukin‐2 receptor antagonist induction observed in renal transplant recipients were not found or were not that convincing in liver transplant recipients. This might be due to the limited numbers of participants and events, systematic errors, and design errors. Furthermore, it might be explained by organ specific differences: The incidence and impact of acute rejection in liver transplant recipients are lower than in renal transplant recipients, and this might be reflected in limited benefits of T‐cell specific antibody induction.
A Cochrane review studied the use of T‐cell specific antibody induction in heart transplant recipients and included 22 randomised trials with a total of 1427 participants (Penninga 2013a). We found that interleukin‐2 receptor antagonists may reduce acute rejection when compared with placebo but may increase acute rejection when compared with antithymocyte globulin (Penninga 2013a). Furthermore, among heart transplant recipients, no significant differences were found regarding mortality, infection, and malignancy. All included randomised clinical trials were with high risk of bias (Penninga 2013a).
A Cochrane review studied the use of antibodies against T‐cells in lung transplant recipients including six trials with a total of 278 participants (Penninga 2013). In this Cochrane review, we found no clear benefits or harms for lung transplant recipients associated with the use of T‐cell specific antibody induction compared with 'no induction,' or when one type of T‐cell specific antibody was compared with another type of antibody (Penninga 2013).
Overall, possible advantages of the use of T‐cell antibody induction regarding acute rejection, as found in other solid organ transplant recipients, were also found in liver transplant recipients in this review (Webster 2010; Penninga 2013a). However, in both reviews risks of bias could not be excluded.
Authors' conclusions
Implications for practice.
Given the low and moderate quality of the evidence, the effects of T‐cell antibody induction remain uncertain. Our systematic review showed no clear beneficial or harmful effects associated with the use of T‐cell specific antibody induction compared with no induction regarding mortality, graft loss, infection, cytomegalovirus infection, hepatitis C virus recurrence, post‐transplantation lymphoproliferative disease, cancer, hyperlipidaemia, diabetes mellitus, and hypertension. Acute rejection may be reduced with T‐cell specific antibody induction, and trial sequential analysis showed that the trial sequential monitoring boundary for benefit was crossed by the cumulative Z‐curve before the required information size was reached. For some of the analyses, the number of trials investigating the use of T‐cell specific antibody induction after liver transplantation is small, and the numbers of participants and outcomes in these randomised trials are limited.
Implications for research.
Given the results of our analysis, it appears that appropriately sized randomised clinical trials comparing T‐cell antibodies versus placebo in liver transplant participants using contemporarily adjunctive immunosuppression and calcineurin inhibitor sparing regimens are warranted. These trials should study intervention with basiliximab (currently the only interleukin‐2 receptor antagonist commercially available), antithymocyte globulin, or alemtuzumab. Such trials ought to be conducted with low risks of systematic error (bias) and low risk of random error (play of chance), and should follow the 'SPIRIT' guidelines (SPIRIT 2013; SPIRIT 2013a) and 'CONSORT' guidelines. (www.consort‐statement.org).
What's new
| Date | Event | Description |
|---|---|---|
| 9 July 2014 | Amended | A spelling mistake in the name of the peer reviewer, Maheswaran Pitchaimuthu, is now corrected. |
Notes
The second version of the published protocol was an update, but we decided, that the review title had to be split and two new protocols had to be prepared: "Antibody induction versus placebo, no induction, or another type of antibody induction for liver transplant recipients" and "Antibody induction versus corticosteroid induction for liver transplant recipients". Both protocols are published in Issue 11 of 2012 of The Cochrane Library (Penninga 2012a; Penninga 2014). The reason for doing this was to increase the focus and readability of the reviews.
Acknowledgements
We would like to thank Dimitrinka Nikolova and Sarah L. Klingenberg from The Cochrane Hepato‐Biliary Group editorial office for their support.
Review peer reviewers: Jane Lindschou, Denmark; Maheswaran Pitchaimuthu, UK. Contact editor: Frederik Keus, The Netherlands.
Appendices
Appendix 1. Search strategies
| Database | Time span | Search strategy |
| The Cochrane Hepato‐Biliary Group Controlled Trials Register | Until September 2013 | (liver OR hepatic) AND (transplant* OR graft*) AND ('monoclonal antibod*' OR antithymocyt* OR thymocyt* OR ATG OR atgam OR thymoglobulin OR 'thymus anti*' OR muromonab OR OKT3 OR orthoclone OR basiliximab OR simulect OR daclizumab OR daclizimab OR dacluzumab OR daclizumab OR zenapax OR alemtuzumab OR campath) |
| Cochrane Central Register of Controlled Trials (CENTRAL), part of The Cochrane Library | Latest issue | #1 MeSH descriptor Liver Transplantation explode all trees #2 (liver or hepatic) and (transplant* or graft*) #3 (#1 OR #2) #4 MeSH descriptor Antibodies, Monoclonal explode all trees #5 MeSH descriptor Antilymphocyte Serum explode all trees #6 monoclonal antibod* or antithymocyt* or thymocyt* or ATG or atgam or thymoglobulin or thymus anti* #7 muromonab or OKT3 or orthoclone or basiliximab or simulect or daclizumab or daclizimab or dacluzumab or daclizumab or zenapax or alemtuzumab or campath #8 (#4 OR #5 OR #6 OR #7) #9 (#3 AND #8) |
| MEDLINE (Ovid SP) | 1948 to September 2013 | #1 explode "Liver‐Transplantation"/ all subheadings #2 (liver or hepatic) and (transplant* or graft*) #3 #1 or #2 #4 explode "Antibodies‐Monoclonal"/ all subheadings #5 explode "Antilymphocyte‐Serum"/ all subheadings #6 monoclonal antibod* or antithymocyt* or thymocyt* or ATG or atgam or thymoglobulin or thymus anti* #7 muromonab or OKT3 or orthoclone or basiliximab or simulect or daclizumab or daclizimab or dacluzumab or daclizumab or zenapax or alemtuzumab or campath #8 #4 or #5 or #6 or #7 #9 #3 and #8 #10 random* or blind* or placebo* or meta‐analysis #11 #9 and #10 |
| EMBASE (Ovid SP) | 1980 to September 2013 | #1 explode "liver‐transplantation"/ all subheadings #2 (liver or hepatic) and (transplant* or graft*) #3 #1 or #2 #4 explode "OKT‐3"/ all subheadings #5 explode "basiliximab"/ all subheadings #6 explode "daclizumab"/ all subheadings #7 explode "alemtuzumab"/ all subheadings #8 explode "thymocyte‐antibody"/ all subheadings #9 monoclonal antibod* or antithymocyt* or thymocyt* or ATG or atgam or thymoglobulin or thymus anti* #10 muromonab or OKT3 or orthoclone or basiliximab or simulect or daclizumab or daclizimab or dacluzumab or daclizumab or zenapax or alemtuzumab or campath #11 #4 or #5 or #6 or #7 or #8 or #9 or #10 #12 #3 and #11 #13 random* or blind* or placebo* or meta‐analysis #14 #12 and #13 |
Data and analyses
Comparison 1. T‐cell antibody induction vs placebo/no intervention.
| Outcome or subgroup title | No. of studies | No. of participants | Statistical method | Effect size |
|---|---|---|---|---|
| 1 Mortality | 16 | 1853 | Risk Ratio (M‐H, Random, 95% CI) | 0.91 [0.64, 1.28] |
| 2 Graft loss including death | 14 | 1749 | Risk Ratio (M‐H, Random, 95% CI) | 0.92 [0.71, 1.19] |
| 3 Acute rejection | 16 | 1918 | Risk Ratio (M‐H, Random, 95% CI) | 0.85 [0.75, 0.96] |
| 4 Adverse events | 8 | 1228 | Risk Ratio (M‐H, Random, 95% CI) | 0.97 [0.93, 1.02] |
| 5 Infection | 11 | 1424 | Risk Ratio (M‐H, Random, 95% CI) | 0.90 [0.76, 1.06] |
| 6 CMV | 10 | 1543 | Risk Ratio (M‐H, Random, 95% CI) | 1.24 [0.93, 1.67] |
| 7 Hepatitis C recurrence | 2 | 147 | Risk Ratio (M‐H, Random, 95% CI) | 0.97 [0.72, 1.30] |
| 8 Malignancy | 12 | 1682 | Risk Ratio (M‐H, Random, 95% CI) | 0.91 [0.49, 1.69] |
| 9 Post‐transplant lymphoproliferative disorder | 9 | 985 | Risk Ratio (M‐H, Random, 95% CI) | 1.08 [0.26, 4.46] |
| 10 Renal failure requiring dialysis | 4 | 428 | Risk Ratio (M‐H, Random, 95% CI) | 0.0 [0.0, 0.0] |
| 11 Glomerular filtration rate (GFR) | 2 | 527 | Mean Difference (IV, Random, 95% CI) | 2.69 [‐3.19, 8.56] |
| 12 Creatinine (µmol/L) | 7 | 881 | Mean Difference (IV, Random, 95% CI) | 3.77 [0.33, 7.21] |
| 13 Hyperlipidaemia | 2 | 549 | Risk Ratio (M‐H, Random, 95% CI) | 1.00 [0.59, 1.69] |
| 14 Diabetes mellitus | 4 | 741 | Risk Ratio (M‐H, Random, 95% CI) | 0.91 [0.72, 1.14] |
| 15 Hypertension | 3 | 642 | Risk Ratio (M‐H, Random, 95% CI) | 0.96 [0.78, 1.18] |
Comparison 2. T‐cell antibody induction vs placebo/no intervention (subgroups).
| Outcome or subgroup title | No. of studies | No. of participants | Statistical method | Effect size |
|---|---|---|---|---|
| 1 Mortality | 16 | 1895 | Risk Ratio (M‐H, Random, 95% CI) | 0.87 [0.62, 1.22] |
| 1.1 Interleukin‐2 receptor antagonists | 9 | 1355 | Risk Ratio (M‐H, Random, 95% CI) | 0.86 [0.51, 1.45] |
| 1.2 Monoclonal antibody | 5 | 395 | Risk Ratio (M‐H, Random, 95% CI) | 0.81 [0.48, 1.35] |
| 1.3 Polyclonal antibody | 3 | 145 | Risk Ratio (M‐H, Random, 95% CI) | 0.92 [0.11, 7.75] |
| 2 Graft loss including death | 14 | 1791 | Risk Ratio (M‐H, Random, 95% CI) | 0.88 [0.68, 1.14] |
| 2.1 Interleukin‐2 receptor antagonists | 7 | 1251 | Risk Ratio (M‐H, Random, 95% CI) | 0.93 [0.58, 1.50] |
| 2.2 Monoclonal antibody | 5 | 395 | Risk Ratio (M‐H, Random, 95% CI) | 0.82 [0.62, 1.07] |
| 2.3 Polyclonal antibody | 3 | 145 | Risk Ratio (M‐H, Random, 95% CI) | 0.89 [0.13, 6.07] |
| 3 Acute rejection | 16 | 1960 | Risk Ratio (M‐H, Random, 95% CI) | 0.87 [0.77, 0.99] |
| 3.1 Interleukin‐2 receptor antagonists | 9 | 1420 | Risk Ratio (M‐H, Random, 95% CI) | 0.84 [0.67, 1.05] |
| 3.2 Monoclonal antibody | 5 | 395 | Risk Ratio (M‐H, Random, 95% CI) | 0.86 [0.74, 1.00] |
| 3.3 Polyclonal antibody | 3 | 145 | Risk Ratio (M‐H, Random, 95% CI) | 1.00 [0.41, 2.46] |
| 4 Adverse events | 8 | 1228 | Risk Ratio (M‐H, Random, 95% CI) | 0.97 [0.93, 1.02] |
| 4.1 Interleukin‐2 receptor antagonists | 4 | 970 | Risk Ratio (M‐H, Random, 95% CI) | 0.97 [0.92, 1.03] |
| 4.2 Monoclonal antibody | 3 | 236 | Risk Ratio (M‐H, Random, 95% CI) | 5.38 [0.27, 106.98] |
| 4.3 Polyclonal antibody | 1 | 22 | Risk Ratio (M‐H, Random, 95% CI) | 0.0 [0.0, 0.0] |
| 5 Infection | 11 | 1466 | Risk Ratio (M‐H, Random, 95% CI) | 0.91 [0.78, 1.07] |
| 5.1 Interleukin‐2 receptor antagonists | 6 | 1044 | Risk Ratio (M‐H, Random, 95% CI) | 0.94 [0.86, 1.02] |
| 5.2 Monoclonal antibody | 4 | 307 | Risk Ratio (M‐H, Random, 95% CI) | 0.84 [0.46, 1.53] |
| 5.3 Polyclonal antibody | 2 | 115 | Risk Ratio (M‐H, Random, 95% CI) | 1.36 [0.85, 2.18] |
| 6 CMV | 10 | 1585 | Risk Ratio (M‐H, Random, 95% CI) | 1.29 [0.97, 1.72] |
| 6.1 Interleukin‐2 receptor antagonists | 6 | 1203 | Risk Ratio (M‐H, Random, 95% CI) | 1.24 [0.91, 1.71] |
| 6.2 Monoclonal antibody | 3 | 267 | Risk Ratio (M‐H, Random, 95% CI) | 1.24 [0.32, 4.83] |
| 6.3 Polyclonal antibody | 2 | 115 | Risk Ratio (M‐H, Random, 95% CI) | 1.83 [0.56, 5.97] |
| 7 Hepatitis C recurrence | 2 | 147 | Risk Ratio (M‐H, Random, 95% CI) | 0.97 [0.72, 1.30] |
| 7.1 Interleukin‐2 receptor antagonists | 1 | 133 | Risk Ratio (M‐H, Random, 95% CI) | 0.94 [0.70, 1.27] |
| 7.2 Polyclonal antibody | 1 | 14 | Risk Ratio (M‐H, Random, 95% CI) | 2.18 [0.42, 11.26] |
| 8 Malignancy | 12 | 1724 | Risk Ratio (M‐H, Random, 95% CI) | 0.90 [0.49, 1.65] |
| 8.1 Interleukin‐2 receptor antagonists | 7 | 1302 | Risk Ratio (M‐H, Random, 95% CI) | 1.27 [0.58, 2.77] |
| 8.2 Monoclonal antibody | 4 | 307 | Risk Ratio (M‐H, Random, 95% CI) | 0.50 [0.12, 2.03] |
| 8.3 Polyclonal antibody | 2 | 115 | Risk Ratio (M‐H, Random, 95% CI) | 0.56 [0.15, 2.09] |
| 9 Post‐transplant lymphoproliferative disorder | 9 | 1027 | Risk Ratio (M‐H, Random, 95% CI) | 1.23 [0.30, 5.10] |
| 9.1 Interleukin‐2 receptor antagonists | 4 | 605 | Risk Ratio (M‐H, Random, 95% CI) | 1.00 [0.20, 4.89] |
| 9.2 Monoclonal antibody | 4 | 307 | Risk Ratio (M‐H, Random, 95% CI) | 2.87 [0.12, 68.47] |
| 9.3 Polyclonal antibody | 2 | 115 | Risk Ratio (M‐H, Random, 95% CI) | 0.0 [0.0, 0.0] |
| 10 Renal failure requiring dialysis | 4 | 428 | Risk Ratio (M‐H, Random, 95% CI) | 0.0 [0.0, 0.0] |
| 10.1 Interleukin‐2 receptor antagonists | 2 | 247 | Risk Ratio (M‐H, Random, 95% CI) | 0.0 [0.0, 0.0] |
| 10.2 Monoclonal antibody | 1 | 88 | Risk Ratio (M‐H, Random, 95% CI) | 0.0 [0.0, 0.0] |
| 10.3 Polyclonal antibody | 1 | 93 | Risk Ratio (M‐H, Random, 95% CI) | 0.0 [0.0, 0.0] |
| 11 Glomerular filtration rate (GFR) | 2 | 527 | Mean Difference (IV, Random, 95% CI) | 2.69 [‐3.19, 8.56] |
| 11.1 Interleukin‐2 receptor antagonists | 2 | 527 | Mean Difference (IV, Random, 95% CI) | 2.69 [‐3.19, 8.56] |
| 12 Creatinine (µmol/L) | 7 | 881 | Mean Difference (IV, Random, 95% CI) | 3.77 [0.33, 7.21] |
| 12.1 Interleukin‐2 receptor antagonists | 3 | 615 | Mean Difference (IV, Random, 95% CI) | 1.36 [‐2.68, 5.40] |
| 12.2 Monoclonal antibody | 3 | 197 | Mean Difference (IV, Random, 95% CI) | 1.57 [‐9.69, 12.82] |
| 12.3 Polyclonal antibody | 1 | 69 | Mean Difference (IV, Random, 95% CI) | 7.20 [4.36, 10.04] |
| 13 Hyperlipidaemia | 2 | 549 | Risk Ratio (M‐H, Random, 95% CI) | 1.00 [0.59, 1.69] |
| 13.1 Interleukin‐2 receptor antagonists | 2 | 549 | Risk Ratio (M‐H, Random, 95% CI) | 1.00 [0.59, 1.69] |
| 14 Diabetes mellitus | 4 | 741 | Risk Ratio (M‐H, Random, 95% CI) | 0.91 [0.72, 1.14] |
| 14.1 Interleukin‐2 receptor antagonists | 3 | 648 | Risk Ratio (M‐H, Random, 95% CI) | 0.89 [0.71, 1.13] |
| 14.2 Polyclonal antibody | 1 | 93 | Risk Ratio (M‐H, Random, 95% CI) | 1.11 [0.49, 2.55] |
| 15 Hypertension | 3 | 642 | Risk Ratio (M‐H, Random, 95% CI) | 0.96 [0.78, 1.18] |
| 15.1 Interleukin‐2 receptor antagonists | 2 | 549 | Risk Ratio (M‐H, Random, 95% CI) | 0.94 [0.75, 1.18] |
| 15.2 Polyclonal antibody | 1 | 93 | Risk Ratio (M‐H, Random, 95% CI) | 1.11 [0.58, 2.14] |
Comparison 3. Interleukin‐2 receptor antagonists vs placebo/no intervention (subgroups).
| Outcome or subgroup title | No. of studies | No. of participants | Statistical method | Effect size |
|---|---|---|---|---|
| 1 Mortality | 9 | 1355 | Risk Ratio (M‐H, Random, 95% CI) | 0.86 [0.51, 1.45] |
| 1.1 Basiliximab | 2 | 429 | Risk Ratio (M‐H, Random, 95% CI) | 0.83 [0.51, 1.35] |
| 1.2 Daclizumab | 4 | 767 | Risk Ratio (M‐H, Random, 95% CI) | 0.95 [0.53, 1.73] |
| 1.3 BT563 | 2 | 74 | Risk Ratio (M‐H, Random, 95% CI) | 2.76 [0.61, 12.61] |
| 1.4 LO‐Tact‐1 | 1 | 85 | Risk Ratio (M‐H, Random, 95% CI) | 0.21 [0.06, 0.68] |
| 2 Graft loss including death | 7 | 1251 | Risk Ratio (M‐H, Random, 95% CI) | 0.93 [0.58, 1.50] |
| 2.1 Basiliximab | 2 | 429 | Risk Ratio (M‐H, Random, 95% CI) | 0.81 [0.52, 1.25] |
| 2.2 Daclizumab | 3 | 697 | Risk Ratio (M‐H, Random, 95% CI) | 1.12 [0.73, 1.72] |
| 2.3 BT563 | 1 | 40 | Risk Ratio (M‐H, Random, 95% CI) | 3.87 [0.91, 16.39] |
| 2.4 LO‐Tact‐1 | 1 | 85 | Risk Ratio (M‐H, Random, 95% CI) | 0.34 [0.16, 0.72] |
| 3 Acute rejection | 9 | 1420 | Risk Ratio (M‐H, Random, 95% CI) | 0.84 [0.67, 1.05] |
| 3.1 Basiliximab | 3 | 528 | Risk Ratio (M‐H, Random, 95% CI) | 0.89 [0.61, 1.29] |
| 3.2 Daclizumab | 4 | 767 | Risk Ratio (M‐H, Random, 95% CI) | 0.73 [0.57, 0.94] |
| 3.3 BT563 | 1 | 40 | Risk Ratio (M‐H, Random, 95% CI) | 0.25 [0.06, 1.00] |
| 3.4 LO‐Tact‐1 | 1 | 85 | Risk Ratio (M‐H, Random, 95% CI) | 1.18 [0.92, 1.51] |
| 4 Adverse events | 4 | 970 | Risk Ratio (M‐H, Random, 95% CI) | 0.97 [0.92, 1.03] |
| 4.1 Basiliximab | 1 | 381 | Risk Ratio (M‐H, Random, 95% CI) | 1.00 [0.99, 1.01] |
| 4.2 Daclizumab | 2 | 549 | Risk Ratio (M‐H, Random, 95% CI) | 0.95 [0.88, 1.03] |
| 4.3 BT563 | 1 | 40 | Risk Ratio (M‐H, Random, 95% CI) | 0.0 [0.0, 0.0] |
| 4.4 LO‐Tact‐1 | 0 | 0 | Risk Ratio (M‐H, Random, 95% CI) | 0.0 [0.0, 0.0] |
| 5 Infection | 6 | 1044 | Risk Ratio (M‐H, Random, 95% CI) | 0.94 [0.86, 1.02] |
| 5.1 Basiliximab | 2 | 429 | Risk Ratio (M‐H, Random, 95% CI) | 0.96 [0.88, 1.06] |
| 5.2 Daclizumab | 2 | 490 | Risk Ratio (M‐H, Random, 95% CI) | 0.82 [0.54, 1.23] |
| 5.3 BT563 | 1 | 40 | Risk Ratio (M‐H, Random, 95% CI) | 0.79 [0.62, 1.01] |
| 5.4 LO‐Tact‐1 | 1 | 85 | Risk Ratio (M‐H, Random, 95% CI) | 1.24 [0.64, 2.42] |
| 6 CMV | 6 | 1203 | Risk Ratio (M‐H, Random, 95% CI) | 1.24 [0.91, 1.71] |
| 6.1 Basiliximab | 1 | 381 | Risk Ratio (M‐H, Random, 95% CI) | 1.11 [0.52, 2.37] |
| 6.2 Daclizumab | 3 | 697 | Risk Ratio (M‐H, Random, 95% CI) | 1.14 [0.64, 2.03] |
| 6.3 BT563 | 1 | 40 | Risk Ratio (M‐H, Random, 95% CI) | 1.38 [0.43, 4.40] |
| 6.4 LO‐Tact‐1 | 1 | 85 | Risk Ratio (M‐H, Random, 95% CI) | 2.28 [0.63, 8.23] |
| 7 Hepatitis C recurrence | 1 | 133 | Risk Ratio (M‐H, Random, 95% CI) | 0.94 [0.70, 1.27] |
| 7.1 Basiliximab | 1 | 133 | Risk Ratio (M‐H, Random, 95% CI) | 0.94 [0.70, 1.27] |
| 8 Malignancy | 7 | 1302 | Risk Ratio (M‐H, Random, 95% CI) | 1.27 [0.58, 2.77] |
| 8.1 Basiliximab | 2 | 480 | Risk Ratio (M‐H, Random, 95% CI) | 1.32 [0.33, 5.23] |
| 8.2 Daclizumab | 3 | 697 | Risk Ratio (M‐H, Random, 95% CI) | 1.43 [0.48, 4.28] |
| 8.3 BT563 | 1 | 40 | Risk Ratio (M‐H, Random, 95% CI) | 0.0 [0.0, 0.0] |
| 8.4 LO‐Tact‐1 | 1 | 85 | Risk Ratio (M‐H, Random, 95% CI) | 0.33 [0.01, 7.78] |
| 9 Post‐transplant lymphoproliferative disorder | 4 | 605 | Risk Ratio (M‐H, Random, 95% CI) | 1.00 [0.20, 4.89] |
| 9.1 Basiliximab | 2 | 480 | Risk Ratio (M‐H, Random, 95% CI) | 1.00 [0.20, 4.89] |
| 9.2 BT563 | 1 | 40 | Risk Ratio (M‐H, Random, 95% CI) | 0.0 [0.0, 0.0] |
| 9.3 LO‐Tact‐1 | 1 | 85 | Risk Ratio (M‐H, Random, 95% CI) | 0.0 [0.0, 0.0] |
| 10 Renal failure requiring dialysis | 2 | 247 | Risk Ratio (M‐H, Random, 95% CI) | 0.0 [0.0, 0.0] |
| 10.1 Daclizumab | 1 | 207 | Risk Ratio (M‐H, Random, 95% CI) | 0.0 [0.0, 0.0] |
| 10.2 BT563 | 1 | 40 | Risk Ratio (M‐H, Random, 95% CI) | 0.0 [0.0, 0.0] |
| 11 Glomerular filtration rate (GFR) | 2 | 527 | Mean Difference (IV, Random, 95% CI) | 2.69 [‐3.19, 8.56] |
| 11.1 Daclizumab | 2 | 527 | Mean Difference (IV, Random, 95% CI) | 2.69 [‐3.19, 8.56] |
| 12 Creatinine (µmol/L) | 3 | 615 | Mean Difference (IV, Random, 95% CI) | 1.36 [‐2.68, 5.40] |
| 12.1 Daclizumab | 3 | 615 | Mean Difference (IV, Random, 95% CI) | 1.36 [‐2.68, 5.40] |
| 13 Hyperlipidaemia | 2 | 549 | Risk Ratio (M‐H, Random, 95% CI) | 1.00 [0.59, 1.69] |
| 13.1 Daclizumab | 2 | 549 | Risk Ratio (M‐H, Random, 95% CI) | 1.00 [0.59, 1.69] |
| 14 Diabetes mellitus | 3 | 648 | Risk Ratio (M‐H, Random, 95% CI) | 0.89 [0.71, 1.13] |
| 14.1 Basiliximab | 1 | 99 | Risk Ratio (M‐H, Random, 95% CI) | 0.47 [0.17, 1.28] |
| 14.2 Daclizumab | 2 | 549 | Risk Ratio (M‐H, Random, 95% CI) | 0.93 [0.73, 1.18] |
| 15 Hypertension | 2 | 549 | Risk Ratio (M‐H, Random, 95% CI) | 0.94 [0.75, 1.18] |
| 15.1 Daclizumab | 1 | 207 | Risk Ratio (M‐H, Random, 95% CI) | 0.95 [0.71, 1.28] |
| 15.2 Basiliximab | 1 | 342 | Risk Ratio (M‐H, Random, 95% CI) | 0.93 [0.66, 1.31] |
3.2. Analysis.
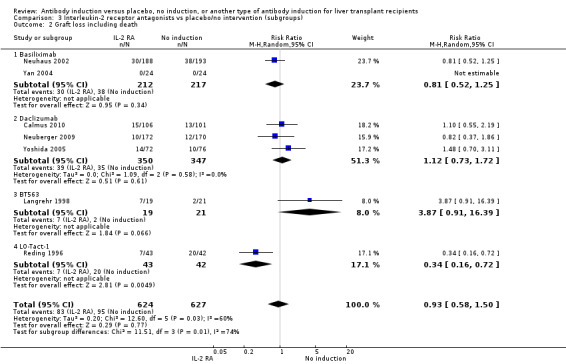
Comparison 3 Interleukin‐2 receptor antagonists vs placebo/no intervention (subgroups), Outcome 2 Graft loss including death.
3.3. Analysis.
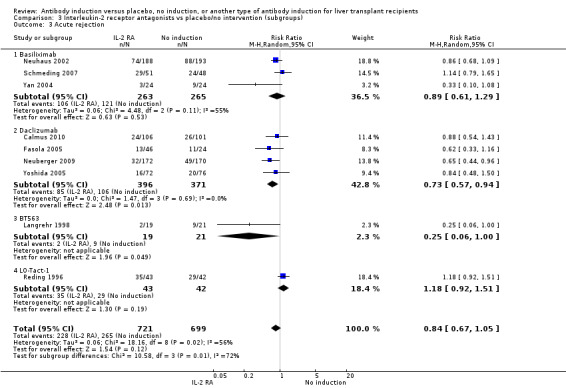
Comparison 3 Interleukin‐2 receptor antagonists vs placebo/no intervention (subgroups), Outcome 3 Acute rejection.
3.4. Analysis.
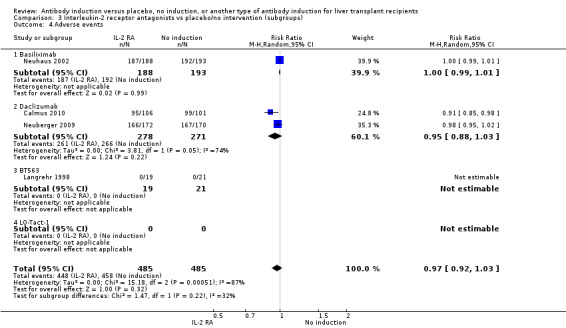
Comparison 3 Interleukin‐2 receptor antagonists vs placebo/no intervention (subgroups), Outcome 4 Adverse events.
3.5. Analysis.
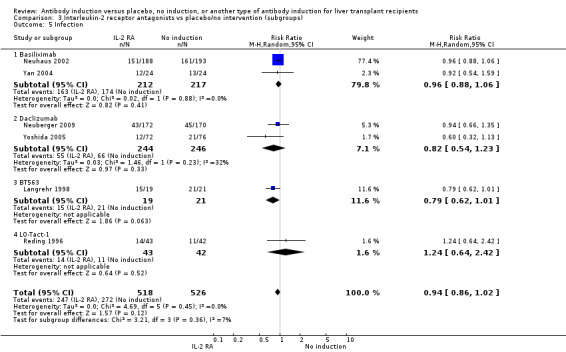
Comparison 3 Interleukin‐2 receptor antagonists vs placebo/no intervention (subgroups), Outcome 5 Infection.
3.6. Analysis.
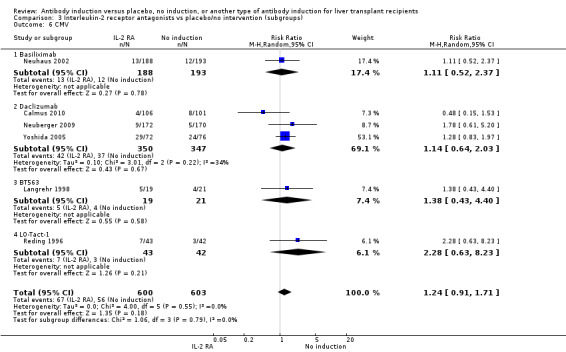
Comparison 3 Interleukin‐2 receptor antagonists vs placebo/no intervention (subgroups), Outcome 6 CMV.
3.7. Analysis.
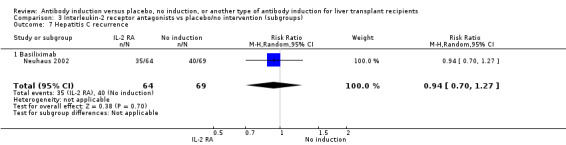
Comparison 3 Interleukin‐2 receptor antagonists vs placebo/no intervention (subgroups), Outcome 7 Hepatitis C recurrence.
3.8. Analysis.
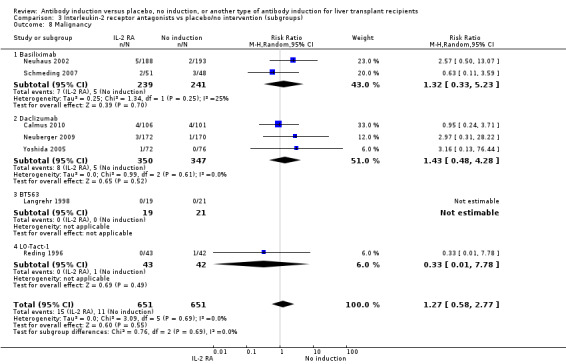
Comparison 3 Interleukin‐2 receptor antagonists vs placebo/no intervention (subgroups), Outcome 8 Malignancy.
3.9. Analysis.
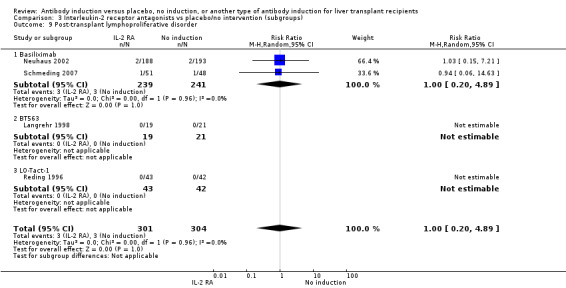
Comparison 3 Interleukin‐2 receptor antagonists vs placebo/no intervention (subgroups), Outcome 9 Post‐transplant lymphoproliferative disorder.
3.10. Analysis.
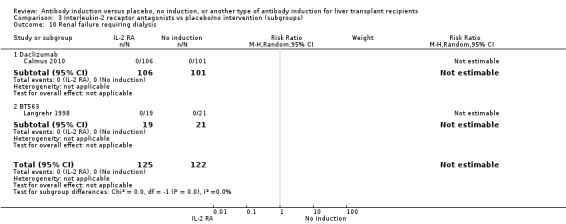
Comparison 3 Interleukin‐2 receptor antagonists vs placebo/no intervention (subgroups), Outcome 10 Renal failure requiring dialysis.
3.11. Analysis.
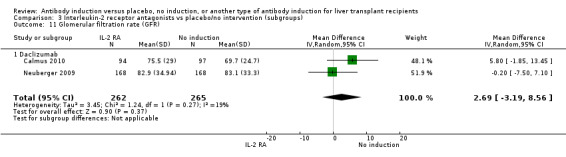
Comparison 3 Interleukin‐2 receptor antagonists vs placebo/no intervention (subgroups), Outcome 11 Glomerular filtration rate (GFR).
3.12. Analysis.
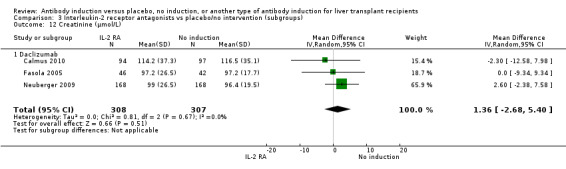
Comparison 3 Interleukin‐2 receptor antagonists vs placebo/no intervention (subgroups), Outcome 12 Creatinine (µmol/L).
3.13. Analysis.
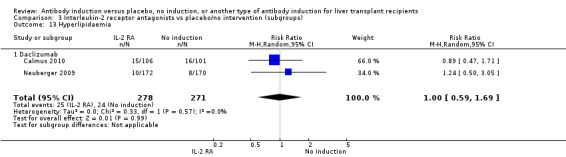
Comparison 3 Interleukin‐2 receptor antagonists vs placebo/no intervention (subgroups), Outcome 13 Hyperlipidaemia.
3.14. Analysis.
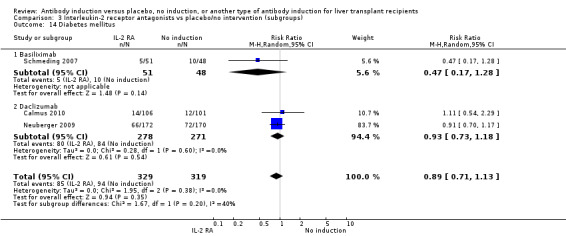
Comparison 3 Interleukin‐2 receptor antagonists vs placebo/no intervention (subgroups), Outcome 14 Diabetes mellitus.
Comparison 4. Monoclonal antibody induction vs placebo/no intervention (subgroups).
| Outcome or subgroup title | No. of studies | No. of participants | Statistical method | Effect size |
|---|---|---|---|---|
| 1 Mortality | 5 | 395 | Risk Ratio (M‐H, Random, 95% CI) | 0.81 [0.48, 1.35] |
| 1.1 Muromonab‐CD3 | 4 | 355 | Risk Ratio (M‐H, Random, 95% CI) | 0.85 [0.49, 1.47] |
| 1.2 Anti‐CD2 monoclonal antibody | 1 | 40 | Risk Ratio (M‐H, Random, 95% CI) | 0.33 [0.04, 2.94] |
| 2 Graft loss including death | 5 | 395 | Risk Ratio (M‐H, Random, 95% CI) | 0.82 [0.62, 1.07] |
| 2.1 Muromonab‐CD3 | 4 | 355 | Risk Ratio (M‐H, Random, 95% CI) | 0.83 [0.63, 1.10] |
| 2.2 Anti‐CD2 monoclonal antibody | 1 | 40 | Risk Ratio (M‐H, Random, 95% CI) | 0.5 [0.10, 2.43] |
| 3 Acute rejection | 5 | 395 | Risk Ratio (M‐H, Random, 95% CI) | 0.86 [0.74, 1.00] |
| 3.1 Muromonab‐CD3 | 4 | 355 | Risk Ratio (M‐H, Random, 95% CI) | 0.87 [0.74, 1.01] |
| 3.2 Anti‐CD2 monoclonal antibody | 1 | 40 | Risk Ratio (M‐H, Random, 95% CI) | 0.6 [0.17, 2.18] |
| 4 Adverse events | 3 | 236 | Risk Ratio (M‐H, Random, 95% CI) | 5.38 [0.27, 106.98] |
| 4.1 Muromonab‐CD3 | 3 | 236 | Risk Ratio (M‐H, Random, 95% CI) | 5.38 [0.27, 106.98] |
| 5 Infection | 4 | 307 | Risk Ratio (M‐H, Random, 95% CI) | 0.84 [0.46, 1.53] |
| 5.1 Muromonab‐CD3 | 3 | 267 | Risk Ratio (M‐H, Random, 95% CI) | 1.00 [0.47, 2.11] |
| 5.2 Anti‐CD2 monoclonal antibody | 1 | 40 | Risk Ratio (M‐H, Random, 95% CI) | 0.56 [0.33, 0.96] |
| 6 CMV | 3 | 267 | Risk Ratio (M‐H, Random, 95% CI) | 1.24 [0.32, 4.83] |
| 6.1 Muromonab‐CD3 | 3 | 267 | Risk Ratio (M‐H, Random, 95% CI) | 1.24 [0.32, 4.83] |
| 7 Malignancy | 4 | 307 | Risk Ratio (M‐H, Random, 95% CI) | 0.50 [0.12, 2.03] |
| 7.1 Muromonab‐CD3 | 3 | 267 | Risk Ratio (M‐H, Random, 95% CI) | 0.66 [0.11, 4.15] |
| 7.2 Anti‐CD2 monoclonal antibody | 1 | 40 | Risk Ratio (M‐H, Random, 95% CI) | 0.33 [0.04, 2.94] |
| 8 Post‐transplant lymphoproliferative disorder | 4 | 307 | Risk Ratio (M‐H, Random, 95% CI) | 2.87 [0.12, 68.47] |
| 8.1 Muromonab‐CD3 | 3 | 267 | Risk Ratio (M‐H, Random, 95% CI) | 2.87 [0.12, 68.47] |
| 8.2 Anti‐CD2 monoclonal antibody | 1 | 40 | Risk Ratio (M‐H, Random, 95% CI) | 0.0 [0.0, 0.0] |
| 9 Creatinine (µmol/L) | 3 | 197 | Mean Difference (IV, Random, 95% CI) | 1.57 [‐9.69, 12.82] |
| 9.1 Muromonab‐CD3 | 2 | 157 | Mean Difference (IV, Random, 95% CI) | 6.63 [‐18.33, 31.59] |
| 9.2 Anti‐CD2 monoclonal antibody | 1 | 40 | Mean Difference (IV, Random, 95% CI) | 0.0 [‐14.30, 14.30] |
| 10 Renal failure requiring dialysis | 1 | 88 | Risk Ratio (M‐H, Random, 95% CI) | 0.0 [0.0, 0.0] |
| 10.1 Muromonab‐CD3 | 1 | 88 | Risk Ratio (M‐H, Random, 95% CI) | 0.0 [0.0, 0.0] |
Comparison 5. Interleukin‐2 receptor antagonists vs placebo/no intervention (hepatitis C virus).
| Outcome or subgroup title | No. of studies | No. of participants | Statistical method | Effect size |
|---|---|---|---|---|
| 1 Mortality | 9 | 1355 | Risk Ratio (M‐H, Random, 95% CI) | 0.86 [0.51, 1.45] |
| 1.1 Mixed transplant indications | 8 | 1285 | Risk Ratio (M‐H, Random, 95% CI) | 0.85 [0.48, 1.52] |
| 1.2 Hepatitis C virus | 1 | 70 | Risk Ratio (M‐H, Random, 95% CI) | 1.04 [0.21, 5.29] |
| 2 Graft loss including death | 7 | 1251 | Risk Ratio (M‐H, Random, 95% CI) | 0.93 [0.58, 1.50] |
| 2.1 Mixed transplant indications | 7 | 1251 | Risk Ratio (M‐H, Random, 95% CI) | 0.93 [0.58, 1.50] |
| 3 Acute rejection | 9 | 1420 | Risk Ratio (M‐H, Random, 95% CI) | 0.84 [0.67, 1.05] |
| 3.1 Mixed transplant indications | 8 | 1350 | Risk Ratio (M‐H, Random, 95% CI) | 0.86 [0.68, 1.09] |
| 3.2 Hepatitis C virus | 1 | 70 | Risk Ratio (M‐H, Random, 95% CI) | 0.62 [0.33, 1.16] |
| 4 Adverse events | 4 | 970 | Risk Ratio (M‐H, Random, 95% CI) | 0.97 [0.92, 1.03] |
| 4.1 Mixed transplant indications | 4 | 970 | Risk Ratio (M‐H, Random, 95% CI) | 0.97 [0.92, 1.03] |
| 5 Infection | 6 | 1044 | Risk Ratio (M‐H, Random, 95% CI) | 0.94 [0.86, 1.02] |
| 5.1 Mixed transplant indications | 6 | 1044 | Risk Ratio (M‐H, Random, 95% CI) | 0.94 [0.86, 1.02] |
| 6 CMV | 6 | 1203 | Risk Ratio (M‐H, Random, 95% CI) | 1.24 [0.91, 1.71] |
| 6.1 Mixed transplant indications | 6 | 1203 | Risk Ratio (M‐H, Random, 95% CI) | 1.24 [0.91, 1.71] |
| 7 Malignancy | 7 | 1302 | Risk Ratio (M‐H, Random, 95% CI) | 1.27 [0.58, 2.77] |
| 7.1 Mixed transplant indications | 7 | 1302 | Risk Ratio (M‐H, Random, 95% CI) | 1.27 [0.58, 2.77] |
| 8 Post‐transplant lymphoproliferative disorder | 4 | 605 | Risk Ratio (M‐H, Random, 95% CI) | 1.00 [0.20, 4.89] |
| 8.1 Mixed transplant indications | 4 | 605 | Risk Ratio (M‐H, Random, 95% CI) | 1.00 [0.20, 4.89] |
| 9 Renal failure requiring dialysis | 2 | 247 | Risk Ratio (M‐H, Random, 95% CI) | 0.0 [0.0, 0.0] |
| 9.1 Mixed transplant indications | 2 | 247 | Risk Ratio (M‐H, Random, 95% CI) | 0.0 [0.0, 0.0] |
| 10 Glomerular filtration rate (GFR) | 2 | 527 | Mean Difference (IV, Random, 95% CI) | 2.69 [‐3.19, 8.56] |
| 10.1 Mixed transplant indications | 2 | 527 | Mean Difference (IV, Random, 95% CI) | 2.69 [‐3.19, 8.56] |
| 11 Creatinine (µmol/L) | 3 | 615 | Mean Difference (IV, Random, 95% CI) | 1.36 [‐2.68, 5.40] |
| 11.1 Mixed transplant indications | 2 | 527 | Mean Difference (IV, Random, 95% CI) | 1.67 [‐2.81, 6.15] |
| 11.2 Hepatitis C virus | 1 | 88 | Mean Difference (IV, Random, 95% CI) | 0.0 [‐9.34, 9.34] |
| 12 Hyperlipidaemia | 2 | 549 | Risk Ratio (M‐H, Random, 95% CI) | 1.00 [0.59, 1.69] |
| 12.1 Mixed transplant indications | 2 | 549 | Risk Ratio (M‐H, Random, 95% CI) | 1.00 [0.59, 1.69] |
| 13 Diabetes mellitus | 3 | 648 | Risk Ratio (M‐H, Random, 95% CI) | 0.89 [0.71, 1.13] |
| 13.1 Mixed transplant indications | 3 | 648 | Risk Ratio (M‐H, Random, 95% CI) | 0.89 [0.71, 1.13] |
| 14 Hypertension | 2 | 549 | Risk Ratio (M‐H, Random, 95% CI) | 0.94 [0.75, 1.18] |
| 14.1 Mixed transplant indications | 2 | 549 | Risk Ratio (M‐H, Random, 95% CI) | 0.94 [0.75, 1.18] |
5.2. Analysis.
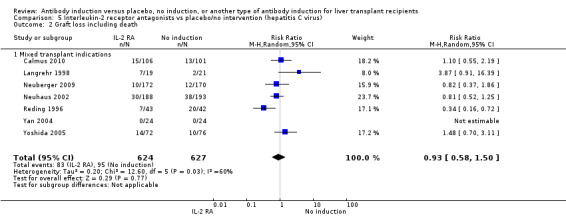
Comparison 5 Interleukin‐2 receptor antagonists vs placebo/no intervention (hepatitis C virus), Outcome 2 Graft loss including death.
5.3. Analysis.
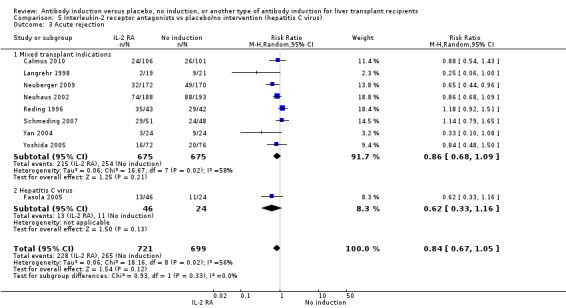
Comparison 5 Interleukin‐2 receptor antagonists vs placebo/no intervention (hepatitis C virus), Outcome 3 Acute rejection.
5.4. Analysis.
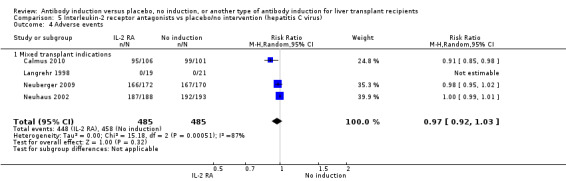
Comparison 5 Interleukin‐2 receptor antagonists vs placebo/no intervention (hepatitis C virus), Outcome 4 Adverse events.
5.5. Analysis.
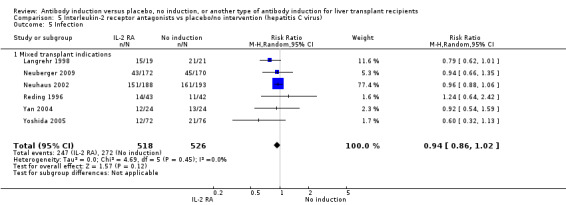
Comparison 5 Interleukin‐2 receptor antagonists vs placebo/no intervention (hepatitis C virus), Outcome 5 Infection.
5.6. Analysis.
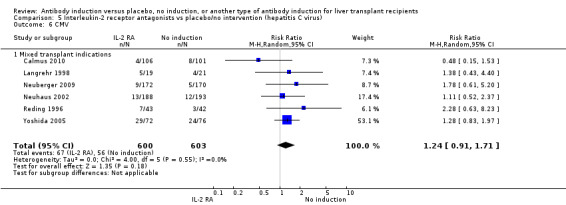
Comparison 5 Interleukin‐2 receptor antagonists vs placebo/no intervention (hepatitis C virus), Outcome 6 CMV.
5.7. Analysis.
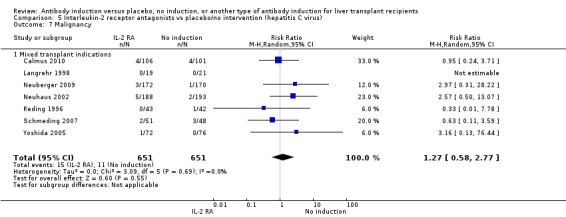
Comparison 5 Interleukin‐2 receptor antagonists vs placebo/no intervention (hepatitis C virus), Outcome 7 Malignancy.
5.8. Analysis.
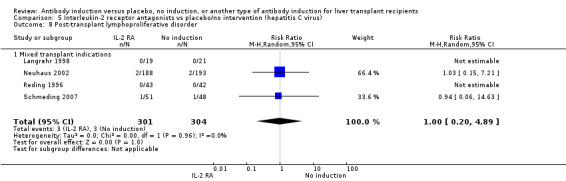
Comparison 5 Interleukin‐2 receptor antagonists vs placebo/no intervention (hepatitis C virus), Outcome 8 Post‐transplant lymphoproliferative disorder.
5.9. Analysis.
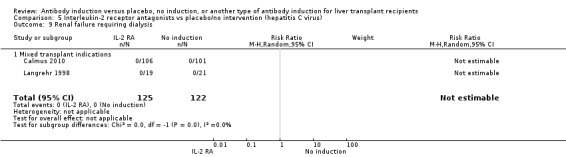
Comparison 5 Interleukin‐2 receptor antagonists vs placebo/no intervention (hepatitis C virus), Outcome 9 Renal failure requiring dialysis.
5.10. Analysis.
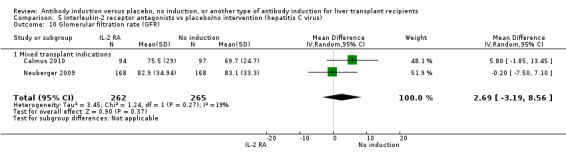
Comparison 5 Interleukin‐2 receptor antagonists vs placebo/no intervention (hepatitis C virus), Outcome 10 Glomerular filtration rate (GFR).
5.11. Analysis.
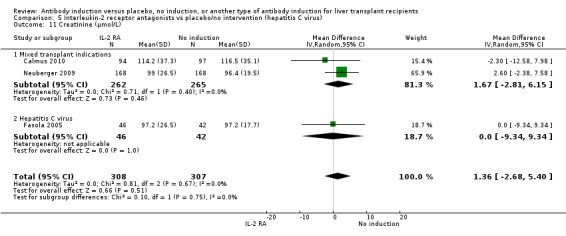
Comparison 5 Interleukin‐2 receptor antagonists vs placebo/no intervention (hepatitis C virus), Outcome 11 Creatinine (µmol/L).
5.12. Analysis.
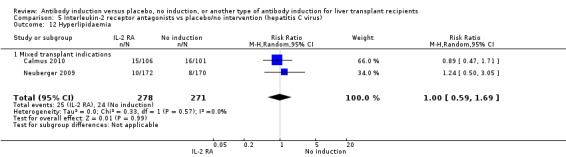
Comparison 5 Interleukin‐2 receptor antagonists vs placebo/no intervention (hepatitis C virus), Outcome 12 Hyperlipidaemia.
5.13. Analysis.
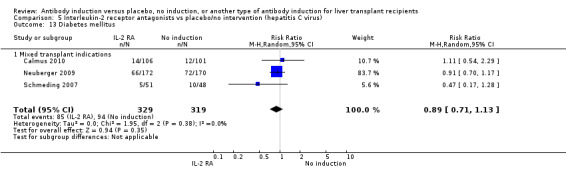
Comparison 5 Interleukin‐2 receptor antagonists vs placebo/no intervention (hepatitis C virus), Outcome 13 Diabetes mellitus.
Comparison 6. T‐cell antibody induction vs placebo/no intervention (CNI start).
| Outcome or subgroup title | No. of studies | No. of participants | Statistical method | Effect size |
|---|---|---|---|---|
| 1 Mortality | 16 | 1853 | Risk Ratio (M‐H, Random, 95% CI) | 0.91 [0.64, 1.28] |
| 1.1 Early calcineurin inhibitor start | 10 | 945 | Risk Ratio (M‐H, Random, 95% CI) | 0.85 [0.52, 1.39] |
| 1.2 Delayed calcineurin inhibitor start | 6 | 908 | Risk Ratio (M‐H, Random, 95% CI) | 1.00 [0.58, 1.71] |
| 2 Graft loss including death | 14 | 1749 | Risk Ratio (M‐H, Random, 95% CI) | 0.92 [0.71, 1.19] |
| 2.1 Early calcineurin inhibitor start | 8 | 841 | Risk Ratio (M‐H, Random, 95% CI) | 0.86 [0.55, 1.35] |
| 2.2 Delayed calcineurin inhibitor start | 6 | 908 | Risk Ratio (M‐H, Random, 95% CI) | 1.01 [0.76, 1.35] |
| 3 Acute rejection | 16 | 1918 | Risk Ratio (M‐H, Random, 95% CI) | 0.85 [0.75, 0.96] |
| 3.1 Early calcineurin inhibitor start | 10 | 1010 | Risk Ratio (M‐H, Random, 95% CI) | 0.88 [0.73, 1.06] |
| 3.2 Delayed calcineurin inhibitor start | 6 | 908 | Risk Ratio (M‐H, Random, 95% CI) | 0.78 [0.65, 0.93] |
| 4 Adverse events | 8 | 1228 | Risk Ratio (M‐H, Random, 95% CI) | 0.97 [0.93, 1.02] |
| 4.1 Early calcineurin inhibitor start | 4 | 531 | Risk Ratio (M‐H, Random, 95% CI) | 1.00 [0.99, 1.01] |
| 4.2 Delayed calcineurin inhibitor start | 4 | 697 | Risk Ratio (M‐H, Random, 95% CI) | 0.95 [0.89, 1.03] |
| 5 Infection | 11 | 1424 | Risk Ratio (M‐H, Random, 95% CI) | 0.90 [0.76, 1.06] |
| 5.1 Early calcineurin inhibitor start | 7 | 753 | Risk Ratio (M‐H, Random, 95% CI) | 0.93 [0.77, 1.14] |
| 5.2 Delayed calcineurin inhibitor start | 4 | 671 | Risk Ratio (M‐H, Random, 95% CI) | 0.79 [0.55, 1.13] |
| 6 CMV | 10 | 1543 | Risk Ratio (M‐H, Random, 95% CI) | 1.24 [0.93, 1.67] |
| 6.1 Early calcineurin inhibitor start | 5 | 665 | Risk Ratio (M‐H, Random, 95% CI) | 1.52 [0.92, 2.51] |
| 6.2 Delayed calcineurin inhibitor start | 5 | 878 | Risk Ratio (M‐H, Random, 95% CI) | 1.08 [0.71, 1.65] |
| 7 Hepatitis C recurrence | 2 | 147 | Risk Ratio (M‐H, Random, 95% CI) | 0.97 [0.72, 1.30] |
| 7.1 Early calcineurin inhibitor start | 1 | 133 | Risk Ratio (M‐H, Random, 95% CI) | 0.94 [0.70, 1.27] |
| 7.2 Delayed calcineurin inhibitor start | 1 | 14 | Risk Ratio (M‐H, Random, 95% CI) | 2.18 [0.42, 11.26] |
| 8 Malignancy | 12 | 1682 | Risk Ratio (M‐H, Random, 95% CI) | 0.91 [0.49, 1.69] |
| 8.1 Early calcineurin inhibitor start | 7 | 804 | Risk Ratio (M‐H, Random, 95% CI) | 0.71 [0.32, 1.57] |
| 8.2 Delayed calcineurin inhibitor start | 5 | 878 | Risk Ratio (M‐H, Random, 95% CI) | 1.33 [0.50, 3.55] |
| 9 Post‐transplant lymphoproliferative disorder | 9 | 985 | Risk Ratio (M‐H, Random, 95% CI) | 1.08 [0.26, 4.46] |
| 9.1 Early calcineurin inhibitor start | 7 | 804 | Risk Ratio (M‐H, Random, 95% CI) | 1.08 [0.26, 4.46] |
| 9.2 Delayed calcineurin inhibitor start | 2 | 181 | Risk Ratio (M‐H, Random, 95% CI) | 0.0 [0.0, 0.0] |
| 10 Renal failure requiring dialysis | 4 | 428 | Risk Ratio (M‐H, Random, 95% CI) | 0.0 [0.0, 0.0] |
| 10.1 Early calcineurin inhibitor start | 3 | 221 | Risk Ratio (M‐H, Random, 95% CI) | 0.0 [0.0, 0.0] |
| 10.2 Delayed calcineurin inhibitor start | 1 | 207 | Risk Ratio (M‐H, Random, 95% CI) | 0.0 [0.0, 0.0] |
| 11 Glomerular filtration rate (GFR) | 2 | 527 | Mean Difference (IV, Random, 95% CI) | 2.69 [‐3.19, 8.56] |
| 11.1 Delayed calcineurin inhibitor start | 2 | 527 | Mean Difference (IV, Random, 95% CI) | 2.69 [‐3.19, 8.56] |
| 12 Creatinine (µmol/L) | 7 | 881 | Mean Difference (IV, Random, 95% CI) | 3.77 [0.33, 7.21] |
| 12.1 Early calcineurin inhibitor start | 4 | 262 | Mean Difference (IV, Random, 95% CI) | 5.60 [2.07, 9.14] |
| 12.2 Delayed calcineurin inhibitor start | 3 | 619 | Mean Difference (IV, Random, 95% CI) | 1.88 [‐2.67, 6.44] |
| 13 Hyperlipidaemia | 2 | 549 | Risk Ratio (M‐H, Random, 95% CI) | 1.00 [0.59, 1.69] |
| 13.1 Delayed calcineurin inhibitor start | 2 | 549 | Risk Ratio (M‐H, Random, 95% CI) | 1.00 [0.59, 1.69] |
| 14 Diabetes mellitus | 4 | 741 | Risk Ratio (M‐H, Random, 95% CI) | 0.91 [0.72, 1.14] |
| 14.1 Early calcineurin inhibitor start | 2 | 192 | Risk Ratio (M‐H, Random, 95% CI) | 0.76 [0.33, 1.76] |
| 14.2 Delayed calcineurin inhibitor start | 2 | 549 | Risk Ratio (M‐H, Random, 95% CI) | 0.93 [0.73, 1.18] |
| 15 Hypertension | 3 | 642 | Risk Ratio (M‐H, Random, 95% CI) | 0.96 [0.78, 1.18] |
| 15.1 Early calcineurin inhibitor start | 1 | 93 | Risk Ratio (M‐H, Random, 95% CI) | 1.11 [0.58, 2.14] |
| 15.2 Delayed calcineurin inhibitor start | 2 | 549 | Risk Ratio (M‐H, Random, 95% CI) | 0.94 [0.75, 1.18] |
6.2. Analysis.
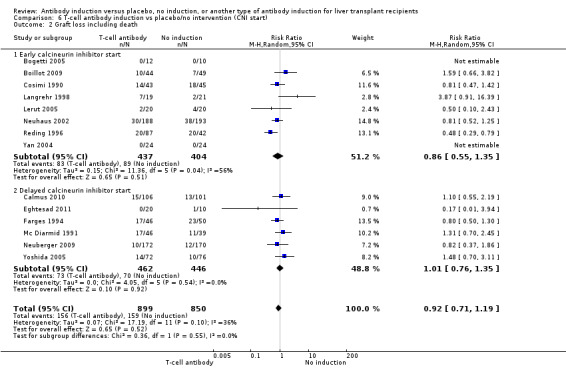
Comparison 6 T‐cell antibody induction vs placebo/no intervention (CNI start), Outcome 2 Graft loss including death.
6.3. Analysis.
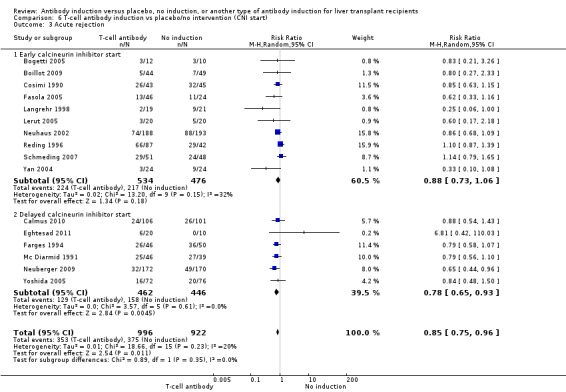
Comparison 6 T‐cell antibody induction vs placebo/no intervention (CNI start), Outcome 3 Acute rejection.
6.4. Analysis.
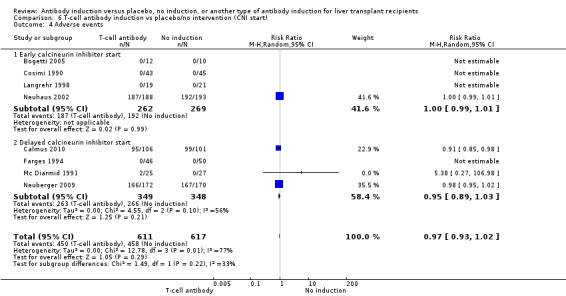
Comparison 6 T‐cell antibody induction vs placebo/no intervention (CNI start), Outcome 4 Adverse events.
6.5. Analysis.
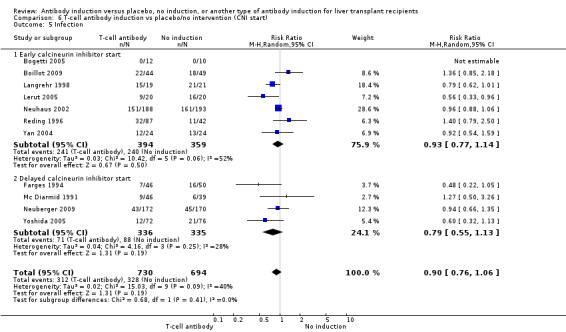
Comparison 6 T‐cell antibody induction vs placebo/no intervention (CNI start), Outcome 5 Infection.
6.6. Analysis.
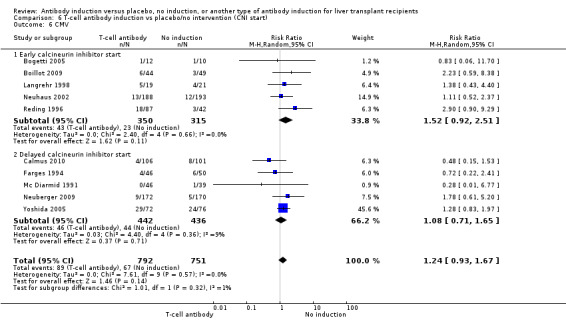
Comparison 6 T‐cell antibody induction vs placebo/no intervention (CNI start), Outcome 6 CMV.
6.7. Analysis.
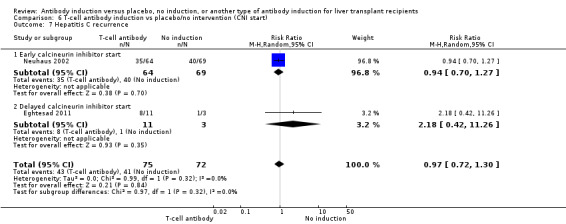
Comparison 6 T‐cell antibody induction vs placebo/no intervention (CNI start), Outcome 7 Hepatitis C recurrence.
6.8. Analysis.
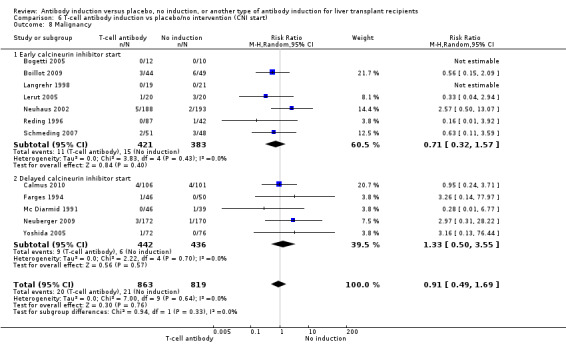
Comparison 6 T‐cell antibody induction vs placebo/no intervention (CNI start), Outcome 8 Malignancy.
6.9. Analysis.
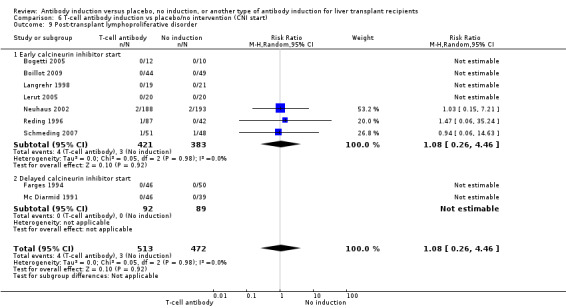
Comparison 6 T‐cell antibody induction vs placebo/no intervention (CNI start), Outcome 9 Post‐transplant lymphoproliferative disorder.
6.10. Analysis.
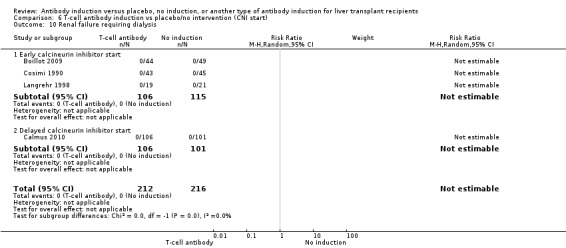
Comparison 6 T‐cell antibody induction vs placebo/no intervention (CNI start), Outcome 10 Renal failure requiring dialysis.
6.11. Analysis.
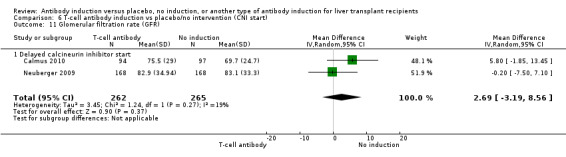
Comparison 6 T‐cell antibody induction vs placebo/no intervention (CNI start), Outcome 11 Glomerular filtration rate (GFR).
6.12. Analysis.
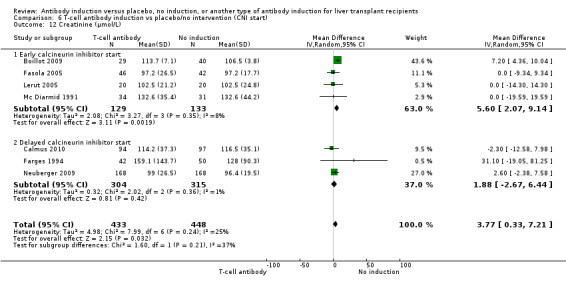
Comparison 6 T‐cell antibody induction vs placebo/no intervention (CNI start), Outcome 12 Creatinine (µmol/L).
6.13. Analysis.
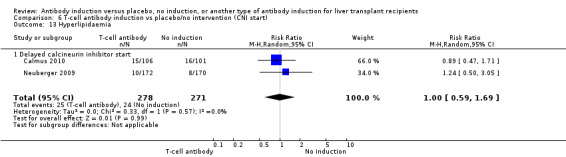
Comparison 6 T‐cell antibody induction vs placebo/no intervention (CNI start), Outcome 13 Hyperlipidaemia.
6.14. Analysis.
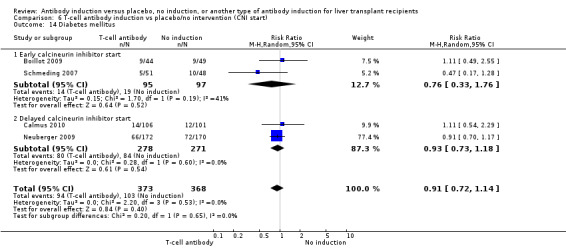
Comparison 6 T‐cell antibody induction vs placebo/no intervention (CNI start), Outcome 14 Diabetes mellitus.
Comparison 7. Interleukin‐2 receptor antagonist vs monoclonal antibody induction.
| Outcome or subgroup title | No. of studies | No. of participants | Statistical method | Effect size |
|---|---|---|---|---|
| 1 Mortality | 1 | 87 | Risk Ratio (M‐H, Fixed, 95% CI) | 0.34 [0.10, 1.18] |
| 1.1 Muromonab‐CD3 | 1 | 87 | Risk Ratio (M‐H, Fixed, 95% CI) | 0.34 [0.10, 1.18] |
| 2 Graft loss | 1 | 87 | Risk Ratio (M‐H, Random, 95% CI) | 0.60 [0.26, 1.37] |
| 2.1 Muromonab‐CD3 | 1 | 87 | Risk Ratio (M‐H, Random, 95% CI) | 0.60 [0.26, 1.37] |
| 3 Acute rejection | 1 | 87 | Risk Ratio (M‐H, Random, 95% CI) | 1.16 [0.91, 1.47] |
| 3.1 Muromonab‐CD3 | 1 | 87 | Risk Ratio (M‐H, Random, 95% CI) | 1.16 [0.91, 1.47] |
| 4 Infection | 1 | 87 | Risk Ratio (M‐H, Random, 95% CI) | 0.80 [0.46, 1.39] |
| 4.1 Muromonab‐CD3 | 1 | 87 | Risk Ratio (M‐H, Random, 95% CI) | 0.80 [0.46, 1.39] |
| 5 CMV | 1 | 87 | Risk Ratio (M‐H, Random, 95% CI) | 0.65 [0.28, 1.52] |
| 5.1 Muromonab‐CD3 | 1 | 87 | Risk Ratio (M‐H, Random, 95% CI) | 0.65 [0.28, 1.52] |
| 6 Malignancy | 1 | 87 | Risk Ratio (M‐H, Random, 95% CI) | 0.0 [0.0, 0.0] |
| 6.1 Muromonab‐CD3 | 1 | 87 | Risk Ratio (M‐H, Random, 95% CI) | 0.0 [0.0, 0.0] |
| 7 Post‐transplant lymphoproliferative disorder | 1 | 87 | Risk Ratio (M‐H, Random, 95% CI) | 1.02 [0.07, 15.84] |
| 7.1 Muromonab‐CD3 | 1 | 87 | Risk Ratio (M‐H, Random, 95% CI) | 1.02 [0.07, 15.84] |
Comparison 8. Interleukin‐2 receptor antagonist vs polyclonal T‐cell specific antibody induction.
| Outcome or subgroup title | No. of studies | No. of participants | Statistical method | Effect size |
|---|---|---|---|---|
| 1 Mortality | 2 | 112 | Risk Ratio (M‐H, Random, 95% CI) | 1.22 [0.44, 3.38] |
| 2 Graft loss | 2 | 112 | Risk Ratio (M‐H, Random, 95% CI) | 1.18 [0.50, 2.80] |
| 3 Acute rejection | 2 | 112 | Risk Ratio (M‐H, Random, 95% CI) | 0.35 [0.11, 1.10] |
| 4 Adverse events | 1 | 80 | Risk Ratio (M‐H, Random, 95% CI) | 0.23 [0.09, 0.63] |
| 5 Infection | 2 | 112 | Risk Ratio (M‐H, Random, 95% CI) | 0.56 [0.15, 2.08] |
| 6 CMV | 2 | 112 | Risk Ratio (M‐H, Random, 95% CI) | 0.82 [0.39, 1.71] |
| 7 Malignancy | 2 | 112 | Risk Ratio (M‐H, Random, 95% CI) | 0.0 [0.0, 0.0] |
| 8 Post‐transplant lymphoproliferative disorder | 2 | 112 | Risk Ratio (M‐H, Random, 95% CI) | 3.15 [0.13, 75.08] |
| 9 Renal failure requiring dialysis | 1 | 80 | Risk Ratio (M‐H, Random, 95% CI) | 0.0 [0.0, 0.0] |
Characteristics of studies
Characteristics of included studies [ordered by study ID]
Bogetti 2005.
| Methods | Trial design: randomised clinical trial Language: English Type of information: journal article Judgement of the quality: high risk of bias |
|
| Participants | Setting: University of Illinois Medical Center, Chicago, IL, USA Allocation of participants: 22 participants, 12 allocated to rabbit antithymocyte globulin (Thymoglobulin®) and 10 allocated to no intervention Sex ratio: antithymocyte globulin 5 (42%) males, 7 (58%) females Control: 8 (80%) males, 2 (20%) females Mean age: antithymocyte globulin 52 (27‐67) years, control 53 (47‐62) years Indication (No. (%)): Hepatitis C: antithymocyte globulin 9 (75%), control 6 (60%) Laennec's cirrhosis: antithymocyte globulin 1 (8%), control 2 (20%) Autoimmune hepatitis: antithymocyte globulin 2 (17%), control 2 (20%) Type of donor: 100% cadaveric donor Inclusion criteria: all patients eligible for liver transplantation |
|
| Interventions | Intervention A: Antithymocyte globulin was given during the an‐hepatic phase (1.5 mg/kg/dose) and every other day × 2 doses postoperatively Intervention B: No antithymocyte globulin was given during the an‐hepatic phase or postoperatively Concomitant immunosuppressive treatment: Immunosuppressive regimen consisted of tacrolimus and corticosteroids. Starting dose of tacrolimus was 0.1 mg/kg with target levels between 5 and 10 ng/dL, or in the presence of tacrolimus toxicity, cyclosporine was given and was dosed to reach target levels between 100 and 150 ng/mL. Corticosteroid regimen consisted of 500 mg methylprednisolone preoperatively, with a postoperative corticosteroid taper. Corticosteroids were discontinued 90 days postoperatively |
|
| Outcomes | Ischemia‐reperfusion injury, acute rejection, participant and graft survival, and infection | |
| Notes | Single‐centre study Cross‐over between treatment groups: no Sample size calculation: not reported Sources of funding: not reported |
|
| Risk of bias | ||
| Bias | Authors' judgement | Support for judgement |
| Random sequence generation (selection bias) | Unclear risk | Not specified |
| Allocation concealment (selection bias) | Unclear risk | Not reported |
| Blinding of participants and personnel (performance bias) All outcomes | High risk | No blinding |
| Blinding of outcome assessment (detection bias) All outcomes | High risk | No blinding |
| Incomplete outcome data (attrition bias) All outcomes | Low risk | No participants were lost to follow‐up |
| Selective reporting (reporting bias) | Low risk | No protocol was available, but all expected outcomes were reported |
| Other bias | Low risk | Trial appears to be free of other bias components |
Boillot 2009.
| Methods | Trial design: randomised open‐label clinical trial Language: English Type of information: journal article and abstract Judgement of the quality: high risk of bias |
|
| Participants | Setting: Edouard Herriot Hospital, Lyon, France Allocation of participants: 93 participants, 44 allocated to rabbit antithymocyte globulin (Thymoglobulin®) and 49 allocated to no intervention Sex ratio: antithymocyte globulin 25 (57%) males, 19 (43%) females Control: 29 (59%) males, 20 (41%) females Mean age: antithymocyte globulin 51 ± 9 years, control 49 ± 9 years Indication (No. (%)): Alcoholic cirrhosis: antithymocyte globulin 25 (57%), control 16 (33%) Virus‐related cirrhosis: antithymocyte globulin 10 (23%), control 14 (29%) Primary biliary cirrhosis: antithymocyte globulin 1 (2%), control 3 (6%) Sclerosing cholangitis: antithymocyte globulin 1 (2%), control 5 (10%) Fulminant hepatitis: antithymocyte globulin 1 (2%), control 1 (2%) Cryptogenic cirrhosis: antithymocyte globulin 1 (2%), control 2 (4%) Miscellaneous: antithymocyte globulin 5 (11%), control 8 (16%) Associated hepatocellular carcinoma: antithymocyte globulin 5 (11%), control 4 (8%) Type of donor: 100% cadaveric donor Inclusion criteria: adults undergoing primary orthotopic liver allograft transplantation, including partial organ transplantation Exclusion criteria: retransplantation, multi‐organ transplantation, or living donor transplantation, ABO blood group–incompatible grafts, previous administration (in the past 3 months) of any immunosuppressive drugs, serum creatinine above 180 mol/L, human immunodeficiency virus seropositivity, or a history of malignancy except for hepatocellular carcinoma (HCC) within the Milan criteria. Participation in another clinical trial or treatment with an experimental compound within the previous month and unlikely compliance with the study schedule |
|
| Interventions | Intervention A: Antithymocyte globulin was started intraoperatively and was given at a daily dose of 100 mg for 6 days Intervention B: no intervention Concomitant immunosuppressive treatment: Tacrolimus was given orally from the day of transplantation at the initial daily starting dose of 0.075 mg/kg twice daily; daily dose was then adjusted to reach the following tacrolimus trough level targets: 8‐12 ng/mL during the first month, 7‐10 ng/mL during the first year, and 3‐7 ng/mL thereafter, according to participant and graft tolerance Mycophenolate mofetil was administrated orally according to participant tolerance at the initial daily dose of 2 g/d and was progressively tapered to 1 g/d or less according to efficacy and safety. As for steroids, 500 mg of solumedrol was given intraoperatively; thereafter, participants received 20 mg per day, progressively tapered to 5 mg When possible, participants were withdrawn from steroids 3 months post transplantation |
|
| Outcomes | Over a 5‐year follow‐up of all surviving participants, the primary outcome was the incidence of biopsy‐proven acute rejection. Secondary outcomes were 5‐year participant and graft survival, liver and kidney function over the 5‐year follow‐up, and incidence of medical complications | |
| Notes | Single‐centre study Cross‐over between treatment groups: no Sample size calculation: not reported Sources of funding: not reported |
|
| Risk of bias | ||
| Bias | Authors' judgement | Support for judgement |
| Random sequence generation (selection bias) | Low risk | Randomisation table applied |
| Allocation concealment (selection bias) | Unclear risk | Not reported |
| Blinding of participants and personnel (performance bias) All outcomes | High risk | No blinding; open‐label trial |
| Blinding of outcome assessment (detection bias) All outcomes | High risk | No blinding; open label trial |
| Incomplete outcome data (attrition bias) All outcomes | Low risk | Missing data are unlikely to affect outcome results |
| Selective reporting (reporting bias) | Low risk | No protocol was available, but all expected outcomes were reported |
| Other bias | Low risk | Trial appears to be free of other bias components |
Calmus 2010.
| Methods | Trial design: randomised prospective open‐label clinical trial Language: English Type of information: journal articles Judgement of the quality: high risk of bias |
|
| Participants | Setting: 13 transplant centres in France Allocation of participants: 207 participants, 106 allocated to daclizumab and delayed tacrolimus and 101 allocated to no intervention. 8 participants in the daclizumab group withdrawn from analysis Sex ratio: daclizumab 77 (79%) males, 21 (21%) females Control: 74 (73%) males, 27 (27%) females Mean age: daclizumab 52 ± 10 years, control 54 ± 9 years Indication (No. (%)): Cirrhosis: daclizumab 48 (49%), control 54 (55%) Hepatitis C virus: daclizumab 10 (10%), control 12 (12%) Alcoholic: daclizumab 31 (32%), control 31 (31%) Hepatocellular carcinoma: daclizumab 43 (44%), control 38 (38%) Other: daclizumab 7 (7%), control 8 (8%) Type of donor: living and deceased donors Inclusion criteria: Patients between the ages of 18 and 60 years who were scheduled to receive a primary, single‐organ liver transplant (including split liver transplant) from a living or a deceased donor were eligible Exclusion criteria: recipient of a multi‐organ transplant or a previous organ transplant; SrC level greater than 180 mol/L at 12 hours post transplant; malignancy or history of neoplastic disease except hepatocellular carcinoma, in situ epithelioma, or low‐grade cutaneous carcinoma; ABO incompatibility; positive for HIV; and use of induction with other antibody preparations |
|
| Interventions | Intervention A: 2 doses of daclizumab were administered. The first dose of 2.0 mg/kg was administered at 12 hours post transplant, the second dose of 1.0 mg/kg was administered between days 7 and 10. Delayed tacrolimus Intervention B: no intervention. Standard tacrolimus Concomitant immunosuppressive treatment: Tacrolimus was administered starting on day 5 in the daclizumab and delayed tacrolimus group and on day 0 in the standard tacrolimus group. The initial dose of tacrolimus was 0.075 mg/kg twice daily in both groups. Subsequent doses were administered to obtain recommended trough levels of 10‐20 ng/mL during the first 4 weeks and 5‐15 ng/mL thereafter. Maintenance doses of tacrolimus were adjusted on the basis of clinical evidence of efficacy and the occurrence of adverse events. Both groups started mycophenolate mofetil at a dose of 1 g twice daily from day 0‐14. Thereafter, doses were 0.5 g twice daily until day 56. Steroids were initiated at 15‐20 mg/d until the end of month 1, decreased to 10‐15 mg/d until the end of month 2, and then decreased to 5‐10 mg/d for the remainder of the study |
|
| Outcomes | Primary outcome was the incidence of a mean serum creatinine level greater than 130 mol/L at 6 months. For this analysis, the mean of 2 consecutive values during the last week of the controlled trial (between days 162 and 168) was calculated. In instances of participant withdrawal or dropout, the last 2 available consecutive serum creatinine values were used for calculation. A benefit for renal function was defined as a mean serum creatinine value less than or equal to 130 mol/L at 6 months. Secondary outcomes included acute rejection, incidence and time to first biopsy‐proven acute rejection, participant and graft survival, serum creatinine, estimated glomerular filtration rate using the Cockcroft‐Gault formula (16), post‐transplant diabetes mellitus (defined as treatment with insulin for 30 consecutive days), hypertension (defined as diastolic blood pressure 90 mm Hg or systolic blood pressure 140 mm Hg, or a patient receiving treatment for hypertension), and adverse events. Participants were assessed at baseline and on days 1, 5, 14, 28, 84, and 168 | |
| Notes | Multi‐centre study Cross‐over between treatment groups: no Sample size calculation: yes Sources of funding: supported by Astellas Pharma, France. The study sponsor was involved in the design of the study, analysis of the data, and preparation of the manuscript |
|
| Risk of bias | ||
| Bias | Authors' judgement | Support for judgement |
| Random sequence generation (selection bias) | Low risk | Computer‐generated randomisation |
| Allocation concealment (selection bias) | Low risk | Sealed envelopes |
| Blinding of participants and personnel (performance bias) All outcomes | High risk | No blinding; open‐label |
| Blinding of outcome assessment (detection bias) All outcomes | High risk | No blinding; open‐label |
| Incomplete outcome data (attrition bias) All outcomes | Low risk | Eight randomly assigned participants were excluded from intention‐to‐treat analysis, but missing data are unlikely to affect outcome results |
| Selective reporting (reporting bias) | Low risk | No protocol was available, but all expected outcomes were reported |
| Other bias | High risk | Supported by Astellas Pharma, France. Study sponsor was involved in design of the study, analysis of the data, and preparation of the manuscript |
Cosimi 1990.
| Methods | Trial design: randomised clinical trial Language: English Type of information: journal article Judgement of the quality: high risk of bias |
|
| Participants | Setting: Boston Center for Liver Transplantation (3 institutions), Chicago, IL, USA Allocation of participants: 88 participants, 43 allocated to muromonab‐CD3 (OKT3®) and 45 allocated to no intervention Sex ratio: muromonab‐CD3 22 (58%) males, 16 (42%) females Control: 21 (51%) males, 20 (49%) females Mean age: muromonab‐CD3 47 ± 13 years, control 45 ± 12 years Indication (No. (%)): Chronic active hepatitis: muromonab‐CD3 10 (26%), control 10 (24%) Primary biliary cirrhosis: muromonab‐CD3 5 (13%), control 6 (15%) Neoplasm: muromonab‐CD3 5 (13%), control 2 (5%) Alcoholic cirrhosis: muromonab‐CD3 6 (16%), control 6 (15%) Cryptogenic cirrhosis: muromonab‐CD3 3 (8%), control 4 (10%) Autoimmune cirrhosis: muromonab‐CD3 2 (5%), control 1 (2%) Fulminant hepatitis: muromonab‐CD3 2 (5%), control 2 (5%) Sclerosing cholangitis: muromonab‐CD3 3 (8%), control 6 (15%) Genetic defect: muromonab‐CD3 2 (5%), control 4 (10%) Type of donor: 100% cadaveric donor Inclusion criteria: all patients eligible for liver transplantation |
|
| Interventions | Intervention A: muromonab‐CD3 5 mg/d was given the first 10‐14 postoperative days. 3 days before discontinuation of muromonab‐CD3, oral cyclosporine was started at a dose of 12‐15 mg/kg per day Intervention B: No muromonab‐CD3 was given. Participants received intravenous cyclosporine 1‐4 mg/kg per day, starting on the day of transplantation, with oral cyclosporine (12‐15 mg/kg/d) added as soon as it could be tolerated Concomitant immunosuppressive treatment: Azathioprine was initiated at a loading dose of 5 mg/kg and then was maintained at 1‐2 mg/kg per day. Methylprednisolone sodium succinate or prednisone 200 mg was administered on the day of transplantation. The dosage was then reduced by daily decrements of 40 mg to a maintenance dosage of 0.3 mg/kg per day |
|
| Outcomes | Early rejection episodes, renal function, infection | |
| Notes | Multi‐centre study (3 Boston institutions) Cross‐over between treatment groups: no Sample size calculation: not reported Sources of funding: not reported No intention to treat; 5 participants in the muromonab‐CD3 group died within 48 hours after surgery and were excluded from analysis. 3 patients in the control group died within 48 hours after surgery and were excluded from analysis. 1 control participant required retransplantation on day 2 for primary allograft non‐function and was excluded from analysis |
|
| Risk of bias | ||
| Bias | Authors' judgement | Support for judgement |
| Random sequence generation (selection bias) | Unclear risk | Not specified |
| Allocation concealment (selection bias) | Unclear risk | Not reported |
| Blinding of participants and personnel (performance bias) All outcomes | High risk | No blinding |
| Blinding of outcome assessment (detection bias) All outcomes | High risk | No blinding |
| Incomplete outcome data (attrition bias) All outcomes | Unclear risk | 8 randomly assigned participants were excluded from analysis |
| Selective reporting (reporting bias) | Low risk | No protocol was available, but all expected outcomes were reported |
| Other bias | Low risk | Trial appears to be free of other bias components |
Eghtesad 2011.
| Methods | Trial design: a pilot 3‐armed randomised open‐label clinical trial Language: English Type of information: abstract Judgement of the quality: high risk of bias |
|
| Participants | Setting: The Cleveland Clinic, Clevaland, OH, USA Allocation of participants: 30 participants; high dose rabbit antithymocyte globulin (Thymoglobulin®) with delayed start of tacrolimus (n = 10); low dose rabbit antithymocyte globulin (Thymoglobulin®) with delayed start of tacrolimus (n = 10), and standard tacrolimus and no T‐cell specific antibody induction (n = 10) Sex ratio: not reported Mean age: not reported Indication (No. (%)): Hepatitis C virus–related cirrhosis: high dose antithymocyte globulin 6 (60%); low dose antithymocyte globulin 5 (50%); control 3 (30%) Type of donor: 100% cadaveric donor Inclusion criteria: adults undergoing deceased donor solitary liver transplantation, between 18 and 70 years of age at time of transplantation, hepatitis C–positive and –negative, hepatocellular carcinoma as indication for liver transplantation within the MIlan criteria, willingness to comply with study procedures and able to sign informed consent Exclusion criteria: prior kidney transplantation, congenital or iatrogenic absence of 1 kidney, individuals at renal replacement therapy at the time of transplantation, MELD (model of end‐stage liver disease) score greater than 28, HIV‐positive patients, patients with current severe systemic infection, history of bacterial peritonitis within 30 days before liver transplantation, active infection or recent infection within 30 days before liver transplantation, use of calcineurin inhibitor continuously for longer than 90 days within the past 6 months, history of hypersensitivity to thymoglobulin, rabbits, tacrolimus, or iohexol; women of childbearing age who are unwilling to use effective contraceptive methods during the duration of the study |
|
| Interventions | Intervention A: antithymocyte globulin 1.5 mg/kg days 0, 2, and 4. Tacrolimus delayed until day 10 Intervention B: antithymocyte globulin 1.5 mg/kg days 0 and 2. Tacrolimus delayed until day 10 Control group: no T‐cell specific antibody induction, tacrolimus initiated within 48 hours post transplant Concomitant immunosuppressive treatment: In the intervention groups, tacrolimus was started at day 10 and continued beyond 180 days, trough concentration 3‐8 ng/mL In the control group, tacrolimus was initiated within 48 hours after transplantation. Trough concentration 8‐12 ng/mL on days 0‐10. Trough concentration 6‐12 ng/mL on days 11‐30. Trough concentration 6‐10 ng/mL on days 31‐60. Trough concentration 5‐8 ng/mL on days 61‐179. Trough concentration 3‐8 ng/mL beyond day 180 Mycophenolate mofetil 1000 mg PO/IV twice daily for up to 6 months Corticosteroids |
|
| Outcomes | Primary: reduced incidence of perioperative acute kidney injury in participants undergoing liver transplant as evidenced by kidney function measurement at 30 days Secondary: participant survival at 12 months, graft survival at 12 months, allograft rejection rates at 30 days and 6 and 12 months as proven by biopsy, renal function measured by eGFR (estimated glomerular filtration rate) at 1 year |
|
| Notes | Single‐centre study Cross‐over between treatment groups: no Sample size calculation: not reported Sources of funding: Genzyme, manufacturer of thymoglobulin, was reported to be collaborator on the trial |
|
| Risk of bias | ||
| Bias | Authors' judgement | Support for judgement |
| Random sequence generation (selection bias) | Unclear risk | Randomised, not otherwise reported |
| Allocation concealment (selection bias) | Unclear risk | Randomised, not otherwise reported |
| Blinding of participants and personnel (performance bias) All outcomes | High risk | Open‐label |
| Blinding of outcome assessment (detection bias) All outcomes | High risk | Open‐label |
| Incomplete outcome data (attrition bias) All outcomes | Low risk | No participants were lost to follow‐up |
| Selective reporting (reporting bias) | Low risk | Trial protocol was assessed, and all predefined outcomes were reported |
| Other bias | High risk | Trial was industry sponsored |
Farges 1994.
| Methods | Trial design: randomised clinical trial Language: English/French. Type of information: journal article Judgement of the quality: high risk of bias |
|
| Participants | Setting: 8 transplant centres in Europe and Australia Allocation of participants: 96 participants, 46 allocated to muromonab‐CD3 (OKT3®) and 50 allocated to no intervention Sex ratio: muromonab‐CD3 26 (59%) males, 18 (41%) females Control: 29 (58%) males, 21 (42%) females Mean age: muromonab‐CD3 40 ± 12 years, control 40 ± 16 years Indication (No. (%)): Post‐hepatitic cirrhosis: muromonab‐CD3 15 (34%), control 14 (28%) Primary biliary cirrhosis: muromonab‐CD3 8 (18%), control 10 (20%) Primary hepatic neoplasm: muromonab‐CD3 2 (5%), control 2 (5%) Alcoholic cirrhosis: muromonab‐CD3 2 (5%), control 8 (16%) Other cirrhosis: muromonab‐CD3 6 (14%), control 4 (8%) Autoimmune cirrhosis: muromonab‐CD3 2 (5%), control 1 (2%) Fulminant hepatitis: muromonab‐CD3 2 (5%), control 2 (5%) Sclerosing cholangitis: muromonab‐CD3 4 (9%), control 4 (8%) Congenital bile duct disorder: muromonab‐CD3 3 (7%), control 4 (8%) Alveolar echinococcosis: muromonab‐CD3 3 (7%), control 3 (6%) Metabolic disorder: muromonab‐CD3 1 (2%), control 1 (2%) Type of donor: not reported Inclusion criteria: first ABO‐compatible liver transplantation Exclusion criteria: patients older than 65 years of age; pregnant or lactating; patients who previously had received a transplant or had been treated with muromonab‐CD3; patients who had been transplanted with an ABO‐incompatible graft; patients transplanted for acute or subacute liver failure; patients who were leukopenic at the time of transplantation; patients who were fluid overloaded on chest x‐ray |
|
| Interventions | Intervention A: Muromonab CD‐3 was given from day 0 (within 12 hours after transplantation) through day 13 by intravenous push at a dosage of 5 mg/d if the participant's weight was greater than 30 kg, or 2.5 mg/d if the participant's weight was less than 30 kg Cyclosporine was started at day 11 as adapted to maintain whole blood levels of 250‐300 ng/mL (HPLC) or 1000 ng/mL (RIA) Intervention B: No muromonab‐CD3 was given. Cyclosporine was started at day 0 at a dosage of 0.3 mg/kg/d, and thereafter was adapted according to blood levels Concomitant immunosuppressive treatment: Azathioprine was administered immediately before anaesthesia and on day 0 (1.5 mg/kg), increased from day 1 to day 10 (2‐3 mg/kg), and from day 11 decreased to the maintenance level or discontinued at the discretion of each investigator (provided doses were the same in both arms for the same time) Methylprednisolone sodium succinate 5 mg/kg IV given before anaesthesia, on day 0 and day 1. Prednisone was administered on day 2 (2.5 mg/kg) and was decreased (40 mg/d) to reach 0.3 mg/kg/day on days 7 to 8. After day 11, the dose was tapered to the maintenance level |
|
| Outcomes | Graft rejection, septic complications, kidney dysfunction, participant and graft survival | |
| Notes | Multi‐centre study Cross‐over between treatment groups: no Sample size calculation: not reported Sources of funding: not reported No intention to treat; 2 participants in the muromonab‐CD3 group received outdated muromonab‐CD3 and were excluded from analysis |
|
| Risk of bias | ||
| Bias | Authors' judgement | Support for judgement |
| Random sequence generation (selection bias) | Unclear risk | Not specified |
| Allocation concealment (selection bias) | Unclear risk | Not reported |
| Blinding of participants and personnel (performance bias) All outcomes | High risk | No blinding |
| Blinding of outcome assessment (detection bias) All outcomes | High risk | No blinding |
| Incomplete outcome data (attrition bias) All outcomes | Low risk | 2 randomly assigned participants were excluded from analysis, but missing data are unlikely to affect outcome results |
| Selective reporting (reporting bias) | Low risk | No protocol was available, but all expected outcomes were reported |
| Other bias | Low risk | Trial appears to be free of other bias components |
Fasola 2005.
| Methods | Trial design: randomised trial Language: English Type of information: abstract Judgement of the quality: high risk of bias |
|
| Participants | Setting: Liver Transplantation Services, Emory Healthcare, Atlanta, GA, USA Allocation of participants: 70 participants, 3 groups; 32 allocated to daclizumab single dose, 14 allocated to daclizumab multiple doses, 24 allocated to no intervention Sex ratio: not reported Mean age: not reported Indication (No. (%)): Hepatitis C: daclizumab single dose 32 (100%), daclizumab multiple doses 14 (100%), control 24 (100%) Type of donor: not reported Inclusion criteria: adult hepatitis C–positive liver transplant recipients Exclusion criteria: not specified |
|
| Interventions | Intervention A: daclizumab (Zenapax®) single dose 1 mg/kg on postoperative day 1 Intervention B: daclizumab (Zenapax®) multiple doses; on postoperative day 1 (2 mg/kg), postoperative day 3 (2 mg/kg), and postoperative day 8 (1 mg/kg) Intervention C: no intervention Concomitant immunosuppressive treatment: Tacrolimus, corticosteroids, and mycophenolate mofetil |
|
| Outcomes | 1‐year survival, graft loss, acute rejection, renal function, and hepatitis C virus recurrence | |
| Notes | Single‐centre study Cross‐over between treatment groups: no Sample size calculation: not reported Sources of funding: not reported |
|
| Risk of bias | ||
| Bias | Authors' judgement | Support for judgement |
| Random sequence generation (selection bias) | Unclear risk | Participants were randomly allocated |
| Allocation concealment (selection bias) | Unclear risk | Not reported |
| Blinding of participants and personnel (performance bias) All outcomes | Unclear risk | Not reported |
| Blinding of outcome assessment (detection bias) All outcomes | Unclear risk | Not reported |
| Incomplete outcome data (attrition bias) All outcomes | Low risk | No participants lost to follow‐up |
| Selective reporting (reporting bias) | Low risk | No protocol was available, but all expected outcomes were reported |
| Other bias | Low risk | Trial appears to be free of other bias components |
Langrehr 1997.
| Methods | Trial design: randomised clinical trial Language: English Type of information: journal articles Judgement of the quality: high risk of bias |
|
| Participants | Setting: Charité Campus Virchow Klinikum, Berlin, Germany Allocation of participants: 80 participants, 39 allocated to BT563 and 41 allocated to antithymocyte globulin Sex ratio: BT563 26 (67%) males, 13 (33%) females Control: 26 (63%) males, 15 (37%) females Mean age: BT563 43 ± 4 years, antithymocyte globulin 39 ± 4 years. Indication (No. (%)): Hepatitis B virus: BT563 5 (13%), antithymocyte globulin 9 (22%) Hepatitis C virus: BT563 4 (10%), antithymocyte globulin 4 (10%) NANBNC cirrhosis: BT563 1 (3%), antithymocyte globulin 3 (7%) Alcoholic cirrhosis: BT563 11 (28%), antithymocyte globulin 8 (20%) Autoimmune cirrhosis: BT563 1 (3%), antithymocyte globulin 1 (2%) Cryptogenic cirrhosis: BT563 1 (3%), antithymocyte globulin 3 (7%) Biliary cirrhosis: BT563 4 (10%), antithymocyte globulin 4 (10%) Sclerosing cholangitis: BT563 3 (8%), antithymocyte globulin 3 (7%) Metabolic disorders: BT563 1 (3%), antithymocyte globulin 0 (0%) Malignant disease: BT563 7 (18%), antithymocyte globulin 3 (7%) Miscellaneous: BT563 1 (3%), antithymocyte globulin 3 (7%) Type of donor: 100% cadaveric donor Inclusion criteria: adult recipients of primary liver transplants Exclusion criteria: combined liver‐kidney transplantation |
|
| Interventions | Intervention A: BT563 was started as continuous infusion at a dose of 10 mg/d. From postoperative day 7 until postoperative day 12, time of administration was reduced to 6 hours daily to allow mobilisation of the participant. Duration of administration was chosen on the basis of previous reports that development of antimurine antibodies reduced BT563 plasma levels to below the detection range after this period Intervention B: ATG was started after surgery at a dosage of 5 mg/kg/d and was infused over 6 hours. After 7 days, ATG therapy was ceased because of the known increase in infectious complications following prolonged administration of polyclonal anti‐T cell preparations Concomittant immunosuppressive treatment: Cyclosporine was started between 6 hours and 48 hours after orthotopic liver transplantation at a dose of 2 × 1 mg/kg body weight iv. Oral administration of cyclosporine was begun after the T‐tube was clamped, usually at postoperative day 5, at a dose of 5‐7 mg/kg bid, and adjusted according to polyclonal whole blood levels to reach 600‐900 ng/mL. After 3 months, cyclosporine was tapered down to reach maintenance trough levels of 300‐600 ng/mL. During surgery, an intravenous bolus of 500 mg of prednisolone was given. At 6 hours after surgery, a 250‐mg bolus was added. Steroid dosage was tapered from 1 mg/kg body weight on postoperative days 1‐3 to 25 mg after 1 week, 20 mg after 2 weeks, 15 mg after 2 months, and according to individual needs thereafter. Before surgery, 150 mg of azathioprine was administered. After surgery, 25 mg of azathioprine was given daily as long as ATG or anti‐IL‐2R was infused. Subsequently, dosage was increased to 1‐2 mg/kg/d and was adjusted according to leukocyte count; consequently, dosage was increased to 1‐2 mg/kg/d and was adjusted according to leukocyte counts |
|
| Outcomes | Survival, graft survival, rejection, infectious complications, tolerance to treatment | |
| Notes | Single‐centre study Cross‐over between treatment groups: no Sample size calculation: no Sources of funding: not reported |
|
| Risk of bias | ||
| Bias | Authors' judgement | Support for judgement |
| Random sequence generation (selection bias) | Unclear risk | Not reported |
| Allocation concealment (selection bias) | Unclear risk | Not reported |
| Blinding of participants and personnel (performance bias) All outcomes | Unclear risk | Not reported |
| Blinding of outcome assessment (detection bias) All outcomes | Unclear risk | Not reported |
| Incomplete outcome data (attrition bias) All outcomes | Low risk | Participants lost to follow‐up addressed, and missing data are unlikely to affect outcome results |
| Selective reporting (reporting bias) | Low risk | No protocol was available, but all expected outcomes were reported |
| Other bias | Low risk | Trial appears to be free of other bias components |
Langrehr 1998.
| Methods | Trial design: randomised, placebo‐controlled clinical trial Language: English Type of information: journal articles Judgement of the quality: high risk of bias |
|
| Participants | Setting: Charité Campus Virchow Klinikum, Berlin, Germany Allocation of participants: 40 participants, 19 allocated to BT563 and 21 allocated to control Sex ratio: BT563 11 (58%) males, 8 (42%) females Control: 11 (52%) males, 10 (48%) females Mean age: BT563 42 (range 18‐60) years, control 54 (range‐65) years Indication (No. (%)): Hepatitis B virus: BT563 1 (5%), control 4 (19%) Hepatitis C virus: BT563 3 (16%), control 1 (5%) Alcoholic cirrhosis: BT563 3 (16%), control 5 (24%) Autoimmune cirrhosis: BT563 1 (5%), control 0 (0%) Cryptogenic cirrhosis: BT563 1 (5%), control 2 (10%) Biliary cirrhosis: BT563 0 (0%), control 3 (14%) Sclerosing cholangitis: BT563 2 (11%), control 0 (0%) Malignant disease: BT563 1 (5%), control 3 (14%) Acute liver failure: BT563 4 (21%), control 3 (14%) Budd‐Chiari syndrome: BT563 2 (11%), control 0 (0%) Type of donor: 100% cadaveric donor Inclusion criteria: adult recipients of orthotopic liver transplants Exclusion criteria: not specified |
|
| Interventions | Intervention A: Interleukin‐2 receptor antibody BT563 was administered as a continuous infusion at 10 mg per day for 12 days Intervention B: Placebo was provided in identical vials as BT563 and was administered as a continuous infusion at 10 mg per day for 12 days Concomitant immunosuppressive treatment: Cyclosporine was started intravenously at a dose of 2 × 1 mg/kg bodyweight, and oral administration of cyclosporine was begun after the T‐tube had been clamped. Dose was adjusted according to whole blood levels. Intravenous bolus of 500 mg prednisolone was given intraoperatively and 6 hours postoperatively; a 250‐mg bolus was added, followed by standard steroid taper. Preoperatively, 150 mg azathioprine was administered, and postoperatively 25 mg was given daily as long as BT563 or placebo was infused. Subsequently, dosage was increased to 1‐2 mg/kg/d and was adjusted according to leukocyte counts |
|
| Outcomes | Outcomes: survival, acute cellular rejection, steroid‐resistant rejection, chronic rejection, sepsis, pneumonia, cholangitis, urinary tract infection, CMV infection | |
| Notes | Single‐centre study Cross‐over between treatment groups: no Sample size calculation: no Sources of funding: not reported |
|
| Risk of bias | ||
| Bias | Authors' judgement | Support for judgement |
| Random sequence generation (selection bias) | Unclear risk | Not reported |
| Allocation concealment (selection bias) | Unclear risk | Not reported |
| Blinding of participants and personnel (performance bias) All outcomes | Unclear risk | Placebo‐controlled trial |
| Blinding of outcome assessment (detection bias) All outcomes | Unclear risk | Placebo‐controlled trial |
| Incomplete outcome data (attrition bias) All outcomes | Low risk | Participants lost to follow‐up were addressed, and missing data are unlikely to affect outcome results |
| Selective reporting (reporting bias) | Low risk | No protocol was available, but all expected outcomes were reported |
| Other bias | Low risk | Trial appears to be free of other bias components |
Lerut 2005.
| Methods | Trial design: randomised open‐label clinical trial Language: English Type of information: journal article Judgement of the quality: high risk of bias |
|
| Participants | Setting: University of Louvain, Brussels, Belgium Allocation of participants: 40 participants, 20 allocated to anti‐CD2 monoclonal rat antibody (anti‐CD2, mAB, LO‐CD2a) and 20 allocated to no intervention Sex ratio: total 26 (65%) males, 14 (35%) females Median age: total 50 years (range 16‐68) Indication (No. (%)): Hepatocellular: anti‐CD2 mAb 12 (60%), control 7 (35%) Cholestatic: anti‐CD2 mAb 5 (25%), control 9 (45%) Metabolic: anti‐CD2 mAb 2 (10%), control 3 (15%) Toxic: anti‐CD2 mAb 1 (5%), control 1 (5%) Type of donor: living‐related donor: basiliximab 0 (0%), control 1 (5%) Inclusion criteria: adults (age 15 years) who underwent primary liver transplantation for chronic benign end‐stage liver disease Exclusion criteria: patients with malignant disease |
|
| Interventions | Intervention A: anti‐CD2 mAb. The first anti‐CD2 mAb dose was given intraoperatively after allograft reperfusion as soon as haemodynamic stability and haemostasis were obtained. The mAb was administered for 10 days as a single daily intravenous (iv) dose of 10 mg Intervention B: no intervention Concomitant immunosuppressive treatment: First oral tacrolimus dose was given the first evening or morning following the end of the transplant procedure. Tacrolimus trough levels between 6 and 10 ng/mL were sought Low‐dosage tacrolimus level was defined as a level below the generally accepted level of 6 ng/mL Hydrocortisone (400 mg intravenously) was administered perioperatively, followed by 200 mg per day during the first 3 days. Methylprednisolone treatment was started on day 4 at a dose of 16 mg. Steroids were tapered from day 21 onwards by 4 mg to be stopped in all participants within 6 months, independently of any previously occurring immunological event |
|
| Outcomes | Primary outcome of the study was incidence of rejection at day 7 and at 3‐12 months. Secondary outcomes were 3‐, 12‐, and 60‐month participant and graft survival rates, incidences of corticosteroid‐resistant rejection, steroid withdrawal, tacrolimus monotherapy, low‐dosage tacrolimus (6 ng/mL) or cyclosporine (100 ng/mL trough level) monotherapy, and infectious or tumour complications during follow‐up | |
| Notes | Single‐centre study Cross‐over between treatment groups: no Sample size calculation: yes Sources of funding: supported in part by a grant from BioTransplant Incorporation |
|
| Risk of bias | ||
| Bias | Authors' judgement | Support for judgement |
| Random sequence generation (selection bias) | Unclear risk | Not reported |
| Allocation concealment (selection bias) | Low risk | Serially numbered, sealed opaque envelopes |
| Blinding of participants and personnel (performance bias) All outcomes | High risk | Open‐label trial |
| Blinding of outcome assessment (detection bias) All outcomes | High risk | Open‐label trial |
| Incomplete outcome data (attrition bias) All outcomes | Low risk | Participants lost to follow‐up were addressed, and missing data are unlikely to affect outcome results |
| Selective reporting (reporting bias) | Low risk | No protocol was available, but all expected outcomes were reported |
| Other bias | High risk | Trial is partly industry sponsored |
Mc Diarmid 1991.
| Methods | Trial design: randomised clinical trial Language: English Type of information: journal article Judgement of the quality: high risk of bias |
|
| Participants | Setting: UCLA, School of Medicine, Los Angeles, CA, USA Allocation of participants: 88 participants, 46 allocated to muromonab‐CD3 (OKT3®) and 39 allocated to no intervention: 3 participants were excluded Sex ratio: not reported Mean age: not reported Indication (No. (%)): not reported Type of donor: 100% cadaveric donor Inclusion criteria: all participants receiving their first ABO identical liver graft Exclusion criteria: previous exposure to muromonab‐CD3, age greater than 65 years, pregnancy, pretransplant chest roentgenogram showing pulmonary oedema |
|
| Interventions | Intervention A: Muromonab CD‐3 5 mg/d (2.5 mg/d for participants weighing less than 30 kg) was given days 0‐14 post transplant. The first dose of muromonab‐CD3 was given intraoperatively immediately after reperfusion of the liver graft. On day 11, cyclosporine, 10 mg/kg/d, was given orally, and the dose was then adjusted to achieve therapeutic levels (trough serum 250‐350 ng/mL) by day 14, when muromonab‐CD3 was discontinued Intervention B: No muromonab‐CD3 was given. Participants received preoperatively 15 mg/kg cyclosporine orally or 3 mg/kg intravenously, followed by 3 to 5 mg/kg/d intravenous cyclosporine given as a 4‐hour infusion, with conversion to oral cyclosporine (10 mg/kg/d) when oral intake was tolerated. Doses were adjusted daily to keep trough levels of 250‐350 ng/mL Concomitant immunosuppressive treatment: Azathioprine 1 mg/kg/d was initiated at day 0 and was continued throughout. Methylprednisolone was started at 200 mg/d and was tapered over 6 days to 0.3 mg/kg/d |
|
| Outcomes | Acute rejection episodes, renal function | |
| Notes | Single‐centre study Cross‐over between treatment groups: yes, 2 patients from muromonab‐CD3.group to control group Sample size calculation: not reported Sources of funding: not reported No intention to treat; participants with graft survival less than 7 days were excluded from the analysis |
|
| Risk of bias | ||
| Bias | Authors' judgement | Support for judgement |
| Random sequence generation (selection bias) | Unclear risk | Not specified |
| Allocation concealment (selection bias) | Low risk | Sealed envelopes |
| Blinding of participants and personnel (performance bias) All outcomes | High risk | No blinding |
| Blinding of outcome assessment (detection bias) All outcomes | Unclear risk | Partial blinding, as only the pathologists who examined the liver biopsy specimens were blinded to study drug assignment |
| Incomplete outcome data (attrition bias) All outcomes | High risk | Participants with graft loss within 7 days after transplantation were excluded from analysis |
| Selective reporting (reporting bias) | Low risk | No protocol was available, but all expected outcomes were reported |
| Other bias | Low risk | Trial appears to be free of other bias components |
Nashan 1996.
| Methods | Trial design: randomised phase III clinical trial Language: English Type of information: Journal articles Judgement of the quality: high risk of bias |
|
| Participants | Setting: Medizinische Hochschule Hannover, Hannover, Germany Allocation of participants: 32 participants, 16 allocated to BT563 and 16 allocated to antithymocyte globulin Sex ratio: BT563 7 (44%) males, 9 (56%) females Antithymocyte globulin: 6 (37.5%) males, 10 (62.5%) females Mean age: BT563 47 (range 24‐66) years, antithymocyte globulin 46 (range 25‐66) years Indication (No. (%)): Hepatitis B virus: BT563 4 (25%), antithymocyte globulin 3 (19%) Hepatitis C virus: BT563 2 (13%), antithymocyte globulin 3 (19%) NANBNC cirrhosis: BT563 1 (6%), antithymocyte globulin 0 (0%) Autoimmune cirrhosis: BT563 1 (6%), antithymocyte globulin 1 (6%) Alcohol: BT563 2 (13%), antithymocyte globulin 0 (0%) Biliary cirrhosis: BT563 2 (13%), antithymocyte globulin 3 (19%) Sclerosing cholangitis: BT563 0 (0%), antithymocyte globulin 2 (13%) Budd‐Chiari: BT563 1 (6%), antithymocyte globulin 0 (0%) Wilson's disease: BT563 0 (0%), antithymocyte globulin 1 (6%) Malignant disease: BT563 3 (19%), antithymocyte globulin 3 (19%) Polycystic liver disease: BT563 1 (6%), antithymocyte globulin 0 (0%) Type of donor: 100% cadaveric donor Inclusion criteria: patients with benign and malignant liver disease Exclusion criteria: patients younger than 18 years of age or receiving a second transplant |
|
| Interventions | Intervention A: BT563 for 12 days at a daily dosage of 10 mg given intravenously for 24 hours, starting 6 hours after reperfusion. BT563 (Fa. Biotest, Dreieich, Germany) is an IgG1, kappa moAb of murine origin (clone BB10) that binds to the alpha‐chain of the interleukin‐2 receptor (CD25) Intervention B: Antithymocyte globulin (Fresenius, Bad Homburg, Germany) was started 6 hours after reperfusion intravenously at a dosage of 5 mg/kg for 6 hours. ATG course was limited to 7 days Concomitant immunosuppressive treatment: Cyclosporine was started 6 hours postoperatively at a daily dosage of 1‐2 mg/kg intravenously and was converted to oral administration after clamping of the T‐tube. After day 3 of therapy, dosages were adjusted to whole blood trough levels measured using the specific monoclonal RIA and the non‐specific monoclonal RIA (Incstar, Stillwater, MN), aiming for specific whole blood trough levels of 100‐200 ng/mL and non‐specific whole blood trough levels < 1200 ng/mL. Methylprednisolone 500 mg was given intravenously during the operation; at days 1‐3, 1 mg/kg prednisolone was administered. After day 4, 0.5 mg/kg prednisolone was administered until day 10, then it was tapered every 10 days by 0.05 mg/kg until maintenance dose of 0.15 mg/kg was achieved |
|
| Outcomes | Primary objective: incidences of acute rejection and infection Secondary objectives: safety and tolerability of BT563 |
|
| Notes | Single‐centre study Cross‐over between treatment groups: no Sample size calculation: no Sources of funding: Deutsche Forschungsgemeinschaft Sonderforschungsbereich 265 |
|
| Risk of bias | ||
| Bias | Authors' judgement | Support for judgement |
| Random sequence generation (selection bias) | Unclear risk | Not reported |
| Allocation concealment (selection bias) | Unclear risk | Not reported |
| Blinding of participants and personnel (performance bias) All outcomes | Unclear risk | Not specified |
| Blinding of outcome assessment (detection bias) All outcomes | Unclear risk | Not specified |
| Incomplete outcome data (attrition bias) All outcomes | Low risk | Missing data are unlikely to affect outcome results |
| Selective reporting (reporting bias) | Low risk | No protocol was available, but all expected outcomes were reported |
| Other bias | Low risk | Trial appears to be free of other bias components |
Neuberger 2009.
| Methods | Trial design: randomised, open‐label, clinical trial Language: English Type of information: journal articles Judgement of the quality: high risk of bias |
|
| Participants | Setting: 30 transplant centres in 9 countries Allocation of participants: 342 participants, 172 allocated to daclizumab and delayed tacrolimus and 170 allocated to no intervention. 4 participants in the daclizumab group and 2 participants in the control group were withdrawn from analysis Sex ratio: daclizumab 116 (69%) males, 52 (31%) females Control: 109 (65%) males, 59 (35%) females Mean age: daclizumab 55 (range 26‐70) years, control 54 (range 18 to 73) years Indication (No. (%)): Alcoholic liver disease: daclizumab 76 (45%), control 72 (43%) Primary biliary cirrhosis: daclizumab 12 (7%), control 14 (8%) Sclerosing cholangitis: daclizumab 13 (8%), control 18 (11%) Hepatitis B: daclizumab 10 (6%), control 13 (8%) Hepatitis C: daclizumab 39 (23%), control 34 (20%) Hepatitis of unknown etiology: daclizumab 4 (2%), control 0 (0%) Fulminant hepatic failure: daclizumab 4 (2%), control 0 (0%) Hepatocellular carcinoma: daclizumab 38 (23%), control 38 (23%) Autoimmune hepatitis: daclizumab 6 (4%), control 5 (3%) Other: daclizumab 28 (17%), control 28 (17%) Type of donor: Deceased heart beating: daclizumab 146 (87%), control 131 (78%) Deceased non‐heart beating: daclizumab 19 (11%), control 28 (17%) Living‐related: daclizumab 1 (1%), control 3 (2%) Living unrelated: daclizumab 2 (1%), control 6 (4%) Inclusion criteria: older than 16 years of age, first orthotopic (whole or split) liver transplant, expected survival and graft survival longer than 7 days Exclusion criteria: serum creatinine concentration above 200 µmol/L on the day of transplant; need for renal replacement therapy within 30 days before transplant; ABO incompatibility, HIV positivity, or a previous history of malignancy other than adequately treated non‐melanoma skin cancer |
|
| Interventions | Intervention A: daclizumab (Zenapax®) 2 mg/kg within 12 hours after transplantation and a second dose of 1 mg/kg given at 7 days. Introduction of tacrolimus was delayed until the fifth postoperative day Intervention B: no intervention. Standard tacrolimus Concomitant immunosuppressive treatment: Tacrolimus; Initial oral doses were 0.05‐0.10 mg/kg/d and intravenous doses were 0.008‐0.04 mg/kg/d, adjusted to achieve target trough levels ≤8 ng/mL for the duration of the study. Corticosteroid therapy was administered according to local practice, and mycophenolate mofetil 1 g was given twice daily, intravenously for the first 5 days to ensure adequate therapeutic concentrations, then orally |
|
| Outcomes | Primary outcome was change from baseline in calculated creatinine clearance (estimated using the Cockcroft–Gault formula) at week 52. In addition, an assessment of renal function was made using an abbreviated modification of diet in renal disease (MDRD) formula based on estimations of glomerular filtration rate (GFR). Baseline creatinine clearance was the one obtained closest to and before transplant. A value of 15 mL/min was used in the calculation for participants on dialysis post transplant, when creatinine clearance was to be assessed Secondary outcomes included change from baseline in serum creatinine at 52 weeks post transplantation; change from baseline in calculated creatinine clearance at 26 weeks post transplantation; requirement for renal replacement therapy between 2 weeks and 52 weeks post transplantation; biopsy‐proven acute rejection (requiring pulse immunosuppression therapy) up to 26 weeks and 52 weeks post transplantation; composite endpoint of a 20% (or greater) decrease from baseline in calculated creatinine clearance, or acute rejection, or graft loss or death; acute rejection (biopsy‐proven or presumed on clinical grounds only) requiring increased immunosuppressive therapy during 26 and 52 weeks; time to first biopsy‐proven acute rejection requiring additional immunosuppression therapy up to 52 weeks; participant and graft survival at 52 weeks; time to graft loss or death up to 52 weeks; and incidence of histologically determined recurrence of underlying liver disease post transplantation. Participants were followed up to week 52, even if prematurely discontinuing study treatments | |
| Notes | Multi‐centre study Cross‐over between treatment groups: no Sample size calculation: yes 1 intervention group was excluded from the meta‐analysis, as differences in concomitant immunosuppressive treatment (e.g., no mycophenolate mofetil was administered) were noted Sources of funding: F. Hoffman‐La Roche Limited, Basel, Switzerland, and the University Hospital Birmingham NHS Trust, UK |
|
| Risk of bias | ||
| Bias | Authors' judgement | Support for judgement |
| Random sequence generation (selection bias) | Low risk | Randomisation list with blocks of 6 participants |
| Allocation concealment (selection bias) | Low risk | Participants were randomly assigned centrally |
| Blinding of participants and personnel (performance bias) All outcomes | High risk | Open‐label trial |
| Blinding of outcome assessment (detection bias) All outcomes | High risk | Open‐label trial |
| Incomplete outcome data (attrition bias) All outcomes | Low risk | Six participants were withdrawn from intention‐to‐treat analysis, but missing data are unlikely to affect outcome results |
| Selective reporting (reporting bias) | Low risk | No protocol was available, but all expected outcomes were reported |
| Other bias | High risk | Trial was partly industry sponsored |
Neuhaus 2002.
| Methods | Trial design: randomised clinical trial Language: English. Type of information: journal article Judgement of the quality: high risk of bias |
|
| Participants | Setting: European, Canadian, US trial including 30 centres Allocation of participants: 381 participants, 188 allocated to basiliximab and 193 allocated to placebo Sex ratio: basiliximab 124 (66%) males, 64 (34%) females Control: 117 (61%) males, 76 (39%) females Mean age: basiliximab 49 (20‐68) years; control 50 (20‐72) years Indication (No. (%)): Primary biliary cirrhosis: basiliximab 14 (7%), control 18 (9%) Sclerosing cholangitis: basiliximab 11 (6%), control 13 (7%) Viral hepatitis: basiliximab 65 (35%), control 67 (35%) Alcoholic cirrhosis: basiliximab 38 (20%), control 44 (23%) Other active hepatitis: basiliximab 47 (25%), control 38 (20%) Other indication: basiliximab 13 (7%), control 13 (7%) Type of donor: 100% cadaveric donor Inclusion criteria: first cadaveric ABO‐compatible liver transplantation Exclusion criteria: second or subsequent liver transplantation, multiple organ transplantation, pregnancy, history of malignancy, fulminant liver failure, severe active infection requiring systemic antibiotics, treatment with an investigational drug in the preceding month, treatment with an experimental immunosuppressive agent in the preceding 6 months, serological positivity for human immunodeficiency virus type 1 or 2, continuing drug abuse or mental dysfunction, myocardial infarction within 6 months before transplantation, or serum creatinine levels greater than 176.8 µmol/L (2.0 mg/dL) |
|
| Interventions | Intervention A: basiliximab 20 mg dissolved in 10 mL sterile water as 10‐second intravenous bolus injection on day 0 (within 6 hours after reperfusion of the graft) and on day 4 Intervention B: placebo Concomitant immunosuppressive treatment: Cyclosporine microemulsion, 15 mg/kg/d, was initiated postoperatively as 2 equally divided doses given 12 hours apart, then was adjusted to maintain whole blood therapeutic trough levels of 200‐400 ng/mL for the first 4 weeks and 150‐250 ng/mL thereafter Methylprednisolone was started intraoperatively (500 mg intravenously), followed by 200 mg of oral prednisolone day 1. This dose was reduced by 40 mg/d over days 2‐5 until 20 mg/d was reached, then was tapered over 6 months to a final dose of 10 mg/d |
|
| Outcomes | Primary efficacy assessment entailed a comparison of the number of participants within each treatment arm who experienced at least 1 (treated) biopsy‐proven acute rejection episode within 6 months of the start of study medication, along with first biopsy‐confirmed rejection or death or graft loss. In addition, problem‐free transplant (defined retrospectively) was the same composite end point, but with HCV recurrence defined by histopathologic diagnosis and clinical evidence added as a fourth component of treatment failure, reflecting its importance as a determinant of clinical outcome in liver transplantation. Secondary efficacy assessments included comparison of rates of death, graft loss, and incidence of biopsy‐confirmed acute rejection and steroid‐resistant acute rejection episodes up to 12 months. Other assessments included comparison of the safety and tolerability of study medication and rates of infection and malignancy | |
| Notes | Multi‐centre study Cross‐over between treatment groups: no Sample size calculation: yes Sources of funding: supported in part by a grant from Novartis Pharma |
|
| Risk of bias | ||
| Bias | Authors' judgement | Support for judgement |
| Random sequence generation (selection bias) | Low risk | Computer‐generated randomisation schedule, stratified into 2 cohorts: hepatitis C virus positive and hepatitis C virus negative |
| Allocation concealment (selection bias) | Unclear risk | Not specified |
| Blinding of participants and personnel (performance bias) All outcomes | Low risk | Double‐blind trial, investigators and sponsor personnel remained blinded to individual treatment codes during the study. Participants received treatment administrations identical in appearance and labelling |
| Blinding of outcome assessment (detection bias) All outcomes | Low risk | Investigators and sponsor personnel remained blinded to individual treatment codes during the study |
| Incomplete outcome data (attrition bias) All outcomes | Low risk | Participants lost to follow‐up were addressed, and missing data are unlikely to affect outcome results |
| Selective reporting (reporting bias) | Low risk | No protocol was available, but all expected outcomes were reported |
| Other bias | High risk | Trial is industry sponsored |
Otto 1996.
| Methods | Trial design: randomised clinical trial Language: English Type of information: journal article Judgement of the quality: high risk of bias |
|
| Participants | Setting: University of Heidelberg, Heidelberg, Germany Allocation of participants: 34 participants, 18 allocated to murine monoclonal antibody BT563 (interleukin‐2 receptor antagonist) and 16 allocated to no intervention Sex ratio: not reported Mean age: not reported Indication (No. (%)): not reported Type of donor: not reported Inclusion criteria: orthotopic liver transplantation Exclusion criteria: not reported |
|
| Interventions | Intervention A: murine monoclonal antibody BT563 10 mg by 20‐minute infusion every day over 14 days Intervention B: no intervention Concomitant immunosuppressive treatment: Cyclosporine was adjusted to a whole blood monoclonal trough level of 200 ng/mL for 2 weeks, and thereafter to a level of 100 ng/mL. Azathioprine was maintained post transplant at a dose of 1.5 mg/kg/d for 4 weeks Methylprednisolone was given intraoperatively (10 mg/kg) and postoperatively, beginning with 1.5 mg/kg/d, tapering down to 0.25 mg/kg at the end of the first week |
|
| Outcomes | Acute rejection | |
| Notes | Single‐centre study Cross‐over between treatment groups: no Sample size calculation: not reported Sources of funding: not reported Results from a pilot study and a randomised study are pooled, hence it is not possible to extract data on most of the outcome measures. Study authors contacted by e‐mail, but no response received |
|
| Risk of bias | ||
| Bias | Authors' judgement | Support for judgement |
| Random sequence generation (selection bias) | Unclear risk | Not specified |
| Allocation concealment (selection bias) | Unclear risk | Not reported |
| Blinding of participants and personnel (performance bias) All outcomes | Unclear risk | Double‐blinded, but not further specified |
| Blinding of outcome assessment (detection bias) All outcomes | Unclear risk | Double‐blinded, but not further specified |
| Incomplete outcome data (attrition bias) All outcomes | Unclear risk | No participants lost to follow‐up |
| Selective reporting (reporting bias) | High risk | No protocol was available; not all expected outcomes (infection, adverse effects) were reported |
| Other bias | Low risk | Trial appears to be free of other bias components |
Reding 1996.
| Methods | Trial design: randomised clinical trial Language: English Type of information: journal article Judgement of the quality: high risk of bias |
|
| Participants | Setting: University of Louvain Medical School, Brussels, Belgium Allocation of participants: 129 participants, 44 allocated to muromonab‐CD3(OKT3®), 43 allocated to LO‐Tact‐1 (interleukin‐2 receptor antagonist derived from rat), and 42 allocated to no intervention Sex ratio (from subgroup): muromonab‐CD3 21 (57%) males, 16 (43%) females LO‐Tact‐1: 23 (66%) males, 12 (34%) females Control: 13 (46%) males, 15 (54%) females Adults: muromonab‐CD3 16 (43%), LO‐Tact‐1 18 (51%), control 13 (46%) Mean age: muromonab‐CD3 47 (26‐57) years, LO‐Tact‐1 46 (25‐62) years, control 45 (25‐58) years Children: muromonab‐CD3 21 (57%), LO‐Tact‐1 17 (49%), control 15 (54%) Mean age: muromonab‐CD3 20 (8‐122) months, LO‐Tact‐1 25 (10‐132) months, control 28 (7‐120) months Indication (No. (%)): Biliary atresia: muromonab‐CD3 15 (42%), LO‐Tact‐1 12 (34%), control 9 (32%) Cryptogenic cirrhosis: muromonab‐CD3 10 (27%), LO‐Tact‐1 10 (28%), control 8 (29%) Primary biliary cirrhosis: muromonab‐CD3 2 (5%), LO‐Tact‐1 3 (9%), control 2 (7%) Familial cholestasis: muromonab‐CD3 2 (5%), LO‐Tact‐1 1 (3%), control 4 (14%) Metabolic disease: muromonab‐CD3 2 (5%), LO‐Tact‐1 3 (9%), control 1 (4%) Liver tumour: muromonab‐CD3 3 (8%), LO‐Tact‐1 3 (9%), control 4 (14%) Alcoholic cirrhosis: muromonab‐CD3 3 (8%), LO‐Tact‐1 2 (5%), control 0 (0%) Autoimmune cirrhosis: muromonab‐CD3 0 (0%), LO‐Tact‐1 1 (3%), control 0 (0%) Type of donor: 100% cadaveric donor Inclusion criteria: first ABO‐compatible liver transplantation Exclusion criteria: retransplantation, orthotopic liver transplantation for fulminant hepatitis, high‐risk orthotopic liver transplantation with preoperative or intraoperative renal or respiratory insufficiency, heterotopic liver transplantation, combined liver‐kidney transplantation |
|
| Interventions | Intervention A: Muromonab CD‐3 was given intraoperatively by bolus intravenous injection and subsequently daily during the first 9 days post transplantation at a dosage of 5 mg/d (2.5 mg/d for participants weighing less than 30 kg) Intervention B: LO‐Tact‐1 was given intraoperatively by bolus iv injection and subsequently daily during the first 9 days post transplantation at a dosage of 20 mg/d (10 mg/d for participants weighing less than 30 kg) Intervention C: no intervention Concomitant immunosuppressive treatment: Cyclosporine was given postoperatively at a daily dose of 3‐5 mg/kg intravenously and subsequently was gradually converted to oral administration with usually a 5‐7‐day overlap period of oral and intravenous administration trough levels between 250 and 350 ng/mL. Azathioprine was started at day 1 post transplant at a dose of 1.5 mg/kg/d in children and 1 mg/kg/d in adults, depending on platelet and white cell counts Methylprednisolone was started intraoperatively at a dosage of 1 g/1.73 square meter body area in children and 1 g/70 kg in adults. Steroid dosage was subsequently tapered during the first post‐transplant week from 100 or 200 mg/d in children below or above 20 kg body weight, respectively, and from 400 mg in adults to 1 mg/kg/d of prednisolone in children and 25 mg/d in adults at 1 month post transplant. Oral doses were further tapered afterward to 0.5 mg/kg/d in children and 15 mg/d in adults at 3 months |
|
| Outcomes | Acute rejection, infection | |
| Notes | Single‐centre study Cross‐over between treatment groups: no Sample size calculation: not reported Sources of funding: not reported |
|
| Risk of bias | ||
| Bias | Authors' judgement | Support for judgement |
| Random sequence generation (selection bias) | Unclear risk | Not specified |
| Allocation concealment (selection bias) | Low risk | Sealed envelopes |
| Blinding of participants and personnel (performance bias) All outcomes | High risk | No blinding |
| Blinding of outcome assessment (detection bias) All outcomes | High risk | No blinding |
| Incomplete outcome data (attrition bias) All outcomes | Low risk | No participants lost to follow‐up |
| Selective reporting (reporting bias) | Low risk | No protocol was available, but all expected outcomes were reported |
| Other bias | Low risk | Trial appears to be free of other bias components |
Schmeding 2007.
| Methods | Trial design: randomised clinical trial Language: English Type of information: journal article Judgement of the quality: high risk of bias |
|
| Participants | Setting: Charité Campus Virchow Klinikum, Berlin, Germany Allocation of participants: 99 participants, 51 allocated to basiliximab and 48 allocated to no intervention Sex ratio: basiliximab 27 (53%) males, 24 (47%) females Control: 27 (56%) males, 21 (44%) females Mean age: basiliximab 49.4 years, control 49.6 years Indication (No. (%)): Hepatocellular carcinoma: basiliximab 7 (14%), control 6 (13%) Hepatitis C virus: basiliximab 3 (6%), control 6 (13%) Alcoholic cirrhosis: basiliximab 16 (31%), control 12 (25%) Hepatitis B virus: basiliximab 6 (12%), control 4 (8%) Sclerosing cholangitis: basiliximab 5 (10%), control 0 (0%) Primary biliary cirrhosis: basiliximab 2 (4%), control 4 (8%) Autoimmune hepatitis: basiliximab 1 (2%), control 5 (10%) Cryptogenic cirrhosis: basiliximab 3 (6%), control 11 (23%) Living donor: basiliximab 2 (4%), control 0 (0%) Transplant procedure: living donor: basiliximab 2 (4%), control 0 (0%) Inclusion criteria: not reported Exclusion criteria: not reported |
|
| Interventions | Intervention A: basiliximab 20 mg on day 0 and on day 4 Intervention B: no intervention Concomitant immunosuppressive treatment: Tacrolimus was administered with target through levels of 10‐15 ng/dL, starting on day 0 in both groups. 4 weeks after transplantation, trough levels were reduced to 8‐10 ng/dL with further reduction to approximately 5 ng/dL in the further long‐term course Steroids were administered intraoperatively and postoperatively in both arms at the same dosage. Continuous steroid tapering was performed until a maintenance dose of 5 mg daily was attained after 3 months. For HCV‐positive participants, steroids were completely eliminated by month 3 post transplantation Mycophenolate mofetil was added in selected cases later in the clinical course as the result of acute rejection, renal insufficiency or other tacrolimus‐associated side effects |
|
| Outcomes | Infection, rejection, kidney function, post‐transplant lymphoproliferative disease, and malignancy | |
| Notes | Single‐centre study Cross‐over between treatment groups: no Sample size calculation: not reported Sources of funding: not reported |
|
| Risk of bias | ||
| Bias | Authors' judgement | Support for judgement |
| Random sequence generation (selection bias) | Unclear risk | Not specified |
| Allocation concealment (selection bias) | Unclear risk | Not reported |
| Blinding of participants and personnel (performance bias) All outcomes | High risk | No blinding |
| Blinding of outcome assessment (detection bias) All outcomes | High risk | No blinding |
| Incomplete outcome data (attrition bias) All outcomes | Low risk | Missing data are unlikely to affect outcome results |
| Selective reporting (reporting bias) | Low risk | No protocol was available, but all expected outcomes were reported |
| Other bias | Low risk | Trial appears to be free of other bias components |
Yan 2004.
| Methods | Trial design: randomised double‐blinded clinical trial Language: English Type of information: abstract Judgement of the quality: high risk of bias |
|
| Participants | Setting: Liver Transplant Center, Sichuan University, Chengdu, Sichuan, China Allocation of participants: 48 participants, 24 allocated to basiliximab and 24 allocated to placebo Sex ratio: total 37 male, 11 female, not specified for the different groups Mean age: range 26‐60 years, not specified for the different groups Indication: cirrhotic liver disease, fulminant hepatitis, or hepatocellular carcinoma, not specified for the different groups Type of donor: 100% cadaveric donor Inclusion criteria: cadaveric liver transplant recipient Exclusion criteria: not reported |
|
| Interventions | Intervention A: basiliximab 20 mg on day 0 and on day 4 Intervention B: placebo Concomitant immunosuppressive treatment: Cyclosporine microemulsion, mycophenolate mofetil, corticosteroids |
|
| Outcomes | Infection, rejection, nephrotoxicity, adverse events, laboratory test abnormalities | |
| Notes | Single‐centre study. Cross‐over between treatment groups: no Sample size calculation: not reported Sources of funding: not reported |
|
| Risk of bias | ||
| Bias | Authors' judgement | Support for judgement |
| Random sequence generation (selection bias) | Unclear risk | Not specified, participants were randomly divided into 2 groups |
| Allocation concealment (selection bias) | Unclear risk | Not reported |
| Blinding of participants and personnel (performance bias) All outcomes | Unclear risk | Trial was double‐blinded, not further specified |
| Blinding of outcome assessment (detection bias) All outcomes | Unclear risk | Trial was double‐blinded, not further specified |
| Incomplete outcome data (attrition bias) All outcomes | Low risk | Missing data are unlikely to affect outcome results |
| Selective reporting (reporting bias) | Low risk | No protocol was available, but all expected outcomes were reported |
| Other bias | Low risk | Trial appears to be free of other bias components |
Yoshida 2005.
| Methods | Trial design: randomised multi‐centre national clinical trial Language: English Type of information: journal article Judgement of the quality: high risk of bias |
|
| Participants | Setting: all 7 Canadian centres actively performing liver transplant surgery Allocation of participants: 148 participants, 72 allocated to daclizumab and delayed low‐dose tacrolimus and 76 allocated to no induction and standard tacrolimus Sex ratio: daclizumab 50 (69%) males, 22 (31%) females Control: 50 (66%) males, 26 (34%) females Mean age: daclizumab 53 ± 9 years, control 52 ± 8 years Indication (No. (%)): Hepatitis C: daclizumab 23 (32%), control 28 (37%) Alcoholic liver disease: daclizumab 14 (19%), control 15 (20%) Primary biliary cirrhosis: daclizumab 7 (10%), control 9 (12%) Hepatitis B: daclizumab 3 (4%), control 2 (3%) Sclerosing cholangitis: daclizumab 6 (8%), control 7 (9%) Autoimmune hepatitis: daclizumab 3 (4%), control 2 (3%) Other: daclizumab 16 (22%), control 13 (17%) Type of donor: 100% cadaveric donor Inclusion criteria: all patients,18 years of age with chronic liver disease undergoing cadaveric liver transplantation for the first time who were able to provide written informed consent. All patients wait‐listed for liver transplantation were consistent with current Canadian practices Exclusion criteria: multi‐organ transplantation, ABO blood group–incompatible organs, acute liver failure, liver failure requiring urgent transplantation (i.e., requiring intubation in a critical care unit), evidence of significant renal dysfunction before transplantation including a pretransplant serum creatinine 180 mol/L or dialysis within 30 days of transplantation, human immunodeficiency virus infection, transplantation with a known hepatocellular carcinoma 5 cm, or, if multicentric, no more than 3 lesions, the largest of which was 3 cm, known significant gastrointestinal disease including active peptic ulceration, malabsorption, or significant chronic diarrhoea |
|
| Interventions | Intervention A: daclizumab (Zenapax, Hoffman‐LaRoche, Canada, Mississauga, ON, Canada) 2 mg/kg intravenously within 4 hours postoperatively and 1 mg/kg intravenously on postoperative day 4. Delayed low‐dose tacrolimus (no tacrolimus for the first 4‐6 days, followed by 1 mg twice daily PO via nasogastric tube, with dose titration to achieve a target trough level of 4‐8 ng/mL) Intervention B: no induction. Standard tacrolimus (Prograf, Fujisawa‐Canada): 0.05 mg/kg via nasogastric tube (followed by later conversion to oral when appropriate) within 12 hours postoperatively, then twice daily. Doses when titrated to achieve a target trough level of 10‐15 ng/mL for the first 30 days, followed by a target trough level of 4‐8 ng/mL Concomitant immunosuppressive treatment: Mycophenolate mofetil (CellCept, Hoffman‐LaRoche Canada) 1000 mg orally via nasogastric tube or intravenously twice daily within 8 hours postoperatively Tapering corticosteroids: methylprednisolone 500 mg intravenously intraoperatively, tapering to 20 mg iv on postoperative day 5, followed by prednisone 5 mg/d orally. Prednisone was then tapered by 5 mg/mo until discontinuation after month 3 post transplant |
|
| Outcomes | Renal function indicated by the Modification of Diet in Renal Disease (MDRD), calculated glomerular filtration rate, and acute rejection | |
| Notes | Multi‐centre study Cross‐over between treatment groups: no Sample size calculation: yes Sources of funding: not reported |
|
| Risk of bias | ||
| Bias | Authors' judgement | Support for judgement |
| Random sequence generation (selection bias) | Unclear risk | Not specified |
| Allocation concealment (selection bias) | Unclear risk | Not reported |
| Blinding of participants and personnel (performance bias) All outcomes | High risk | No blinding |
| Blinding of outcome assessment (detection bias) All outcomes | High risk | No blinding |
| Incomplete outcome data (attrition bias) All outcomes | Low risk | Missing data are unlikely to affect outcome results |
| Selective reporting (reporting bias) | Low risk | No protocol was available, but all expected outcomes were reported |
| Other bias | Low risk | Trial appears to be free of other bias components |
ATG = antithymocyte globulin; GFR = glomerular filtration rate; HCV = hepatitis C virus; HPLC = high‐performance liquid chromatography; MDRD = modification of diet in renal disease; RIA = radioimmunoassay.
Characteristics of excluded studies [ordered by study ID]
| Study | Reason for exclusion |
|---|---|
| Benitez 2010 | Randomised trial studying ATG‐Fresenius followed by immunosuppression withdrawal (tacrolimus withdrawal) compared with standard treatment: differences in concomitant treatment in the study groups |
| Boillot 2005 | Randomised trial comparing T‐cell specific antibody induction versus corticosteroid induction |
| De Simone 2007 | Randomised trial comparing T‐cell specific antibody induction versus corticosteroid induction |
| Eason 2003 | Randomised trial comparing T‐cell specific antibody induction versus corticosteroid induction |
| Kato 2001 | Randomised trial comparing T‐cell specific antibody induction versus corticosteroid induction |
| Kato 2007 | Randomised trial comparing T‐cell specific antibody induction versus corticosteroid induction |
| Klintmalm 2011 | Randomised trial comparing T‐cell specific antibody induction versus corticosteroid induction |
| Lupo 2008 | Randomised trial comparing T‐cell specific antibody induction versus corticosteroid induction |
| Neumann 2012 | Randomised trial comparing T‐cell specific antibody induction versus corticosteroid induction |
| Spada 2006 | Randomised trial comparing T‐cell specific antibody induction versus corticosteroid induction |
| Washburn 2001 | Randomised trial comparing T‐cell specific antibody induction versus corticosteroid induction |
Differences between protocol and review
Differences between the first published protocol (Wilson 2008) and the present updated protocol:
Primary and secondary outcome measures were revised in accordance with the Cochrane Handbook for Systematic Reviews of Interventions (Higgins 2011).
Number of subgroup analyses was reduced.
Changes were made to the review author team and the contact editor.
Non‐randomised studies retrieved by the search for randomised clinical trials were considered for their report on harm.
Contributions of authors
All review authors have contributed to the review preparation.
Draft the review: LP.
Select studies: LP, AW.
Extract data from studies: LP, AW.
Enter data into RevMan: LP.
Carry out the analysis: LP, CG.
Interpret the analysis: LP, CG.
Critically revise the draft of the review: AW, CW, AC, DS, CG.
Resolve disagreement: CG.
Comments on the final review were discussed and approved by all review authors (LP, AW, CW, AC, DS, CG) before they were implemented in the text.
Sources of support
Internal sources
Grant from the Rigshospitalet Research Council to Luit Penninga, Denmark.
The Copenhagen Trial Unit, Centre for Clinical Intervention Research, Copenhagen, Denmark.
External sources
No sources of support supplied
Declarations of interest
None known.
Edited (no change to conclusions)
References
References to studies included in this review
Bogetti 2005 {published data only}
- Bogetti D, Jarzembowski T‐M, Sankary H‐N, Manzelli A, Knight P‐S, Chejfec G, et al. Hepatic ischemia/reperfusion injury can be modulated with thymoglobulin induction therapy. Transplantation Proceedings 2005; Vol. 37, issue 1:404‐6. [DOI] [PubMed]
- Bogetti D, Sankary HN, Chejfec G, Cotler S, Testa G, Benedetti E. Thymoglobulin (TG) induction protects liver allografts from ischemia/reperfusion injury (IRI). American Journal of Transplantation 2004; Vol. 4, issue Suppl 8:25.
Boillot 2009 {published data only}
- Boillot O, Poncet G, Méchet I, Dumortier J, Delafosse B, Sagnard P, et al. Randomized trial of triple based immunosuppression using tacrolimus, mycophenolate mofetil and steroids quadruple regimen induction with thymoglobulin in liver transplantation. Hepatology 2000; Vol. 32, issue 4 (Pt 2):599A.
- Boillot O, Seket B, Dumortier J, Pittau G, Boucaud C, Bouffard Y, et al. Thymoglobulin induction in liver transplant recipients with a tacrolimus, mycophenolate mofetil, and steroid immunosuppressive regimen: a five‐year randomized prospective study. Liver Transplantation 2009;15(11):1426‐34. [DOI] [PubMed] [Google Scholar]
Calmus 2010 {published data only}
- Calmus Y, Kamar N, Gugenheim J, Duvoux C, Ducerf C, Wolf P, et al. Assessing renal function with daclizumab induction and delayed tacrolimus introduction in liver transplant recipients. Transplantation 2010;89(12):1504‐10. [DOI] [PubMed] [Google Scholar]
Cosimi 1990 {published data only}
Eghtesad 2011 {published data only}
- Eghtesad B, Forrest T, Fijiki M, Diago T, Hodgkinson P, Hashimoto K, et al. A pilot randomized controlled clinical trial of thymoglobulin (r‐ATG) induction with extended delay of calcineurin inhibitor therapy in liver transplantation ‐ Interim analysis. International Liver Transplant Society. 2011:O‐21.
Farges 1994 {published data only}
- Farges O, Ericzon BG, Bresson Hadni S, Lynch SV, Hockerstedt K, Houssin D, et al. A randomized trial of OKT3‐based versus cyclosporine‐based immunoprophylaxis after liver transplantation. Long‐term results of a European and Australian multicenter study. Transplantation 1994; Vol. 58, issue 8:891‐8. [DOI] [PubMed]
- Farges O, Ericzon BG, Miguet JP, Lynch S, Hockerstedt K, Chapuis Y, et al. [Immunoprophylaxis with OKT3 after hepatic transplantation: results of a multicenter, prospective, controlled study]. Annales de Chirurgie 1993; Vol. 47, issue 7:675.
Fasola 2005 {published data only}
- Fasola CG, Smallwood G, Martinez E, Steiber A, Heffron TG. Daclizumab (DZB) induction in adult hepatitis C (HCV) liver transplant recipients (OLT): a single center experience with different antibody doses. Liver Transplantation 2005;11:C‐44. [Google Scholar]
Langrehr 1997 {published data only}
- Bechstein WO, Langrehr JM, Lohmann R, Lobeck H, Blumhardt G, Neuhaus P. Interleukin‐2 receptor antibody versus ATG for induction immunosuppression after liver transplantation: results of a prospective randomized trial. Langenbecks Archiv für Chirurgie 1994;379:99‐102. [Google Scholar]
- Langrehr J, Guckelberger O, Neumann U, Nussler N, Lobeck H, Lohmann R, et al. A randomized trial comparing quadruple induction therapy with ANTI‐IL‐2 receptor antibody or ATG after liver transplantation, 1997. www.astp.org (accessed 12 April 2012).
- Langrehr JM, Guckelberger O, Bechstein WO, Lobeck H, Meuer S, Schlag H, et al. Quadruple induction therapy following liver transplantation with interleukin‐2 receptor antibody BT563 or ATG. A prospective randomized trial. Langenbecks Archiv fur Chirurgie 1997;Suppl 1 Forumband:673‐6. [Google Scholar]
- Langrehr JM, Guckelberger O, Nussler N, Radtke A, Lemmens HP, Jonas S, et al. Interleukin‐2 receptor antibody versus antithymocyte globulin as part of quadruple induction therapy after orthotopic liver transplantation: a randomized study. Transplantation Proceedings 1996; Vol. 28, issue 6:3204. [PubMed]
- Langrehr JM, Nussler NC, Neumann U, Guckelberger O, Lohmann R, Radtke A, et al. A prospective randomized trial comparing interleukin‐2 receptor antibody versus antithymocyte globulin as part of a quadruple immunosuppressive induction therapy following orthotopic liver transplantation. Transplantation 1997; Vol. 63, issue 12:1772‐81. [DOI] [PubMed]
Langrehr 1998 {published data only}
- Glanemann M, Langrehr JM, Raakow R, Guckelberger O, Lohmann R, Klupp J, et al. Anti‐IL‐2 receptor BT563 versus placebo: a randomized trial for induction therapy after liver transplantation. Transplantation Proceedings 1998;30(5):2159‐60. [DOI] [PubMed] [Google Scholar]
- Langrehr JM, Glanemann M, Guckelberger O, Klupp J, Neumann U, Machens C, et al. A randomized, placebo‐controlled trial with anti‐interleukin‐2 receptor antibody for immunosuppressive induction therapy after liver transplantation. Clinical Transplantation 1998;12(4):303‐12. [PubMed] [Google Scholar]
- Langrehr JM, Glanemann M, Schneller A, Neumann U, Guckelberger O, Lohmann R, et al. A randomized trial comparing anti‐interleukin‐2 receptor antibody and placebo for immunosuppressive therapy after OLT. Transplantation Proceedings 1998; Vol. 30, issue 4:1445‐6. [DOI] [PubMed]
Lerut 2005 {published data only}
- Lerut J, Thuyne V, Mathijs J, Lemaire J, Talpe S, Roggen F, et al. Anti‐CD2 monoclonal antibody and tacrolimus in adult liver transplantation. Transplantation 2005;80:1186‐93. [DOI] [PubMed] [Google Scholar]
Mc Diarmid 1991 {published data only}
- McDiarmid SV, Busuttil RW, Levy P, Millis MJ, Terasaki PI, Ament ME. The long‐term outcome of OKT3 compared with cyclosporine prophylaxis after liver transplantation. Transplantation 1991; Vol. 52, issue 1:91‐7. [DOI] [PubMed]
- McDiarmid SV, Millis MJ, Terasaki P, Vargas JH, Ament ME, Busuttil W. Induction of immunosuppression in pediatric orthotopic liver transplantation. Clinical Transplantation 1991;5:174‐80. [Google Scholar]
- McDiarmid SV, Millis MJ, Terasaki PI, Ament ME, Busuttil RW. OKT3 prophylaxis in liver transplantation. Digestive Diseases and Sciences 1991; Vol. 36, issue 10:1418‐26. [DOI] [PubMed]
- Millis JM, McDiarmid SV, Hiatt JR, Brems JJ, Colonna JO 2nd, Klein AS, et al. Randomized prospective trial of OKT3 for early prophylaxis of rejection after liver transplantation. Transplantation 1989; Vol. 47, issue 1:82‐8. [DOI] [PubMed]
Nashan 1996 {published data only}
- Nashan B, Schlitt HJ, Schwinzer R, Ringe B, Kuse E, Tusch G, et al. Immunoprophylaxis with a monoclonal anti‐IL‐2 receptor antibody in liver transplant patients. Transplantation 1996; Vol. 61, issue 4:546‐54. [DOI] [PubMed]
- Nashan B, Schwinzer R, Schlitt HJ, Wonigeit K, Pichlmayr R. Immunological effects of the anti‐IL‐2 receptor monoclonal antibody BT 563 in liver allografted patients. Transplant Immunology 1995;3:203‐11. [DOI] [PubMed] [Google Scholar]
Neuberger 2009 {published data only}
- Neuberger JM, Mamelok RD, Neuhaus P, Pirenne J, Samuel D, Isoniemi H, et al. Delayed introduction of reduced‐dose tacrolimus, and renal function in liver transplantation: the 'ReSpECT' study. American Journal of Transplantation 2009;9(2):327‐36. [DOI] [PubMed] [Google Scholar]
Neuhaus 2002 {published data only}
- Nashan B, Neuhaus P, Clavien PA, Kittur D, Salizzoni M, Rimola A, et al. The monoclonal anti‐IL 2 receptor antibody basiliximab reduces the incidence and degree of acute rejections after liver transplantation. Zeitschrift fur Gastroenterologie 2000;38:536. [Google Scholar]
- Neuhaus P, Clavien PA, Kittur D, Salizzoni M, Rimola A, Abeywickrama K, et al. Improved treatment response with basiliximab immunoprophylaxis after liver transplantation: results from a double‐blind randomized placebo‐controlled trial. Liver Transplantation 2002;8:132‐42. [DOI] [PubMed] [Google Scholar]
- Neuhaus P, Nashan B, Clavin PA, Kittur D, Salizzoni M, Rimola A, et al. Basiliximab (Simulect) reduces the rate and severity of acute rejection in adult liver transplant recipients [abstract]. Liver Transplantation 2000; Vol. 6, issue 3:C‐25.
Otto 1996 {published data only}
- Otto G, Hofmann WJ, Gaweco AS, Seelos R, Herfarth C, Meuer S. Influence of the anti‐CD25 monoclonal antibody BT563 on clinical and biological rejection after orthotopic liver transplantation. Transplantation Proceedings 1996; Vol. 28, issue 6:3210‐1. [PubMed]
Reding 1996 {published data only}
- Reding R, Feyaerts A, Vraux H, Latinne D, De‐La Parra B, Cornet A, et al. Prophylactic immunosuppression with anti‐interleukin‐2 receptor monoclonal antibody LO‐Tact‐1 versus OKT3 in liver allografting. A two‐year follow‐up study. Transplantation 1996;61:1406‐9. [DOI] [PubMed] [Google Scholar]
- Reding R, Vraux H, Ville de Goyet J, Sokal E, Hemptinne B, Latinne D, et al. Monoclonal antibodies in prophylactic immunosuppression after liver transplantation. A randomized controlled trial comparing OKT3 and anti‐IL‐2 receptor monoclonal antibody LO‐Tact‐1. Transplantation 1993; Vol. 55, issue 3:534‐41. [DOI] [PubMed]
Schmeding 2007 {published data only}
- Schmeding M, Sauer IM, Kiessling A, Pratschke J, Neuhaus R, Neuhaus P, et al. Influence of basiliximab induction therapy on long term outcome after liver transplantation, a prospectively randomised trial. Annals of Transplantation 2007;12(3):15‐21. [PubMed] [Google Scholar]
Yan 2004 {published data only}
- Yan LN, Wang WT, Li B, Lu SC, Wen TF. Induction with basiliximab reduces acute rejection in Chinese liver transplant recipients treated with cyclosporin, steroids and MMF. Liver Transplantation 2004;10:C‐5. [Google Scholar]
Yoshida 2005 {published data only}
- Yoshida EM, Marotta PJ, Greig PD, Kneteman NM, Marleau D, Cantarovich M, et al. Evaluation of renal function in liver transplant recipients receiving daclizumab (Zenapax), mycophenolate mofetil, and a delayed, low‐dose tacrolimus regimen vs. a standard‐dose tacrolimus and mycophenolate mofetil regimen: a multicenter randomized clinical trial. Liver Transplantation 2005;11(9):1064‐72. [DOI] [PubMed] [Google Scholar]
References to studies excluded from this review
Benitez 2010 {published data only}
- Benitez CE, Puig‐Pey I, Lopez M, Martinez‐Llordella M, Lozano JJ, Bohne F, et al. ATG‐Fresenius treatment and low‐dose tacrolimus: results of a randomized controlled trial in liver transplantation. American Journal of Transplantation 2010;10:2296‐304. [DOI] [PubMed] [Google Scholar]
Boillot 2005 {published data only}
De Simone 2007 {published data only}
- Simone P, Carlis L, Filipponi F, Grazi GL, Cuomo O, Santaniello W, et al. Results of a multicenter, randomized open‐label, controlled clinical trial comparing basiliximab versus steroids in hepatitis C positive liver transplant patients. Transplant International 2007;20(Suppl 2):33. [Google Scholar]
- Simone P, Carlis L, Grazi GL, Cuomo O, Calise F, Castagneto M, et al. Results of a multicenter, randomized open‐label trial comparing basiliximab vs. steroids in HCV liver transplant patients. American Journal of Transplantation 2007;7(Suppl 2):312. [Google Scholar]
Eason 2003 {published data only}
- Eason JD, Blazek J, Mason A, Loss GE. Steroid‐free immunosuppression through thymoglobulin induction in liver transplantation: results of a prospective randomized trial. Transplantation Proceedings 2000;32(4):208A. [DOI] [PubMed] [Google Scholar]
- Eason JD, Loss GE, Blazek J, Nair S, Mason AL. Steroid‐free liver transplantation using rabbit antithymocyte globulin induction: results of a prospective randomized trial. Liver Transplantation 2001;7(8):693‐7. [DOI] [PubMed] [Google Scholar]
- Eason JD, Nair S, Cohen AJ, Blazek JL, Loss GE Jr. Steroid‐free liver transplantation using rabbit antithymocyte globulin and early tacrolimus monotherapy. Transplantation 2003;75(8):1396‐9. [DOI] [PubMed] [Google Scholar]
- Nair S, Loss GE, Cohen AJ, Eason JD. Induction with rabbit antithymocyte globulin versus induction with corticosteroids in liver transplantation: impact on recurrent hepatitis C virus infection. Transplantation 2006;81:620‐2. [DOI] [PubMed] [Google Scholar]
Kato 2001 {published data only}
- Kato T, Gaynor JJ, Yoshida H, Montalvano M, Takahashi H, Pyrsopoulos N, et al. Randomized trial of steroid‐free induction versus corticosteroid maintenance among orthotopic liver transplant recipients with hepatitis C virus: impact on hepatic fibrosis progression at one year. Transplantation 2007;84:829‐35. [DOI] [PubMed] [Google Scholar]
- Kato T, Neff GW, Montalbano M, Hung O, Lavandera R, Levi D, et al. Steroid‐free induction with daclizumab and tacrolimus in liver transplant recipients with hepatitis C: a preliminary report [abstract]. Hepatology 2001;34:362A. [Google Scholar]
Kato 2007 {published data only}
- Kato T, Gaynor JJ, Yoshida H, Montalvano M, Takahashi H, Pyrsopoulos N, et al. Randomized trial of steroid‐free induction versus corticosteroid maintenance among orthotopic liver transplant recipients with hepatitis C virus: impact on hepatic fibrosis progression at one year. Transplantation 2007;84:829‐35. [DOI] [PubMed] [Google Scholar]
- Kato T, Yoshida H, Sadfar K, Martinez E, Nishida S, Moon J, et al. Steroid‐free induction and preemptive antiviral therapy for liver transplant recipients with hepatitis C: a preliminary report from a prospective randomized study. Hepatology 2005; Vol. 37, issue 2:1217‐9. [DOI] [PubMed]
Klintmalm 2011 {published data only}
- Klintmalm GB, Davis GL, Teperman L, Netto GJ, Washburn K, Rudich SM, et al. A randomized, multicenter study comparing steroid‐free immunosuppression and standard immunosuppression for liver transplant recipients with chronic hepatitis C. Liver Transplantation 2011;17(12):1394‐403. [DOI] [PubMed] [Google Scholar]
- Klintmalm GB, Washburn WK, Rudich SM, Heffron TG, Teperman LW, Fasola C, et al. Corticosteroid‐free immunosuppression with daclizumab in HCV(+) liver transplant recipients: 1‐year interim results of the HCV‐3 study. Liver Transplantation 2007;13(11):1521‐31. [DOI] [PubMed] [Google Scholar]
Lupo 2008 {published data only}
- Lupo L, Panzera P, Tandoi F, Carbotta G, Giannelli G, Santantonio T, et al. Basiliximab versus steroids in double therapy immunosuppression in liver transplantation: a prospective randomized clinical trial. Transplantation 2008;86(7):925‐31. [DOI] [PubMed] [Google Scholar]
- Lupo L, Ricci P, Caputi L, Tandoi F, Aquilino F, Palma G, et al. Basiliximab vs steroids in liver transplantation immunosuppression. A prospective randomized clinical trial. Liver Transplantation 2005;11(7):LB17. [Google Scholar]
Neumann 2012 {published data only}
- Neumann U, Samuel D, Trunecka P, Gugenheim J, Gerunda GE, Friman S. A randomized multicenter study comparing a tacrolimus‐based protocol with and without steroids in HCV‐positive liver allograft recipients. Journal of Transplantation 2012;2012:894215. [DOI] [PMC free article] [PubMed] [Google Scholar]
Spada 2006 {published data only}
- Spada M, Bertani A, Petz W, Torri E, Sonzogni A, Guizzetti M, et al. A randomized trial for tacrolimus and steroids vs. tacrolimus and basiliximab in pediatric liver transplantation. Hepatology 2004; Vol. 40, issue 4 Suppl 1:473A.
- Spada M, Petz W, Bertani A, Riva S, Sonzogni A, Giovannelli M, et al. Randomized trial of basiliximab induction versus steroid therapy in pediatric liver allograft recipients under tacrolimus immunosuppression. American Journal of Transplantation 2006; Vol. 6, issue 8:1913‐21. [DOI] [PubMed]
Washburn 2001 {published data only}
- Washburn K, Speeg KV, Esterl R, Cigarroa F, Pollack M, Tourtellot C, et al. Steroid elimination 24 hours after liver transplantation using daclizumab, tacrolimus, and mycophenolate mofetil. Transplantation 2001;72(10):1675‐9. [DOI] [PubMed] [Google Scholar]
Additional references
Adams 1992
- Adams DH, Neuberger JM. Treatment of acute rejection. Seminars in Liver Disease 1992;12(1):80‐8. [DOI] [PubMed] [Google Scholar]
Banff 1997
Brok 2008
- Brok J, Thorlund K, Gluud C, Wetterslev J. Trial sequential analysis reveals insufficient information size and potentially false positive results in many meta‐analyses. Journal of Clinical Epidemiology 2008;61:763‐9. [DOI] [PubMed] [Google Scholar]
Chatenoud 2008
- Chatenoud L. The long and winding road towards induction of allograft tolerance in the clinic. Transplant International 2008;21(8):725‐7. [DOI] [PubMed] [Google Scholar]
Chen 2006
- Chen W, Zhang L. Regulatory T‐cell subsets and their roles in transplantation tolerance. Current Opinion in Organ Transplantation 2006;11(4):373‐8. [Google Scholar]
CTU 2011
- Copenhagen Trial Unit. TSA ‐ Trial Sequential Analysis. ctu.dk/tsa/ 2011 (accessed 19 March 2014).
Dienstag 2012
- Dienstag JL, Cosimi AB. Liver transplantation ‐ a vision realized. New England Journal of Medicine 2012;367(16):1483‐5. [DOI] [PubMed] [Google Scholar]
Egger 1997
- Egger M, Davey SG, Schneider M, Minder C. Bias in meta‐analysis detected by a simple, graphical test. BMJ (Clinical Research Ed.) 1997;315(7109):629‐34. [DOI] [PMC free article] [PubMed] [Google Scholar]
FK506 1994a
- The U.S. Multicenter FK506 Liver Study Group. A comparison of tacrolimus (FK 506) and cyclosporine for immunosuppression in liver transplantation. New England Journal of Medicine 1994;331(17):1110‐5. [DOI] [PubMed] [Google Scholar]
FK506 1994b
- European FK506 Multicentre Liver Study Group. Randomised trial comparing tacrolimus (FK506) and cyclosporin in prevention of liver allograft rejection. Lancet 1994;344(8920):423‐8. [PubMed] [Google Scholar]
Flechner 2008
- Flechner SM, Kobashigawa J, Klintmalm G. Calcineurin inhibitor‐sparing regimens in solid organ transplantation: focus on improving renal function and nephrotoxicity. Clinical Transplantation 2008;22(1):1‐15. [DOI] [PubMed] [Google Scholar]
Gluud 2014
- Gluud C, Nikolova D, Klingenberg SL, Alexakis N, Als‐Nielsen B, Colli A, et al. Cochrane Hepato‐Biliary Group. About The Cochrane Collaboration (Cochrane Review Groups (CRGs)). 2014, Issue 1. Art. No.: LIVER.
Goralczyk 2011
- Goralczyk AD, Hauke N, Bari N, Tsui TY, Lorf T, Obed A. Interleukin 2 receptor antagonists for liver transplant recipients: a systematic review and meta‐analysis of controlled studies. Hepatology 2011;54(2):541‐54. [DOI] [PubMed] [Google Scholar]
Higgins 2002
- Higgins JP, Thompson SG. Quantifying heterogeneity in a meta‐analysis. Statistics in Medicine 2002;21(11):1539‐58. [DOI] [PubMed] [Google Scholar]
Higgins 2011
- Higgins JPT, Green S (editors). Cochrane Handbook for Systematic Reviews of Interventions Version 5.1.0 [updated March 2011]. The Cochrane Collaboration, 2011. www.cochrane‐handbook.org.
ICH‐GCP 1997
- International Conference on Harmonisation Expert Working Group. International conference on harmonisation of technical requirements for registration of pharmaceuticals for human use. ICH harmonised tripartite guideline. Guideline for good clinical practice CFR & ICH Guidelines. Vol. 1, Pennsylvania, USA: Barnett International/PAREXEL, 1997. [Google Scholar]
Iversen 2009
- Iversen M, Corris P. Immunosuppression. In: Fisher AJ, Verleden G, Massard G editor(s). European Respiratory Monthly: Lung Transplantation. Plymouth, UK: European Respiratory Society Journals Ltd, 2009:147‐68. [Google Scholar]
Keus 2009
- Keus F, Wetterslev J, Gluud C, Gooszen HG, Laarhoven CJ. Robustness assessments are needed to reduce bias in meta‐analyses that include zero‐event randomized trials. American Journal of Gastroenterology 2009;104(3):546‐51. [MEDLINE: ] [DOI] [PubMed] [Google Scholar]
Kjaergard 2001
- Kjaergard LL, Villumsen J, Gluud C. Reported methodologic quality and discrepancies between large and small randomized trials in meta‐analyses. Annals of Internal Medicine 2001;135(11):982‐9. [DOI] [PubMed] [Google Scholar]
Lechler 2005
- Lechler RI, Sykes M, Thomson AW, Turka LA. Organ transplantation ‐ how much of the promise has been realized?. Nature Medicine 2005;11(6):605‐13. [DOI] [PubMed] [Google Scholar]
Lundh 2012
- Lundh A, Sismondo S, Lexchin J, Busuioc OA, Bero L. Industry sponsorship and research outcome. Cochrane Database of Systematic Reviews 2012, Issue 12. [DOI: 10.1002/14651858.MR000033.pub2] [DOI] [PubMed] [Google Scholar]
Macaskill 2001
- Macaskill P, Walter SD, Irwig L. A comparison of methods to detect publication bias in meta‐analysis. Statistics in Medicine 2001;20(4):641‐54. [DOI] [PubMed] [Google Scholar]
Magliocca 2006
- Magliocca JF, Knechtle SJ. The evolving role of alemtuzumab (Campath‐1H) for immunosuppressive therapy in organ transplantation. Transplant International 2006;19(9):705‐14. [DOI] [PubMed] [Google Scholar]
Marcos 2004
- Marcos A, Eghtesad B, Fung JJ, Fontes P, Patel K, Devera M, et al. Use of alemtuzumab and tacrolimus monotherapy for cadaveric liver transplantation: with particular reference to hepatitis C virus. Transplantation 2004;78(7):966‐71. [DOI] [PMC free article] [PubMed] [Google Scholar]
Moher 1998
- Moher D, Pham B, Jones A, Cook DJ, Jadad AR, Moher M, et al. Does quality of reports of randomised trials affect estimates of intervention efficacy reported in meta‐analyses?. Lancet 1998;352(9128):609‐13. [DOI] [PubMed] [Google Scholar]
Moser 2002
- Moser MA. Options for induction immunosuppression in liver transplant recipients. Drugs 2002;62(7):995‐1011. [DOI] [PubMed] [Google Scholar]
Neuhaus 1993
- Neuhaus P, Bechstein WO, Blumhardt G, Wiens M, Lemmens P, Langrehr JM, et al. Comparison of quadruple immunosuppression after liver transplantation with ATG or IL‐2 receptor antibody. Transplantation 1993;55(6):1320‐7. [DOI] [PubMed] [Google Scholar]
O'Grady 2002
- O'Grady JG, Burroughs A, Hardy P, Elbourne D, Truesdale A. Tacrolimus versus microemulsified ciclosporin in liver transplantation: the TMC randomised controlled trial. Lancet 2002;360(9340):1119‐25. [DOI] [PubMed] [Google Scholar]
OPTN 2009
- OPTN / SRTR Annual Report. The U.S. Organ Procurement and Transplantation Network and the Scientific Registry of Transplant Recipients. www.ustransplant.org/annual_reports/current/ 2009 (accessed 19 March 2014).
Penninga 2012
- Penninga L, Wettergren A, Chan AW, Steinbrüchel DA, Gluud C. Calcineurin inhibitor minimisation versus continuation of calcineurin inhibitor treatment for liver transplant recipients. Cochrane Database of Systematic Reviews 2012, Issue 3. [DOI: 10.1002/14651858.CD008852.pub2] [DOI] [PMC free article] [PubMed] [Google Scholar]
Penninga 2013
- Penninga L, Møller CH, Penninga EI, Iversen M, Gluud C, Steinbrüchel DA. Antibody induction therapy for lung transplant recipients. Cochrane Database of Systematic Reviews 2013, Issue 11. [DOI: 10.1002/14651858.CD008927.pub2] [DOI] [PMC free article] [PubMed] [Google Scholar]
Penninga 2013a
- Penninga L, Møller CH, Gustafsson F, Gluud C, Steinbrüchel DA. Immunosuppressive T‐cell antibody induction for heart transplant recipients. Cochrane Database of Systematic Reviews 2013, Issue 12. [DOI: 10.1002/14651858.CD008842.pub2] [DOI] [PMC free article] [PubMed] [Google Scholar]
Penninga 2014
- Penninga L, Wettergren A, Wilson CH, Chan AW, Steinbrüchel DA, Gluud C. Antibody induction versus corticosteroid induction for liver transplant recipients. Cochrane Database of Systematic Reviews 2014, Issue 5. [DOI: 10.1002/14651858.CD010252.pub2] [DOI] [PMC free article] [PubMed] [Google Scholar]
Penninga 2014a
- Pennnga L, Gluud C, Wetterslev J. Meta‐analysis of randomised trials on laparoscopic versus open surgery for acute appendicitis: has firm evidence been reached?. Journal of Gastrointestinal Surgery 2014. [DOI: 10.1007/s11605-013-2264-8] [DOI] [PubMed] [Google Scholar]
Perera 2009
- Perera MT, Mirza DF, Elias E. Liver transplantation: issues for the next 20 years. Journal of Gastroenterology and Hepatology 2009;24(Suppl 3):S124‐S131. [DOI] [PubMed] [Google Scholar]
Pillai 2009
- Pillai AA, Levitsky J. Overview of immunosuppression in liver transplantation. World Journal of Gastroenterology 2009;15(34):4225‐33. [DOI] [PMC free article] [PubMed] [Google Scholar]
RevMan 2012 [Computer program]
- The Nordic Cochrane Centre, The Cochrane Collaboration. Review Manager (RevMan). Version 5.2. Copenhagen: The Nordic Cochrane Centre, The Cochrane Collaboration, 2012.
Royle 2003
- Royle P, Milne R. Literature searching for randomized controlled trials used in Cochrane reviews: rapid versus exhaustive searches. International Journal of Technology Assessment in Health Care 2003;19(4):591‐603. [DOI] [PubMed] [Google Scholar]
Savović 2012
- Savović J, Jones HE, Altman DG, Harris RJ, Jüni P, Pildal J, et al. Influence of reported study design characteristics on intervention effect estimates from randomized, controlled trials. Health Technology Assessment 2012;16(35):1‐82. [DOI] [PubMed] [Google Scholar]
Savović 2012a
- Savović J, Jones HE, Altman DG, Harris RJ, Jüni P, Pildal J, et al. Influence of reported study design characteristics on intervention effect estimates from randomized, controlled trials. Annals of Internal Medicine 2012;157(6):429‐38. [DOI] [PubMed] [Google Scholar]
Schulz 1995
- Schulz KF, Chalmers I, Hayes RJ, Altman DG. Empirical evidence of bias. Dimensions of methodological quality associated with estimates of treatment effects in controlled trials. JAMA 1995;273(5):408‐12. [DOI] [PubMed] [Google Scholar]
Seyfert‐Margolis 2010
- Seyfert‐Margolis V, Feng S. Tolerance: is it achievable in pediatric solid organ transplantation?. Pediatric Clinics of North America 2010;57:523‐38. [DOI] [PubMed] [Google Scholar]
Sgourakis 2009
- Sgourakis G, Radtke A, Fouzas I, Mylona S, Goumas K, Gockel I, et al. Corticosteroid‐free immunosuppression in liver transplantation: a meta‐analysis and meta‐regression of outcomes. Transplant International 2009;22(9):892‐905. [DOI] [PubMed] [Google Scholar]
SPIRIT 2013
- Chan AW, Tetzlaff JM, Altman DG, Laupacis A, Gøtzsche PC, Krleža‐Jerić K, et al. SPIRIT 2013 Statement: defining standard protocol items for clinical trials. Annals of Internal Medicine 2013;158:200‐7. [DOI] [PMC free article] [PubMed] [Google Scholar]
SPIRIT 2013a
- Chan A‐W, Tetzlaff JM, Gøtzsche PC, Altman DG, Mann H, Berlin J, et al. SPIRIT 2013 explanation and elaboration: guidance for protocols of clinical trials. BMJ (Clinical Research Ed.) 2013;346:e7586. [DOI] [PMC free article] [PubMed] [Google Scholar]
Starzl 2003
- Starzl TE, Murase N, Abu‐Elmagd K, Gray EA, Shapiro R, Eghtesad B, et al. Tolerogenic immunosuppression for organ transplantation. Lancet 2003; Vol. 361, issue 9368:1502‐10. [DOI] [PMC free article] [PubMed]
Starzl 2008
- Starzl TE. Immunosuppressive therapy and tolerance of organ allografts. New England Journal of Medicine 2008; Vol. 358, issue 4:407‐11. [DOI] [PMC free article] [PubMed]
Sweeting 2004
- Sweeting MJ, Sutton AJ, Lambert PC. What to add to nothing? Use and avoidance of continuity corrections in meta‐analysis of sparse data. Statistics in Medicine 2004;23(9):1351‐75. [MEDLINE: ] [DOI] [PubMed] [Google Scholar]
Thompson 2002
- Thompson SG, Higgins JP. How should meta‐regression analyses be undertaken and interpreted?. Statistics in Medicine 2002;21(11):1559‐73. [DOI] [PubMed] [Google Scholar]
Thorlund 2009
- Thorlund K, Devereaux PJ, Wetterslev J, Guyatt G, Ioannidis JP, Thabane L, et al. Can trial sequential monitoring boundaries reduce spurious inferences from meta‐analyses. International Journal of Epidemiology 2009;38(1):276‐86. [DOI] [PubMed] [Google Scholar]
Thorlund 2011
- Thorlund K, Imberger G, Walsh M, Chu R, Gluud C, Wetterslev J, et al. The number of patients and events required to limit the risk of overestimation of intervention effects in meta‐analysisa simulation study. PLoS One 2011;6(10):e25491. [DOI] [PMC free article] [PubMed] [Google Scholar]
Thorlund 2011a
- Thorlund K, Engstrøm J, Wetterslev J, Brok J, Imberger G, Gluud C. User manual forTrial Sequential Analysis (TSA). ctu.dk/tsa/files/tsa_manual.pdf 2011 (accessed 19 March 2014).
Transplant Activity Report 2009
- Transplant activity report 2008/2009 UK. www.organdonation.nhs.uk/ukt/statistics/statistics.jsp 2009 (accessed 19 March 2014).
Uemura 2011
- Uemura T, Schaefer E, Hollenbeak CS, Khan A, Kadry Z. Outcome of induction immunosuppression for liver transplantation comparing anti‐thymocyte globulin, daclizumab, and corticosteroid. Transplant International 2011;24(7):640‐50. [DOI] [PubMed] [Google Scholar]
Wang 2010
- Wang XF, Li JD, Peng Y, Dai Y, Shi G, Xu W. Interleukin‐2 receptor antagonists in liver transplantation: a meta‐analysis of randomized trials. Transplantation Proceedings 2010;42(10):4567‐72. [DOI] [PubMed] [Google Scholar]
Webster 2010
- Webster AC, Ruster LP, McGee R, Matheson SL, Higgins GY, Willis NS, et al. Interleukin 2 receptor antagonists for kidney transplant recipients. Cochrane Database of Systematic Reviews 2010, Issue 1. [DOI: 10.1002/14651858.CD003897.pub3] [DOI] [PMC free article] [PubMed] [Google Scholar]
Wetterslev 2008
- Wetterslev J, Thorlund K, Brok J, Gluud C. Trial sequential analysis may establish when firm evidence is reached in cumulative meta‐analysis. Journal of Clinical Epidemiology 2008;61(1):64‐75. [DOI] [PubMed] [Google Scholar]
Wetterslev 2009
- Wetterslev J, Thorlund K, Brok J, Gluud C. Estimating required information size by quantifying diversity in random‐effects model meta‐analyses. BMC Medical Research Methodology 2009;9:86. [DOI] [PMC free article] [PubMed] [Google Scholar]
Wiesner 2003
Wood 2008
- Wood L, Egger M, Gluud LL, Schulz KF, Jüni P, Altman GD, et al. Empirical evidence of bias in treatment effect estimates in controlled trials with different interventions and outcomes: meta‐epidemiological study. BMJ (Clinical Research Ed.) 2008;336:601‐5. [DOI] [PMC free article] [PubMed] [Google Scholar]
References to other published versions of this review
Penninga 2012a
- Penninga L, Wettergren A, Wilson CH, Steinbrüchel DA, Gluud C. Immunosuppressive T cell antibody induction therapy for liver transplant recipients. Cochrane Database of Systematic Reviews 2012, Issue 11, 2011 ‐ 10, 2012. [DOI: 10.1002/14651858.CD007341.pub2] [DOI] [Google Scholar]
Wilson 2008
- Wilson CH, Asher JF, Manas DM. Immunosuppressive T cell antibodies for liver transplant recipients. Cochrane Database of Systematic Reviews 2011, Issue 3, 2008 ‐ 10, 2011. [DOI: 10.1002/14651858.CD007341] [DOI] [Google Scholar]