

Abstract
Objective:
To test the use of macrophage colony-stimulating factor (M-CSF), an early osteoclast recruitment/differentiation factor, in increasing the rate of osteoclastic recruitment and differentiation as a means of accelerating tooth movement.
Materials and Methods:
The distribution of osteoclasts and their precursors in the periodontal ligament (PDL) of teeth was initially characterized in a mouse model by immunohistochemical expression analyses of markers of osteoclast differentiation. We next administered two different dosages of M-CSF in the PDL of molars subject to force. Tooth movement was measured and correlated with changes in expression of M-CSF downstream genes in the PDL.
Results:
We found that monocytes may have differentiated into preosteoclasts before being recruited to the PDL during the lag phase of tooth movement, and an influx of multinucleated osteoclasts occurred after 6 days. The lower dose of M-CSF was found to be most effective in increasing the amount of tooth movement and expression of M-CSF downstream genes and TRAP, an osteoclast marker. In contrast, administration of a higher dose of M-CSF resulted in a decrease in the expression of one gene downstream of M-CSF and possible inhibition of osteoclast formation.
Conclusions:
Exogenous administration of optimal dosages of M-CSF to orthodontically moved teeth provides potential for clinical studies in accelerating tooth movement.
Keywords: Osteoclasts, Acceleration of tooth movement
INTRODUCTION
The application of force during orthodontic tooth movement (OTM) results in bone resorption by osteoclasts (OCs) and deposition by osteoblasts on the pressure and tension sides of the periodontal ligament (PDL), respectively.1 Upon force application, teeth tip within the periodontal space, followed by a lag phase where recruitment of tissue-remodeling cells occurs.2 The rate-limiting step occurs during the lag phase, as OCs are recruited into the PDL from the bone marrow. OCs in the periodontal ligament originate from bone marrow precursors which mature into preosteoclasts that fuse and become activated to form multinucleated bone-resorbing OCs; however, the temporal pattern of OC differentiation during OTM is still unclear.3 The differentiation of precursors to mature OCs is regulated by macrophage colony-stimulating factor (M-CSF), known to induce OC differentiation by recruiting precursors, inhibiting apoptosis, and promoting expression of tumor necrosis factor family receptors important for cell fusion, receptor activator of nuclear factor kappa B (RANK).4,5 Additionally, when M-CSF binds to receptor c-Fms on monocytic lineage cells, macrophage marker F4/80 and vascular endothelial growth factor (VEGF) proteins are activated.6,7 RANK in turn binds its ligand (RANKL), inducing preosteoclastic cell fusion to produce polykaryon cells that become OCs.3
Attempts to accelerate the rate of OTM with pharmacologic agents have resulted in increased OTM.8,9 In this current study, we explored the effect of force application and the exogenous administration of an OC differentiation factor on the rate of OTM and PDL gene expression in a mouse model of OTM.
MATERIALS AND METHODS
Animal Models
Work performed on the animals in this study was approved by the Animal Ethics Committee of the University of Toronto. A 5-mm closed coil spring expanded to produce 12 cN was bonded on the right first maxillary molar and central incisor, with the contralateral untreated side as control (Figure 1). Coil expansion to produce 12 cN was determined using an Instron machine (data not shown). Maxillary impressions (Blu-Mousse Impression, Parkell, NY) were taken prior to appliance insertion and after euthanization.
Figure 1.
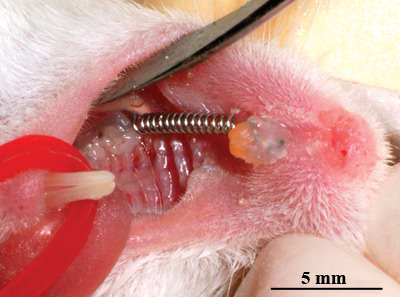
Orthodontic appliance. A 5-mm open 0.008 × 0.022 inch red Elgiloy coiled spring was placed between the maxillary incisors and the right first maxillary molar with light-cured resin on the buccal and labial surfaces of the molar and incisors, respectively.
A total of 73 ten-week-old male CD-1 mice (Charles River) were used. For the first part of the study, 20 mice were divided randomly into five test groups (n = 4) with 3 hours, and 1, 2, 4, and 6 days of orthodontic force. For the second part of the study, 48 mice were divided randomly into four groups: injection of low (0.1 µg/kg; ML) or high (1 µg/kg; MH) doses of recombinant mouse M-CSF (Calbiochem, Gibbstown, NJ) or phosphate buffered saline (PBS) with and without orthodontic force (F) application: control (PBS+F), and three experimental groups, (MH, ML+F, and MH+F). The four test groups were further subdivided (n = 6) according to 2 or 6 (D2, D6) days of force. Additionally, the bone density changes in the skeletons and skulls of five mice injected with 10, 1, 0.1, or 0.01 µg/kg of M-CSF and PBS, and euthanized after 6 days, were assessed by microcomputed tomography (μCT).
A 29-gauge needle containing approximately 10 µL of M-CSF or PBS was injected sub-periosteally into the distopalatal root of the right maxillary first molar. At the end of experimental period, the maxillae from the first part of the study were dissected, formalin fixed, decalcified for 10 weeks (17% EDTA), and sectioned horizontally for immunohistochemistry. For the second part of the study, the PDL of the experimental and control first maxillary molars was extracted and frozen at −80°C until RNA extraction. No distinction was made between the mesial and distal surfaces of each tooth because it was technically unfeasible due to the small size of murine molars and also, as previously shown by us,10 areas of compression occur in both mesial and distal regions of the PDL during force application.
Immunohistochemistry and TRAP Staining
Immunohistochemistry11 and TRAP staining12 were performed as described previously. Antibodies used were: F4/80 (Santa Cruz Biotechnology, Santa Cruz, Calif) and c-Fms antibody (Abcam, Cambridge, Mass). Positive-stained cells were quantified by defining a region of interest (ROI) in the mesial PDL of the distopalatal root of the maxillary first molars, on sections one third apical to the molar furcation. Positive and negative cells within and on the borders of each ROI were counted and expressed as a percentage of total cells. TRAP-positive cells were divided into mononucleate/binucleate and multinucleate groups. The criteria for denoting cells as C precursors, preosteoclasts, and OCs were based on the presence of c-Fms, F4/80 antigen, and TRAP within or on these cells, respectively. However TRAP-positive cells that are mononucleate or binucleate may also be considered preosteoclasts.3 Percentages of cells in the experimental groups were normalized to cells in the control/contralateral tooth within the same animal. Counts were done twice and expressed as means ± standard deviation. Statistical differences were evaluated using a multivariate analysis of variance (ANOVA) test followed by a Student's t-test (P < .05).
Real-time RT-PCR
Total RNA was extracted using an RNeasy Micro kit (Qiagen, Ontario) followed by reverse transcription and quantitative PCR by a one-step methodology. Duplicates were performed using gene-specific primers. Thermocycling conditions were: 50°C for 3 minutes and 95°C for 5 minutes, followed by 40 cycles of amplification at 95°C for 15 seconds alternating with 60°C for 30 seconds. The relative difference in expression of genes of interest was determined with the threshold cycle CT, with glyceraldehyde 3-phosphate dehydrogenase (GAPDH) as the internal standard for normalization. Significant differences between controls and duration of treatment were determined with two-way ANOVA (P < .05).
Tooth Movement Quantification
The distance from the mesial-buccal cusp tip of the first molar and distal-buccal cusp tip of the second molar was measured with an electronic caliper using maxillary impressions. Total movement was obtained by subtracting the intermolar distance prior to appliance insertion from that obtained after euthanization. Statistical differences were determined using a two-way ANOVA followed by a Student's t-test (P < .05).
RESULTS
Tooth Movement and c-Fms, F4/80, and TRAP-positive Cells During OTM
We focused on the phases of OTM in our mouse model: initial/tipping phase (3 and 24 hours), lag phase (2 days), and acceleration/linear phases (4 and 6 days). After confirming these phases were present in our OTM model (see results below), we characterized the presence of specific osteoclastic-cell types in the PDL compression site of orthodontically moved teeth using markers of monocytic lineage cells (c-Fms), F4/80-positive or mononucleated/binucleated TRAP-positive cells as preosteoclasts, and TRAP-positive multinucleated OCs. Cells that were c-Fms–positive were observed in the PDL after 3 hours (Figure 2B), showing an increase of 8.49% compared with the contralateral control of the same animal (compare Figure 2B with A). After 1 day, the percentage of c-Fms–positive cells decreased to control levels (Figure 2C), followed by another increase at day 2 to 14.33%, after which the number remained fairly constant (Figure 3A). F4/80-positive cells (arrows, Figure 2D through F) were present after 2 days (Figure 2F), showing a 17.10% increase compared with the control (Figure 2D). After 2 days we could no longer detect F4/80-positive cells (Figure 3B).
Figure 2.

Expression of OC differentiation markers in the mesial (compression) side of the PDL surrounding the distal-palatal root of the maxillary first molar during OTM. (A,B,C) c-Fms–positive cells (arrows). (A) Control. (B) 3 Hours. (C) 1 Day of force. (D,E,F) F4/80-positive cells (arrowheads). (D) Control. (E) 1 Day. (F) 2 Days of force. (G,H,I) TRAP-positive cells (red). (G) Control. (H) 4 Days of force. (I) 6 Days of force. (A,B,C,D,E,F) Counterstained with neutral red. (G,H,I) Hematoxylin and eosin (H&E). D indicates dentin; AB, alveolar bone.
Figure 3.

Percentage of stained cells during OTM. (A) c-Fms–positive cells. (B) F4/80-positive cells. (C) TRAP-positive cells. * P < .05 when compared with the previous time point. (D) Trends of positive cells (curves fit to original data).
TRAP-positive cells were present in the mesial side of the treated mice after 4 (arrows, Figure 2H) and 6 days (arrows, Figure 2I). Both mononucleated/binucleated and multinucleated cells were present after 4 days (Figure 2G). After 6 days, the number of mononucleated/binucleated-positive cells on the compression side decreased, while the percentage of multinucleated TRAP-positive cells increased (Figure 3C).
Tooth Movement and Gene Expression With M-CSF Administration
Based on the results above, we hypothesized that the rate of OTM could be accelerated if the differentiation and recruitment of the preosteoclastic populations of cells could be increased by the exogenous administration of an OC differentiation factor, M-CSF. We first determined whether delivery of M-CSF would result in any bone density effects by injecting 0.01–10 µg/kg of M-CSF into the PDL of the first molar. μCT scans performed on the axial and appendicular skeleton and skull revealed no changes in bone density in these mice after 6 days (Table 1). We next injected two different doses of M-CSF into the PDL of molars subject to force, using a dosage approximating those used for other proteins such as VEGF in OTM models: low dose (0.1 µg/kg; ML) and high dose (1 µg/kg; MH).13 At D2, teeth in groups subject to force (ie, PBS+F, ML+F, and MH+F) moved approximately the same amount (about 70 µm; Table 2), whereas group MH had negligible tooth movement at both D2 and D6 (Table 2). After 6 days, group ML+F had the most tooth movement (220 ± 18 µm) with a statistically significant difference compared to PBS+F (P < .05). There was no statistical difference in the amount of tooth movement between groups MH+F and PBS+F (Table 2; Figure 4A).
Table 1.
Bone Densities of Animals Treated With M-CSF

Table 2.
Tooth Movement With M-CSF and Orthodontic Treatment

Figure 4.

Tooth movement and PDL gene expression in OTM and M-CSF treated mice. (A) Movement of the right first maxillary molar after 6 days. * P < .05 compared to OTM and PBS group. (B,C,D) Relative gene expression by the cells of the PDL after 2 and 6 days. (B) VEGF expression. (C) RANK expression. (D) TRAP expression. * P < .05 when compared to that of the OTM and PBS group.
To determine whether the change in tooth movement associated with M-CSF administration could be correlated with a change in preosteoclast activity at the gene expression level, we used real-time RT-PCR to quantify the expression of M-CSF downstream markers in the PDL tissues of teeth at D2 and D6 of force application. We chose VEGF and RANK in addition to TRAP, a marker of OCs. In group PBS+F, the expression of all three markers was increased at D2 and D6 of force application (Figure 4A through C). Analysis of VEGF expression revealed that M-CSF administration at either dose level resulted in its elevation at D2 and D6, regardless of the presence of force (Figure 4B). VEGF expression increased from D2 to D6 in all groups, with the highest and lowest increases in groups ML+F and MH+F, respectively (Figure 4B). Similar trends were noted in the expression of RANK in each of the groups (Figure 4C), with one significant difference: RANK levels in group MH+F were lower than group PBS+F after 6 days. TRAP expression in groups MH and MH+F was not significantly different from PBS+F, but was observed to be much higher at D2 and D6 in group ML+F (Figure 4D). In summary, the greatest increase in gene expression was observed in the group subjected to force and injected with the lower dose of M-CSF, the group that also had the most tooth movement.
DISCUSSION
Our study is one of few to characterize the basic cellular and molecular events of a specific cell type at a distinct phase of OTM. Initially, we observed the distinct phases of tooth movement in our model of OTM, replicating work performed by others, and validating the use of our mouse model for subsequent studies.1 Our immunolocalization data suggest that at the cellular/molecular level, entry of the c-Fms–positive (monocytic lineage) cells, after only 3 hours of OTM and its subsequent disappearance, is most likely an aseptic wounding response due to compressive forces in the PDL, leading to cell death and the release of cytokines involved in the inflammatory process.14 This influx of c-Fms–positive cells, without an increase in F4/80-positive cells, may indicate the presence of neutrophils (c-Fms–positive and F4/80-negative cells), typically the first cell type to arrive during wounding.15
There is currently no known unique marker of preosteoclastic cells. We chose the F4/80 marker because it is expressed by preosteoclasts and macrophages16 but not monocytes or mature OCs.17 After 2 days of force, the spike in the number of c-Fms–positive cells concomitant with the presence of F4/80-positive cells suggest that these cells are either differentiating into OCs (ie, preosteoclasts) or they are macrophages. The presence of F4/80-positive cells after the second day of OTM and the subsequent appearance of mononucleated and binucleated TRAP-positive cells (which are considered to be more differentiated preosteoclasts) after 4 days, suggests strongly that preosteoclasts, and not mature OCs, are very likely recruited to the PDL. Furthermore, if these F4/80-positive cells do represent preosteoclastic cells, the lack of c-Fms–positive cells just prior to the presence of F4/80-positive cells suggests that monocytes (c-Fms–positive) may be undergoing differentiation into preosteoclasts before being recruited to the PDL, a theory corroborated by another group.18 The number of mononucleated/binucleated TRAP-positive OCs decreased after 6 days concomitant with an increase in the number of multinucleated TRAP-positive cells, due most likely to fusion of mononucleate and binucleate cells to form multinucleated OCs necessary for bone resorption.
We showed variation in gene response between the groups that received two different doses of M-CSF, corroborating other work demonstrating the biphasic effects of M-CSF on OCs.19 High levels of M-CSF can have inhibitory effects on OC differentiation and impede mature OC bone resorption, explaining the decreased gene expression in groups receiving a higher dose of M-CSF.20 Decreased RANK expression at D6 of force application in MH+F suggests an inhibition of OC formation and function with high doses, supported by the much higher TRAP expression level in ML+F. While OTM was not inhibited (Figure 4A) when compared to PBS+F, the high dose administration did not aid OTM. In retrospect, it would have been useful to see the effects of the low dose without force. We suspect that a lower dose of M-CSF would result in gene expression change values that would likely be similar to that of group PBS+F, where OCs are not inhibited.
Although many groups have attempted to accelerate tooth movement pharmacologically, no studies so far have addressed the molecular changes in the PDL consequent to the administration of exogenous substances. We showed, by real-time RT-PCR, that M-CSF application in the PDL during OTM had an effect on osteoclastic differentiation at the molecular level. One advantage to using a PCR-based quantitative gene expression analysis during OTM is that it is able to detect gene expression changes with relatively small amount of starting tissues, an issue of great importance when dealing with murine teeth which have sizes of about a millimeter or two in all dimensions. Thus, compared to either a Western blot or a northern blot assay, much less starting material is required for a PCR-based assay. Even then, however, the main challenge still lay in harvesting enough tissues from the PDL for extraction of RNA for subsequent gene analysis. With the amount of RNAs that we had, we were therefore careful to perform standard curves of each primer set to ensure efficiency of primers and integrity of RNA. Our results indicate that we were successful in reproducing data shown by others with immunohistochemistry and TRAP staining.18 We were additionally able to quantify expression level changes between treatment groups, an analysis that has not been performed in other studies.
Exogenous application of other agents did result in increases in OTM; most of these studies, however, involved frequent administration (eg, daily or every 2–3 days).8,9 We achieved an increase of 14% with only one injection of M-CSF and believe the one-time injection compared to frequent applications may offer a good option in a clinical setting. Conceivably, M-CSF may be able to be administered during appliance activation/reactivation without increasing the number of visits to the orthodontist's office, therefore decreasing treatment duration without increasing appointments. Additionally, the administration of M-CSF may also offer the advantage of using lower force values, eliminating the likelihood of unwanted root resorption. Further studies need to be conducted to determine the long-term effect of multiple M-CSF administrations that coincide with reactivations of orthodontic appliances.
CONCLUSIONS
Our results suggest that preosteoclasts and not monocytes may be recruited to the PDL during OTM in mice and that these cells may be targeted for acceleration of tooth movement.
Our data showed that exogenous administration of optimal dosages of M-CSF resulted in measureable changes in tooth movement and gene expression, providing potential for clinical studies in accelerating tooth movement.
REFERENCES
- 1.Krishnan V, Davidovitch Z. Cellular, molecular, and tissue-level reactions to orthodontic force. Am J Orthod Dentofacial Orthop. 2006;129:469.e1–469.e32. doi: 10.1016/j.ajodo.2005.10.007. [DOI] [PubMed] [Google Scholar]
- 2.Rody W. J, King G. J, Gu G. Osteoclast recruitment to sites of compression in orthodontic tooth movement. Am J Orthod Dentofacial Orthop. 2001;120:477–489. doi: 10.1067/mod.2001.118623. [DOI] [PubMed] [Google Scholar]
- 3.Boyle W. J, Simonet W. S, Lacey D. L. Osteoclast differentiation and activation. Nature. 2003;423:337–342. doi: 10.1038/nature01658. [DOI] [PubMed] [Google Scholar]
- 4.Pilkington M. F, Sims S. M, Dixon S. J. Wortmannin inhibits spreading and chemotaxis of rat osteoclasts in vitro. J Bone Miner Res. 1998;13:688–694. doi: 10.1359/jbmr.1998.13.4.688. [DOI] [PubMed] [Google Scholar]
- 5.Hotokezaka H, Sakai E, Ohara N, et al. Molecular analysis of RANKL-independent cell fusion of osteoclast-like cells induced by TNF-alpha, lipopolysaccharide, or peptidoglycan. J Cell Biochem. 2007;101:122–134. doi: 10.1002/jcb.21167. [DOI] [PubMed] [Google Scholar]
- 6.Curry J. M, Eubank T. D, Roberts R. D, Wang Y, Pore N, Maity A, Marsh C. B. M-CSF signals through the MAPK/ERK pathway via Sp1 to induce VEGF production and induces angiogenesis in vivo. PLoS One. 2008;3:e3405. doi: 10.1371/journal.pone.0003405. [DOI] [PMC free article] [PubMed] [Google Scholar]
- 7.Blair H. C, Robinson L. J, Zaidi M. Osteoclast signalling pathways. Biochem Biophys Res Commun. 2005;328:728–738. doi: 10.1016/j.bbrc.2004.11.077. [DOI] [PubMed] [Google Scholar]
- 8.Kanzaki H, Chiba M, Arai K, Takahashi I, Haruyama N, Nishimura M, Mitani H. Local RANKL gene transfer to the periodontal tissue accelerates orthodontic tooth movement. Gene Ther. 2006;13:678–685. doi: 10.1038/sj.gt.3302707. [DOI] [PubMed] [Google Scholar]
- 9.Hashimoto F, Kobayashi Y, Mataki S, Kobayashi K, Kato Y, Sakai H. Administration of osteocalcin accelerates orthodontic tooth movement induced by a closed coil spring in rats. Eur J Orthod. 2001;23:535–545. doi: 10.1093/ejo/23.5.535. [DOI] [PubMed] [Google Scholar]
- 10.Brooks P. J, Nilforoushan D, Manolson M. F, Simmons C. A, Gong S. G. Molecular markers of early orthodontic tooth movement. Angle Orthod. 2009;79:1108–1113. doi: 10.2319/121508-638R.1. [DOI] [PubMed] [Google Scholar]
- 11.Gong S. G. Characterization of olfactory nerve abnormalities in Twirler mice. Differentiation. 2001;69:58–65. doi: 10.1046/j.1432-0436.2001.690106.x. [DOI] [PubMed] [Google Scholar]
- 12.van de Wijngaert F. P, Burger E. H. Demonstration of tartrate-resistant acid phosphatase in un-decalcified, glycolmethacrylate-embedded mouse bone: a possible marker for (pre)osteoclast identification. J Histochem Cytochem. 1986;34:1317–1323. doi: 10.1177/34.10.3745910. [DOI] [PubMed] [Google Scholar]
- 13.Kaku M, Kohno S, Kawata T, Fujita I, Tokimasa C, Tsutsui K, Tanne K. Effects of vascular endothelial growth factor on osteoclast induction during tooth movement in mice. J Dent Res. 2001;80:1880–1883. doi: 10.1177/00220345010800100401. [DOI] [PubMed] [Google Scholar]
- 14.Lilja E, Lindskog S, Hammarstrom L. Histochemistry of enzymes associated with tissue degradation incident to orthodontic tooth movement. Am J Orthod. 1983;83:62–75. doi: 10.1016/0002-9416(83)90273-7. [DOI] [PubMed] [Google Scholar]
- 15.Schaller E, MacFarlane A. J, Rupec R. A, Gordon S, McKnight A. J, Pfeffer K. Inactivation of the F4/80 glycoprotein in the mouse germ line. Mol Cell Biol. 2002;22:8035–8043. doi: 10.1128/MCB.22.22.8035-8043.2002. [DOI] [PMC free article] [PubMed] [Google Scholar]
- 16.Hirsch S, Austen J. M, Gordon S. Expression of the macrophage-specific antigen F4/80 during differentiation of mouse bone marrow cells in culture. J Exp Med. 1981;154:713–725. doi: 10.1084/jem.154.3.713. [DOI] [PMC free article] [PubMed] [Google Scholar]
- 17.Grigoriadis E, Wang Z. Q, Cecchini M. G, Hofstetter W, Felix R, Fleisch H. A, Wagner E. F. c-Fos: a key regulator of osteoclast-macrophage lineage determination and bone remodeling. Science. 1994;266:443–448. doi: 10.1126/science.7939685. [DOI] [PubMed] [Google Scholar]
- 18.Xie R, Kuijpers-Jagtman A. M, Maltha J. C. Osteoclast differentiation during experimental tooth movement by a short-term force application: an immunohistochemical study in rats. Acta Odontol Scand. 2008;66:314–320. doi: 10.1080/00016350802317488. [DOI] [PubMed] [Google Scholar]
- 19.Hattersley G, Dorey E, Horton M. A, Chambers T. J. Human macrophage colony-stimulating factor inhibits bone resorption by osteoclasts disaggregated from rat bone. J Cell Physiol. 1988;137:199–203. doi: 10.1002/jcp.1041370125. [DOI] [PubMed] [Google Scholar]
- 20.Corboz V. A, Cecchini M. G, Felix R, Fleisch H, van der Pluijm G, Lowik C. W. Effect of macrophage colony-stimulating factor on in vitro osteoclast generation and bone resorption. Endocrinology. 1992;130:437–442. doi: 10.1210/endo.130.1.1727717. [DOI] [PubMed] [Google Scholar]