

Abstract
Background:
Multiple sclerosis (MS) is a chronic neuroinflammatory disorder, in which activated immune cells directly or indirectly induce demyelination and axonal degradation. Inflammatory stimuli also change the phenotype of astrocytes, making them neurotoxic. The resulting ‘toxic astrocyte’ phenotype has been observed in animal models of neuroinflammation and in MS lesions. Proteins secreted by toxic astrocytes are elevated in the cerebrospinal fluid (CSF) of MS patients and reproducibly correlate with the rates of accumulation of neurological disability and brain atrophy. This suggests a pathogenic role for neurotoxic astrocytes in MS.
Methods:
Here, we applied a commercially available library of small molecules that are either Food and Drug Administration-approved or in clinical development to an in vitro model of toxic astrogliosis to identify drugs and signaling pathways that inhibit inflammatory transformation of astrocytes to a neurotoxic phenotype.
Results:
Inhibitors of three pathways related to the endoplasmic reticulum stress: 1) proteasome, 2) heat shock protein 90 and 3) mammalian target of rapamycin reproducibly decreased inflammation-induced conversion of astrocytes to toxic phenotype. Dantrolene, an anti-spasticity drug that inhibits calcium release through ryanodine receptors expressed in the endoplasmic reticulum of central nervous system cells, also exerted inhibitory effect at in vivo achievable concentrations. Finally, we established CSF SERPINA3 as a relevant pharmacodynamic marker for inhibiting toxic astrocytes in clinical trials.
Conclusion:
Drug library screening provides mechanistic insight into the generation of toxic astrocytes and identifies candidates for immediate proof-of-principle clinical trial(s).
Keywords: multiple sclerosis, toxic astrogliosis, neurotoxicity, SERPINA3, drug library screening
1). INTRODUCTION
Multiple sclerosis (MS) is a chronic inflammatory disease of the central nervous system (CNS), where activated immune cells directly or indirectly contribute to the loss of myelin sheath from axons, leading to neurodegeneration. Affecting over 2.0 million individuals worldwide, MS is the most common non-traumatic neurological disability in young adults (Markowitz, 2014).
Recruitment of immune cells from blood forms acute MS lesions in relapsing-remitting MS (RR-MS) (Frischer et al., 2009; Kirk et al., 2003). Development of focal lesions diminishes in later stages of MS (progressive MS [P-MS]), even though P-MS patients have levels of immune cell-specific cerebrospinal fluid (CSF) biomarkers indistinguishable from that of RR-MS (Komori et al., 2015), indicating persistent CNS inflammation. Consequently, the age-related decrease in the efficacy of immunomodulatory drugs on MS disability progression (Weideman et al., 2017) has been attributed to inflammation compartmentalized to CNS tissue, largely inaccessible to current drugs. Alternatively, neurodegenerative mechanisms may drive CNS tissue destruction in P-MS.
Inflammation-induced change in the phenotype and function of astrocytes towards “neurotoxic” (or “A1”) astrocytes identified in animal models of neuroinflammation represent a candidate neurodegenerative mechanism in MS (Brambilla, 2019; Kamermans et al., 2019; Yi et al., 2019). Immunohistochemistry and in situ hybridization showed the presence of complement factor 3 (C3; a putative marker of “A1” astrocytes defined in animals) in the astrocytes in MS lesions (Liddelow et al., 2017), with acute inflammatory lesions showing significantly higher numbers of C3+/GFAP+ astrocytes per mm2 compared to chronic inactive MS lesions. No other markers of neurotoxic astrocytes were evaluated.
In a different study, identification of CNS cell-specific protein clusters within the MS CSF proteome detected only two clusters of proteins that reproducibly correlated with the rate of disability accumulation in MS patients (Masvekar et al., 2019b). One protein cluster was enriched for microglia-secreted proteins while the second cluster constituted proteins secreted mostly by inflammatory stimuli-activated astrocytes. Indeed, proteins of this cluster partially overlap with the aforementioned neurotoxic astrocyte signature (Liddelow et al., 2017). Because this unbiased screen of CNS cell-enriched protein clusters supported a potential pathogenic role of neurotoxic astrocytes in MS progression, we sought to develop an in vitro model of inflammation-induced neurotoxic astrocyte formation for a drug library screen, with two related aims: 1) to elucidate signaling pathways/druggable targets that underlie toxic astrocyte transformation; and 2) to identify FDA-approved drug(s) with an acceptable toxicity profile for immediate use in proof-of-principle clinical trial of toxic astrocyte inhibition in MS.
2). MATERIALS and METHODS
2.1). Peripheral Blood Mononuclear Cells (PBMCs) Isolation and Stimulation
PBMCs were isolated using density gradient centrifugation as described (10). PBMC (1×10⁶ cells/ml i.e., 4×10⁵ cells/cm2) were cultured in serum-free media (X-vivo TM-10) and either left untreated or stimulated with lipopolysaccharide (LPS; Sigma-Aldrich, St. Louis, MO; 100 ng/ml) and CD3/CD28 microbeads (Invitrogen, Carlsbad, CA; at 1:1 beads to cells ratio). After 24 hours, cell-free supernatants were collected, aliquoted and stored at −80°C until further use. We validated stimulation of PBMCs via confirming elevated concentrations of proinflammatory cytokines (TNFα and IL1α) in culture supernatants (Supplementary Figure 1).
2.2). Astrocyte Cultures and Treatments
Primary human astrocytes from cerebral cortex (ScienCell, Carlsbad, CA; Catalog#: 1800; purchased and used before 05/2019) were cultured (105 cells/ml, 100 μl/well in a 96-well plate i.e., 3.1×10⁴ cells/cm2) on poly-L-lysine (PLL)-coated plates; After 24 hours, cells were treated with 50% volume/volume of either unstimulated- or stimulated-PBMCs supernatants. 24 hours after treatment, cell-free culture supernatants were collected, aliquoted and stored at −80°C until further use. Cells were detached from the culture plate using trypsin-EDTA for downstream applications.
2.3). Immunostaining and Flow Cytometry
Astrocytes were immuno-stained for intracellular complement component 3 (C3) and serine protease inhibitor family A member 3 (SERPINA3) (Liddelow et al., 2017; Zamanian et al., 2012). Briefly, cells were resuspended in fixation/permeabilization solution (BD Biosciences, San Jose, CA) for 20 min at 4°C, washed with permeabilization/wash buffer and stained with anti-C3 (Sigma-Aldrich; Catalog#: GW20073F) or -SERPINA3 (R&D Systems; Catalog#: MAB1295) antibodies conjugated with fluorescence-tag (PE/Cy7, Lightning-Link® Antibody Labeling Kit, R&D Systems). Stained cells were washed twice and then analyzed using fluorescence-activated flow-cytometry (BD LSR II Flow Cytometer, BD Biosciences).
2.4). ELISA
C3 level in astrocyte culture supernatants were measured using commercially available ELISA kit (Genway Biotech, San Diego, CA; Catalog#: GWB-1C0767). All samples were diluted 1:1 with 1% BSA/PBS and assayed as per manufacturer’s instructions.
Matching CSF and serum samples were analyzed for SERPINA3 using commercially available ELISA kit (RayBiotech, Norcross, GA; Catalog#: ELH-SerpinA3). CSF and serum samples were diluted 1:500 and 1:15000 respectively with provided assay diluent and assayed as per manufacturer’s instructions.
2.5). Research Subjects
All subjects were prospectively recruited under NIH IRB-approved protocol (ClinicalTrials.gov Identifier: NCT00794352), between 10/2008 and 04/2016. All subjects underwent neurological examination to derive the measures of neurological disability Expanded Disability Status Scale (EDSS) (Kurtzke, 1983) and Combinatorial Weight-Adjusted Disability Scale (CombiWISE) (Kosa et al., 2016). Composite magnetic resonance imaging (MRI) scale of CNS tissue destruction (COMRIS-CTD) was calculated from 3T brain MRI images as described (Kosa et al., 2015). MS severity measures were calculated based on published algorithms either from EDSS: Multiple Sclerosis Severity Score (MSSS) (Roxburgh et al., 2005) and Age-Related Multiple Sclerosis Severity (ARMSS) (Manouchehrinia et al., 2017) or from CombiWISE: Multiple Sclerosis Disease Severity Scale (MSDSS) (Weideman et al., 2017). MS diagnostic subgroups (RR-MS, secondary and primary progressive MS [SP-MS and PP-MS]) were classified using McDonald’s criteria, 2010 revisions (Polman et al., 2011).
Healthy donors (HD) and untreated MS patients (Table 1 and Supporting Data File 1) were randomly divided into training and validation cohorts, stratified on age, gender, MS type and MS severity (Masvekar et al., 2019b).
Table 1:
All subjects were divided into two cohorts: training and validation.
| Training Cohort (N = 169) | |||||
| HD | RR-MS | P-MS | P value | ||
|
| |||||
| Gender (N) | female/male | 8/10 | 35/23 | 44/49 | 0.2431 |
|
| |||||
| Age (yrs) | mean (SD) | 39.9 (15.6) | 40.2 (11.3) | 52.6 (10.4) | <0.0001 |
| range | 19.4 – 70.3 | 18.0 – 68.7 | 22.0 – 65.8 | ||
|
| |||||
| EDSS | mean (SD) | - | 2.0 (1.5) | 5.5 (1.6) | <0.0001 |
| range | - | 0.0 – 6.5 | 1.5 – 8.5 | ||
|
| |||||
| CombiWISE | mean (SD) | - | 15.6 (10.8) | 43.0 (14.7) | <0.0001 |
| range | - | 2.2 – 50.4 | 9.4 – 84.5 | ||
|
| |||||
| COMRIS-CTD | mean (SD) | - | 8.4 (5.7) | 15.0 (6.2) | <0.0001 |
| range | - | 0.0 – 22.0 | 3.7 – 31.5 | ||
|
| |||||
| MSSS | mean (SD) | - | 4.0 (2.2) | 6.8 (2.0) | <0.0001 |
| range | - | 0.2 – 9.2 | 1.2 – 10.0 | ||
|
| |||||
| ARMSS | mean (SD) | - | 3.5 (2.3) | 6.5 (2.2) | <0.0001 |
| range | - | 0.2 – 9.5 | 0.9 – 9.9 | ||
|
| |||||
| MSDSS | mean (SD) | - | 1.4 (0.7) | 2.1 (1.1) | <0.0001 |
| range | 0.4 – 3.5 | 0.3 – 5.3 | |||
|
| |||||
| Validation Cohort (N = 164) | |||||
| HD | RR-MS | P-MS | P value | ||
|
| |||||
| Gender(N) | female/male | 10/11 | 35/19 | 48/41 | 0.2965 |
|
| |||||
| Age (yrs) | mean (SD) | 35.6 (11.0) | 39.5 (10.6) | 53.9 (9.0) | <0.0001 |
| range | 19.7 – 57.4 | 18.3 – 67.9 | 29.8 – 74.7 | ||
|
| |||||
| EDSS | mean (SD) | - | 1.6 (1.0) | 5.3 (1.5) | <0.0001 |
| range | - | 0.0 – 6.0 | 2.0 – 7.5 | ||
|
| |||||
| CombiWISE | mean (SD) | - | 12.5 (6.9) | 42.2 (13.6) | <0.0001 |
| range | - | 2.4 – 35.5 | 14.5 – 70.8 | ||
|
| |||||
| COMRIS-CTD | mean (SD) | - | 8.4 (5.5) | 14.6 (5.9) | <0.0001 |
| range | - | 0.0 – 23.5 | 0.0 – 26.3 | ||
|
| |||||
| MSSS | mean (SD) | - | 3.6 (2.2) | 6.8 (1.8) | <0.0001 |
| range | - | 0.2 – 9.4 | 1.3 – 9.8 | ||
|
| |||||
| ARMSS | mean (SD) | - | 3.1 (1.9) | 6.2 (2.2) | <0.0001 |
| range | - | 0.3 – 7.4 | 0.9 – 9.5 | ||
|
| |||||
| MSDSS | mean (SD) | - | 1.3 (0.5) | 2.1 (0.9) | <0.0001 |
| range | - | 0.5 – 2.6 | 0.7 – 4.4 | ||
Gender distribution (Chi-square test), age (ANOVA), and clinical outcome measures (EDSS, CombiWISE, COMRIS-CTD, MSSS, ARMSS and MSDSS; t-test) were compared across diagnostic categories (HD, RR-MS, and P-MS [comprised of both SP-MS and PP-MS]).
2.6). CSF Collection and Processing
CSF were collected by lumbar puncture and processed as per standard operating procedure (Barbour et al., 2017). CSF was collected and transported on ice and processed within 30 min or collection. Cell-free CSF supernatants were collected by centrifugation (335g for10 min), aliquoted, labeled using alphanumeric code and stored at −80°C.
2.7). DNA-Aptamer-Based Multiplex Proteomics
CSF and cell culture supernatants were analyzed using the Slow Off-rate Modified Aptamers scan (SOMAscan®; SomaLogic Inc., Boulder, CO) (Gold et al., 2010). CSF supernatants were analyzed using the 1.1K SOMAscan platform (available from 06/2012 to 10/2016), and cell culture supernatants were analyzed using the 1.3K platform (available from 11/2016).
As SOMAscan output is in form of relative concentration units (relative fluorescence units, RFU), we presented our results in form fold-change using ‘toxic vs resting astrocytes index’ as follows: first to identify fold-change during respective treatment period we calculated ratio of RFU at the end of treatment (24 h) versus at the start of treatment (0 h). Then to identify effect of treatment we calculated ratio of treatment (stimulated) versus control (unstimulated); ‘toxic vs resting astrocytes index’ = (stimulated RFU at 24h / stimulated RFU at 0h) / (unstimulated RFU at 24h / unstimulated RFU at 0h).
2.8). Neurotoxicity
The human neuroblastoma cell line, SK-N-SH (ATCC® HTB-11™; ATCC, Manassas, VA), was cultured (105 cells/ml, 100 μl/well in a 96-well plate i.e., 3.1×10⁴ cells/cm2) on poly-L-lysine (PLL)-coated plates; After 24 hours, cells were treated with either unstimulated- or stimulated-astrocyte culture supernatants (50% v/v). After 24 hours neuronal death were analyzed using Annexin V-FITC (Trevigen Inc., Gaithersburg, MD) as described (Masvekar et al., 2019a).
Similarly, direct neurotoxic effects of conditioned media from unstimulated/stimulated PBMCs were analyzed. Supernatants from unstimulated- or stimulated-PBMCs were added (50% v/v) to PLL-coated, cell (astrocyte)-free flasks and incubated for 24 hours. Conditioned media from these cell-free flasks were collected and stored similarly to conditioned media from unstimulated- or stimulated-astrocyte. Conditioned media from cell-free flasks were added (50% v/v) to neuroblastoma cell line cultures, and after 24 hours apoptotic neurons were analyzed as described previously; there was no statistically significant difference between cell-free flask conditioned (unstimulated vs stimulated) media-mediated neuronal apoptosis (Supplementary Figure 2).
2.9). Drug Library Screening
Astrocytes were plated (105 cells/ml) on PLL-coated 96-well cell-culture plates (100 μl/well). After 24 hours, cells were treated with either unstimulated- or stimulated-PBMCs supernatants (50% v/v) in the presence of a respective drug. The library screen (1431 drugs; Selleckchem LLC, Houston, TX; Catalog#: L1300) was performed twice: once with 100 nM and then with 10 nM drug concentrations. Equivalent concentrations of dimethyl sulfoxide (DMSO, a drug solvent) were used as control. 24 hours after treatment, supernatants were collected, and C3 levels were analyzed by ELISA. Percent change in absolute C3 secretion for a drug treatment with respect to control was calculated: ([C3 secretion by stimulated astrocytes with a drug treatment – C3 secretion by unstimulated astrocytes] / [C3 secretion by stimulated astrocytes with DMSO treatment – C3 secretion by unstimulated astrocytes]) X 100. Toxicity of respective drugs on cultured astrocytes were analyzed using the calorimetric assay that measures metabolic activity of viable cells (i.e., MTT assay, ThermoFisher Scientific, Waltham, MA) which after collection of cell culture supernatants.
2.10). Statistical Analyses
To differentiate biomarkers specific for MS biology from physiological age- and gender-differences, CSF SOMAscan values for all subjects were adjusted for age and gender dependency within HD subgroup as described (Barbour et al., 2020).
Group-wise comparisons across multiple groups were performed using Analysis of Variance (ANOVA). When statistically significant (p < 0.05) differences were found, pairwise multiple comparisons using Tukey’s p-value adjustments were performed. Comparisons between only two subgroups were performed using Welch’s t-test. Kruskal-Wallis ANOVA was used to examine differences between diagnostic subgroups in biomarker values within the training cohort, followed by pairwise multiple comparisons using Dunn’s p-value adjustment. Only statistically significant (adjusted p-value < 0.05) differences were then validated in an independent validation cohort.
Relationship between astrocyte-specific biomarkers and clinical outcomes were examined using Spearman correlations. Only statistically significant (p < 0.05) correlation coefficients in the training cohort were then validated in an independent validation cohort.
Drugs from the library screen were grouped based on their known targets (153 groups). Mean C3 concentrations (normalized to control treatment) of drugs that did not induce substantial toxicity (i.e., MTT > 75%), at 100 nM concentrations, were calculated and compared with C3 levels of control (i.e., 100%) using ANOVA. P-values were adjusted for multiple comparisons using Benjamini and Hochberg False Discovery Rate.
Concentration-response curves for selected drugs were created via nonlinear regression /curve fitting (Log[inhibitor] vs normalized response) using GraphPad Prism. With limited available data points (only 4 concentrations: 0, 10, 100, and 1000 nM) software was able to find a best-fit line but was unable to calculate a complete confidence interval. Thus, LogIC50 or IC50 values extrapolated from these best-fit lines should be interpreted with caution.
3). RESULTS
3.1). Expression of Toxic Astrogliosis Biomarkers
Although in animal model(s) the “A1” astrocytes were induced by LPS-stimulated microglia and subsequently by three microglia-secreted pro-inflammatory stimuli (i.e., TNF, IL-1a and C1q), this is non-physiological situation, difficult to translate to MS, where CNS tissue is infiltrated by cells of both adaptive and innate immunity. Thus, to generate more physiological human in-vitro model, we asked whether supernatant from polyclonally (i.e., LPS+CD3/CD28 microbeads)-stimulated PBMCs induce similar transformation of resting astrocytes to “neurotoxic phenotype” observed in animals.
First, we analyzed supernatants from polyclonally-stimulated PBMC using DNA-aptamer-based multiplex proteomic assay (SOMAscan®.; Supporting Data File 2). The most upregulated protein was IL-6 (35.6-fold), while TNFα, IL22, IL12/23b, IL9, IFNγ were all upregulated at least 5-fold. We have confirmed the strong secretion of TNFα and IL-1α by polyclonally activated PBMCs by ELISA (Supplementary Figure 1).
The pathway analysis of the proteins enriched in stimulated PBMC supernatants (Supporting Data File 3) included IL-17 signaling pathway (false discovery rate [FDR]-adjusted p-value 1.93e-19, Rheumatoid arthritis (FDR p=3.57e-14), Inflammatory bowel disease (FDR p=1.08e-11) and Type I diabetes mellitus (FDR p=1.4e-7). Thus, we conclude that our selected pro-inflammatory stimulus is highly relevant to human autoimmune diseases.
Next we analyzed secretome of PBMC-supernatants-stimulated astrocytes for putative markers of “A1” versus “A2” mouse astrocytes, previously defined by transcriptome profiling (Zamanian et al., 2012): None of the ‘A2’ astrocyte-specific markers, with linear fold change (FC) at least five times higher in ‘A2’ compared to ‘A1’ astrocytes, present in SOMAscan® assay were elevated (i.e., >1.5 toxic vs resting astrocytes index) in our pro-inflammatory supernatants co-cultured astrocytes. On the other hand, ‘A1’ astrocytes-specific markers, such as C3 (Clarke et al., 2018; Fan and Huo, 2021; Li et al., 2020, 2019; Liddelow et al., 2017; Ugalde et al., 2020; Zou et al., 2019), SERPING1 (Fan and Huo, 2021; Liddelow et al., 2017), and CFB (Li et al., 2019) have shown to be robustly elevated in our experimental model (C3: figure 1 and supplementary table 1; SERPING1: Supplementary Figure 3; CFB: supplementary table 1). We confirmed upregulation of C3 and SERPINA3 in our toxic astrocyte model by intracellular flow cytometry (Figure 1A).
Figure 1:
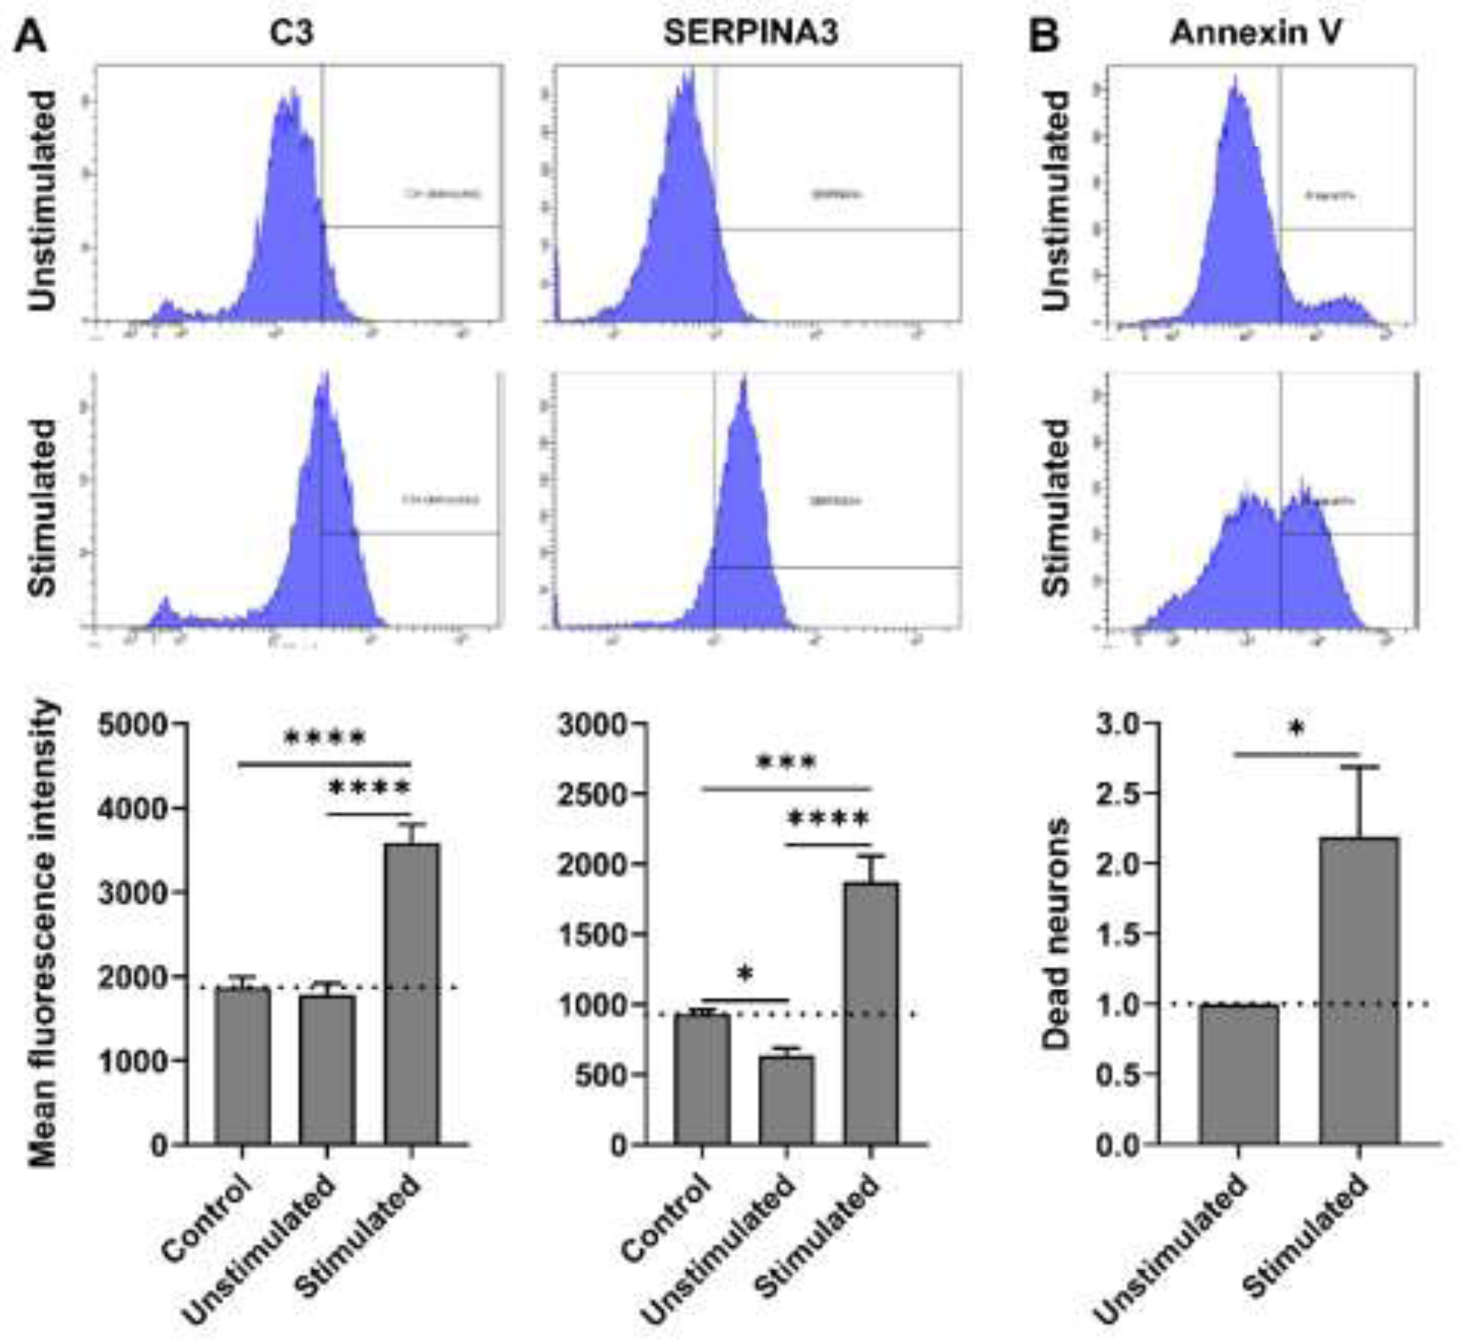
(A) Representative flow cytometry images of astrocytes immuno-stained for C3 and SERPINA3, 24 hours after treatment with unstimulated- or stimulated-PBMCs supernatants. Intracellular expression (mean fluorescence intensity) of C3 and SERPINA3 under different culture conditions is represented in respective charts. Expression across treatment groups (n = 3) were compared using ANOVA (Tukey’s multiple comparisons test); *p < 0.05, ***p < 0.0005 and ****p < 0.0001. (B) Representative flow cytometry images of neuroblastoma cell line (SK-N-SH) stained with Annexin V after treatment with unstimulated- or stimulated-astrocyte conditioned media (astrocyte supernatant) for 24 hours. Normalized % of dead (Annexin V+) neurons, with respect to unstimulated-astrocyte conditioned media treatment, compared (n = 4) using Welch’s t test; *p < 0.05.
Finally, we also performed functional assay, where we observed that toxic-astrocyte-conditioned medium (50% v/v) induced neuronal apoptosis (Figure 1B). Based on these data, we will refer to these astrocytes from now on as “neurotoxic”.
3.2). Drug Library Screening
Now that we confirmed that our in vitro model transforms human astrocytes into neurotoxic phenotype, we searched for the druggable targets that might suppress this unwanted transformation.
We applied a commercially available library of 1430 small molecule chemical compounds that represent either FDA-approved drugs or drugs tested in early human clinical trials to inflammation-induced astrocytes. We aimed to identify drugs that inhibit astrocyte-secretion of C3, which represented at that time the single best-validated biomarker of mouse and human neurotoxic astrocytes (Liddelow et al., 2017; Zamanian et al., 2012). To differentiate suppression of astrocytic neurotoxic transformation from drug toxicity, we measured viability of the astrocytes after collecting supernatants.
The entire drug library screen was performed two times: first we tested 10 μM concentration of drugs, but at this concentration, many drugs induced cytotoxic effects on astrocytes (i.e., MTT < 75% of control treatment). Thus, the entire screen was repeated with 100-fold lower drug concentrations (i.e., 100 nM; Figure 2), which better reflects in vivo achievable concentrations of tested drugs in humans. As expected, all inhibitory effects observed at 100 nM were also observed at higher drug concentration (see Supporting Data File 4 for raw data from both library screens).
Figure 2:

Toxicity (MTT) and efficacy of each drug (at 100 nM) in blocking secretion of C3 was analyzed. Effect of each drug was normalized with respect to control (DMSO) treatment: ([C3 secretion by stimulated astrocytes with a drug treatment – C3 secretion by unstimulated astrocytes] / [C3 secretion by stimulated astrocytes with DMSO treatment – C3 secretion by unstimulated astrocytes]) * 100. 1431 drugs (n = 1) are represented here. Drugs were grouped based on their known targets (153 groups, Supplementary Table 1). Mean C3 secretion (% control) of drugs that did not induce substantial toxicity (i.e., MTT > 75%), were calculated and compared with C3 levels of control (Stimulated astrocytes with DMSO treatment, i.e., 100%) using ANOVA. P-values were adjusted for multiple comparisons using Benjamini and Hochberg False Discovery Rate. Significantly efficacious drugs at group level (mean C3 < 75% of control and adjusted p-value < 0.05) are represented with respective colors.
3.3). Identification of Signaling Pathways Important in Inflammation-Induced Transformation of Astrocytes Towards a Toxic Phenotype
To identify therapeutic targets more robustly, we leveraged the fact that library included multiple drugs with identical therapeutic target (Supplementary Table 1 and Supporting Data File 4). For example, all included proteasome inhibitors inhibit proteasome; all mTOR inhibitors inhibit mTOR, all glucocorticoids bind to and signal via glucocorticoid receptor etc. If we tested only one of these drugs, let’s say only rapamycin, we would not know if rapamycin inhibited C3 secretion from toxic astrocytes via inhibition of mTOR or by some other, off-target effect. By testing the appropriate null hypothesis, e.g., “mTOR inhibitors do not affect secretion of C3 by toxic astrocytes” and observing adjusted p-value p = 0.008 (Figure 2) allowed us to conclude that inhibiting mTOR pathway leads to statistically significant inhibition of C3 secretion by toxic astrocytes. This group analysis is therefore more robust than testing single drug multiple times.
Using this strategy, we identified seven druggable targets that, collectively suppressed C3 secretion by at least 25% with adjusted p-value < 0.05: 1) proteasome, 2) heat shock protein 90 (HSP90), 3) p38 mitogen-activated protein kinase (p38 MAPK), 4) phosphoinositide 3-kinases (PI3K), 5) mammalian target of rapamycin (mTOR), 6) Akt, and 7) sphingosine 1-phosphate (S1P) receptor. (Figure 2 and Supplementary Table 1). Inhibitors of c-kit and poly ADP ribose polymerase (PARP) also achieved statistical significance (FDR-adjusted p <0.05), although their inhibitory effect did not reach 75%.
Surprisingly, most glucocorticoids increased secretion of C3 (174.44 % of control) from inflammation-induced astrocytes. Although other drug groups also stimulated C3 secretion from toxic astrocytes with formal statistical significance, the group effects were lower than 125%. Drugs that did not pertain to any specific category and thus were grouped as “others” also achieved a minimal stimulatory effect that reached formal statistical significance (Figure 2 and Supplementary Table 1).
We realized that drug targets that inhibit C3 secretion are related. They interact together and participate in the endoplasmic reticulum (ER) stress response also called unfolder protein response (UPR). ER stress was likely induced in astrocytes by pro-inflammatory stimuli (Figure 3). Supporting this observation, dantrolene, an anti-spasticity drug that inhibits calcium release from the ER of CNS cells via inhibiting ryanodine receptor (RyR), also reliably inhibited secretion of C3 with high potency in the drug library screen (77.7 % inhibition).
Figure 3:

The summary of signaling pathways found inhibitory in our screen and their physiological relationships. Our results suggest that NFκB-p65 mediated transcription of proinflammatory mediators plays a central role in induction of toxic astrogliosis. Abnormally high protein secretion during inflammatory stress may overwhelm the protein folding capacity of the ER, causing accumulation of unfolded proteins, leading to disturbed Ca2+-homeostasis and proteotoxic stress. Sustained ER stress further exacerbates the toxic astrocyte-mediated proinflammatory response and under severe stress, it may lead to cell death. Drugs which can alleviate NFκB-mediated proinflammatory responses and relieve ER stress may be effective in blocking astrocyte-mediated toxicity during MS progression. Green color and ‘+’ sign indicate positive regulation. Red color and ‘stop’ sign indicate negative regulation.
Thus, we conclude that drug library screen demonstrated that neurotoxic transformation of astrocytes driven by inflammatory stimuli is linked to multiple druggable signaling pathways related to ER stress. The summary of signaling pathways found inhibitory in our screen and their physiological relationship is depicted in Figure 3.
3.4). Independent validation of inhibitory effects of selected drugs in concentration response curves
To validate inhibitory effect of the representative drugs from the most effective target categories and other drugs of potential interest, we performed more granular dose-titration experiments using 0, 10, 100, and 1,000 nM concentrations. 50% inhibitory concentrations (IC50) were calculated from these curves (Figure 4).
Figure 4:

Concentration-response curves for selected drugs. Efficacy of blocking C3 secretion by proteasome-, HSP90-, and mTOR-inhibitors, and dantrolene were tested at 0, 10, 100, and 1000 nM concentrations (n = 3). Mean ± standard deviations are represented here. The dotted line indicates a 50% reduction in C3 secretion, compared to control, and IC50 for each drug are depicted on respective graphs. For better representation, y-axis limits are selected to be from 0 to 100%, but some datapoints and error bars may be out of axis limits. With limited data points (only 4 concentrations) software was able to find a best-fit line but was unable to calculate a complete confidence interval. Thus, LogIC50 or IC50 values extrapolated from these best-fit lines should be interpreted with caution.
We validated inhibitory effects of all drugs tested in these titration experiments. All tested proteasome inhibitors (Delanzomib, Ixazomib, Carfilzomib and Marizomib) blocked C3 secretion from inflammation-induced astrocytes at low concentrations (IC50 < 25 nM). Out of three tested HSP90 inhibitors, Ganetespib had the highest potency (IC50 = 29.75 nM), while the other two drugs, Tanespimycin and Onalespib, had an IC50 193.8 and 120.9 nM, respectively. Within tested mTOR-inhibitors, Rapamycin had lowest IC50 (159.7 nM), and Everolimus and Tacrolimus had IC50 918.6 and 2888 nM respectively. Based on tested concentrations, IC50 for Temsirolimus cannot be determined. Dantrolene, an RyR-antagonist, had projected IC50 226.5 nM.
3.5). Pretreatment of astrocytes with selected drugs inhibits their transformation into neurotoxic astrocytes
In the previous experiments we identified categories of drugs that reproducibly inhibit C3 secretion from inflammation-stimulated astrocytes. Because C3 may be only a marker of neurotoxicity but not the main effector mechanism, we tested the direct neurotoxic potential of inflammation-stimulated astrocytes pre-treated with selected drugs for 24h (at 100 nM concentrations) or appropriate DMSO control (Figure 5).
Figure 5:

(A) Absolute (24h – 0h) secretion of C3 by astrocytes under different culture conditions were analyzed using ELISA. The effect of each tested drug (100 nM) was normalized with respect to control (DMSO) treatment: ([absolute C3 secretion by inflammation-induced astrocytes with a drug treatment – absolute C3 secretion by unstimulated astrocytes with DMSO treatment] / [absolute C3 secretion by inflammation-induced astrocytes with DMSO treatment – absolute C3 secretion by unstimulated astrocytes with DMSO treatment]) * 100. (B) Unstimulated or stimulated astrocytes conditioned media-mediated neuronal death was analyzed using Annexin V immunostaining and flow cytometry; Normalized % of dead (Annexin V+) neurons, with respect to unstimulated-astrocyte conditioned media + DMSO treatment. C3 secretion and neuronal death across different culture conditions were compared using ANOVA (Tukey’s multiple comparisons test). N = 3; *p < 0.05 vs unstimulated + DMSO and #p < 0.05 vs. inflammation-induced + DMSO.
From 4 proteasome inhibitors tested, calfirzomib and marizomib inhibited neuronal apoptosis, Ixazombib had no effect while delanzomib enhanced neuronal apoptosis. Similarly, from three HSP inhibitors, tamespimycin inhibited apoptosis, onalespib had marginal inhibitory effect while ganetespib increased neuronal apoptosis. Dantrolene and all four tested mTOR inhibitors inhibited neuronal apoptosis.
3.6). Identification of Inflammation-Induced, Astrocyte-Secreted Biomarkers
The drug library screen identified several FDA-approved drugs that reliably suppressed secretion of C3 from neurotoxic astrocytes and our preliminary neuronal co-culture data suggested that some of these drugs may inhibit neurotoxicity of inflammatory-stimulated astrocytes. To facilitate translation of these findings to human proof-of-principle clinical trial(s), we sought to define biomarker of neurotoxic astrocytes that may be used in early phases of clinical testing as surrogate marker.
Thus far we examined overlap between neurotoxic astrocytes defined in mouse models and human neurotoxic astrocytes generated in our in vitro system. Because human neurotoxic astrocytes might have additional, non-overlapping features with mouse counterparts, we compared secretome of astrocytes cultured with supernatant from resting PBMC with those cultured with stimulated PBMC supernatants (Supplementary Table 2 and Supporting Data File 5) using multiple proteomic assay SOMAscan. We arbitrarily defined measured proteins as inflammation-induced, astrocyte-secreted if their fold change was higher than 5. 18 proteins fulfilled these criteria: X-C motif chemokine ligand (CXCL-6, 9, 10 and 11), matrix metalloproteinases (MMP-3, 10, 12 and 13), C-C motif chemokine ligand (CCL-7, 8 and 20), SERPINA3, C-X3-C motif chemokine ligand 1 (CX3CL1), TNFα induced protein 6 (TNFAIP6), C3, complement factors (CFB and CFH) and interleukin 1 receptor like 1 (IL1RL1).
To serve as biomarker of human neurotoxic astrocytes in living human subjects, these biomarkers must be measurable in human CSF and cannot be produced by CNS or immune cells other than astrocytes.
To analyze which of these biomarkers are astrocyte-specific, we searched publicly available databases of cell-specific expression profiles and proteomic data. We observed that 17/18 inflammation-induced, astrocyte-secreted biomarkers were also expressed or released, at comparable or higher levels, by cells of the CNS or immune system other than astrocytes (Supplementary Figure 4). This lack of cell-specificity makes these 17 biomarkers unsuitable as in vivo marker of neurotoxic astrocytes in neuro-inflammatory conditions such as MS. Only SERPINA3 was astrocyte-specific in all cell-specific database searches.
3.7). CSF SERPINA3 levels are significantly increased in both RR-MS and P-MS patients compared to HD
Next, we asked whether these inflammation-induced, astrocyte-secreted biomarkers are present in human CSF and whether they are increased in MS patients compared to healthy donors (HD).
We measured the identified 18 biomarkers in the CSF samples derived from 18 HD and 151 untreated MS patients (58 RR-MS, 93 progressive MS [P-MS; comprised of both PP-MS and SP-MS]; training cohort). Statistically significant results were confirmed in the independent validation cohort of 21 HD and 143 untreated MS patients (54 RR-MS, 89 P-MS).
CXCL10 and C3 were significantly elevated only in RR-MS patients compared to HD, and MMP13 was elevated only in P-MS patients. SERPINA3 was significantly elevated in both MS subgroups (Figure 6A and Supplementary Table 3).
Figure 6:

(A) Age- and gender-adjusted SOMAscan values (relative fluorescence unit, RFU) of inflammation-induced, astrocyte-secreted biomarkers were compared across disease diagnostic subgroups using Kruskal-Wallis ANOVA (Dunn’s multiple comparisons test); *p < 0.05 and **p < 0.005. The ‘+’ sign represents mean of respective subgroup and dotted line indicates the median of the HD subgroup. Only statistically significant and reproducible results from validation cohort are presented (n: HD = 21, RR-MS = 54 and P-MS = 89). (B) Correlations between SOMAscan values and clinical outcome measures were analyzed using Spearman analyses. The solid line indicates the best-fit line for linear regression between respective variables and the dotted line represents the 95% confidence interval. Spearman’s rank correlation coefficient (ρ) and adjusted P values are represented on respective correlation plots. Only statistically significant and reproducible results from the validation cohort are presented (n = 143).
3.8). CSF SERPINA3 levels correlate with MS Severity Outcomes
Clinically relevant biomarkers may either correlate with clinical progression or MS severity. Biomarkers that positively correlate with clinical or imaging progression/disability outcomes are less valuable because they may be induced by the disease process, rather than pathogenically driving it. On the other hand, biomarkers that positively correlate with MS severity outcomes, which measure the speed of accumulation of disability or CNS tissue damage, more likely reflect causal process, especially if they do not correlate with markers of MS progression/disability. In other words, these biomarkers are unlikely to be a consequence of MS (because if they were, they would correlate with disability scales and MRI outcomes of CNS tissue destruction), so their positive correlation with MS severity means they likely measure causal process, such as neurotoxic astrogliosis (please note that the correlation does not necessarily implies that the biomarker itself is causal).
To determine if CSF SERPINA3 has clinical value as in vivo biomarker of neurotoxic astrocytes, we assessed it correlation with disability scales EDSS (Kurtzke, 1983) and CombiWISE (Kosa et al., 2016), and with the Combinatorial MRI scale of CNS tissue destruction (COMRIS-CTD; (Kosa et al., 2015)). CSF SERPINA3 levels did not correlate with any of these scales (Supplementary Table 4).
On the other hand, as depicted in Figure 6B, CSF SERPINA3 levels positively correlated with two out of three MS severity scales: the ARMSS (Manouchehrinia et al., 2017) (ρ = 0.19 and p = 0.0229), and MSDSS (Weideman et al., 2017) (ρ = 0.21 and p = 0.0147). , but not with MSSS (Roxburgh et al., 2005). MSSS assesses speed of accumulation of clinical disability measured by EDSS using disease duration, whereas both ARMSS and MS-DSS measure speed of accumulation of clinical disability using patients’ age. As subclinical stage of MS prevents from ascertaining the disease duration accurately, age-based MS severity outcomes might be more accurate.
We conclude that positive correlation of CSF SERPINA3 levels with age-based MS severity outcomes suggest that process of inflammation-induced transformation of astrocytes to neurotoxic phenotype may play a pathogenic role in CNS tissue destruction and accumulation of clinical disability in MS.
3.9). MS Patients Have Intrathecal Production of SERPINA3
Although SERPINA3 is produced intrathecally only by astrocytes, systemically, large quantities of SERPINA3 are also produced by liver, pancreas, stomach, and other peripheral tissues. Consequently, serum SERPINA3 levels greatly exceed CSF concentration. This posed a possibility that increased levels of SERPINA3 in MS CSF might be due to blood brain barrier (BBB) opening, which is common especially in untreated RR-MS patients. If intrathecal SERPINA3 levels originated from serum, CSF SERPINA3 might not be reliable marker of neurotoxic astrogliosis.
To examine this hypothesis, we measured absolute SERPINA3 levels in the matching CSF and serum samples from78 subjects (20 HD and 28 RR-MS and 30 P-MS; Figure 7, Supplementary Table 5 and Supporting Data File 6) by ELISA.
Figure 7:

(A) In a pilot cohort matching CSF and serum samples were analyzed for SERPINA3 levels using ELISA. CSF- and serum-SERPINA3 concentrations (Log[ng/ml]) and SERPINA3 Index were compared across disease diagnostic subgroups (n: HD = 20, RR-MS = 28 and P-MS = 30); *p < 0.05 and ****p < 0.0001. (B) Correlations between CSF-SERPINA3 and SERPINA3 Index with MS severity outcome measures were analyzed using Spearman analyses. The solid line indicates the best-fit line for linear regression between respective variables and the dotted line represents the 95% confidence interval. Spearman’s rank correlation coefficient (ρ) and adjusted P values are represented on respective correlation plots (n = 58). (C) MS severity outcomes were compared across MS patients those who were having physiologically normal-versus high-SERPINA3 Index, with respect to (wrt) HD cohort: Normal < (HD-median + 3*SD) and High > (HD-median + 3*SD). N: HD = 20, RR-MS = 28 and P-MS = 30; *p < 0.05 and **p < 0.005.
The ELISA confirmed SOMAscan results that CSF-SERPINA3 was significantly elevated in both MS subgroups (RR-MS and P-MS) compared to HD (Figure 7A); while the serum-SERPINA3 levels were equivalent between HD and MS.
Next, We calculated SERPINA3 index ([CSF SERPINA3/serum SERPINA3] X [serum albumin/CSF albumin]) analogously to IgG index (Steinberg et al., 2008) to measure the intrathecal production of SERPINA3. SERPINA3 index was elevated in both MS subgroups compared to HD, but only P-MS difference reached formal statistical significance (Figure 7A), while RR-MS comparison showed trend (p = 0.0633).
ELISA results also validated our observations from the SOMAscan data, that CSF SERPINA3 levels correlate with MS severity outcomes (Figure 7B). This time, we observed stronger correlations and achieved statistical significance with all 3 MS severity outcomes. Also, we tested correlations between SERPINA3 Index and MS severity outcomes and observed that SERPINA3 Index also correlates with all 3 severity outcomes in this cohort (Figure 7B).
Finally, we compared MS severity outcomes within the MS patients those who have physiologically normal versus high SERPINA3 index (Figure 7C). All 3 MS severity outcomes were significantly elevated in MS patients with high SERPINA3 index; median fold-elevation: MSSS = 1.6, ARMSS = 1.6, and MSDSS = 1.3.
Thus, we conclude that compared to HD, MS patients have higher intrathecal production of SERPINA3, likely secreted by neurotoxic astrocytes, and that patients with high intrathecal SERPINA3 accumulate MS disability significantly faster than patients with physiological CSF SERPINA3 levels.
3.10). Proteomic Analyses of Supernatants from Inflammation-Induced Astrocytes in The Presence of Selected Drugs
Although we showed that selected FDA-approved drugs that are candidates for proof-of-principle clinical trial to limit astrocyte neurotoxicity reliably inhibit C3 secretion, from all biomarkers secreted by neurotoxic astrocytes, only SERPINA3 is astrocyte-specific (Supplementary Figure 4) and correlates with MS severity outcomes (Figures 6 and 7).
To gain comprehensive understanding of the effect of these drugs on resting and inflammation-induced astrocytes, we selected three representative drugs (Ganetespib [HSP90-inhibitor], Dantrolene [RyR-antagonist], and Rapamycin [mTOR-inhibitor]) and studied their influence on the secretome of inflammation-induced astrocytes using SOMAscan.
Ganetespib strongly reduced secretion of all biomarkers previously identified as part of a “toxic astrocyte signature” (Figure 8 Supporting Data File 7). However, Ganetespib also inhibited secretion of proteins from astrocytes that were not activated by inflammatory stimuli. This suggests inhibition of physiological functions of astrocytes, which may have detrimental effects on neurons in vivo. Dantrolene reduced secretion of most of the “toxic astrocyte” biomarkers, including SERPINA3. However, it elevated secretion of MMP-10 and −12. In contrast, Rapamycin did not have potent effect on secretion of most of the “toxic astrocyte” biomarkers, except CX3CL1, C3, MMP13 and IL1RL1. Rapamycin elevated secretion of CCL20, TNFAIP6 and CFB.
Figure 8:

Normalized ‘toxic vs resting astrocytes index’ for toxic astrocyte-specific biomarkers after treatment with Ganetespib, Dantrolene and Rapamycin (n = 1). Toxic vs resting astrocytes index (stimulated [RFU@24h / RFU@0h] / unstimulated [RFU@24h /RFU@0h]) for each biomarker, under DMSO or respective drug treatment was calculated, then index for each drug was normalized with respect to DMSO treatment (% DMSO).
We conclude that from these three drugs tested, dantrolene may have most selective inhibitory effect on neurotoxic astrocytes.
4). DISCUSSION
There are two approaches to drug library screening: in vitro assays and in vivo experiments in short-lived animal species, such as fruit-flies or zebrafish (MacRae and Peterson, 2015; Pandey and Nichols, 2011). Both have limitations: the non-physiological approach of in vitro assays risks the possibility that obtained results do not reproduce the in vivo situation, while animal models suffer from differences in physiological and pathogenic mechanisms between lower species and humans. Nevertheless, drugs identified through in vitro drug screens validated therapeutic efficacy in humans (Mei et al., 2014).
We acknowledge following drawbacks of our study: 1) In vitro monoculture might have influenced the astrocyte phenotype, as was previously observed on transcriptome level (Wilhelm et al., 2004); 2) The short-term induction of toxic astrocytes by inflammatory stimuli may not capture spectrum of toxic astrocytes in vivo, where long-term exposure to an inflammatory environment may cause epigenetic changes not reversible by pharmacological manipulations; 3) While we selected inhibition of C3 for drug library screen as C3 is broadly used to identify toxic astrocytes in human brain, including MS lesions (Liddelow et al., 2017), the mechanism(s) of neurotoxicity by toxic astrocytes have not been elucidated and are unlikely caused by C3 alone. For relevant drugs we also showed inhibitory effect on SERPINA3, which came out of this work as the single best intrathecal biomarker of toxic astrogliosis. Finally, we showed that if present during the process of inflammation-driven transformation of astrocytes to neurotoxic phenotype, dantrolene and mTOR inhibitors inhibit astrocyte-induced neuronal apoptosis in vitro. However, we can’t exclude that remaining drug concentrations in the astrocyte supernatants did not exert direct neuroprotective effect, which might be plausible especially for mTOR inhibitors. One can argue that for the eventual efficacy in patients it is irrelevant whether the drug exert their neuroprotective effect directly or indirectly by inhibiting transformation of astrocytes to neurotoxic phenotype during CNS inflammatory process, or both. Nevertheless, as none of the data from this, or previously published studies assure that inhibition of C3 or SERPINA3 secretion will inhibit astrocyte-induced neurotoxicity, only interventional clinical trial(s) can prove or disprove that the targeted mechanism was truly pathogenic.
Being mindful of the limitations, we employed strategies to maximize the clinical relevance of drug library screen: we analyzed overlap between the toxic astrocyte-secreted proteome in our in vitro model and previously published studies and found overlap for CXCLs (Zamanian et al., 2012), SERPINA3 (Liddelow et al., 2017; Padmanabhan et al., 2006; Zamanian et al., 2012), C3 (Liddelow et al., 2017), CFB (Liddelow et al., 2017) and MMPs (Hara et al., 2017). This suggests that our assay captures most of the in vivo phenotypical change of ‘toxic astrogliosis’.
C3 has been widely used as a marker of the toxic astrocytes (Hyvärinen et al., 2019; Liddelow et al., 2017; Xu et al., 2018) and Liddelow et al found C3 protein mainly expressed in astrocytes (Liddelow et al., 2017). However, during neuroinflammation, CSF C3 concentrations cannot be attributed solely to astrocytes because C3 mRNA is mainly expressed in microglia and other cells of myeloid lineage. This is aligned with our observation that CSF C3 is significantly elevated only in RR-MS, but not P-MS patients. This suggests that during the formation of MS lesions, most C3 either originates from serum and reaches CSF via BBB opening or is secreted by cells of the myeloid lineage recruited to acute MS lesions (Frischer et al., 2009; Kirk et al., 2003). Thus, CSF C3 cannot be a reliable biomarker of toxic astrogliosis in vivo.
From all inflammation-induced astrocyte-secreted proteins, only SERPINA3 CSF levels are astrocyte-specific. Furthermore, serum SERPINA3 levels have minimal contribution to CSF SERPINA3 levels in MS patients. Consequently, SERPINA3 index (analogous to IgG index) validated strong intrathecal production of SERPINA3 in MS subjects and faster accumulation of disability in subjects with nonphysiologically high SERPINA3 index.
The relevance of the CSF SERPINA3 as a biomarker of toxic astrocytes is supported by animal studies. Genomic analysis of astrocytes from pro-inflammatory stimuli-treated mice has shown robust increase in SERPINA3 (Zamanian et al., 2012). SERPINA3 also induced toxic effects on cortical murine neuron cultures (Padmanabhan et al., 2006), suggesting its direct pathogenic role. The pathogenic role of SERPINA3 in neurodegeneration is supported by our observations that adjusting for serum contributions to CSF SERPINA3 levels (i.e., SERPINA3 index) slightly decreases correlations with MS severity outcomes. If SERPINA3 was simply a biomarker of toxic astrocytes which killed neurons using SERPINA3-independent mechanism(s), then adjusting for serum contributions would increase accuracy of adjusted levels to quantify toxic astrocytes. On the other hand, if SERPINA3 is directly linked to neurotoxicity, then it is irrelevant whether high intrathecal SERPINA3 levels come from blood or NS tissue – in this scenario we expect that adjusting for serum contributions to CSF SERPINA3 levels will decrease correlations with MS outcomes, which is what we observed.
Nevertheless, although our study identified CSF SERPINA3 as single most accurate pharmacodynamic biomarker for therapeutic intervention targeting toxic astrogliosis, only clinical trial can assess its surrogate value.
We identified small molecules among FDA-approved MS drugs with inhibitory effect on toxic astrocytes. One study reported that in vitro pre-treatment of astrocytes with dimethyl fumarate (DMF; 25 μM) reduced secretion of proinflammatory cytokines and oxidative stress following stimulation with IL1β (Galloway et al., 2017). We too observed that DMF inhibited C3 secretion by astrocytes at a non-physiologically high (10 μM) concentration but not at 100 nM. A 25 μM dose is almost 1000-fold higher than the peak measured concentration of DMF in human blood (Linker and Haghikia, 2016) and the concentrations in the CNS are likely even lower. This highlights the essential limitation of testing inhibitory effects with non-physiological drug concentrations. In contrast, we based our conclusions on 100 nM drug concentration screen and validated the most promising drugs in dose titration experiments down to 10 nM.
In contrast to DMF, our drug library screen identified S1P receptor modulators as inhibiting C3 secretion from toxic astrocytes. Indeed, immunostaining of postmortem MS brains showed elevated expression of S1P receptors on astrocytes in MS lesions (Van Doorn et al., 2010), suggesting a role of S1P receptors in the induction of toxic astrogliosis. Additionally, pretreatment of human induced pluripotent stem cells (iPSCs)-differentiated astrocytes with fingolimod or siponimod reduced secretion of proinflammatory cytokines in the presence of inflammatory stimuli via blocking activation and nuclear translocation of the NFκB-p65 (Colombo et al., 2020). Our results expand on these data and suggest that S1P receptor modulators may also partially block the process of toxic astrogliosis in vivo. We plan to test this hypothesis in future studies evaluating the effect of S1P receptor modulators on CSF SERPINA3 levels.
While glucocorticoids, effective inhibitors of neuro-inflammation (Giatti et al., 2012; Rhen and Cidlowski, 2005), reproducibly elevated secretion of C3 from inflammation-induced astrocytes in vitro, there is currently no experimental evidence that increased secretion of C3 captures the complete neurotoxic phenotype of astrocytes. Thus, it will be important to analyze CSF SERPINA3 levels in patients treated with steroids in future studies.
Next, we’ll provide integrative analysis of signaling pathways that library screen identified as contributing to formation of toxic astrocytes (please refer to Figure 3). Among these, HSP and proteasome inhibitors were the most potent. In response to inflammation, astrocytes initiate protein biosynthesis to amplify the inflammatory response. Most of these proteins are secreted, requiring posttranslational modifications and proper folding in the ER before entering the Golgi apparatus. High protein secretion may overwhelm protein folding capacity, resulting in accumulation of unfolded proteins leading to ER stress. This triggers UPR response aimed to restore homeostasis, consisting of the following actions: 1) refolding of misfolded proteins, 2) degradation of irreparably damaged proteins via the ubiquitin proteasome system (UPS) and lysosome/autophagy-mediated pathways, and 3) downregulation of new protein biosynthesis (Bozaykut et al., 2014; Schröder and Kaufman, 2005). The UPR is initially protective, but under sustained stress, it induces further inflammation and eventually triggers apoptosis (Hotamisligil, 2010).
By inhibiting protein folding and degradation of misfolded proteins, HSP and proteasome inhibitors exacerbate ER stress and stall protein synthesis. Indeed, Ganetespib, an HSP-inhibitor, reduced secretion of all astrocyte-secreted proteins, both physiological and inflammation-induced. Clearly, such a strategy is not sustainable long-term, as it will cease essential astrocyte-mediated functions that may not be consistent with the survival. Even in oncology, these drugs can be administered only short-term. Thus, we excluded these drugs/pathways from consideration for treatment of neurodegenerative diseases.
Another class of drugs identified through our drug library screening are PI3K/Akt/mTOR-inhibitors. These pathways positively regulate the proinflammatory response via activation and nuclear translocation of NFκB-p65 (Bové et al., 2011; Gao et al., 2015). Particularly mTOR signaling plays a vital role in astrocytic proliferation and production of proinflammatory mediators during stress (Li et al., 2015). mTOR has a bidirectional crosstalk with ER stress: 1) mTOR signaling works upstream and exacerbates ER stress by upregulating protein biosynthesis and downregulating clearance of damaged proteins through the lysosome/autophagy-mediated pathways, and 2) mTOR signaling also works downstream of ER stress, where sustained ER stress activates mTOR signaling, leading to inflammation and cell death (Appenzeller-Herzog and Hall, 2012; Bové et al., 2011; Kato et al., 2012). Though our results showed that PI3K/Akt/mTOR-inhibitors inhibit secretion of C3 from inflammation-induced astrocytes, Rapamycin failed to inhibit secretion of SERPINA3, and increased secretion of CCL20 and CCL8. This is an intriguing observation as it suggests that different pathways mediate secretion of C3 versus other markers of toxic astrocytes, like SERPINA3. Because the reviewed literature, supported by observed correlation of CSF SERPINA3 with MS severity assigns a stronger role to SERPINA3 than C3 as the marker of pathogenic astrocytes, PI3K/Akt/mTOR inhibitors may not inhibit the most relevant neurotoxic functions.
Dantrolene, an RyR-antagonist, significantly and reproducibly reduced secretion of C3, but also SERPINA3, CCL20, CCL8 from inflammation-induced astrocytes. Under normal conditions, the ER has at least a three-fold higher Ca2+ concentration than that of the cytosol, which is crucial for normal protein folding. Early ER stress dysregulates RyR functioning (Yamamoto et al., 2019), causing Ca2+ leak from the ER, which further disturbs protein folding. During sustained ER stress, dysregulated RyR-mediated Ca2+ leak from the ER positively regulates UPR-mediated inflammation and cell death (Wang et al., 2017; Yamamoto et al., 2019), suggesting that dantrolene should alleviate ER stress.
This would mean that drugs with opposing mechanisms on ER stress (i.e., HSP/proteasome inhibitor exacerbating and dantrolene alleviating ER stress) are both efficacious in suppressing generation of toxic astrocytes. How can we resolve this discrepancy? One possibility is that the neurotoxic astrocytes are not induced directly by inflammatory stimuli, which signal via PI3K/Akt/mTOR and p38MAPK. Instead, the result of this pro-inflammatory signaling is robust protein synthesis and ER stress. Perhaps it is the failing ER stress phase of the astrocytic response to inflammation that generates their true neurotoxicity. The HSP/proteasome inhibition tips the astrocyte one way (shutting off protein synthesis completely and eventually causing cell death), while dantrolene blocks the pathogenic transformation of astrocytes by blocking Ca2+ release from the failing ER to cytosol and/or to mitochondria. Clearly, this hypothesis will need to be tested in future studies. Nevertheless, since dantrolene is FDA-approved for treatment of spasticity and has been applied in this indication to MS patients long-term, it is an immediately available candidate for testing in proof-of-principle clinical trials its efficacy on toxic astrocytes. Its major drawback is serious hepatotoxicity with doses over 400 mg/day (Utili et al., 1977), but we showed that desired pharmacodynamic effect in CNS should be achieved using safe dose of 200mg/day, which is the dose being tested in the ongoing platform TRAP-MS clinical trial (clinicaltrial.gov identifier NCT03109288).
In conclusion, we elucidated signaling pathways associated with transformation of astrocytes to a toxic phenotype and identified dantrolene as immediately available drug for clinical testing. The first step in proving its efficacy should be demonstrating its ability to inhibit CSF SERPINA3 levels, which correlate with MS severity.
Supplementary Material
HIGHLIGHTS.
CSF SERPINA3 is a reliable pharmacodynamic marker of toxic astrogliosis in multiple sclerosis.
Inhibitors of pathways related to the ER stress (proteasome, HSP90 and mTOR) attenuated inflammation-induced conversion of astrocytes to a toxic phenotype.
In vitro drug library screening provided mechanistic insight into the generation of toxic astrocytes and identified potential candidates for immediate proof-of-principle clinical trials.
5). ACKNOWLEDGEMENTS
The study was supported by the intramural research program of the National Institute of Allergy and Infectious Diseases (NIAID) of the National Institutes of Health (NIH).
We thank Elena Romm for processing of CSF samples. We thank Dr. Alison Wichman and research nurses Mary Sandford and Tiffany Hauser for expert patient care and patient care coordinator Michelle Woodland for patient scheduling. Finally, we thank all the patients, their caregivers, and healthy volunteers, without whom this work could not be possible.
ABBREVIATIONS
- MS
multiple sclerosis
- CNS
central nervous system
- RRMS
relapsing-remitting MS
- PMS
progressive MS
- CSF
cerebrospinal fluid
- FDA
Food and Drug Administration
- PBMCs
peripheral blood mononuclear cells
- PBS
phosphate-buffered saline
- LPS
lipopolysaccharide
- TNFα
tumor necrosis factor α
- IL1α
interleukin 1 α
- C3
complement component 3
- SERPINA3
serine protease inhibitor family A member 3
- EDSS
Expanded Disability Status Scale
- CombiWISE
Combinatorial Weight-Adjusted Disability Scale
- MRI
magnetic resonance imaging
- COMRIS-CTD
Composite MRI scale of CNS tissue destruction
- MSSS
Multiple Sclerosis Severity Score
- ARMSS
Age Related Multiple Sclerosis Severity
- MSDSS
Multiple Sclerosis Disease Severity Scale
- SP-MS
secondary progressive MS
- PP-MS
primary progressive MS
- HD
healthy donors
- SOMAscan
Slow Off-rate Modified Aptamers scan
- DMSO
dimethyl sulfoxide
- MTT
3-(4,5-dimethylthiazol-2-yl)-2,5-diphenyltetrazolium bromide
- ANOVA
Analysis of Variance
- FDR
False Discovery Rate
- CXCL
C-X-C motif chemokine ligand
- MMP
matrix metalloproteinases
- CCL
C-C motif chemokine ligand
- CX3CL1
C-X3-C motif chemokine ligand 1
- TNFAIP6
TNFα induced protein 6
- CF
complement factors
- IL1RL1
interleukin 1 receptor like 1
- ER
endoplasmic reticulum
- UPR
unfolder protein response
- HSP90
heat shock protein 90
- p38 MAPK
p38 mitogen-activated protein kinase
- PI3K
phosphoinositide 3-kinases
- mTOR
mammalian target of rapamycin
- S1P
sphingosine 1-phosphate
- RyR
ryanodine receptor
- PARP
poly ADP ribose polymerase
- CYPs
cytochrome P450s
- COX
cyclooxygenase
- LTR
leukotriene receptor
- IC50
50% inhibitory concentrations
- BBB
blood-brain barrier
- GSK-3β
glycogen synthase kinase-3β
- TMT
trimethyltin chloride
- DMF
dimethyl fumarate
- iPSCs
induced pluripotent stem cell
- UPS
ubiquitin proteasome system
Footnotes
Credit author statement
Ruturaj Masvekar: Conceptualization, Methodology, Data Analysis and Writing – Original draft preparation.
Peter Kosa: Data Analysis and Manuscript Review
Christopher Barbour: Data Analysis and Manuscript Review
Joshua L Milstein: Methodology and Manuscript Review
Bibiana Bielekova: Conceptualization, Data Analysis and Writing – Original draft preparation.
CONFLICTS of INTEREST
The authors declare no conflicts of interest.
We wish to confirm that there are no known conflicts of interest associated with this publication and there has been no significant financial support for this work that could have influenced its outcome.
AUTHORS’ DECLARATION
We the all named authors declare that this manuscript is original, has not been published before and is not currently being considered for publication elsewhere.
We confirm that the manuscript has been read and approved by all named authors and that there are no other persons who satisfied the criteria for authorship but are not listed. We further confirm that the order of authors listed in the manuscript has been approved by all of us.
We confirm that we have given due consideration to the protection of intellectual property associated with this work and that there are no impediments to publication, including the timing of publication, with respect to intellectual property. In so doing we confirm that we have followed the regulations of our institutions concerning intellectual property.
We further confirm that any aspect of the work covered in this manuscript that has involved human patients has been conducted with the ethical approval of all relevant bodies and that such approvals are acknowledged within the manuscript.
We understand that the Corresponding Author is the sole contact for the Editorial process (including Editorial Manager and direct communications with the office). He/she is responsible for communicating with the other authors about progress, submissions of revisions and final approval of proofs. We confirm that we have provided a current, correct email address.
Publisher's Disclaimer: This is a PDF file of an unedited manuscript that has been accepted for publication. As a service to our customers we are providing this early version of the manuscript. The manuscript will undergo copyediting, typesetting, and review of the resulting proof before it is published in its final form. Please note that during the production process errors may be discovered which could affect the content, and all legal disclaimers that apply to the journal pertain.
8) REFERENCES
- Appenzeller-Herzog C, Hall MN, 2012. Bidirectional crosstalk between endoplasmic reticulum stress and mTOR signaling. Trends Cell Biol. 10.1016/j.tcb.2012.02.006 [DOI] [PubMed] [Google Scholar]
- Barbour C, Kosa P, Komori M, Tanigawa M, Masvekar R, Wu T, Johnson K, Douvaras P, Fossati V, Herbst R, Wang Y, Tan K, Greenwood M, Bielekova B, 2017. Molecular-based diagnosis of multiple sclerosis and its progressive stage. Ann. Neurol. 82, 795–812. 10.1002/ana.25083 [DOI] [PMC free article] [PubMed] [Google Scholar]
- Barbour C, Kosa P, Varosanec M, Greenwood M, Bielekova B, 2020. Molecular models of multiple sclerosis severity identify heterogeneity of pathogenic mechanisms. medRxiv 2020.05.18.20105932. 10.1101/2020.05.18.20105932 [DOI] [PMC free article] [PubMed] [Google Scholar]
- Bové J, Martínez-Vicente M, Vila M, 2011. Fighting neurodegeneration with rapamycin: Mechanistic insights. Nat. Rev. Neurosci. 12, 437–452. 10.1038/nrn3068 [DOI] [PubMed] [Google Scholar]
- Bozaykut P, Ozer NK, Karademir B, 2014. Regulation of protein turnover by heat shock proteins. Free Radic. Biol. Med. 10.1016/j.freeradbiomed.2014.08.012 [DOI] [PubMed] [Google Scholar]
- Brambilla R, 2019. The contribution of astrocytes to the neuroinflammatory response in multiple sclerosis and experimental autoimmune encephalomyelitis. Acta Neuropathol. 137, 757–783. 10.1007/s00401-019-01980-7 [DOI] [PMC free article] [PubMed] [Google Scholar]
- Clarke LE, Liddelow SA, Chakraborty C, Münch AE, Heiman M, Barres BA, 2018. Normal aging induces A1-like astrocyte reactivity. Proc. Natl. Acad. Sci. U. S. A. 115, E1896–E1905. 10.1073/pnas.1800165115 [DOI] [PMC free article] [PubMed] [Google Scholar]
- Colombo E, Bassani C, De Angelis A, Ruffini F, Ottoboni L, Comi G, Martino G, Farina C, 2020. Siponimod (BAF312) Activates Nrf2 While Hampering NFκB in Human Astrocytes, and Protects From Astrocyte-Induced Neurodegeneration. Front. Immunol. 11, 1–11. 10.3389/fimmu.2020.00635 [DOI] [PMC free article] [PubMed] [Google Scholar]
- Fan YY, Huo J, 2021. A1/A2 astrocytes in central nervous system injuries and diseases: Angels or devils? Neurochem. Int. 148, 105080. 10.1016/j.neuint.2021.105080 [DOI] [PubMed] [Google Scholar]
- Frischer JM, Bramow S, Dal-Bianco A, Lucchinetti CF, Rauschka H, Schmidbauer M, Laursen H, Sorensen PS, Lassmann H, 2009. The relation between inflammation and neurodegeneration in multiple sclerosis brains. Brain 132, 1175–1189. 10.1093/brain/awp070 [DOI] [PMC free article] [PubMed] [Google Scholar]
- Galloway DA, Williams JB, Moore CS, 2017. Effects of fumarates on inflammatory human astrocyte responses and oligodendrocyte differentiation. Ann. Clin. Transl. Neurol. 4, 381–391. 10.1002/acn3.414 [DOI] [PMC free article] [PubMed] [Google Scholar]
- Gao S, Liu W, Zhuo X, Wang L, Wang G, Sun T, Zhao Z, Liu J, Tian Y, Zhou J, Yuan Z, Wu Y, 2015. The activation of mTOR is required for monocyte pro-inflammatory response in patients with coronary artery disease. Clin. Sci. 128, 517–526. 10.1042/CS20140427 [DOI] [PubMed] [Google Scholar]
- Giatti S, Boraso M, Melcangi RC, Viviani B, 2012. Neuroactive steroids, their metabolites, and neuroinflammation. J. Mol. Endocrinol. 49. 10.1530/JME-12-0127 [DOI] [PubMed] [Google Scholar]
- Gold L, Ayers D, Bertino J, Bock C, Bock A, Brody EN, Carter J, Dalby AB, Eaton BE, Fitzwater T, Flather D, Forbes A, Foreman T, Fowler C, Gawande B, Goss M, Gunn M, Gupta S, Halladay D, Heil J, Heilig J, Hicke B, Husar G, Janjic N, Jarvis T, Jennings S, Katilius E, Keeney TR, Kim N, Koch TH, Kraemer S, Kroiss L, Le N, Levine D, Lindsey W, Lollo B, Mayfield W, Mehan M, Mehler R, Nelson SK, Nelson M, Nieuwlandt D, Nikrad M, Ochsner U, Ostroff RM, Otis M, Parker T, Pietrasiewicz S, Resnicow DI, Rohloff J, Sanders G, Sattin S, Schneider D, Singer B, Stanton M, Sterkel A, Stewart A, Stratford S, Vaught JD, Vrkljan M, Walker JJ, Watrobka M, Waugh S, Weiss A, Wilcox SK, Wolfson A, Wolk SK, Zhang C, Zichi D, 2010. Aptamer-based multiplexed proteomic technology for biomarker discovery. PLoS One 5, e15004. 10.1371/journal.pone.0015004 [DOI] [PMC free article] [PubMed] [Google Scholar]
- Hara M, Kobayakawa K, Ohkawa Y, Kumamaru H, Yokota K, Saito T, Kijima K, Yoshizaki S, Harimaya K, Nakashima Y, Okada S, 2017. Interaction of reactive astrocytes with type i collagen induces astrocytic scar formation through the integrin-N-cadherin pathway after spinal cord injury. Nat. Med. 23, 818–828. 10.1038/nm.4354 [DOI] [PubMed] [Google Scholar]
- Hotamisligil GS, 2010. Endoplasmic Reticulum Stress and the Inflammatory Basis of Metabolic Disease. Cell. 10.1016/j.cell.2010.02.034 [DOI] [PMC free article] [PubMed] [Google Scholar]
- Hyvärinen T, Hagman S, Ristola M, Sukki L, Veijula K, Kreutzer J, Kallio P, Narkilahti S, 2019. Co-stimulation with IL-1β and TNF-α induces an inflammatory reactive astrocyte phenotype with neurosupportive characteristics in a human pluripotent stem cell model system. Sci. Rep. 9. 10.1038/s41598-019-53414-9 [DOI] [PMC free article] [PubMed] [Google Scholar]
- Kamermans A, Planting KE, Jalink K, van Horssen J, de Vries HE, 2019. Reactive astrocytes in multiple sclerosis impair neuronal outgrowth through TRPM7-mediated chondroitin sulfate proteoglycan production. Glia 67, 68–77. 10.1002/glia.23526 [DOI] [PMC free article] [PubMed] [Google Scholar]
- Kato H, Nakajima S, Saito Y, Takahashi S, Katoh R, Kitamura M, 2012. MTORC1 serves ER stress-triggered apoptosis via selective activation of the IRE1-JNK pathway. Cell Death Differ. 19, 310–320. 10.1038/cdd.2011.98 [DOI] [PMC free article] [PubMed] [Google Scholar]
- Kirk J, Plumb J, Mirakhur M, McQuaid S, 2003. Tight junctional abnormality in multiple sclerosis white matter affects all calibres of vessel and is associated with blood-brain barrier leakage and active demyelination. J. Pathol. 201, 319–27. 10.1002/path.1434 [DOI] [PubMed] [Google Scholar]
- Komori M, Blake A, Greenwood M, Lin YC, Kosa P, Ghazali D, Winokur P, Natrajan M, Wuest SC, Romm E, Panackal AA, Williamson PR, Wu T, Bielekova B, 2015. Cerebrospinal fluid markers reveal intrathecal inflammation in progressive multiple sclerosis. Ann. Neurol. 78, 3–20. 10.1002/ana.24408 [DOI] [PMC free article] [PubMed] [Google Scholar]
- Kosa P, Ghazali D, Tanigawa M, Barbour C, Cortese I, Kelley W, Snyder B, Ohayon J, Fenton K, Lehky T, Wu T, Greenwood M, Nair G, Bielekova B, 2016. Development of a Sensitive Outcome for Economical Drug Screening for Progressive Multiple Sclerosis Treatment. Front. Neurol. 7, 131. 10.3389/fneur.2016.00131 [DOI] [PMC free article] [PubMed] [Google Scholar]
- Kosa P, Komori M, Waters R, Wu T, Cortese I, Ohayon J, Fenton K, Cherup J, Gedeon T, Bielekova B, 2015. Novel composite MRI scale correlates highly with disability in multiple sclerosis patients. Mult. Scler. Relat. Disord. 4, 526–35. 10.1016/j.msard.2015.08.009 [DOI] [PMC free article] [PubMed] [Google Scholar]
- Kurtzke JF, 1983. Rating neurologic impairment in multiple sclerosis: An expanded disability status scale (EDSS). Neurology 33, 1444–1452. 10.1212/wnl.33.11.1444 [DOI] [PubMed] [Google Scholar]
- Li CY, Li X, Liu SF, Qu WS, Wang W, Tian DS, 2015. Inhibition of mTOR pathway restrains astrocyte proliferation, migration and production of inflammatory mediators after oxygen-glucose deprivation and reoxygenation. Neurochem. Int. 83–84, 9–18. 10.1016/j.neuint.2015.03.001 [DOI] [PubMed] [Google Scholar]
- Li T, Chen X, Zhang C, Zhang Y, Yao W, 2019. An update on reactive astrocytes in chronic pain. J. Neuroinflammation 16, 1–13. 10.1186/s12974-019-1524-2 [DOI] [PMC free article] [PubMed] [Google Scholar]
- Li T, Liu T, Chen X, Li L, Feng M, Zhang Y, Wan L, Zhang C, Yao W, 2020. Microglia induce the transformation of A1/A2 reactive astrocytes via the CXCR7/PI3K/Akt pathway in chronic post-surgical pain. J. Neuroinflammation 17, 1–15. 10.1186/s12974-020-01891-5 [DOI] [PMC free article] [PubMed] [Google Scholar]
- Liddelow SA, Guttenplan KA, Clarke LE, Bennett FC, Bohlen CJ, Schirmer L, Bennett ML, Münch AE, Chung WS, Peterson TC, Wilton DK, Frouin A, Napier BA, Panicker N, Kumar M, Buckwalter MS, Rowitch DH, Dawson VL, Dawson TM, Stevens B, Barres BA, 2017. Neurotoxic reactive astrocytes are induced by activated microglia. Nature 541, 481–487. 10.1038/nature21029 [DOI] [PMC free article] [PubMed] [Google Scholar]
- Linker RA, Haghikia A, 2016. Dimethyl fumarate in multiple sclerosis: latest developments, evidence and place in therapy. Ther. Adv. Chronic Dis. 7, 198–207. 10.1177/2040622316653307 [DOI] [PMC free article] [PubMed] [Google Scholar]
- MacRae CA, Peterson RT, 2015. Zebrafish as tools for drug discovery. Nat. Rev. Drug Discov. 10.1038/nrd4627 [DOI] [PubMed] [Google Scholar]
- Manouchehrinia A, Westerlind H, Kingwell E, Zhu F, Carruthers R, Ramanujam R, Ban M, Glaser A, Sawcer S, Tremlett H, Hillert J, 2017. Age Related Multiple Sclerosis Severity Score: Disability ranked by age. Mult. Scler. 23, 1938–1946. 10.1177/1352458517690618 [DOI] [PMC free article] [PubMed] [Google Scholar]
- Markowitz CE, 2014. Multiple sclerosis update. Int. J. MS Care 16, 5–11. 10.7748/phc2004.03.14.2.26.c488 [DOI] [Google Scholar]
- Masvekar R, Mizrahi J, Park J, Williamson PR, Bielekova B, 2019a. Quantifications of CSF Apoptotic Bodies Do Not Provide Clinical Value in Multiple Sclerosis. Front. Neurol. 10, 1241. 10.3389/fneur.2019.01241 [DOI] [PMC free article] [PubMed] [Google Scholar]
- Masvekar R, Wu T, Kosa P, Barbour C, Fossati V, Bielekova B, 2019b. Cerebrospinal fluid biomarkers link toxic astrogliosis and microglial activation to multiple sclerosis severity. Mult. Scler. Relat. Disord. 28, 34–43. 10.1016/j.msard.2018.11.032 [DOI] [PMC free article] [PubMed] [Google Scholar]
- Mei F, Fancy SPJ, Shen YAA, Niu J, Zhao C, Presley B, Miao E, Lee S, Mayoral SR, Redmond SA, Etxeberria A, Xiao L, Franklin RJM, Green A, Hauser SL, Chan JR, 2014. Micropillar arrays as a high-throughput screening platform for therapeutics in multiple sclerosis. Nat. Med. 20, 954–960. 10.1038/nm.3618 [DOI] [PMC free article] [PubMed] [Google Scholar]
- Padmanabhan J, Levy M, Dickson DW, Potter H, 2006. Alpha1-antichymotrypsin, an inflammatory protein overexpressed in Alzheimer’s disease brain, induces tau phosphorylation in neurons. Brain 129, 3020–3034. 10.1093/brain/awl255 [DOI] [PubMed] [Google Scholar]
- Pandey UB, Nichols CD, 2011. Human disease models in drosophila melanogaster and the role of the fly in therapeutic drug discovery. Pharmacol. Rev. 63, 411–436. 10.1124/pr.110.003293 [DOI] [PMC free article] [PubMed] [Google Scholar]
- Polman CH, Reingold SC, Banwell B, Clanet M, Cohen JA, Filippi M, Fujihara K, Havrdova E, Hutchinson M, Kappos L, Lublin FD, Montalban X, O’Connor P, Sandberg-Wollheim M, Thompson AJ, Waubant E, Weinshenker B, Wolinsky JS, 2011. Diagnostic criteria for multiple sclerosis: 2010 Revisions to the McDonald criteria. Ann. Neurol. 69, 292–302. 10.1002/ana.22366 [DOI] [PMC free article] [PubMed] [Google Scholar]
- Rhen T, Cidlowski JA, 2005. Antiinflammatory action of glucocorticoids - New mechanisms for old drugs. N. Engl. J. Med. 353, 1711–1723. 10.1056/NEJMra050541 [DOI] [PubMed] [Google Scholar]
- Roxburgh RHSR, Seaman SR, Masterman T, Hensiek AE, Sawcer SJ, Vukusic S, Achiti I, Confavreux C, Coustans M, Le Page E, Edan G, McDonnell GV, Hawkins S, Trojano M, Liguori M, Cocco E, Marrosu MG, Tesser F, Leone MA, Weber A, Zipp F, Miterski B, Epplen JT, Oturai A, Sørensen PS, Celius EG, Lara NT, Montalban X, Villoslada P, Silva AM, Marta M, Leite I, Dubois B, Rubio J, Butzkueven H, Kilpatrick T, Mycko MP, Selmaj KW, Rio ME, Sá M, Salemi G, Savettieri G, Hillert J, Compston DAS, 2005. Multiple sclerosis severity score: Using disability and disease duration to rate disease severity. Neurology 64, 1144–1151. 10.1212/01.WNL.0000156155.19270.F8 [DOI] [PubMed] [Google Scholar]
- Schröder M, Kaufman RJ, 2005. ER stress and the unfolded protein response. Mutat. Res. - Fundam. Mol. Mech. Mutagen. 10.1016/j.mrfmmm.2004.06.056 [DOI] [PubMed] [Google Scholar]
- Steinberg TA, Boettcher IC, Matiasek K, Hirschvogel K, Hartmann K, Fischer A, Kuntz A, 2008. Use of albumin quotient and IgG index to differentiate blood- vs brain-derived proteins in the cerebrospinal fluid of cats with feline infectious peritonitis. Vet. Clin. Pathol. 37, 207–216. 10.1111/j.1939-165X.2008.00028.x [DOI] [PMC free article] [PubMed] [Google Scholar]
- Ugalde CL, Lewis V, Stehmann C, McLean CA, Lawson VA, Collins SJ, Hill AF, 2020. Markers of A1 astrocytes stratify to molecular sub-types in sporadic Creutzfeldt–Jakob disease brain. Brain Commun. 2, 1–8. 10.1093/braincomms/fcaa029 [DOI] [PMC free article] [PubMed] [Google Scholar]
- Utili R, Boitnott JK, Zimmerman HJ, 1977. Dantrolene-Associated Hepatic Injury: Incidence and character. Gastroenterology 72, 610–616. 10.1016/S0016-5085(77)80141-8 [DOI] [PubMed] [Google Scholar]
- Van Doorn R, Van Horssen J, Verzijl D, Witte M, Ronken E, Van Het Hof B, Lakeman K, Dijkstra CD, Van Der Valk P, Reijerkerk A, Alewijnse AE, Peters SLM, De Vries HE, 2010. Sphingosine 1-phosphate receptor 1 and 3 are upregulated in multiple sclerosis lesions. Glia 58, 1465–1476. 10.1002/glia.21021 [DOI] [PubMed] [Google Scholar]
- Wang Y, Shi Y, Wei H, 2017. Calcium Dysregulation in Alzheimer’s Disease: A Target for New Drug Development. J. Alzheimer’s Dis. Park. 7. 10.4172/2161-0460.1000374 [DOI] [PMC free article] [PubMed] [Google Scholar]
- Weideman AM, Barbour C, Tapia-Maltos MA, Tran T, Jackson K, Kosa P, Komori M, Wichman A, Johnson K, Greenwood M, Bielekova B, 2017. New Multiple Sclerosis Disease Severity Scale Predicts Future Accumulation of Disability. Front. Neurol. 8, 598. 10.3389/fneur.2017.00598 [DOI] [PMC free article] [PubMed] [Google Scholar]
- Wilhelm A, Volknandt W, Langer D, Nolte C, Kettenmann H, Zimmermann H, 2004. Localization of SNARE proteins and secretory organelle proteins in astrocytes in vitro and in situ. Neurosci. Res. 48, 249–257. 10.1016/j.neures.2003.11.002 [DOI] [PubMed] [Google Scholar]
- Xu X, Zhang A, Zhu Y, He W, Di W, Fang Y, Shi X, 2018. MFG-E8 reverses microglial-induced neurotoxic astrocyte (A1) via NF-κB and PI3K-Akt pathways. J. Cell. Physiol. 234, 904–914. 10.1002/jcp.26918 [DOI] [PubMed] [Google Scholar]
- Yamamoto WR, Bone RN, Sohn P, Syed F, Reissaus CA, Mosley AL, Wijeratne AB, True JD, Tong X, Kono T, Evans-Molina C, 2019. Endoplasmic reticulum stress alters ryanodine receptor function in the murine pancreatic cell. J. Biol. Chem. 294, 168–181. 10.1074/jbc.RA118.005683 [DOI] [PMC free article] [PubMed] [Google Scholar]
- Yi W, Schlüter D, Wang X, 2019. Astrocytes in multiple sclerosis and experimental autoimmune encephalomyelitis: Star-shaped cells illuminating the darkness of CNS autoimmunity. Brain. Behav. Immun. 80, 10–24. 10.1016/j.bbi.2019.05.029 [DOI] [PubMed] [Google Scholar]
- Zamanian JL, Xu L, Foo LC, Nouri N, Zhou L, Giffard RG, Barres BA, 2012. Genomic analysis of reactive astrogliosis. J. Neurosci. 32, 6391–6410. 10.1523/JNEUROSCI.6221-11.2012 [DOI] [PMC free article] [PubMed] [Google Scholar]
- Zou LH, Shi YJ, He H, Jiang SM, Huo FF, Wang XM, Wu F, Ma L, 2019. Effects of FGF2/FGFR1 pathway on expression of A1 astrocytes after infrasound exposure. Front. Neurosci. 13, 1–8. 10.3389/fnins.2019.00429 [DOI] [PMC free article] [PubMed] [Google Scholar]
Associated Data
This section collects any data citations, data availability statements, or supplementary materials included in this article.