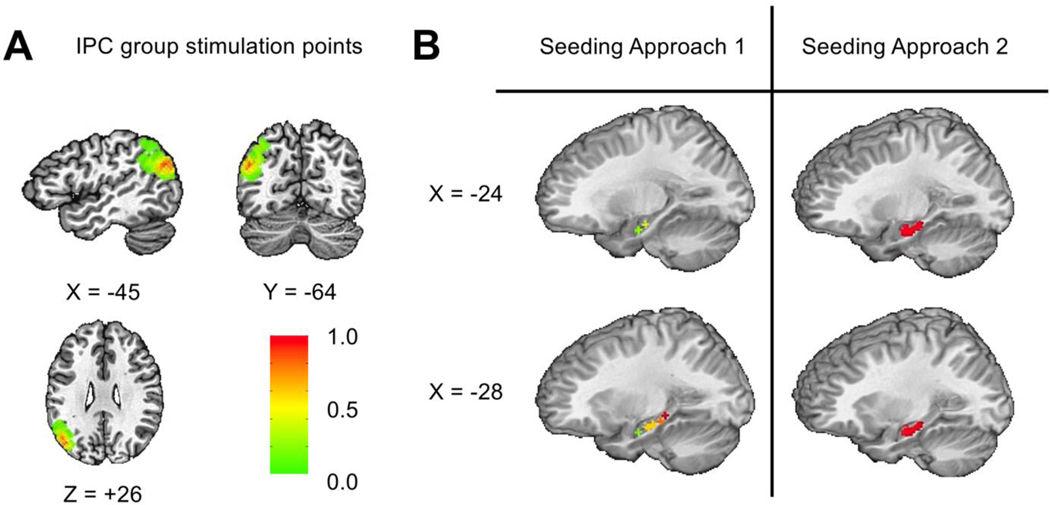
Figure 3.
A. Distribution of stimulation points. Topographical distribution of stimulated voxels across the left IPC, shown on a template brain (TT_N27). Colors represent the proportion of voxels stimulated across participants. B. IPC group seeding approaches 1. Location of the six sampled seeds for 12 participants. 2. Region sampled to find the seed voxel maximally connected with the IPC for the remaining 12 IPC participants.

