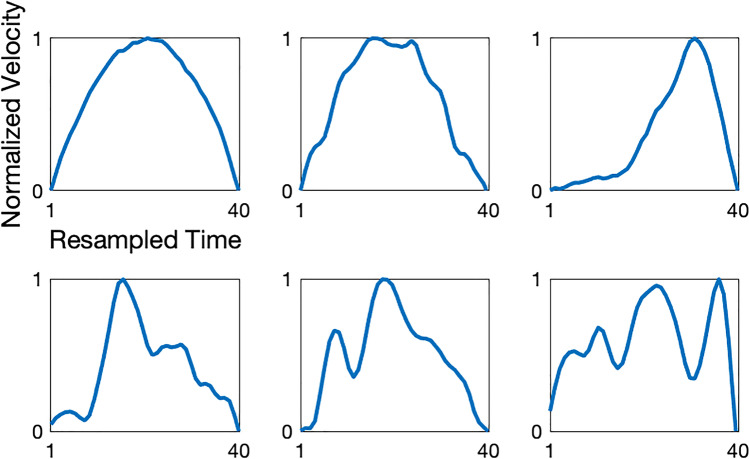
Fig. 1.
Examples of normalized submovements from an individual with ataxia-telangiectasia. The x-axis is resampled time so that each submovement is represented by forty time points. The y-axis is velocity, normalized to the range 0–1. Normalized submovements can take on a range of different shapes with varied peak locations and low and high-frequency components

