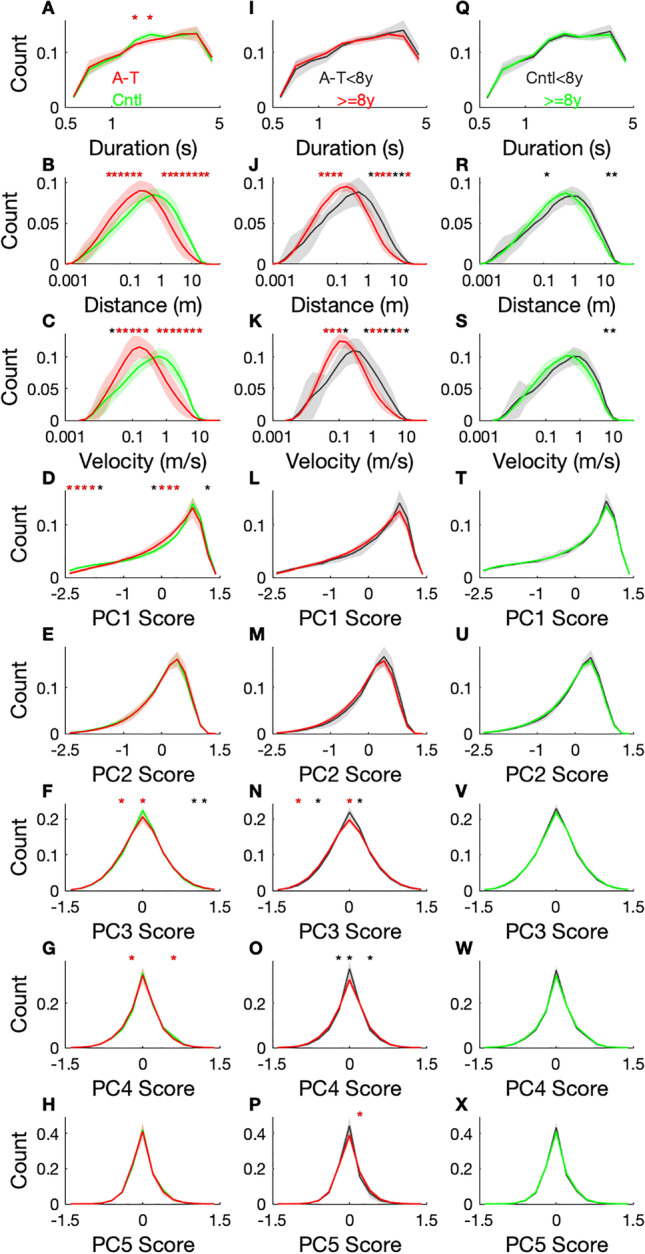
Fig. 4.

Normalized histograms of long duration (0.6–5 s) submovement properties for individuals with A-T versus controls (column 1, A–H), younger versus older individuals with A-T (column 2, I–P), and younger versus older controls (column 3, Q–X), for dataset 2 (N = 55). Participants with A-T are shown in red and controls in green. The line is the population group mean, and the line width indicates group standard deviation. Duration, distance, and velocity histograms are plotted in log scale. Each histogram bin that is significantly different between groups is marked to indicate the level of significance: p < 0.001(*); p < 0.0001(red*). Abbreviations: PC principal component
