. 2022 Mar 2;11:e75658. doi: 10.7554/eLife.75658

Figure 3. Tom70 regulates the abundance of mtDNA.

(A, B) Representative images and quantification of mtDNA in wild type and ∆tom70 cells were stained by Hoechst dye. Yellow arrowheads point to the mtDNA. Bar graph are the mean and s.e.m. from 87 and 109 cells. (C) iMTS probability profiles of Mip1 and Hsp60 predicted by TargetP algorithm. The consecutively N-terminally truncated sequences of the proteins were used as input to calculate the TargetP scores for each residue, which shows internal regions with presequence-like properties, or iMTS. Hsp60, another mitochondrial protein does not depend on Tom70, was also plotted in the same way for comparison (Backes et al., 2018). Red line (0.4) indicates the cutoff defined in previous study (Backes et al., 2018). Blue and red arrows indicate the N-terminal signal peptide and iMTS, respectively. (D) Representative images and quantification of Mip1-GFP in control and TOM70 OE cells. Bar graphs are the mean and s.e.m. from 300 and 438 cells. (E) Quantification of mtDNA in control and MIP1 OE cells from Hoechst staining. Bar graphs are the mean and s.e.m. from 253 and 209 cells. Scale bar for all images: 5 μm. Images are representative of at least two independent experiments.Bar graphs are the normalized mean and s.e.m. Data were analyzed with unpaired two-tailed t test: ***, p < 0.001.

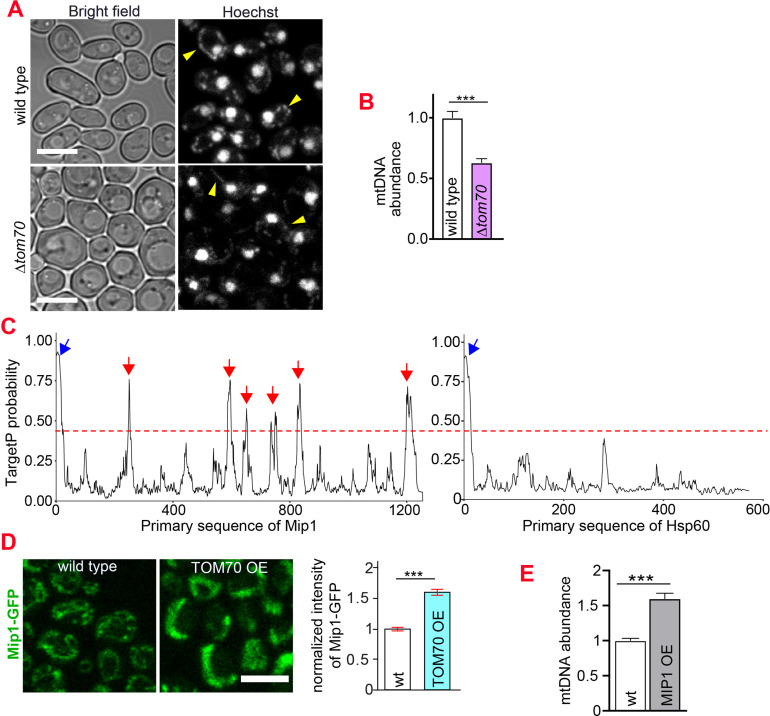
Figure 3.

Figure 3—figure supplement 1. The role of mtDNA metabolisms in Tom70’s regulatory function of mitochondrial biogenesis.

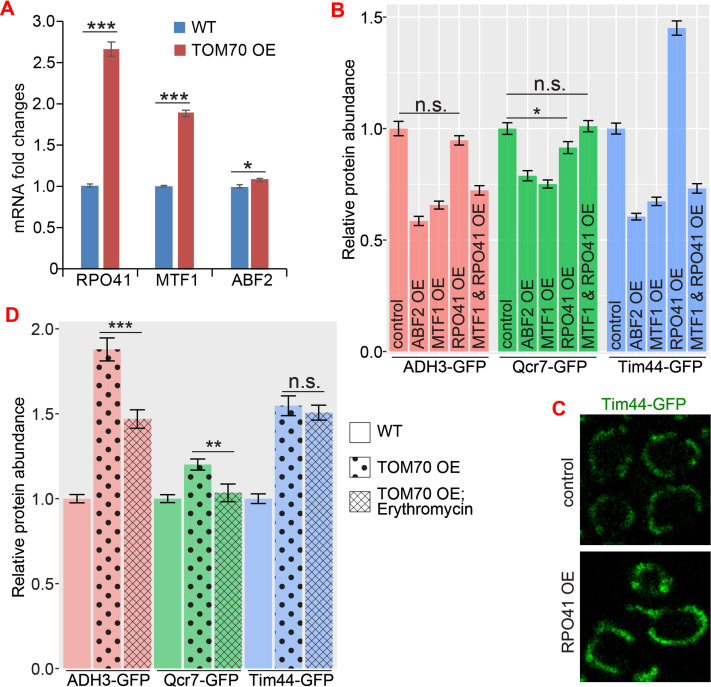
Figure 3—figure supplement 1.

(A) mRNA abundance of basic mitochondrial transcription machineries quantified by RT-qPCR in TOM70 OE strain and normalized to control cells. All different yeast strains, including wild-type control, were cultured in the same medium. Shown are the mean and s.e.m. from three replicates. (B, C) Quantification (B) of different mitochondrial proteins in wild type control strain and other strains overexpressing different mitochondrial transcription machineries. All different yeast strains were cultured in the same medium. Only RPO41 OE increased Tim44-GFP expression among these strains. In fact, most of these overexpressing strains have reduced abundance of mitochondrial proteins , and the mitochondrial morphology in RPO41 OE cells (C) was different from TOM70 OE (Figure 1A), suggesting that these mitochondrial transcription machineries are not downstream of TOM70 OE. (D) Quantification of different mitochondrial proteins in wild type control strain and TOM70 OE strains with/without Erythromycin (2 mg/ml) treatment 30 min before and during galactose induced TOM70 OE. All different yeast strains were cultured in the same growth medium. Inhibition of mitochondrial translation by Erythromycin partially inhibit some mitochondrial biogenesis induced by TOM70 OE. Data were analyzed with unpaired two-tailed t test: ***, p < 0.001; *, p < 0.05; n.s., not significant. Sample sizes are given in Supplementary file 4.