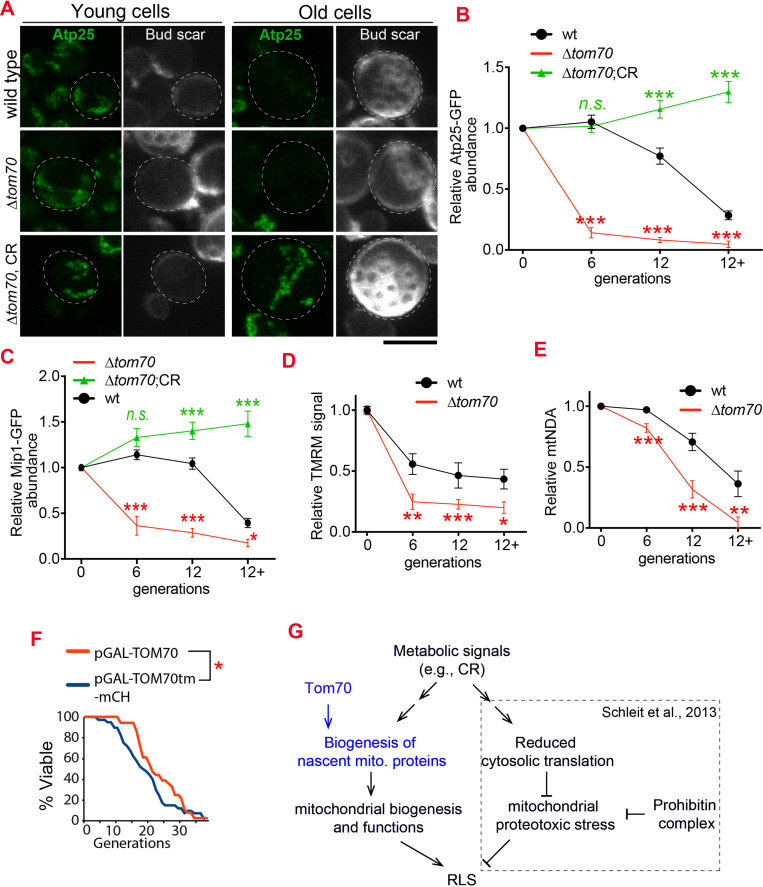
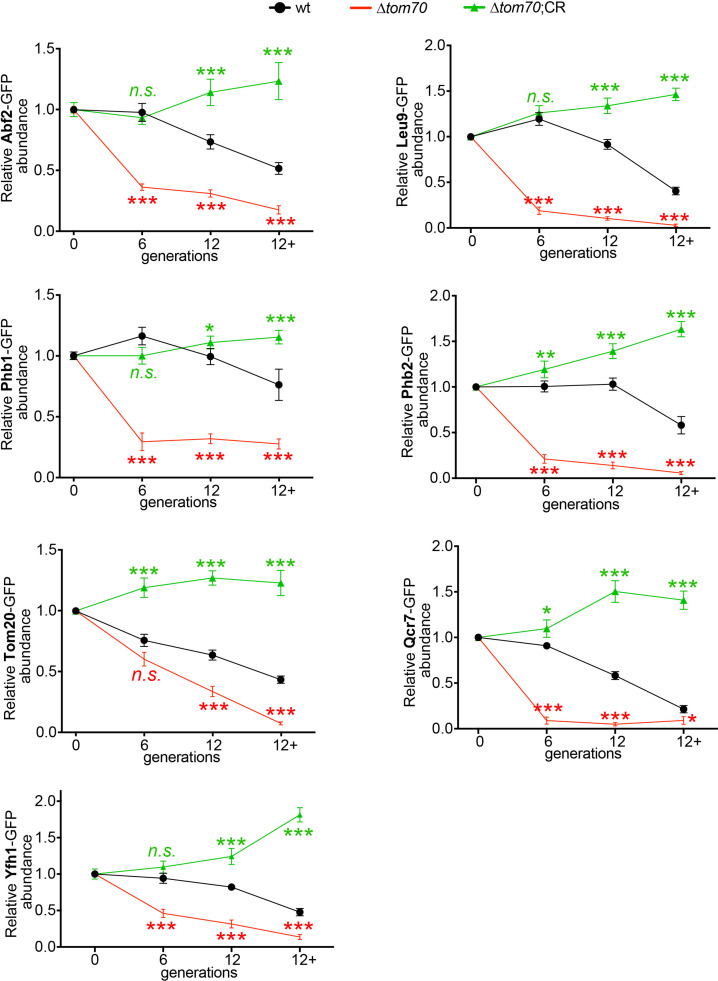
Figure 6. Loss of Tom70 accelerates mitochondrial aging.
(A, B) Representative images (A) and quantifications (B) of Atp25-GFP in young and aged cells of different strains. Both young and old cells were from YPD culture and stained with calcofluor white to visualize the bud scars. Both young and old cells were quantified from the purified cells that went through the same experimental procedures and purification (same for other results). All strains cultured in YPD medium with 2% glucose except for CR, which has 0.05% glucose. The GFP signal quantified from the old cells was normalized to corresponding young cells of the same strain. Old cells were grouped as young (0 bud scar), age 2–6, age 7–11, and age 12+. Data were analyzed with unpaired two-tailed t test: ***, p < 0.001; **, p < 0.01; *, p < 0.05; n.s., not significant (same for C-E). More than 20 cells quantified for each group (same for C-E). (C) Quantification of Mip1 in young and aged cells from different strains. All strains cultured in YPD medium with 2% glucose except for CR, which has 0.05% glucose. (D, E) Quantification of mitochondrial membrane potential (D) and mtDNA (E) in young and aged cells from different strains. Mitochondrial membrane potential was indicated by TMRM staining. All strains cultured in YPD medium with 2% glucose except for CR, which has 0.05% glucose. (F) Survival curve from replicative life span assay of 36 and 40 cells expressing pGAL-TOM70 and pGAL-TOM70tm-mCH, respectively, were determined by microscopic dissection on YEP-galactose plates. P = 0.038 by Mann-Whitney test. (G) Proposed model by which CR extends the RLS of different mitochondrial mutants via different mechanisms. Schleit et al., 2013 showed that CR extends the RLS of ∆phb cells by reducing mitochondrial proteotoxic stress via reduced cytosolic translation. Our results demonstrated that this reduced cytosolic translation in CR is not universal as the biogenesis of mitochondrial proteins is preserved during aging. This preserved mitochondrial biogenesis in CR is consistent with the observed rescue of RLS in ∆tom70 cells by CR (Schleit et al., 2013). Scale bar for all images: 5 μm. Mitochondrial proteins were visualized by endogenous C-terminal GFP tagging and expressed from their own promoters. Images are representative of at least two independent experiments.


