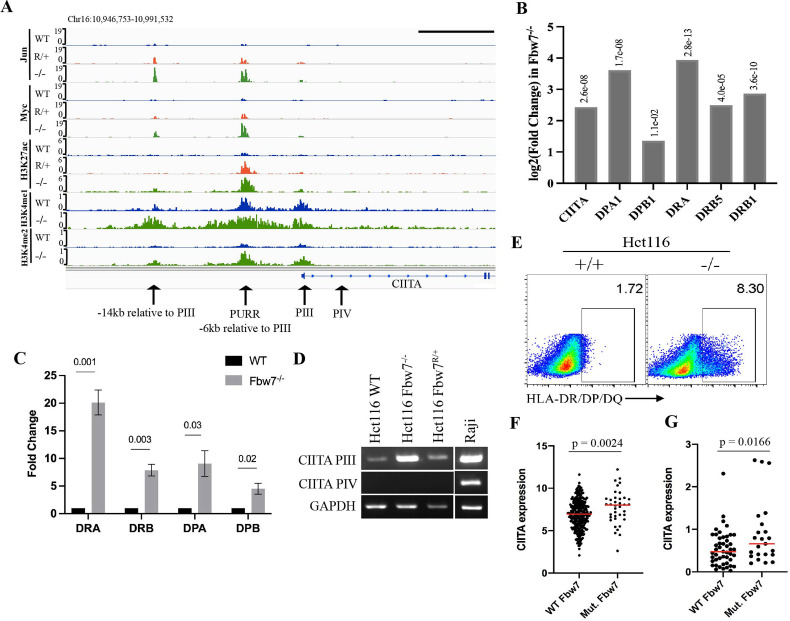
Figure 5. Fbw7 regulates the expression of MHC Class II genes.
(A) Genome browser view of TFs and histone modification marks enriched at the promoter and regulatory sites upstream of CIITA gene. Arrows point to (from right to left): PIV (promoter of isoform IV); PIII (promoter of isoform III); PURR (PIII Upstream Regulatory Regions)—a known regulatory site 6-kb upstream of PIII; and a known regulatory site 14-kb upstream to PIII. Black scale bar=10 kb. (B) Expression fold change of CIITA and MHC Class II genes in Hct116 Fbw7−/− with respect to WT cells. FDR values are indicated on top of each bar. n=3. (C) Quantitative RT-PCR analysis of MHC Class II (HLA-DRA, HLA-DRB, HLA-DPA, and HLA-DPB) expression in Hct116 Fbw7−/− cells. Mean fold change in Fbw7−/− cells with respect to WT cells. Error bars=SEM, n=3. (D) CIITA isoforms III and IV amplified using isoform specific primers in Hct116 and Raji cells. (E) Flow cytometry analysis of HLA-DR/DP/DQ protein expression in Hct116 cells. (F) CIITA expression in primary cancer samples from TCGA COADREAD data sets that have WT Fbw7 (n=297) and mutated Fbw7 (n=43). (G) CIITA expression in colon and rectal cancer cell lines with WT Fbw7 (n=47) and mutated Fbw7 (n=23). Data collected from DepMap portal. See Figure 5—figure supplement 1, Figure 5—figure supplement 2 and Figure 5—source data 1–4. TF, transcription factor; WT, wild-type.
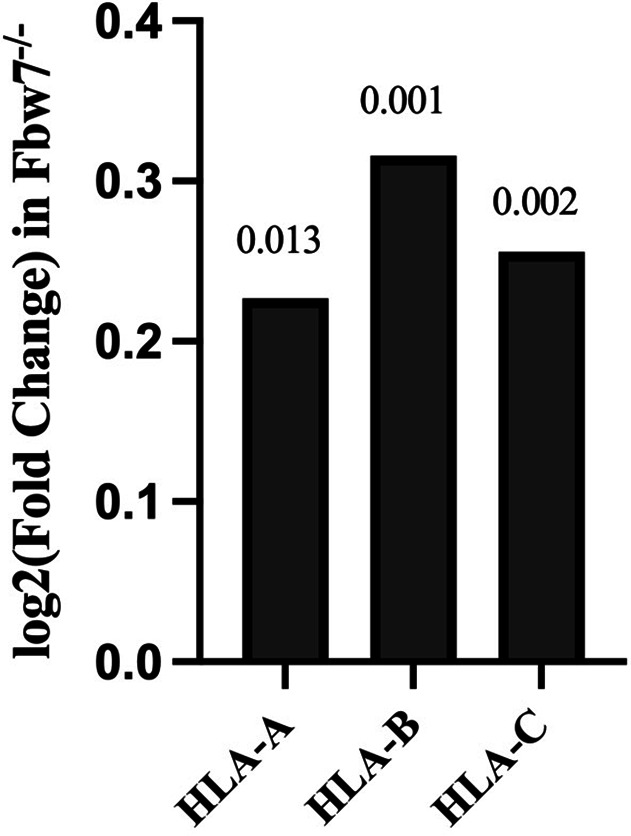
Figure 5—figure supplement 1. Expression fold change of MHC Class I genes in Hct116 Fbw7−/− with respect to WT cells.

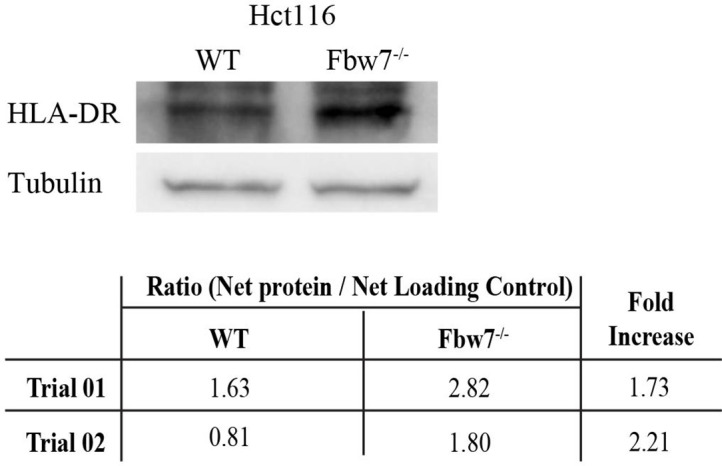
Figure 5—figure supplement 2. MHC Class II protein expression in Hct116 cells.


