Abstract
Aegilops tauschii, the diploid wild progenitor of the D subgenome of bread wheat, is a reservoir of genetic diversity for improving bread wheat performance and environmental resilience. Here we sequenced 242 Ae. tauschii accessions and compared them to the wheat D subgenome to characterize genomic diversity. We found that a rare lineage of Ae. tauschii geographically restricted to present-day Georgia contributed to the wheat D subgenome in the independent hybridizations that gave rise to modern bread wheat. Through k-mer-based association mapping, we identified discrete genomic regions with candidate genes for disease and pest resistance and demonstrated their functional transfer into wheat by transgenesis and wide crossing, including the generation of a library of hexaploids incorporating diverse Ae. tauschii genomes. Exploiting the genomic diversity of the Ae. tauschii ancestral diploid genome permits rapid trait discovery and functional genetic validation in a hexaploid background amenable to breeding.
Subject terms: Plant domestication, Genome informatics, Plant breeding, Plant immunity, Genome-wide association studies
Exploring the diversity of the wild progenitor of the wheat D subgenome allows for rapid trait discovery.
Main
The success of bread wheat (Triticum aestivum) as a major worldwide crop is underpinned by its adaptability to diverse environments, high grain yield and nutritional content1. With the combined challenge of population expansion and hotter, less favorable climates, wheat yields must be sustainably increased to ensure global food security. The rich reservoir of genetic diversity amongst the wild relatives of wheat provides a means to improve productivity1,2. Maximizing the genetic potential of wheat requires a deep understanding of the structure and function of its genome, including its relationship with its wild progenitor species.
The evolution of bread wheat from its wild relatives is typically depicted as two sequential interspecific hybridization and genome duplication events leading to the genesis of the allohexaploid bread wheat genome2,3. The first hybridization between T. urartu (AA) and a presumed extinct diploid (BB) species formed tetraploid emmer wheat, T. turgidum (AABB), ~0.5 million years ago4. The gradual process of domestication of T. turgidum started with its cultivation in the Fertile Crescent some 10,000 years ago5. Subsequent hybridization with Ae. tauschii (DD) formed the hexaploid T. aestivum (AABBDD)6. Whereas ancient gene flow incorporated the majority of the AABB genome diversity into hexaploid wheat, only a small fraction of the D genome diversity was captured7. Indeed, hybridization between T. turgidum and Ae. tauschii was thought to be restricted to a subpopulation of Ae. tauschii from the shores of the Caspian Sea in present-day Iran8. Despite sampling limited diversity, this genomic innovation created a plant more widely adapted to a broad range of environments and with end-use qualities not found in its progenitors1.
The low genetic diversity of the bread wheat D subgenome has long motivated breeders to recruit diversity from Ae. tauschii. The most common route involves hybridization between tetraploid wheat and Ae. tauschii followed by chromosome doubling to create synthetic hexaploids9. Alternatively, direct hybridization between hexaploid wheat and Ae. tauschii is possible. This approach usually requires embryo rescue but has the advantage that it does not disrupt desirable allele combinations in the bread wheat A and B subgenomes10,11. Notwithstanding, the products of all these wide crosses require backcrossing to domesticated cultivars to remove unwanted agronomic traits from the wild progenitor and restore optimal end-use qualities. The boost to genetic diversity and resilience therefore comes at a cost to the breeder9. However, if haplotypes underlying useful traits could be directly identified in Ae. tauschii, this would mitigate a critical limitation in breeding wheat with Ae. tauschii; such haplotypes can be tagged with molecular markers for accelerated delivery into domesticated wheat by combining marker-assisted selection12 with rapid generation advancement13. Furthermore, a gene-level understanding would permit next-generation breeding by gene editing and transformation.
In this study, we performed whole-genome shotgun short-read sequencing on a diverse panel of 242 Ae. tauschii accessions. We discovered that an uncharacterized Ae. tauschii lineage contributed to the initial gene flow into domesticated wheat, thus broadening our understanding of the evolution of bread wheat. To facilitate the discovery of useful genetic variation from Ae. tauschii, we established a k-mer-based association mapping pipeline and demonstrated the mobilization of the untapped diversity from Ae. tauschii into wheat through the use of synthetic wheats and genetic transformation for biotic stress resistance genes.
Results
Multiple hybridizations shaped the bread wheat D subgenome
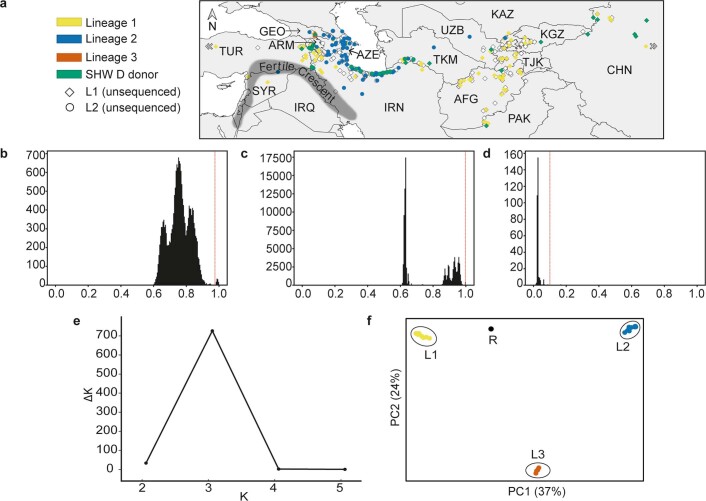
We identified a set of 242 non-redundant Ae. tauschii accessions with minor residual heterogeneity after short-read sequencing of 306 accessions covering the geographical range spanned by diverse Ae. tauschii collections (Fig. 1a, Extended Data Fig. 1a–d, Supplementary Tables 1–5 and Supplementary Note). To capture the genetic diversity of the Ae. tauschii species complex, we generated a k-mer matrix specifying the presence and absence of a comprehensive set of 51-mer variants in the sequenced accessions and a single-nucleotide polymorphism (SNP) matrix relative to the AL8/78 reference genome14.
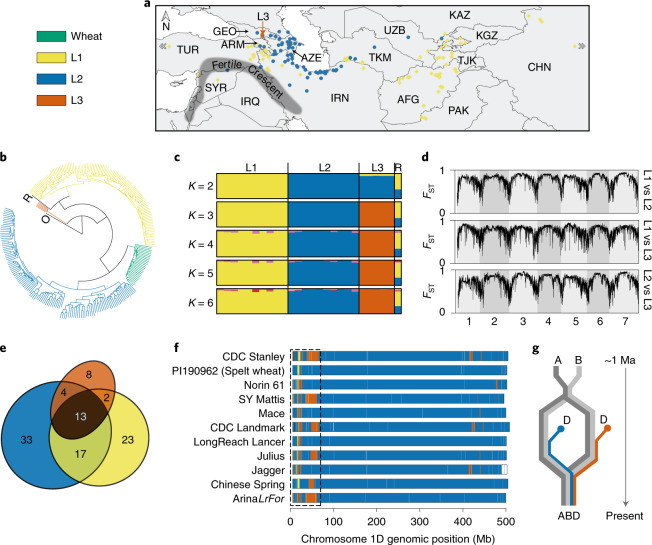
Fig. 1. Characterization of a third lineage of Ae. tauschii and its contribution to the wheat D subgenome.
The color code for all panels is shown for wheat and Ae. tauschii lineages (L1, L2, L3) in the top left corner. a, Distribution of the 242 Ae. tauschii samples used in this study. The five L3 accessions are indicated by an orange vertical arrow. Country abbreviations are provided in Extended Data Fig. 1a. b, Phylogeny showing the D subgenome of 28 wheat landraces in relation to Ae. tauschii, a tetraploid (AABB genome) outgroup (O) and an Ae. tauschii RIL (labeled R) derived from L1 and L2. c, STRUCTURE analysis of the randomly selected ten accessions from each of L1 and L2 along with the five accessions of L3 and the RIL. K denotes the number of subpopulations considered. d, Genome-wide fixation index (FST) estimates of the Ae. tauschii lineages. e, Venn diagram showing the percentage of lineage-specific and shared k-mers between the lineages. f,g, Chromosome 1D of wheat cultivars/accessions colored according to their Ae. tauschii lineage-specific origin (f). The pattern of lineage-specific contribution to the wheat D subgenome, highlighted for one region by a dashed rectangle, suggests that at least two polyploidization events with distinct Ae. tauschii lineages, as shown in g, followed by intraspecific crossing gave rise to extant hexaploid bread wheat. Ma, million years ago.
Extended Data Fig. 1. Configuration and genetic structure of the Aegilops tauschii diversity panel used in this study.
a, Geographical distribution of 242 Ae. tauschii accessions. Filled squares and circles represent accessions sequenced as part of this study, while accessions represented by unfilled squares and circles were not sequenced. Accessions highlighted in green were used as D genome donors to generate synthetic hexaploid wheat (SHW) lines. Three accessions outside of the map, one from Turkey and two from China, are indicated by white arrow heads. AFG, Afghanistan; ARM, Armenia; AZE, Azerbaijan; CHN, China; GEO, Georgia; IRN, Iran; IRQ, Iraq; KAZ, Kazakhstan; KGZ, Kyrgyzstan; PAK, Pakistan; SYR, Syria; TJK, Tajikistan; TUR, Turkey; TKM, Turkmenistan; UZB, Uzbekistan. The Fertile Crescent follows the shaded area in Fig. 1 of Harlan and Zohary (1966) and is bound by the Mediterranean in the west, by chains of large and high mountain ranges in the north and east (the Amanos in northwestern Syria, the Taurus in southern Turkey, Ararat in north-eastern Turkey and the Zagros in western Iran), and in the south by the Syrio-Arabian desert, with its western extension (for example, Paran desert) in the Sinai Peninsula. b, Identification of non-redundant Ae. tauschii accessions using KASP markers on 195 accessions and: c, 100,000 random SNPs obtained from whole genome shotgun sequencing of 306 accessions. The vertical red line in both histogram similarity plots indicates the redundancy cut-off at which the peak of the high similarity values is clearly separated from the rest. d, Identification of Ae. tauschii accessions with minimal residual heterogeneity. The histogram of heterozygosity scores was generated using all the bi-allelic SNPs obtained from whole genome shotgun sequencing of 305 accessions (excluding TOWWC0193). The vertical red line indicates the cut-off at which the cluster of the low heterozygosity values is clearly separated. e, ΔK plot for a STRUCTURE run with 10 randomly selected accessions each of L1 and L2 along with the five accessions of the putative L3 and the control L1-L2 RIL. f, Principal Component Analysis with the same set of accessions as used in panel a. The recombinant inbred control line is indicated by R.
Ae. tauschii is generally categorized into two lineages, lineage 1 (L1) and lineage 2 (L2)15,16, with L2 considered the major contributor to the wheat D subgenome8. To better understand the relationship between Ae. tauschii and wheat, we randomly selected 100,000 k-mers and checked their presence in the short-read sequences of 28 hexaploid wheat landraces17. We used a tetraploid wheat accession as an outgroup in the phylogenetic analysis and included a recent Ae. tauschii L1–L2 recombinant inbred line (RIL)15 as a control in our population structure analysis. We generated a phylogeny based on the presence/absence of these k-mers and found it to be consistent with earlier phylogenies generated using molecular markers in that Ae. tauschii L1 and L2 formed two major clades, whereas the wheat D subgenome formed a discrete and narrow clade most closely related to L2 (Fig. 1b)8,15,16. This supports the L2 origin of the wheat D subgenome and its limited genetic diversity relative to Ae. tauschii. A group of five accessions formed a distinct clade separate from L1 and L2, as previously observed15,16, which seems to be a basal lineage based on the split from the outgroup. Matsuoka et al. hypothesized that this group could be a separate lineage18, whereas Singh et al. hypothesized that it could have arisen from interlineage hybridization followed by isolated evolution15. To resolve this question, we conducted Bayesian clustering analysis using STRUCTURE19. Because this algorithm does not reliably recover the correct population structure when sampling is uneven20, we randomly selected ten accessions from L1 and from L2 for this analysis along with the five accessions of the putative lineage 3 (L3) and the control L1–L2 RIL (Supplementary Table 6). Performing STRUCTURE analysis with the number of subpopulations, K = 2 showed the putative L3 accessions as an admixture of L1 and L2, similar to the L1–L2 RIL; but with K = 3, these accessions were assigned to a distinct lineage (Fig. 1c). Further increasing the value of K did not reveal any discernible substructure. This interpretation was supported by the ΔK curve, which showed a clear peak at K = 3 (Extended Data Fig. 1e). Principal-component analysis (PCA) also separated the population into three clusters corresponding to L1, L2 and L3 (Extended Data Fig. 1f). Computing the genome-wide pairwise fixation index (FST) between the three lineages using SNPs in a sliding window of 1 megabases (Mb) with a step size of 100 kilobases (kb) indicated a high level of population differentiation across the genome, with values near 1.0 in the centromeric regions and around 0.3–0.5 near the telomeric ends (Fig. 1d). These observations demonstrate the existence of a differentiated third lineage within Ae. tauschii.
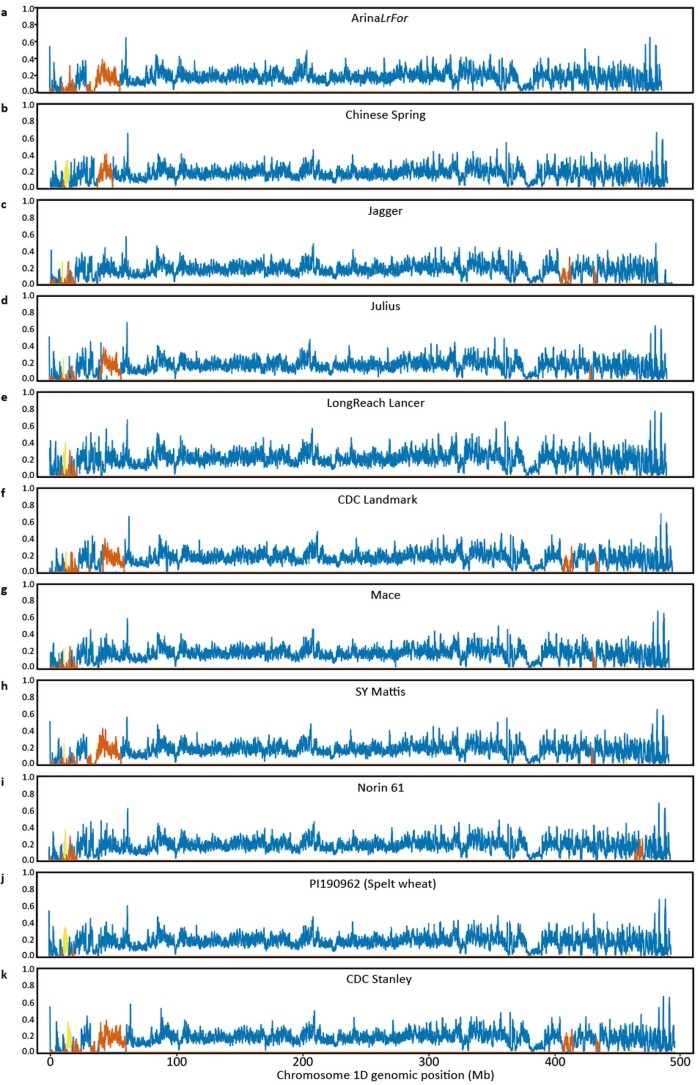
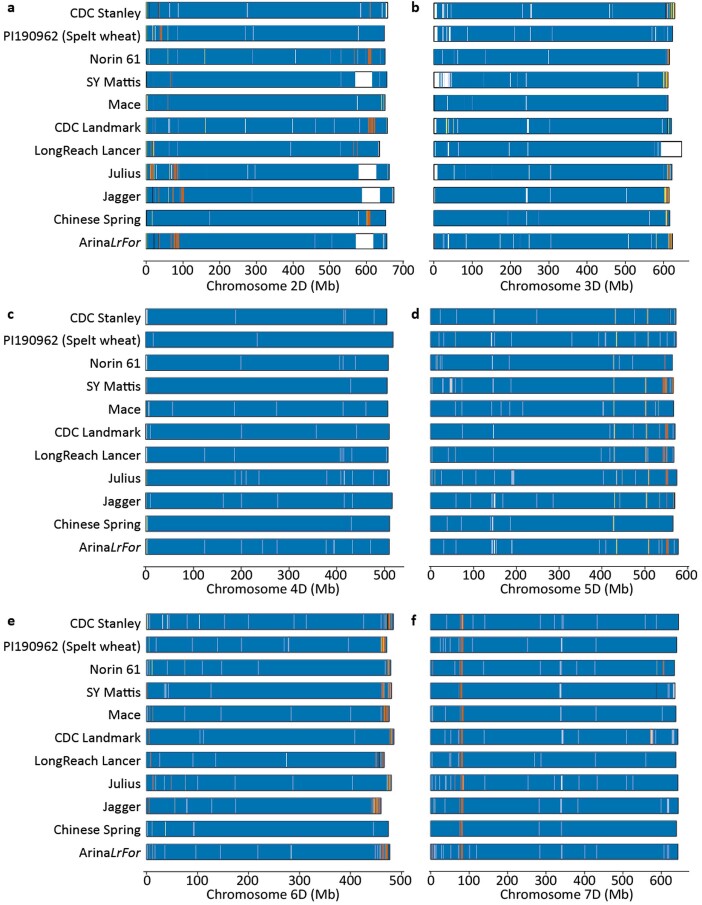
Consistent with the above population structure, we found that 64% of the Ae. tauschii k-mer space, obtained by summing up the percentages in the non-overlapping sections of the Venn diagram (Fig. 1e), is lineage specific. We used the lineage-specific k-mers to understand the origin of the wheat D subgenome by representing the D subgenomes of the available chromosome-scale wheat assemblies21 as 100-kb segments and assigning them to the Ae. tauschii lineage predominantly contributing lineage-specific k-mers to that segment (Extended Data Fig. 2). To account for recent alien introgressions in modern cultivars due to breeding, only those k-mers that were also present in the 28 hexaploid wheat landraces17 were used. The differential presence of L2 and L3 segments at multiple independent regions in these wheat lines (shown for chromosome 1D in Fig. 1f and chromosomes 2D–7D in Extended Data Fig. 3) suggests that at least two hybridization events gave rise to the extant wheat D subgenome (Fig. 1g) and that one of the D genome donors was of predominantly L2 origin, while the other was of predominantly L3 origin. The total L3 contribution across all the seven chromosomes ranges from 0.5% for Spelt, T. aestivum spp. spelta, to 1.9% for T. aestivum ssp. aestivum ArinaLrFor, with an average of 1.1% for all the 11 reference genomes (Extended Data Fig. 3).
Extended Data Fig. 2. Fraction of lineage-specific k-mers in non-overlapping 100 kb windows of Chromosome 1D for the 11 wheat genome assemblies.
For the nine modern cultivars21, only those k-mers were considered which were also present in the short-read sequences of 28 hexaploid wheat landraces17. Chromosomes are colored according to their Ae. tauschii lineage-specific origin as displayed in Fig. 1.
Extended Data Fig. 3. Lineage-specific origin of extant wheat D-subgenomes.
Chromosomes 2D-7D of 11 wheat cultivars colored according to their Ae. tauschii lineage-specific origin as in Fig. 1f.
Discovery of Ae. tauschii trait–genotype correlations
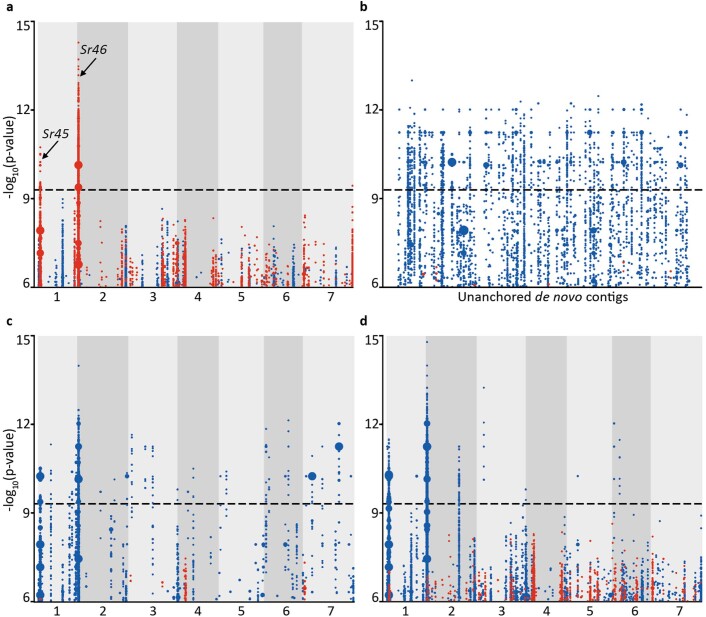
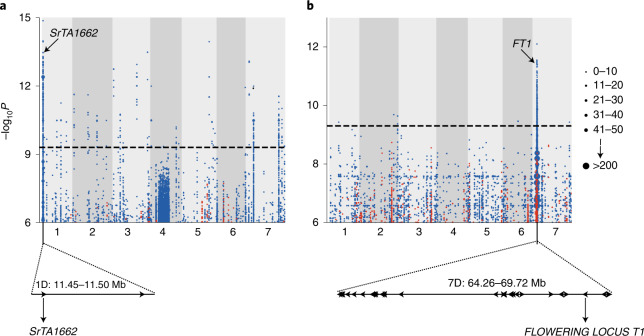
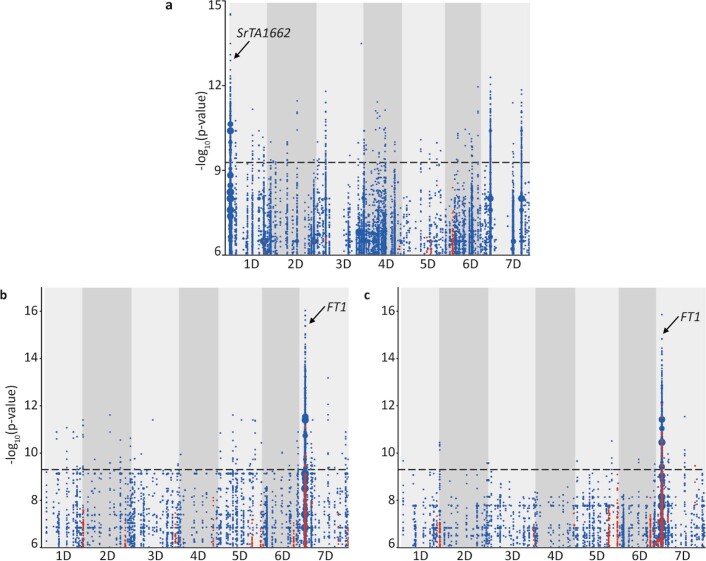
Identification of genes or haplotypes in Ae. tauschii underpinning useful variation would permit accelerated wheat improvement through wide crossing and marker-assisted selection or biotechnological approaches to introduce them into wheat. To identify this variation, we adapted our k-mer-based association mapping pipeline, previously developed for resistance gene families obtained using sequence capture22, to whole-genome shotgun data (Extended Data Fig. 4a). The significantly associated k-mers were not just directly mapped to the Ae. tauschii AL8/78 reference genome but were also mapped to the de novo assembly of a relevant accession, which was anchored to the reference genome. In theory, using a set of de novo assemblies (either reference or anchored to a reference) covering the species diversity in this manner would enable us to determine the genomic context of all the significant k-mers. To demonstrate the advantage of this approach, we generated a de novo assembly of accession TOWWC0112 (N50 = 196 kb; Supplementary Table 7), which carries two cloned stem rust resistance genes that could be used as controls, and then anchored this assembly to a reference genome14. This enabled identification of the cis-associated k-mers rather than those linked in repulsion to the corresponding region in the reference genome (Extended Data Fig. 4c,d). Note the improvement in the association signal with the improvement in the quality of de novo assembly; when the quality is poor (Extended Data Fig. 4c), some of the short scaffolds with the significant k-mers are anchored outside the true locus, but with the improved de novo assembly (Extended Data Fig. 4d), most of the scaffolds with the significant k-mers tend to concentrate around the true locus. We also determined that the sequencing coverage could be reduced from tenfold to fivefold with no appreciable loss of signal from the two control genes (Extended Data Fig. 5). To test our method further, we performed association mapping for resistance to additional stem rust isolates and flowering time. For stem rust, we identified a peak within the genetic linkage group of SrTA1662 (ref. 23) (Fig. 2a, Extended Data Fig. 6a and Supplementary Table 8). Annotation of the associated 50-kb linkage disequilibrium (LD) block revealed two genes, of which one encoded the nucleotide-binding and leucine-rich repeat (NLR) gene previously identified in our sequence capture association pipeline22 (Fig. 2a, Supplementary Tables 9 and 10 and Supplementary Note). We also recorded flowering time and found that it mapped to a broad peak of 5.46 Mb on chromosome arm 7DS containing 35 genes, including FLOWERING LOCUS T1 (Fig. 2b, Extended Data Fig. 6b,c and Supplementary Tables 8 and 10), a well-known regulator of flowering time in dicots and monocots, including wheat24–26.
Extended Data Fig. 4. Optimization of k-mer GWAS with the positive controls Sr45 and Sr46.
Blue/red dots on the y-axis represent one or more k-mers significantly associated with resistance/susceptibility, respectively, to Puccinia graminis f. sp. tritici isolate 04KEN156/04 (race TTKSK) across the diversity panel. Definition of association score, threshold, and dot size (which is proportional to the number of k-mers having the specific value on the y-axis), is as in Fig. 2. a, Significantly associated k-mers mapped to AL8/78 which is susceptible to TTKSK. The peaks marked Sr45 and Sr46 contain the non-functional (not providing resistance to TTKSK) alleles of Sr45 and Sr46. The x-axis represents the seven chromosomes of Ae. tauschii reference accession, AL8/78. Each dot column represents a 10 kb interval. b, Significantly associated k-mers mapped to the unordered de novo assembly of TOWWC0112 (N50 1.1 kb), an Ae. tauschii accession resistant to TTKSK. Each dot-column on the x-axis represents an unordered contig from the de novo assembly. c, Significantly associated k-mers mapped to the same assembly of TOWWC0112 as in (b), but now each contig has been ordered by anchoring to the reference genome of AL8/78 (x-axis). d, Association mapping with an improved TOWWC0112 assembly (N50 196 kb) anchored to the AL8/78 reference genome (x-axis).
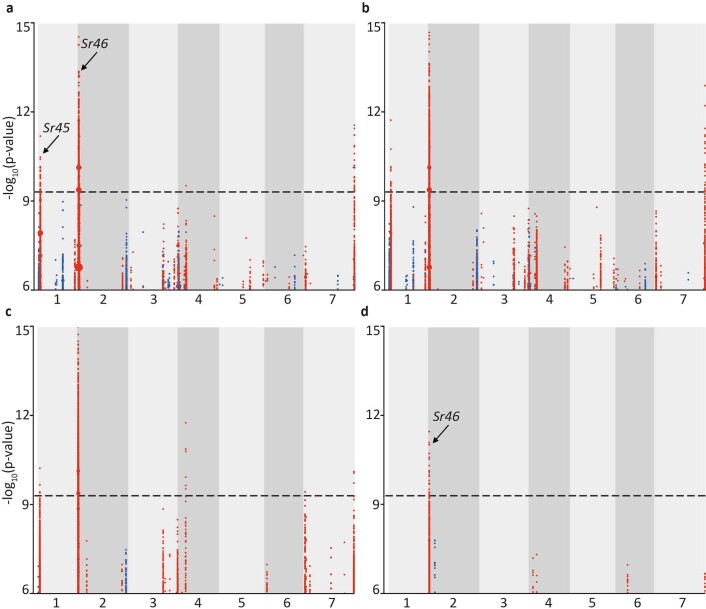
Extended Data Fig. 5. Impact of sequencing coverage on the power to detect the positive controls, Sr45 and Sr46.
Sequencing coverage was artificially reduced by sub-sampling the original 10-fold coverage sequencing reads and mapping associated k-mers to AL8/78. Definition of association score, threshold, and dot size is as in Fig. 2. a, Plot obtained with 7.5-fold coverage (compare with 10-fold coverage in Extended Data Fig. 7a). b, Plot obtained with 5-fold coverage. c, Plot obtained with 3-fold coverage. d, Plot obtained with 1-fold coverage.
Fig. 2. Genetic identification of candidate genes for stem rust resistance and flowering time by k-mer-based association mapping.
a, k-mers significantly associated with resistance to Puccinia graminis f. sp. tritici race QTHJC mapped to scaffolds of a de novo assembly of Ae. tauschii accession TOWWC0112 anchored to chromosomes 1 to 7 of the D subgenome of Chinese Spring51. Points on the y axis show k-mers significantly associated with resistance (blue) and susceptibility (red). b, k-mers significantly associated with flowering time mapped to Ae. tauschii reference genome AL8/78 with early (red) or late (blue) flowering time association relative to the population mean across the diversity panel. Candidate genes for both phenotypes are highlighted. Point size is proportional to the number of k-mers (see inset). The association score is defined as the –log10 of the P value obtained using the likelihood ratio test for nested models. The threshold of significant association scores is adjusted for multiple comparisons using the Bonferroni method.
Extended Data Fig. 6. k-mers significantly associated with FLOWERING LOCUS T1 and SrTA1662 identified by GWAS.
Definition of association score, threshold, and dot size is as in Fig. 2. a, Resistance to Puccinia graminis f. sp. tritici isolate UK-01 maps to the SrTA1662 locus. The peak indicated by the arrow contains the region delimited by the SrTA1662 LD block obtained with P. graminis f. sp. tritici race QTHJC. b, Biological replicate 2 and c, biological replicate 3 for flowering time identify FLOWERING LOCUS T1. The associated k-mers were mapped to the Aegilops tauschii AL8/78 reference genome where they define a peak similar to that in Fig. 2b.
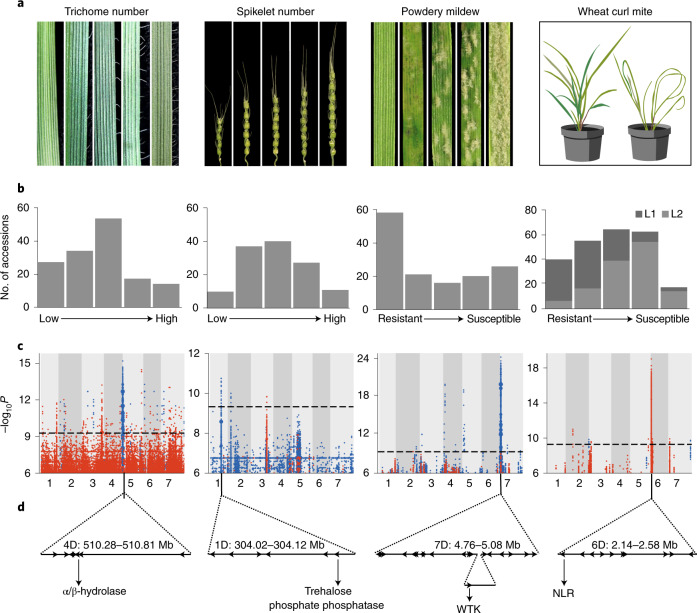
We next screened the Ae. tauschii panel for leaf trichomes (a biotic and abiotic resilience trait27,28), spikelet number per spike (a yield component), infection by Blumeria graminis f. sp. tritici (cause of powdery mildew) and resistance to the wheat curl mite Aceria tosichella (vector of wheat streak mosaic virus)29 (Supplementary Table 8). All four phenotypes presented continuous variation in the panel (Fig. 3a,b and Extended Data Fig. 7a). Mean trichome number along the leaf margin mapped to a 530-kb LD block on chromosome arm 4DL (Fig. 3c,d and Supplementary Table 10) within a 12.5-cM region previously defined by biparental linkage mapping30. The 530-kb interval contains seven genes, including an α/β-hydrolase, a gene class with increased transcript abundance in developing trichomes of Arabidopsis thaliana31. The number of spikelets per spike was associated with a discrete 100-kb peak on chromosome arm 1DL containing six genes (Fig. 3c,d and Supplementary Table 10). One of these encodes a trehalose-6-phosphate phosphatase that is homologous to RAMOSA3 and TPP4, known to control inflorescence branch number in maize32, and SISTER OF RAMOSA3 that influences spikelet fertility in barley33. Powdery mildew resistance mapped to a 320-kb LD block on chromosome arm 7DS containing 19 genes in the resistant haplotype, including a ~60-kb insertion with respect to the reference genome AL8/78 (Fig. 3c,d and Supplementary Table 10). No NLR immune receptor-encoding gene was detected; however, the insertion contains a wheat-tandem kinase (WTK), a gene class previously reported to confer resistance to wheat stripe rust (Yr15)34, stem rust (Rpg1 and Sr60)35,36 and powdery mildew (Pm24)37. Resistance to wheat curl mite mapped to a 440-kb LD block on chromosome arm 6DS within a region previously determined by biparental mapping38–40 (Fig. 3c,d, Supplementary Table 10 and Supplementary Note). The interval contained ten genes, including an NLR immune receptor, a gene class previously reported to confer arthropod resistance in melon and tomato41. These results highlight the ability of the panel, with its rapid LD decay (Extended Data Fig. 8) and k-mer-based association mapping combined with de novo genome assembly and annotation, to identify candidate genes, including those in insertions with respect to the reference genome, within discrete genomic regions for quantitative traits of agronomic value.
Fig. 3. Genome-wide association mapping in Ae. tauschii for morphology, disease and pest resistance traits.
a, Representation of the scale of phenotypic variation observed. b, Frequency distribution of the different phenotypic scales corresponding to a. L1 and L2 are shown in dark and light gray, respectively. c, k-mer–based association mapping to a de novo assembly of accession TOWWC0112 anchored to the AL8/78 reference genome (trichome number, spikelet number) or accession TOWWC0106 anchored to AL8/78 (response to powdery mildew) or directly mapped to AL8/78 (response to wheat curl mite). k-mer color coding, association score, threshold and dot size are as in Fig. 2. d, Identification of genes under the peak in the GWAS plot with promising candidate(s) indicated. The WTK gene resides within a 60-kb insertion relative to the AL8/78 reference genome.
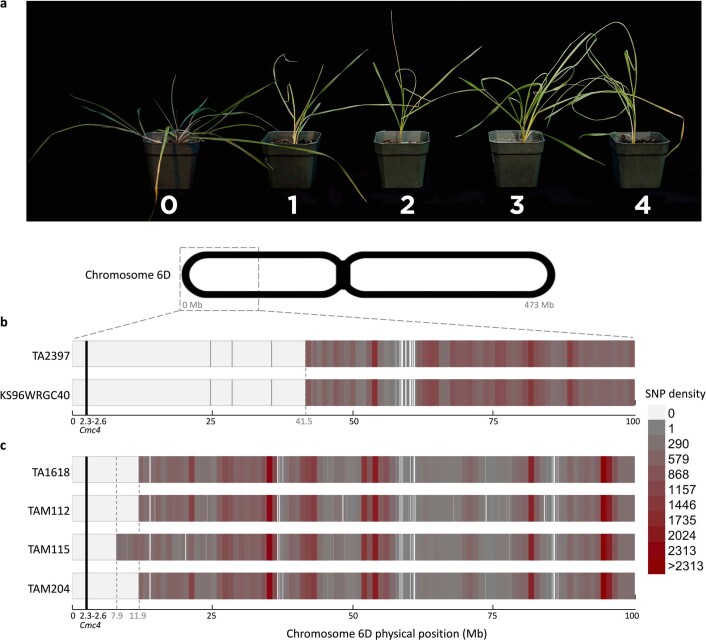
Extended Data Fig. 7. Wheat curl mite (WCM) symptoms in Aegilops tauschii and introgression of WCM resistance into wheat.
a, Phenotype scale used to characterize Ae. tauschii response to WCM infestation. Symptoms used were leaf trapping and leaf curliness. The visual scale ranged from 0 to 4, with 0 equivalent to no symptoms and 1 to 4 denoting increasing levels of curliness or trapped leaves indicative of susceptibility. b, Delineation of Ae. tauschii Lineage 1 accession TA2397 carrying wheat curl mite resistance introgressed into wheat line KS96WGRC40. The retained polymorphic markers were obtained by pairwise comparisons of the Ae. tauschii donor with the corresponding wheat line. KS96WGRC40 is the original line where Cmc4 was mapped. c, The donor of resistance in wheat line TAM 112 is the Lineage 2 accession TA1618. Wheat lines TAM 115 and TAM 204 are both resistant through TAM 112. The black vertical line indicates the Cmc4 position. The three grey dashed vertical lines denote the size of the introgressed fragments, 7.9 Mb, 11.9 Mb, and 41.5 Mb, in the wheat lines TAM 115, TAM 112 and TAM 204, and KS96WGRC40, respectively. SNP density is based on number of SNPs within 1 Mb bins.
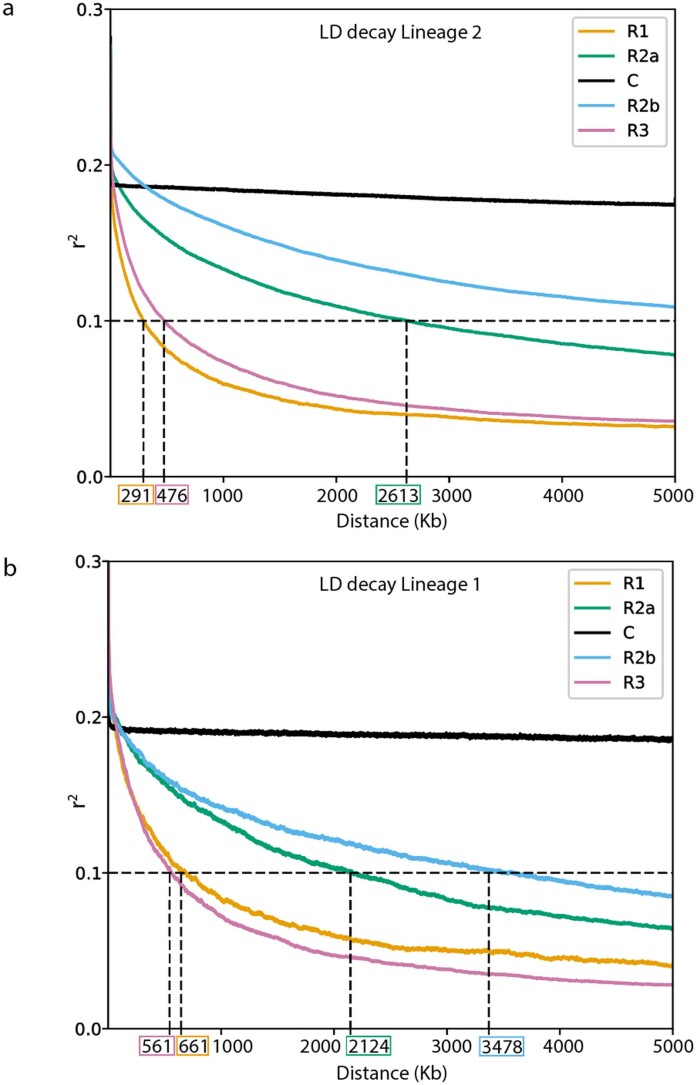
Extended Data Fig. 8. Genome-wide decay of linkage disequilibrium (LD) in Aegilops tauschii.
Genomic regions (R1, R2a, C, R2b, R3) in L2 (top) and L1 (bottom) were determined based on the distribution of the recombination rate in T. aestivum cv. Chinese Spring. The distance at which r2 for a region drops below 0.1 is highlighted.
L1 and L2 share regions of low genetic divergence
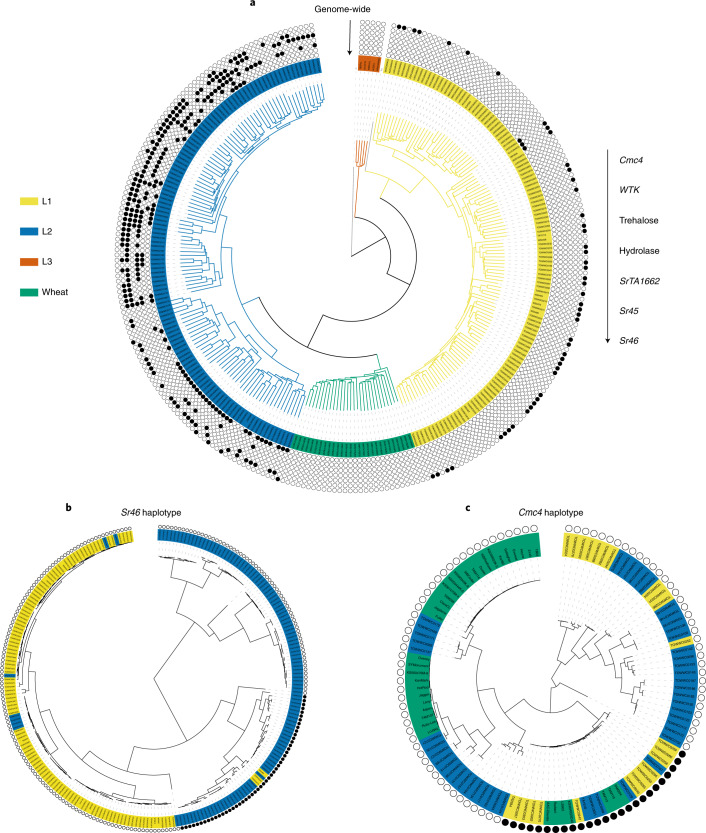
We investigated the population-wide distribution of the candidate genes controlling disease resistance and morphology identified by association mapping (Figs. 2 and 3) across a genome-wide phylogeny of Ae. tauschii and a worldwide collection of 28 wheat landraces17. The absence of the alleles promoting disease resistance, more spikelets and higher trichome density in the wheat landraces for the new candidate genes suggest that they were not incorporated into the initial gene flow into wheat (Fig. 4a). We next examined the distribution of these alleles between the three lineages of Ae. tauschii. The Cmc4 gene candidate for resistance to wheat curl mite was largely confined to L1, whereas the allele variants promoting higher trichome density, spikelet number and resistance to wheat stem rust and powdery mildew were largely confined to L2 (Fig. 4a). Exceptions included three occurrences of the Sr46 gene in L1 and five occurrences of the candidate Cmc4 gene in L2. To investigate whether this was due to a common genetic origin or convergent evolution, we generated phylogenies based on the SNPs within the respective 200-kb and 440-kb Sr46 and Cmc4 LD blocks. This showed that all functional haplotypes clustered together irrespective of genome-wide lineage assortment, indicative of a common genetic origin and not convergent evolution (Fig. 4b,c, Supplementary Table 11 and Supplementary Note).
Fig. 4. Comparison of genome-wide phylogeny with phylogenies of haplotypes surrounding specific genes.
a, Genome-wide k-mer-based phylogeny of Ae. tauschii and hexaploid wheat landraces with designation of the presence of candidate and cloned genes/alleles for disease and pest resistance and morphological traits. The presence and absence of allele-specific polymorphisms is indicated by circles filled with black or white, respectively, for all but outgroup and RIL (gray edges). b, Phylogeny of Ae. tauschii L1 and L2 accessions based on SNPs restricted to the 200-kb region surrounding Sr46. c, Phylogeny based on SNPs of the 440-kb region in LD with Cmc4. Only the most resistant and susceptible Ae. tauschii accessions were included, along with resistant and susceptible modern elite wheat cultivars (different from the landraces shown in a).
After domestication delivery of Ae. tauschii genes into wheat
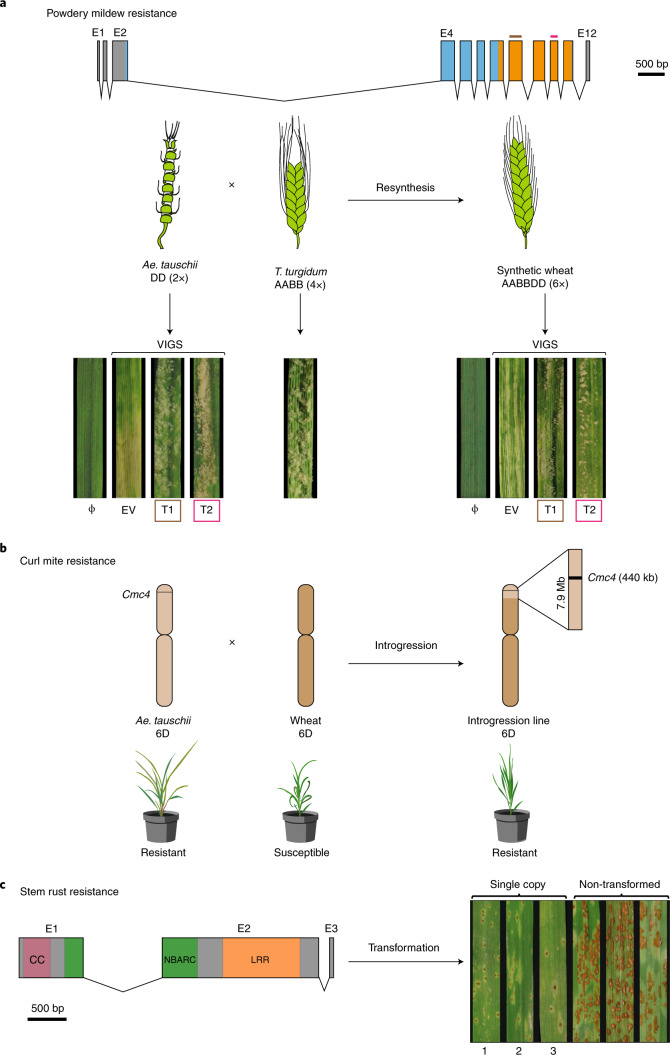
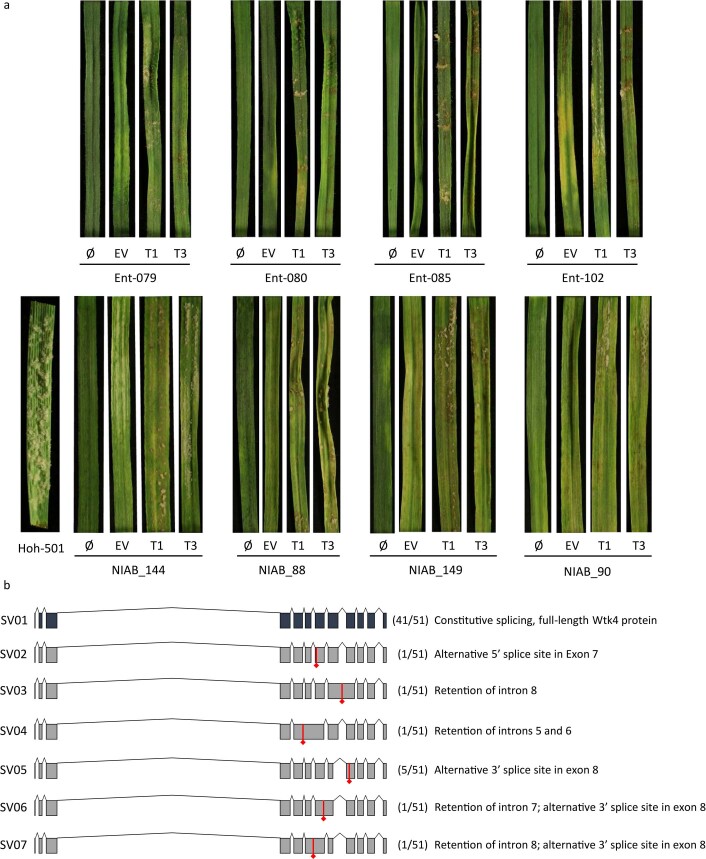
The ability to precisely identify Ae. tauschii haplotypes and candidate genes for target traits provides an opportunity for accelerating their introduction into cultivated wheat. We selected 32 non-redundant and genetically diverse Ae. tauschii accessions, which capture 70% of the genetic diversity across all lineages, and crossed them to tetraploid durum wheat (T. turgidum var. durum; AABB) to generate independent synthetic hexaploid wheat lines (Fig. 5, Supplementary Table 12 and Supplementary Note). From this ‘library’, we selected four synthetic lines with the powdery mildew WTK candidate resistance gene. These synthetics as well as their respective Ae. tauschii donors were resistant to powdery mildew, while the durum line was susceptible (Fig. 6a and Extended Data Fig. 9a). Annotation of WTK identified seven alternative transcripts, of which only one, accounting for ~80% of the transcripts, leads to a complete 2,160-base pair (bp) 12-exon open reading frame (Fig. 6a, Extended Data Fig. 9b, Supplementary Tables 13 and 14 and Supplementary Note). Next, we targeted two exons with very low homology to other genes for virus-induced gene silencing (VIGS; Supplementary Note). WTK-containing Ae. tauschii and synthetics inoculated with the WTK-VIGS constructs became susceptible to powdery mildew, whereas empty vector-inoculated plants remained resistant (Fig. 6a and Extended Data Fig. 9a). This supports the conclusion that WTK, hereafter designated WTK4, is required for powdery mildew resistance and remains effective in synthetic hexaploids. Thus, these synthetic lines can serve as prebreeding stocks for introduction of the trait into elite wheat.
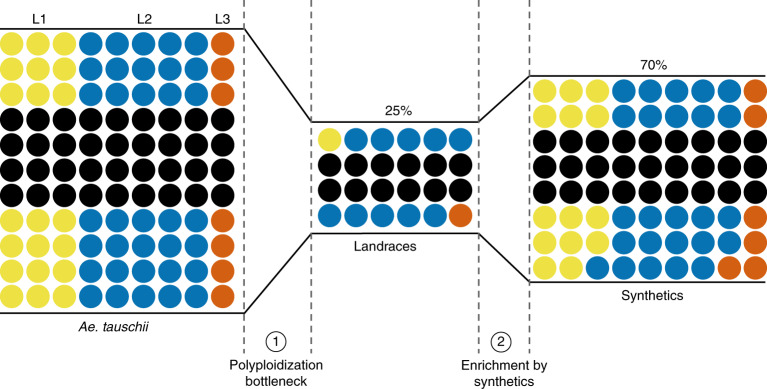
Fig. 5. Restricted gene flow from Ae. tauschii to wheat and the capture of Ae. tauschii diversity in a panel of synthetic hexaploid wheats.
Genetic diversity private to Ae. tauschii L1, L2 and L3 is color coded blue, red and orange, respectively, whereas black dots represent k-mer sequences (51-mers) common to more than one lineage. The number of dots is proportional to the number of k-mers. The polyploidization bottleneck (1) incorporated 25% of the variant k-mers found in Ae. tauschii into wheat landraces. The addition of 32 synthetic hexaploid wheats (2) restored this to 70%.
Fig. 6. Functional transfer of disease and pest resistance from Ae. tauschii into wheat.
a, WTK4 gene structure represented by rectangles (exons E1 to E12) joined by lines (introns). Kinase domains are shown in blue and orange. Exons used for designing VIGS target 1 (T1) and target 2 (T2) are shown in brown and red, respectively. Below, schematic of the cross between Ae. tauschii accession Ent-079 (contains WTK4) and T. turgidum durum line Hoh-501 (lacks WTK4) that generated the synthetic hexaploid wheat line NIAB-144. Leaf segments from plants subjected to VIGS with empty vector (EV), T1, T2 or non-virus control (Φ) and super-infected with B. graminis f. sp. tritici isolate Bgt96224 avirulent to WTK4. b, Introgression of the Cmc4 locus from Ae. tauschii accession TA1618 into wheat. The 440-kb Cmc4 LD block (black) resides within a 7.9-Mb introgressed segment on chromosome 6D (light brown) in wheat cultivar TAM 115. Below, drawings of wheat curl mite-induced phenotypes. c, Structure of the SrTA1662 candidate gene. The predicted 970-amino acid protein has domains with homology to coiled-coil (CC), nucleotide-binding (NB-ARC) and leucine-rich repeats (LRR). Right, transformation with an SrTA1662 genomic construct into cv. Fielder and response to P. graminis f. sp. tritici isolate UK-01 (avirulent to SrTA1662) of single-copy hemizygous transformants (1, DPRM0059; 2, DPRM0051; 3, DPRM0071) and non-transgenic controls.
Extended Data Fig. 9. Analysis of powdery mildew resistance in Aegilops tauschii and durum donors and their derived synthetic hexaploid wheat lines.
a, Top, disease reactions to Blumeria graminis f. sp. tritici Bgt96224 are displayed for the Ae. tauchii accessions Ent-079, Ent-080, Ent-085 and Ent-102. Bottom, disease reactions to Bgt96224 are displayed for the corresponding synthetic hexaploid lines (NIAB_144, derived from Ent-079; NIAB_088 derived from Ent-080; NIAB_149 derived from Ent-085; and NIAB_090 derived from Ent-102) using the tetraploid durum wheat donor line Hoh-501, which is highly susceptible to Bgt96224. Each Ae. tauschii and its corresponding synthetic hexaploid line was not inoculated with BSMV (Ø) or with a BSMV construct as empty vector (EV) or targeting for silencing the WTK4 exon 8 (target 1, T1) or exon 10 (target 2, T2), respectively, and then super-infected with Bgt96224. b, Alternative splicing of WTK4. Alternative splicing variants (SV1-7) revealed by sequencing 51 WTK4 cDNAs. At the top, in black, is shown the splicing variant SV01, which encodes the complete WTK4 protein. Below SV01, six aberrant alternative splicing variants (SV02 to SV07) are shown in in grey. The number of clones identified for each SV is identified in parenthesis. Diamond arrowed red lines point to the first stops codons at the protein level.
Developing wheat cultivars improved with traits from Ae. tauschii can also be achieved by direct crossing between the diploid and hexaploid species10. The wheat curl mite resistance gene Cmc4 was originally transferred by crossing of Ae. tauschii accession TA2397 (L1) into wheat42,43 and genetically localized to chromosome 6D in agreement with our association mapping38–40. Given the common resistant haplotype of Cmc4 in L1 and L2 (Fig. 4), we hypothesized that Cmc4 is the same as a gene originating from L2 accession TA1618, which was introgressed at the same locus into wheat cv. TAM 112 via a synthetic wheat39,43. Consistent with this hypothesis, we observed the same haplotype at the wheat curl mite resistance locus across all derived resistant hexaploid wheat lines and in the Ae. tauschii donors of Cmc4 and CmcTAM112 (Fig. 4c). We delimited the length of the introgressed Ae. tauschii wheat curl mite fragments by comparing SNP data for resistant wheat lines and the corresponding Ae. tauschii donors. The TA2397 (L1) introgression spanned 41.5 Mb, whereas the TA1618 (L2) introgression was reduced to 7.9 Mb in wheat cv. TAM 115 (Fig. 6b, Extended Data Fig. 7b,c and Supplementary Note).
As an alternative to conventional breeding, we targeted the SrTA1662 candidate stem rust resistance gene (Fig. 2d) for introduction into wheat by direct transformation. We cloned a 10,541-bp genomic fragment encompassing the complete SrTA1662 transcribed region as well as >3 kb of 3′- and 5′-untranslated region (UTR) putative regulatory sequences; this was sufficient to confer full race-specific stem rust resistance in transgenic wheat (Fig. 6c, Extended Data Fig. 10, Supplementary Table 15 and Supplementary Note).
Extended Data Fig. 10. The Aegilops tauschii stem rust resistance gene SrTA1662 maintains race specificity as a transgene in wheat.
The SrTA1662 gene was transformed into the stem rust susceptible wheat cultivar Fielder. Shown are T2 generation lines selected to be homozygous for the transgene or to be non-transgenic segregants. a, Inoculation with isolate IT200a/18 (race TKKTF). b, Inoculation with isolate IT16a/18 (race TTRTF). c, Inoculation with isolate ET11a/18 (TKTTF). d, Inoculation with isolate KE184a/18 (Kenya). Numbering refers to 1 = DPRM0050 (null of DPRM0051), 2 = DPRM0051, 3 = DPRM0059, 4 = DPRM0062 (null of DPRM0059), 5 = DPRM0071, 6 = DPRM0072 (= null of DPRM0071) (see Supplementary Table E).
Discussion
The origin of hexaploid bread wheat has long been the subject of intense scrutiny. Archeological and genetic evidence suggests that diploid and tetraploid wheats were first cultivated 10,000 years ago in the Fertile Crescent (Fig. 1a)5,6. The expansion of tetraploid wheat cultivation northeast into Caspian Iran and towards the Caucasus region resulted in sympatry with Ae. tauschii and the emergence of hexaploid bread wheat6. Ae tauschii displays a high level of genetic differentiation among local populations, and genetic marker analysis suggests that the wheat D subgenome donor was recruited from an L2 population of Ae. tauschii in the southwestern coastal area of the Caspian Sea8. However, not all the diversity within the wheat D subgenome can be explained by a single hybridization event6,44,45. Our population genomic analysis revealed the existence of a third lineage of Ae. tauschii, L3, which also contributed to the extant wheat genome. For example, a glutenin allele required for superior dough quality was recently found to be of L3 origin46. L3 accessions are restricted to present-day Georgia and may represent a relict population from a glacial refugium as observed in Arabidopsis47. We observed genomic signatures specific to L2 and L3 in hexaploid wheat supporting the multiple hybridization hypothesis (Fig. 1g).
The creation of hexaploid bread wheat, while giving rise to a crop better adapted to a wider range of environments and end uses1, came at the cost of a pronounced genetic bottleneck7. Our analysis suggested that only 25% of the genetic diversity of Ae. tauschii contributed to the initial gene flow into hexaploid wheat (Fig. 5). To explore this diversity, we performed association mapping and discovered new gene candidates for disease and pest resistance and agromorphological traits underpinning abiotic stress tolerance and yield, exemplifying the potential of Ae. tauschii for wheat improvement (Fig. 6). We obtained discrete LD blocks of 50 to 520 kb, with the exception of flowering time, which resulted in a broad LD block of 5.5 Mb around the FT1 locus (Figs. 2 and 3). The low degree of historical recombination around FT1 is likely imposed by the reduced probability of intraspecies hybridization between populations carrying alleles promoting different flowering times. In contrast to the discrete mostly submegabase mapping intervals we obtained by association mapping with k-mer-based marker saturation, conventional biparental mapping studies on the D subgenome resulted in large intervals with a median of 10 Mb (Supplementary Table 16 and Supplementary Note).
In polyploid wheat, recessive variants are not readily observed; hence, genetics and genomics in wheat have mostly focused on rare dominant or semidominant variants48. Reflecting this, of 69 genes cloned in polyploid wheat by forward genetics, at least 62 have dominant or semidominant modes of action (Supplementary Table 17). This constraint is removed in Ae. tauschii by virtue of being diploid, which along with its rapid LD decay makes it an ideal platform for gene discovery by association mapping. Genes and allelic variants discovered in Ae. tauschii can subsequently be studied in wheat by generating transgenics or mutants or by using synthetic wheats. The first synthetic wheats were created in the middle of the last century by E. Sears and E. McFadden49, and since the late 1980s, synthetic wheats have been used extensively in breeding, for example, by the International Maize and Wheat Improvement Center (CIMMYT)50. However, without the use of high-resolution genomic information, the use of synthetic wheats was not precisely tracked. As illustrated here for wheat curl mite resistance, this led to the same gene being introgressed from two different Ae. tauschii lineages. Our study highlights how synthetic wheats can now be explored in a more directed manner. Our public library of synthetic wheats, which captures 70% of the diversity present across all three Ae. tauschii lineages, allows immediate trait assessment in a hexaploid background. The trait-associated haplotypes can be used to design molecular markers to precisely track the desired gene in a breeding program. In conclusion, our study provides an end-to-end pipeline for rapid and systematic exploration of the Ae. tauschii gene pool for improving modern bread wheat.
Methods
SNP calling relative to the AL8/78 reference genome
Following whole-genome shotgun sequencing, we called SNPs across the panel relative to the Ae. tauschii AL8/78 reference genome assembly. The 306 Ae. tauschii samples were aligned to the Ae. tauschii AL8/78 reference genome14 using HISAT2 default parameters52. All alignment BAM files were sorted and duplicates removed using SAMtools (v.1.9 ‘view’, ‘sort’ and ‘rmdup’ sub-commands). All BAM files were fed into the variant call pipeline using BCFtools (-q 20 -a DP,DV | call -mv -f GQ) with parallelization ‘-r $region’ of 4-Mb windows for a total of 1,010 intervals (regions). The raw variant files were filtered or recalled using a published AWK script based on DP/DV ratios (the ratio of non-reference read depth and total read depth) with default parameters (https://bitbucket.org/ipk_dg_public/vcf_filtering/src/master/) except minPresent parameter (we used minPresent = 0.8 and minPresent = 0.1). The minPresent=0.8 dataset was used for redundancy analysis. The minPresent = 0.1 and minPresent = 0.8 were both used for genome-wide association study (GWAS) analysis. The resulting matrix (104 million SNPs for minPresent = 0.1 concatenated using BCFtools v.1.11) were uploaded to Zenodo.
Quality control for redundancy and residual heterogeneity
A total of 100,900 (100 every 4-Mb window) SNPs were randomly chosen to compute pairwise identity by state among all samples for a total of 46,665 comparisons using custom R and AWK scripts (https://github.com/wheatgenetics/owwc). For every sample pair, a percent identity greater than 99.5% was deemed redundant based on the histogram distribution of all identity by state values (Extended Data Fig. 1c). This analysis confirmed the results of the KASP analysis conducted on the L2 accessions (Extended Data Fig. 1b and Supplementary Note).
For each accession (except TOWWC0193, which is related to the reference genome AL8/78), the fraction of heterozygous SNPs in the total number of biallelic SNPs was computed. Based on the distribution of these values (Extended Data Fig. 1d and Supplementary Table 3), 0.1 was deemed to indicate a low degree of residual heterogeneity. BW_26042, with a value of 0.17, was found to be the only outlier exceeding this threshold.
Based on these quality control analyses, a non-redundant and genetically stable set of 242 accessions was retained for further analysis. The redundant pairs, along with the different similarity scores, are given in Supplementary Table 4, and the set of 242 non-redundant accessions is provided in Supplementary Table 5.
De novo assembly from whole-genome shotgun short-read data
The primary sequence data of non-redundant accessions were trimmed using Trimmomatic v.0.238 and de novo assembled with the MEGAHIT v.1.1.3 assembler using default parameters53. The output of the assembler for each accession was a FASTA file containing all the contig sequences. The assemblies are available from Zenodo.
Genome assembly of Ae. tauschii accession TOWWC0112
TOWWC0112 (line BW_01111) was assembled by combining paired-end and mate-pair sequencing reads using TRITEX54, an open-source computational workflow. A PCR-free 250-bp paired-end library with an insert size range of 400–500 bp was sequenced to a coverage of ~70. Mate-pair libraries MP3 and MP6, with insert size ranges of 2–4 kb and 5–7 kb, respectively, were sequenced to a coverage of ~20. The assembly generated had an N50 of 196 kb (Supplementary Table 7). The assembly is available from the electronic Data Archive Library (e!DAL).
Genome assembly of Ae. tauschii accession TOWWC0106
Accession TOWWC0106 (line BW_01105) was sequenced on a PacBio Sequel II platform (Pacific Biosciences) with single-molecule, real-time chemistry and on the Illumina platform. For single-molecule, real-time library preparation, ~7 μg of high-quality genomic DNA was fragmented to a 20-kb target size and assessed on an Agilent 2100 Bioanalyzer55. The sheared DNA was end repaired, ligated to blunt-end adaptors and size selected. The libraries were sequenced by Berry Genomics. A standard Illumina protocol was followed to make libraries for PCR-free paired-end genome sequencing with ~1 μg of genomic DNA that was fragmented and size selected (350 bp) by agarose gel electrophoresis. The size-selected DNA fragments were end blunted, provided with an A-base overhang and then ligated to sequencing adapters. A total of 251.8 Gb of high-quality 150 paired-end PCR-free reads were generated and sequenced on the NovaSeq sequencing platform.
A set of 11.35 million PacBio long reads (289.6 Gb), representing a ~66-fold genome coverage, was assembled using the CANU pipeline with default parameters56. The assembled contigs were polished with 251.8 Gb of PCR-free reads using Pilon default parameters57. The resulting assembly had an N50 of 1.5 Mb (Supplementary Table 7). The assembly is available from e!DAL.
Phenotyping the Ae. tauschii diversity panel and synthetic hexaploid wheat lines
Wheat stem rust
The wheat stem rust phenotypes with P. graminis f. sp. tritici isolate 04KEN156/04, race TTKSK, and isolate 75ND717C, race QTHJC, were obtained from Arora et al.22. As part of this study, we also phenotyped the same Ae. tauschii lines with isolate UK-01 (race TKTTF)58 (Supplementary Table 8) using the same procedures as described in ref. 59. UK-01 was obtained from Limagrain.
Trichomes
For counting trichomes and measuring flowering time in Ae. tauschii, 50 L1 accessions and 150 L2 accessions were pregerminated at ~4 °C in Petri dishes on wet filter paper for 2 d in the dark. They were transferred to room temperature (~20 °C) and daylight for 4 d. Three seedlings of each genotype were transplanted on 22 January 2019 into 96-cell trays filled with a mixture of peat and sand and then grown under natural vernalization in a glasshouse with no additional light source or heating at the John Innes Centre, Norwich, UK. Trichome phenotyping was conducted 1 month later. Close-up photographs of the second leaf from seedlings at the three-leaf stage were taken and visualized in ImageJ, and trichomes were counted along one side of a 20-mm leaf margin in the mid-leaf region. Measurements were taken from three biological replicates (Supplementary Table 8).
Flowering time, biological replicate 1
Three seedlings used for trichome phenotyping (see above) were transferred on 25 March into individual 2 l pots filled with cereal mix soil60. Flowering time was recorded when the first five spikes were three-fourths emerged from the flag leaf sheath, equivalent to a 55 on the Zadoks growth scale61 (Supplementary Table 8).
Flowering time, biological replicates 2 and 3
A total of 147 Ae. tauschii L2 accessions were grown in the winters of 2018/2019 and 2019/2020 in the greenhouse at the Department of Agrobiotechnology, University of Natural Resources and Life Sciences, Vienna, Austria. Seeds of each accession were sown in multitrays in a mixture of heat-sterilized compost and sand and stratified for 1 week before germination at 4 °C with a 12 h day/12 h night light regimen. Thereafter, the seeds were germinated at 22 °C and at the one-leaf stage vernalized for 11 weeks. Five seedlings per accession were transplanted to 4 l pots (18 cm in diameter, 21 cm in height) filled with a mixture of heat-sterilized compost, peat, sand and rock flour. In the winter of 2018/2019, one pot (= one replicate) per accession was planted, whereas in 2019/2020, two pots (= two replicates) were planted. The pots were randomly arranged in the greenhouse and maintained at a temperature of 14/10 °C day/night with a 12 h photoperiod for the first 40 d. At spike emergence, the temperature was increased to 22/18 °C day/night with a 16 h photoperiod at 15,000 lx. At least ten spikes per pot were evaluated for beginning of anthesis, taken as 60 on the Zadoks growth scale61, resulting in a minimum of 30 assessed spikes per accession. Flowering time was recorded every second day.
The flowering date was analyzed using a linear mixed model, which considered subsampling of individual spikes within each pot as follows:
Here, denotes the flowering date observation of the individual spikes, μ is the grand mean and gi is the genetic effect of the ith accession. The environment effect, ej, is defined as the effect of the jth year, and the genotype-by-environment interaction is described by geij. rjk is the effect of the kth replication within the jth year, pijk is the effect of the ith pot within the kth replication and jth year and εijkl is the residual term. Analysis was performed with R v.3.5.1 (ref. 62) using the package sommer63 with all effects considered as random except gi, which was modeled as a fixed effect to obtain the best linear unbiased estimates (Supplementary Table 8).
Spikelets per spike
For Ae. tauschii spikelet phenotyping, 151 accessions from L2 were vernalized at a constant temperature of 4 °C for 8 weeks in a growth chamber (Conviron). After vernalization, the accessions were transplanted to 3.8 l pots in potting mix (peat moss and vermiculite) and placed in a temperature-controlled Conviron growth chamber with diurnal temperatures gradually changing from 12 °C at 02:00 to 17 °C at 14:00 with a 16 h photoperiod and 80% relative humidity. To represent biological replication, each accession was grown in two pots, and each pot contained two plants. At the transplanting stage, 10 g of a slow-release N-P-K fertilizer was added to each pot. At physiological maturity, 5–15 main stem/tiller spikes per replication (that is, per pot) were collected, and the number of immature as well as mature spikelets were counted. Any obvious weak heads from late-growing tillers were not included. Least square means for each replication were used for k-mer-based association genetic analysis (Supplementary Table 8).
Powdery mildew
Resistance to B. graminis f. sp. tritici was assessed with Bgt96224, a highly avirulent isolate from Switzerland64, using inoculation procedures previously described65. Disease levels were assessed 7–9 d after inoculation as one of five classes of host reactions: resistance (R; 0–10% of leaf area covered), intermediate resistance (IR; 10–25% of leaf area covered), intermediate (I; 25–50% of leaf area covered), intermediate susceptible (IS; 50–75% of leaf area covered) and susceptible (S; >75% of leaf area covered) (Supplementary Table 8).
Wheat curl mite
A total of 210 Ae. tauschii accessions, 102 from L1 and 108 from L2 (Supplementary Table 8), were screened for their response against wheat curl mite. Aceria tosichella (Keifer) biotype 1 colonies (courtesy of M. Smith, Department of Entomology, Kansas State University) were mass reared under controlled conditions at 24 °C in a 14 h light/10 h dark cycle using the susceptible wheat cv. Jagger. The biotype 1 colony was previously reported as avirulent toward all Cmc resistance genes38,66–68. A single colony consisted of an individual pot with ~50 seedlings, and 20 colonies were grown to have sufficient mite inoculum to conduct the phenotyping. Colonies were placed inside 45 cm × 45 cm × 75 cm mite-proof cages covered with a 36-µm mesh screen (ELKO Filtering Co.) to avoid contamination until being used to infest the Ae. tauschii accessions. Accessions from L1 and L2 were evaluated in independent experiments. Six plants per accession were individually grown in 5 cm × 5 cm × 5 cm pots under controlled conditions at 24 °C in a 14 h light/10 h dark cycle. Pots were arranged randomly in an incomplete block design where the block was the tray fitting 32 pots (8 rows and 4 columns). A single pot with the susceptible check cv. Jagger was included in each tray. Accessions were infested at the two-leaf stage, with mite colonies collected from infested pieces of leaves from the susceptible plants and spread as straw over the pots. Plants were evaluated individually 10–14 d after infestation. Wheat curl mite damage was assessed as curled or trapped leaves using a visual scale from 0 to 4, with 0 indicating no symptoms and 1 to 4 indicating increasing levels of curliness or trapped leaves (Extended Data Fig. 7a).
The adjusted mean or best linear unbiased estimator for each accession was calculated with the ‘lme4’ R package69 using the following linear regression model:
Here, yijkl is the phenotypic value, µ is the overall mean, Gi is the fixed effect of the ith accession (genotype), Tj is the random effect of the jth tray assumed as independent and identically distributed (iid) , Rk(j) is the random effect of the kth row nested within the jth tray assumed distributed as iid , Cl(j) is the random effect of the lth column nested within the jth tray assumed distributed as iid and eijkl is the residual error distributed as iid eijkl ≈ N(0, ).
k-mer presence/absence matrix
k-mers (k = 51) were counted in trimmed raw data per accession using Jellyfish70 (version 2.2.6 or above). k-mers with a count of less than two in an accession were discarded immediately. k-mer counts from all accessions were integrated to create a presence/absence matrix with one row per k-mer and one column per accession. The entries were reduced to 1 (presence) and 0 (absence). k-mers occurring in less than two accessions or in all but one accession were removed during the construction of the matrix. Programs to process the data were implemented in Python and are published at https://github.com/wheatgenetics/owwc. The k-mer matrix is available from e!DAL.
Phylogenetic tree construction
A random set of 100,000 k-mers was extracted from the k-mer matrix to build an unweighted pair group method with arithmetic mean (UPGMA) tree with 100 bootstraps using the Bio.Phylo module from the Biopython v.1.77 (http://biopython.org) package. Further, a Python script was used to generate an iTOL-compatible (https://itol.embl.de/) tree for rendering and annotation. The Python script and the random set of 100,000 k-mers used for generating the tree are available at https://github.com/wheatgenetics/owwc.
Bayesian cluster analysis using STRUCTURE
Bayesian clustering implemented in STRUCTURE19 version 2.3.4 was used to investigate the number of distinct lineages of Ae. tauschii. To control the bias due to the highly unbalanced proportion of the three groups20 in the non-redundant sequenced accessions (119 accessions of L2, 118 accessions of L1 and 5 accessions of putative L3), 10 accessions each of L1 and L2 were randomly selected for each STRUCTURE run along with the 5 accessions of the putative L3 and the control L1–L2 RIL. The random selection of 10 accessions each of L1 and L2 was performed 11 times without replacement, thus covering a total of 110 accessions each of L1 and L2 over 11 STRUCTURE runs (Supplementary Table 6). STRUCTURE simulations were run using a random set of 100,000 k-mers with a burn-in length of 100,000 iterations followed by 150,000 Markov chain Monte Carlo iterations for five replicates each of K ranging from 1 to 6. STRUCTURE output was uploaded to Structure Harvester (http://taylor0.biology.ucla.edu/structureHarvester; Web v.0.6.94 July 2014; Plot vA.1 November 2012; Core vA.2 July 2014)71 to generate a ΔK plot for each run. For each STRUCTURE run, a clear peak was observed at K = 3 in the ΔK plot, suggesting that there are three distinct lineages of Ae. tauschii19,71. STRUCTURE results were processed and plotted using CLUMPAK72,73 (http://clumpak.tau.ac.il/; beta version accessed on 11 May 2021) to maintain the label collinearity for multiple replicates of each K.
Determination of genome-wide fixation index
Genome-wide pairwise fixation index (FST) between the three Ae. tauschii lineages was computed using VCFtools74 v.0.1.15 with the parameters ‘–fst-window-size’ and ‘–fst-window-step’ set to 1,000,000 and 100,000, respectively.
Admixture analysis of the wheat D subgenome
To assign segments of the wheat D subgenome to Ae. tauschii lineages for each of the 11 chromosome-scale wheat assemblies21, we considered only those k-mers as usable that were present at a single locus in the D subgenome. Furthermore, out of these k-mers, for nine modern cultivars, only those k-mers were considered usable that were also present in the short-read sequences from 28 hexaploid wheat landraces17. For the assembled wheat genomes, each chromosome of the D subgenome was divided into 100-kb non-overlapping segments. A 100-kb segment was assigned to Ae. tauschii if at least 20% of 100,000 k-mers within that segment were usable as well as present in at least one non-redundant Ae. tauschii accession. A segment assigned to Ae. tauschii was further assigned to one of the three lineages (L1, L2 and L3) if the count of usable k-mers specific to that lineage exceeded the count of those specific to the other lineages by at least 0.01% of 100,000 k-mers. Scripts to determine the counts of lineage-specific and total Ae. tauschii k-mers per 100-kb segment are published at https://github.com/wheatgenetics/owwc, and the output files obtained for 11 wheat assemblies were collated in an Excel file that is available from Zenodo.
Anchoring of a de novo assembly to a reference genome
The contigs of a de novo assembly were ordered along a chromosome-level reference genome using minimap2 (ref. 75) (version 2.14 or above), and the genomic coordinates of their longest hits were assigned.
Correlation prefiltering
For each of the assembly k-mers (including those present at multiple loci), if also present in the precalculated presence/absence matrix, Pearson’s correlation between the vector of that k-mer’s presence/absence and the vector of the phenotype scores was calculated. Only those k-mers for which the absolute value of correlation obtained was higher than a threshold (0.2 by default) were retained to reduce the computational burden of association mapping using linear regression.
Linear regression model accounting for population structure
To each filtered k-mer from the previous step, a P value was assigned using linear regression with a number of leading PCA dimensions as covariates to control for the population structure. PCA was computed using the aforementioned set of 100,000 k-mers. The exact number of leading PCA dimensions was chosen heuristically. Too high a number might overcorrect for population structure, while too few might undercorrect. In the context of this study, three dimensions were found to represent a good trade-off.
Approximate Bonferroni threshold computation
For each phenotype in this study, the total number of k-mers used in association mapping varied between 3,000,000,000 and 5,000,000,000. In general, if the k-mer size is 51, a SNP or any other structural variant would give rise to at least 51 k-mer variants. Therefore, the total number of tested k-mer variants should be divided by 51 to get the effective number of variants to adjust the P value threshold for multiple testing. Assuming a P value threshold of 0.05, a Bonferroni-adjusted –log P value threshold between 9.1 and 9.3 was obtained for each phenotype. The more stringent cutoff of 9.3 was chosen throughout this study.
Generating association mapping plots
Association mapping plots were generated using Python. For a chromosome-level reference assembly, each integer on the x axis corresponds to a 10-kb genomic block starting from that position. For an anchored assembly, each integer on the x axis represents the scaffold that is anchored starting from that position. Dots on the plot represent the –log P values of the filtered k-mers within each block. Dot size is proportional to the number of k-mers with the specific –log P value. The plotting script is published at https://github.com/wheatgenetics/owwc.
Optimization of k-mer GWAS in Ae. tauschii
We used previously generated stem rust phenotype data for P. graminis f. sp. tritici isolate 04KEN156/04, race TTKSK, on 142 Ae. tauschii L2 accessions22. Mapping k-mers with an association score of >6 to the Ae. tauschii reference genome AL8/78 gave rise to significant peaks for the positive controls Sr45 and Sr46 (Extended Data Fig. 4a). The peaks contain k-mers that are negatively correlated with resistance (shown as red dots) because the AL8/78 reference accession does not contain Sr45 and Sr46. To identify the true Sr45 and Sr46 haplotypes, accession TOWWC0112 (which contains Sr45 and Sr46)22 was assembled from tenfold whole-genome shotgun data using MEGAHIT (N50 = 1.1 kb) and used in association mapping. However, noise masked the positive signals from Sr45 and Sr46 when the short scaffolds were distributed randomly along the x axis (Extended Data Fig. 4b). Anchoring the scaffolds to the AL8/78 reference genome considerably improved the plot and produced positive signals for Sr45 and Sr46 (blue peaks; Extended Data Fig. 4c). An improved assembly (N50 = 196 kb), generated with mate-pair libraries and again anchored to AL8/78, further reduced the background noise (Extended Data Fig. 4d).
Performing k-mer GWAS in Ae. tauschii with reduced coverage
The trimmed sequence data of each non-redundant accession was randomly subsampled to reduce the coverage to 7.5-fold, 5-fold, 3-fold and 1-fold. For each coverage point, the k-mer GWAS pipeline was applied, and k-mers with an association score of >6 were mapped to the Ae. tauschii reference genome AL8/78 (Extended Data Fig. 5).
Computing genome-wide LD
The Ae. tauschii AL8/78 reference genome was partitioned into five segments (R1, R2a, C, R2b and R3; Extended Data Fig. 8) based on the distribution of the recombination rate, where the boundaries between these regions were imputed using the boundaries established for the Chinese Spring RefSeqv1.0 D subgenome51. PopLDdecay76 v.3.41 with the parameter ‘-MaxDist’ set to 5 Mb was used to determine the LD decay in these regions for both L1 and L2. For L2, the value of mean r2 in the telomeric regions R1 and R3 dropped below 0.1 at genomic distances of 291 kb and 476 kb, respectively, while for L1, the corresponding genomic distances were 661 kb and 561 kb, respectively.
Reporting Summary
Further information on research design is available in the Nature Research Reporting Summary linked to this article
Online content
Any methods, additional references, Nature Research reporting summaries, source data, extended data, supplementary information, acknowledgements, peer review information; details of author contributions and competing interests; and statements of data and code availability are available at 10.1038/s41587-021-01058-4.
Supplementary information
Supplementary Tables 1–17.
Acknowledgements
We are grateful to the germplasm banks at Kansas State University Wheat Genetics Resource Center, International Center for Agricultural Research in the Dry Areas, USDA-ARS National Small Grains Collection, Leibniz Institute of Plant Genetics and Crop Plant Research, Ilam University, Tajikistan Academy of Sciences and the N. I. Vavilov Research Institute of Plant Industry for providing seed and/or collection data of Ae. tauschii. We thank our colleagues Y. Yue, P. Crane and S. Burrows and John Innes Centre (JIC) Horticultural Services for plant husbandry, M. Ambrose for help with public distribution of germplasm, M. Craze and S. Bowden for help with creation of synthetic wheats, H. Jones for help with elucidating provenance of Ae. tauschii donors used for synthetic wheats, C. Kling for developing and making available the durum wheat line Hoh-501 used for generating synthetic wheats, R. Graf for supplying wheat cv. Radiant, M. Feldman for help with delimiting the Fertile Crescent in Fig. 1, H. Cherry Guo for managing Illumina sequencing, T. Olsson for Illumina data handling, C. Michael Smith for maintenance of wheat curl mite colonies, H. Ahlers for creating graphics, M. Buttner for helpful discussions, A. Galvin and A. Lawn for OWWC communications, A. Meldrum for drafting the OWWC research agreement, the JIC NBI Computing Infrastructure for Science group and the Kansas State University (KSU) BEOCAT for HPC access and maintenance and S. Krattinger for reviewing the draft manuscript. This research was financed by the UK Biotechnology and Biological Sciences Research Council (BBSRC) Wheat Improvement Strategic Programme BB/I002561/1 to R.H. and A.R.B.; BBSRC Designing Future Wheat Institute Strategic Programme BB/P016855/1 to R.H., A.R.B., P.N., S.A.B., X.B., R.P.D., C.U. and B.B.H.W.; BBSRC Earlham Institute Strategic Programme BBS/E/T/000PR9817 to R.P.D.; BBSRC-Embrapa Newton Fund BB/N019113/1 to P.N.; BBSRC grant BB/PPR1740/1 to W.H.; BBSRC National Capability award BBS/E/T/000PR9814 to R.P.D.; UK Research and Innovation-BBSRC National Capability grant BBS/E/J/000PR8000 to N.C.; a UKRI BBSRC Norwich Research Park Biosciences Doctoral Training Partnership scholarship (BB/M011216/1) to A.N.H.; US National Science Foundation (NSF) Industry-University Cooperative Research Center (IUCRC) Award 1822162 to J.P.; Phase II IUCRC at the KSU Center for Wheat Genetic Resources to J.P.; US-NSF award grant/FAIN 1339389 to J.P.; Kansas Wheat Commission award B65336 to J.P.; US-NSF award IOS-1238231 to J.D. and M.-C.L.; United States Department of Agriculture (USDA) to G.B.-G., S.X. and J.F.; National Institute of Food and Agriculture-USDA awards to V.K.T. (2020-67013-31460) and L.G.; a Fulbright Scholars Program to P.S.; Swiss National Science Foundation award 310030B_182833 to B.K.; Newton-Mosharafa Fund award 332408563 to A.F.E. and B.B.H.W.; a JIC Institute Development Grant to B.B.H.W; Agriculture Development Fund of the Saskatchewan Ministry of Agriculture project 20180095 to G.S.B. and H.R.K.; Saskatchewan Wheat Development Commission to G.S.B. and H.R.K.; Alberta Wheat Development Commission to G.S.B. and H.R.K.; Manitoba Crop Alliance to G.S.B. and H.R.K.; Government of Saskatchewan Ministry of Agriculture to P.H.; European Research Council award ERC-2016-STG-716233-MIREDI to K.K.; a Consejo Nacional de Ciencia y Tecnología scholarship to J.Q.-C.; JIC International Scholarships to J.Q.-C. and S.G.; Monsanto’s (now Bayer) Beachell-Borlaug International Scholars’ Program fellowship to S.G.; 2Blades Foundation to S.G. and B.B.H.W.; John Innes Foundation to J.W.; European Union’s Horizon 2020 research and innovation programme Marie Skłodowska-Curie grant agreement 674964 to N.K., B.B.H.W. and C.U.; JIC Science For Africa Initiative to N.K.; The Royal Society award UF150081 to S.A.B.; Australian Research Council award DP210103744 to S.A.B.; a Università di Bologna scholarship to A.P.; Innovation Fund Denmark award 4105-00022B to M.P. and A.F.J.; Jewish National Fund of Australia to R.A. and A.S.; Ministry of Education and Culture of the Republic of Indonesia and the Austrian Agency for International Cooperation in Education and Research (OeAD-GmbH) in cooperation with ASEA-UNINET to R.P.K.; Department of Biotechnology, India award BT/PR30871/BIC/101/1159/2018 to N. Sandhu and award BT/IN/Indo-UK/CGAT/14/PC/2014-15 to P.C.; Science and Technology Development Fund, Egypt-UK Newton-Mosharafa Institutional Links award 30718 to A.F.E. and B.B.H.W. National Science Foundation of China grants 91731305 and 31661143007 to L.M.; Knowledge Innovation Program of Chinese Academy of Agricultural Sciences award CAAS-DRW202002 to LM and the breeding companies KWS, Limagrain, Syngenta and Bayer to the Open Wild Wheat Consortium.
Extended data
Author contributions
S. Arora, M.F.-M., C.G., N. Singh, W.J.R., N.C., S.G., A.N.H., T.O. and J.L. configured, bulked and/or distributed Ae. tauschii germplasm. A.A.M. and F.Y.N. collected and curated new Ae. tauschii accessions from Iran and Tajikistan, respectively. M.F.-M., S.W., J.L., A.P., S. Arora and G.Y. extracted plant DNA, and A.F.E. and S. Arora extracted plant RNA. S.W. prepared DNA libraries. B.B.H.W., J.P., J.F., G.B.-G., S.X., P.C., K.K., A.S., E.L., J.D., M.-C.L., K.F.X.M., A.R.B., B.J.S. and V.K.T. acquired DNA sequences. K.G., J.C., M.M., S. Arora, B. Steuernagel, L.G., S.T., X.B., R.P.D., M.S. and L.S. undertook sequence data curation, back-up and/or distribution. L.G. and K.G. performed variant calling and filtering, L.G., S. Arora and K.G. performed Ae. tauschii redundancy analysis and K.G. performed the heterogeneity analysis. K.G. and M.M. assembled genomes of TOWW0112, A.L., L.M. and D.-C.L. assembled genomes of TOWWC0106 and K.G. assembled the diversity panel. T.L., S. Artmeier and K.F.X.M. performed genome annotations. K.G., S. Arora and J.C. performed genome-wide phylogenetic analysis. K.G. characterized L3 and discovered its contribution to wheat. S. Arora performed the FST analysis. N.K., S. Arora, O.M. and B.J.S. phenotyped Ae. tauschii accessions for stem rust, J.Q.-C., J.S., C.U., B. Steiner, R.P.K. and H.B. phenotyped flowering time, C.C., S.P. and P.N. phenotyped trichomes, G.S.B., H.R.K. and P.H. phenotyped spikelets, J.S.-M. phenotyped powdery mildew and P.S. phenotyped wheat curl mite. K.G. established k-mer GWAS methodology and discovered candidate genes. K.G. and S. Arora. performed genome-wide LD analysis. S.M.K., K.G. and L.G. performed GWAS control experiments. J.Q.-C. and C.U. interpreted Ae. tauschii trait–genotype relationships for flowering time, S.P. and S. Arora for trichomes, S.A.B, J.W., K.G. and J.L. for spikelets, J.S.-M., S. Arora and K.G. for powdery mildew and P.S., L.G. and S. Arora for wheat curl mite. K.G. determined gene level and K.G., P.S., S. Arora and L.G. determined haplotype distribution in Ae. tauschii and wheat. K.G. estimated genetic diversity captured by wheat landraces and synthetic wheats. S. Arora and J.S.-M. annotated WTK4. J.S.-M. and V.W. determined WTK4 gene structure and/or performed functional analysis. R.H. and A.B. generated synthetic wheats. S.L. and J.C.R. developed wheat germplasm for curl mite resistance. S. Arora annotated SrTA1662, M.A.S. and S. Arora designed and engineered binary constructs, S.H. and W.H. transformed wheat and N.K., M.P., A.F.J. and S. Arora phenotyped transgenics. S. Arora, K.G., J.S.-M., P.S., C.G., T.L., B.B.H.W. and J.P. designed figures. K.G., S. Arora, P.S., J.S.-M., L.G., G.S.B., C.C., C.U., M.M., A.R.B., B.K., J.P. and B.B.H.W. conceived and designed experiments. B.B.H.W., K.G., P.S., J.S.-M., R.H., S. Arora, J.P., D.G., R.A., L.G., C.G., N. Sandhu, A.P., S.H., M.S., M.P., C.U., M.M., B.K., K.F.X.M. and A.S. drafted the manuscript. B.B.H.W., J.P. and B. Steuernagel conceived, founded and/or managed OWWC. All authors read and approved the manuscript.
Data availability
The raw PacBio and Illumina sequences used for the assembly of Ae. tauschii accession TOWWC0106 have been submitted to the Genome Sequence Archive (GSA) of the National Genomics Data Center hosted by the Beijing Genomics Institute, Beijing, under the accession number CRA002681 and to NCBI under study number PRJNA730363. The genome assemblies and annotations of TOWWC0112 and TOWWC0106 are available from the Leibniz Institute of Plant Genetics and Crop Plant Research (IPK) at https://doi.ipk-gatersleben.de/DOI/4bb6f03f-3a15-429a-b542-9962cb676e63/953a2d8a-5ade-479a-9304-6fdd12da7ce4/2/1847940088. The 150-bp paired-end Illumina sequences for the 306 Ae. tauschii accessions, the 250-bp paired-end and mate-pair libraries for accession T0WW0112 and the RNA sequencing data for 8 Ae. tauschii accessions are available from NCBI, study number PRJNA685125. The 150-bp paired-end Illumina sequences for the hexaploid wheat accessions and the two additional Ae. tauschii accessions used in the Cmc4 and CmcTAM112 haplotype analysis (Fig. 4 and Extended Data Fig. 7b,c) are available from NCBI, study number PRJNA694980. The k-mer matrix for 305 Ae. tauschii accessions and the tetraploid donor T. durum Hoh-501 used to generate synthetic hexaploids can be obtained from https://doi.ipk-gatersleben.de/DOI/dfc2d351-b5fe-41e6-bd6c-efe96cfcc7aa/0cef0e89-acf2-451c-8efc-a71c0368fec4/2/1847940088. The variant call (SNP) file for 306 Ae. tauschii accessions based on the AL8/78 reference is available from Zenodo at 10.5281/zenodo.4317950. Counts of lineage-specific k-mers in wheat genome assemblies are available from Zenodo at 10.5281/zenodo.4474428. MEGAHIT assemblies for 303 Ae. tauschii accessions (including the 242 non-redundant accessions) are available from Zenodo at 10.5281/zenodo.4430803, 10.5281/zenodo.4430872 and 10.5281/zenodo.4430891. A 29,243-bp fragment extracted from contig 00015145 of the Ae. tauschii TOWWC0106 assembly was deposited in the NCBI GenBank along with the coordinates of the WTK4 transcript SV01 under study number MW295405. The SrTA1662 gene and transcript sequence have been deposited in NCBI Genbank under accession number MW526949. Figures that have associated raw data include Figs. 1–6 and Extended Data Figs. 1–9.
Code availability
Scripts for SNP calling, k-mer matrix generation, redundancy analysis, determination of residual heterogeneity and phylogenetic tree construction, including iTOL.nwk files, admixture analysis, k-mer GWAS and SNP GWAS, can be found in the repository https://github.com/wheatgenetics/owwc.
Competing interests
K.G. and B.B.H.W. are inventors on UK patent application PC931335GB, and S. Arora, B. Steuernagel and B.B.H.W. are inventors on PCT/US2019/013430; these patents are based on part of the work presented here. The remaining authors declare no competing interests.
Footnotes
Peer review information Nature Biotechnology thanks Rudi Appels and the other, anonymous, reviewer(s) for their contribution to the peer review of this work.
Publisher’s note Springer Nature remains neutral with regard to jurisdictional claims in published maps and institutional affiliations.
These authors contributed equally: Kumar Gaurav, Sanu Arora, Paula Silva, Javier Sánchez-Martín, Richard Horsnell.
Contributor Information
Alison R. Bentley, Email: a.bentley@cgiar.org
Beat Keller, Email: bkeller@botinst.uzh.ch.
Jesse Poland, Email: jpoland@ksu.edu.
Brande B. H. Wulff, Email: brande.wulff@kaust.edu.sa
Extended data
is available for this paper at 10.1038/s41587-021-01058-4.
Supplementary information
The online version contains supplementary material available at 10.1038/s41587-021-01058-4.
References
- 1.Dubcovsky J, Dvorak J. Genome plasticity a key factor in the success of polyploid wheat under domestication. Science. 2007;316:1862–1866. doi: 10.1126/science.1143986. [DOI] [PMC free article] [PubMed] [Google Scholar]
- 2.Pont C, et al. Tracing the ancestry of modern bread wheats. Nat. Genet. 2019;51:905–911. doi: 10.1038/s41588-019-0393-z. [DOI] [PubMed] [Google Scholar]
- 3.Marcussen T, et al. Ancient hybridizations among the ancestral genomes of bread wheat. Science. 2014;345:1250092. doi: 10.1126/science.1250092. [DOI] [PubMed] [Google Scholar]
- 4.Huang S, et al. Genes encoding plastid acetyl-CoA carboxylase and 3-phosphoglycerate kinase of the Triticum/Aegilops complex and the evolutionary history of polyploid wheat. Proc. Natl Acad. Sci. USA. 2002;99:8133–8138. doi: 10.1073/pnas.072223799. [DOI] [PMC free article] [PubMed] [Google Scholar]
- 5.Zohary, D., Hopf, M. & Weiss, E. Domestication of Plants in the Old World: The Origin and Spread of Domesticated Plants in Southwest Asia, Europe, and the Mediterranean Basin 4th edn (Oxford Scholarship Online, 2012).
- 6.Giles RJ, Brown TA. GluDy allele variations in Aegilops tauschii and Triticum aestivum: implications for the origins of hexaploid wheats. Theor. Appl. Genet. 2006;112:1563–1572. doi: 10.1007/s00122-006-0259-5. [DOI] [PubMed] [Google Scholar]
- 7.Zhou Y, et al. Triticum population sequencing provides insights into wheat adaptation. Nat. Genet. 2020;52:1412–1422. doi: 10.1038/s41588-020-00722-w. [DOI] [PubMed] [Google Scholar]
- 8.Wang J, et al. Aegilops tauschii single nucleotide polymorphisms shed light on the origins of wheat D-genome genetic diversity and pinpoint the geographic origin of hexaploid wheat. New Phytol. 2013;198:925–937. doi: 10.1111/nph.12164. [DOI] [PubMed] [Google Scholar]
- 9.Li A, Liu D, Yang W, Kishii M, Mao L. Synthetic hexaploid wheat: yesterday, today, and tomorrow. Engineering. 2018;4:552–558. [Google Scholar]
- 10.Gill BS, Raupp WJ. Direct genetic transfers from Aegilops squarrosa L. to hexaploid wheat. Crop Sci. 1987;27:445–450. [Google Scholar]
- 11.Gill BS, et al. Wheat Genetics Resource Center: the first 25 years. Adv. Agron. 2006;89:73–136. [Google Scholar]
- 12.Paux E, Sourdille P, Mackay I, Feuillet C. Sequence-based marker development in wheat: advances and applications to breeding. Biotechnol. Adv. 2012;30:1071–1088. doi: 10.1016/j.biotechadv.2011.09.015. [DOI] [PubMed] [Google Scholar]
- 13.Watson A, et al. Speed breeding is a powerful tool to accelerate crop research and breeding. Nat. Plants. 2018;4:23–29. doi: 10.1038/s41477-017-0083-8. [DOI] [PubMed] [Google Scholar]
- 14.Luo MC, et al. Genome sequence of the progenitor of the wheat D genome Aegilops tauschii. Nature. 2017;551:498–502. doi: 10.1038/nature24486. [DOI] [PMC free article] [PubMed] [Google Scholar]
- 15.Singh, N. et al. Genomic analysis confirms population structure and identifies inter-lineage hybrids in Aegilops tauschii. Front. Plant Sci. 10, 9 (2019). [DOI] [PMC free article] [PubMed]
- 16.Mizuno N, Yamasaki M, Matsuoka Y, Kawahara T, Takumi S. Population structure of wild wheat D-genome progenitor Aegilops tauschii Coss.: implications for intraspecific lineage diversification and evolution of common wheat. Mol. Ecol. 2010;19:999–1013. doi: 10.1111/j.1365-294X.2010.04537.x. [DOI] [PubMed] [Google Scholar]
- 17.Cheng H, et al. Frequent intra- and inter-species introgression shapes the landscape of genetic variation in bread wheat. Genome Biol. 2019;20:136. doi: 10.1186/s13059-019-1744-x. [DOI] [PMC free article] [PubMed] [Google Scholar]
- 18.Matsuoka, Y. et al. Genetic basis for spontaneous hybrid genome doubling during allopolyploid speciation of common wheat shown by natural variation analyses of the paternal species. PLoS ONE8, e68310 (2013). [DOI] [PMC free article] [PubMed]
- 19.Pritchard JK, Stephens M, Donnelly P. Inference of population structure using multilocus genotype data. Genetics. 2000;155:945–959. doi: 10.1093/genetics/155.2.945. [DOI] [PMC free article] [PubMed] [Google Scholar]
- 20.Puechmaille SJ. The program STRUCTURE does not reliably recover the correct population structure when sampling is uneven: subsampling and new estimators alleviate the problem. Mol. Ecol. Resour. 2016;16:608–627. doi: 10.1111/1755-0998.12512. [DOI] [PubMed] [Google Scholar]
- 21.Walkowiak, S. et al. Multiple wheat genomes reveal global variation in modern breeding. Nature588, 277–283 (2020). [DOI] [PMC free article] [PubMed]
- 22.Arora S, et al. Resistance gene discovery and cloning by sequence capture and association genetics. Nat. Biotechnol. 2019;37:139–143. doi: 10.1038/s41587-018-0007-9. [DOI] [PubMed] [Google Scholar]
- 23.Olson EL, et al. Simultaneous transfer, introgression, and genomic localization of genes for resistance to stem rust race TTKSK (Ug99) from Aegilops tauschii to wheat. Theor. Appl. Genet. 2013;126:1179–1188. doi: 10.1007/s00122-013-2045-5. [DOI] [PubMed] [Google Scholar]
- 24.Yan L, et al. The wheat and barley vernalization gene VRN3 is an orthologue of FT. Proc. Natl Acad. Sci. USA. 2006;103:19581–19586. doi: 10.1073/pnas.0607142103. [DOI] [PMC free article] [PubMed] [Google Scholar]
- 25.Bonnin I, et al. FT genome A and D polymorphisms are associated with the variation of earliness components in hexaploid wheat. Theor. Appl. Genet. 2008;116:383–394. doi: 10.1007/s00122-007-0676-0. [DOI] [PubMed] [Google Scholar]
- 26.Dixon LE, et al. Developmental responses of bread wheat to changes in ambient temperature following deletion of a locus that includes FLOWERING LOCUS T1. Plant. Cell Environ. 2018;41:1715–1725. doi: 10.1111/pce.13130. [DOI] [PMC free article] [PubMed] [Google Scholar]
- 27.Pshenichnikova TA, et al. Quantitative characteristics of pubescence in wheat (Triticum aestivum L.) are associated with photosynthetic parameters under conditions of normal and limited water supply. Planta. 2019;249:839–847. doi: 10.1007/s00425-018-3049-9. [DOI] [PubMed] [Google Scholar]
- 28.Glas JJ, et al. Plant glandular trichomes as targets for breeding or engineering of resistance to herbivores. Int. J. Mol. Sci. 2012;13:17077–17103. doi: 10.3390/ijms131217077. [DOI] [PMC free article] [PubMed] [Google Scholar]
- 29.Navia D, et al. Wheat curl mite, Aceria tosichella, and transmitted viruses: an expanding pest complex affecting cereal crops. Exp. Appl. Acarol. 2013;59:95–143. doi: 10.1007/s10493-012-9633-y. [DOI] [PubMed] [Google Scholar]
- 30.Wan H, Yang Y, Li J, Zhang Z, Yang W. Mapping a major QTL for hairy leaf sheath introgressed from Aegilops tauschii and its association with enhanced grain yield in bread wheat. Euphytica. 2015;205:275–285. [Google Scholar]
- 31.Jakoby MJ, et al. Transcriptional profiling of mature Arabidopsis trichomes reveals that NOECK encodes the MIXTA-like transcriptional regulator MYB106. Plant Physiol. 2008;148:1583–1602. doi: 10.1104/pp.108.126979. [DOI] [PMC free article] [PubMed] [Google Scholar]
- 32.Claeys H, et al. Control of meristem determinacy by trehalose 6-phosphate phosphatases is uncoupled from enzymatic activity. Nat. Plants. 2019;5:352–357. doi: 10.1038/s41477-019-0394-z. [DOI] [PMC free article] [PubMed] [Google Scholar]
- 33.Koppolu R, et al. Six-rowed spike4 (Vrs4) controls spikelet determinacy and row-type in barley. Proc. Natl Acad. Sci. USA. 2013;110:13198–13203. doi: 10.1073/pnas.1221950110. [DOI] [PMC free article] [PubMed] [Google Scholar]
- 34.Klymiuk V, et al. Cloning of the wheat Yr15 resistance gene sheds light on the plant tandem kinase-pseudokinase family. Nat. Commun. 2018;9:3735. doi: 10.1038/s41467-018-06138-9. [DOI] [PMC free article] [PubMed] [Google Scholar]
- 35.Brueggeman R, et al. The barley stem rust-resistance gene Rpg1 is a novel disease-resistance gene with homology to receptor kinases. Proc. Natl Acad. Sci. USA. 2002;99:9328–9333. doi: 10.1073/pnas.142284999. [DOI] [PMC free article] [PubMed] [Google Scholar]
- 36.Chen S, et al. Wheat gene Sr60 encodes a protein with two putative kinase domains that confers resistance to stem rust. New Phytol. 2020;225:948–959. doi: 10.1111/nph.16169. [DOI] [PubMed] [Google Scholar]
- 37.Lu P, et al. A rare gain of function mutation in a wheat tandem kinase confers resistance to powdery mildew. Nat. Commun. 2020;11:680. doi: 10.1038/s41467-020-14294-0. [DOI] [PMC free article] [PubMed] [Google Scholar]
- 38.Malik R, Brown-Guedira GL, Smith CM, Harvey TL, Gill BS. Genetic mapping of wheat curl mite resistance genes Cmc3 and Cmc4 in common wheat. Crop Sci. 2003;43:644–650. [Google Scholar]
- 39.Dhakal S, et al. Mapping and KASP marker development for wheat curl mite resistance in ‘TAM 112’ wheat using linkage and association analysis. Mol. Breed. 2018;38:119. [Google Scholar]
- 40.Zhao J, et al. Development of single nucleotide polymorphism markers for the wheat curl mite resistance gene Cmc4. Crop Sci. 2019;59:1567–1575. [Google Scholar]
- 41.Smith CM, Clement SL. Molecular bases of plant resistance to arthropods. Annu. Rev. Entomol. 2012;57:309–328. doi: 10.1146/annurev-ento-120710-100642. [DOI] [PubMed] [Google Scholar]
- 42.Cox TS, et al. Registration of KS96WGRC40 hard red winter wheat germplasm resistant to wheat curl mite, Stagnospora leaf blotch, and Septoria leaf blotch. Crop Sci. 1999;39:597–597. [Google Scholar]
- 43.Rudd JC, et al. ‘TAM 112’ wheat, resistant to greenbug and wheat curl mite and adapted to the dryland production system in the Southern High Plains. J. Plant Regist. 2014;8:291–297. [Google Scholar]
- 44.Talbert LE, Smith LY, Blake NK. More than one origin of hexaploid wheat is indicated by sequence comparison of low-copy DNA. Genome. 1998;41:402–407. [Google Scholar]
- 45.Dvorak, J., Luo, M. C. & Yang, Z.-L. Genetic evidence on the origin of Triticum aestivum L. In The Origins of Agriculture and Crop Domestication, Proceedings of the Harlan Symposium, Aleppo, Syria (eds Damania, A. B. et al) 235–251 (ICARDA, 1997).
- 46.Delorean, E. et al. High molecular weight glutenin gene diversity in Aegilops tauschii demonstrates unique origin of superior wheat quality. Commun. Biol.10.1038/s42003-021-02563-7 (2021). [DOI] [PMC free article] [PubMed]
- 47.Alonso-Blanco C, et al. 1,135 genomes reveal the global pattern of polymorphism in Arabidopsis thaliana. Cell. 2016;166:481–491. doi: 10.1016/j.cell.2016.05.063. [DOI] [PMC free article] [PubMed] [Google Scholar]
- 48.Uauy, C., Wulff, B. B. H. & Dubcovsky, J. Combining traditional mutagenesis with new high-throughput sequencing and genome editing to reveal hidden variation in polyploid wheat. Annu. Rev. Genet.51, 435–454 (2017). [DOI] [PubMed]
- 49.McFadden ES, Sears ER. The origin of Triticum spelta and its free-threshing hexaploid relatives. J. Hered. 1946;37:81–89. doi: 10.1093/oxfordjournals.jhered.a105590. [DOI] [PubMed] [Google Scholar]
- 50.Das MK, Bai G, Mujeeb-Kazi A, Rajaram S. Genetic diversity among synthetic hexaploid wheat accessions (Triticum aestivum) with resistance to several fungal diseases. Genet. Resour. Crop Evol. 2016;63:1285–1296. [Google Scholar]
- 51.International Wheat Genome Sequencing Consortium (IWGSC) et al. Shifting the limits in wheat research and breeding using a fully annotated reference genome. Science361, eaar7191 (2018). [DOI] [PubMed]
- 52.Kim, D., Paggi, J. M., Park, C., Bennett, C. & Salzberg, S. L. Graph-based genome alignment and genotyping with HISAT2 and HISAT-genotype. Nat. Biotechnol. 37, 907–915 (2019). [DOI] [PMC free article] [PubMed]
- 53.Li D, Liu CM, Luo R, Sadakane K, Lam TW. MEGAHIT: an ultra-fast single-node solution for large and complex metagenomics assembly via succinct de Bruijn graph. Bioinformatics. 2015;31:1674–1676. doi: 10.1093/bioinformatics/btv033. [DOI] [PubMed] [Google Scholar]
- 54.Monat C, et al. TRITEX: chromosome-scale sequence assembly of Triticeae genomes with open-source tools. Genome Biol. 2019;20:284. doi: 10.1186/s13059-019-1899-5. [DOI] [PMC free article] [PubMed] [Google Scholar]
- 55.Pendleton M, et al. Assembly and diploid architecture of an individual human genome via single-molecule technologies. Nat. Methods. 2015;12:780–786. doi: 10.1038/nmeth.3454. [DOI] [PMC free article] [PubMed] [Google Scholar]
- 56.Koren S, et al. Canu: scalable and accurate long-read assembly via adaptive k-mer weighting and repeat separation. Genome Res. 2017;27:722–736. doi: 10.1101/gr.215087.116. [DOI] [PMC free article] [PubMed] [Google Scholar]
- 57.Walker BJ, et al. Pilon: an integrated tool for comprehensive microbial variant detection and genome assembly improvement. PLoS ONE. 2014;9:e112963. doi: 10.1371/journal.pone.0112963. [DOI] [PMC free article] [PubMed] [Google Scholar]
- 58.Lewis, C. M. et al. Potential for re-emergence of wheat stem rust in the United Kingdom. Commun. Biol. 1, 13 (2018). [DOI] [PMC free article] [PubMed]
- 59.Kangara N, et al. Mutagenesis of Puccinia graminis f. sp. tritici and selection of gain-of-virulence mutants. Front. Plant Sci. 2020;11:570180. doi: 10.3389/fpls.2020.570180. [DOI] [PMC free article] [PubMed] [Google Scholar]
- 60.Ghosh S, et al. Speed breeding in growth chambers and glasshouses for crop breeding and model plant research. Nat. Protoc. 2018;13:2944–2963. doi: 10.1038/s41596-018-0072-z. [DOI] [PubMed] [Google Scholar]
- 61.Zadoks JC, Chang TT, Konzak CF. A decimal code for the growth stages of cereals. Weed Res. 1974;14:415–421. [Google Scholar]
- 62.R Core Team. R: A Language and Environment for Statistical Computing (R Foundation for Statistical Computing, 2017).
- 63.Covarrubias-Pazaran, G. Genome-assisted prediction of quantitative traits using the R package sommer. PLoS ONE11, e0156744 (2016). [DOI] [PMC free article] [PubMed]
- 64.Wicker T, et al. The wheat powdery mildew genome shows the unique evolution of an obligate biotroph. Nat. Genet. 2013;45:1092–1096. doi: 10.1038/ng.2704. [DOI] [PubMed] [Google Scholar]
- 65.Sánchez-Martín J, et al. Rapid gene isolation in barley and wheat by mutant chromosome sequencing. Genome Biol. 2016;17:221. doi: 10.1186/s13059-016-1082-1. [DOI] [PMC free article] [PubMed] [Google Scholar]
- 66.Aguirre-Rojas L, et al. Resistance to wheat curl mite in arthropod-resistant rye-wheat translocation lines. Agronomy. 2017;7:74. [Google Scholar]
- 67.Chuang WP, et al. Wheat genotypes with combined resistance to wheat curl mite, wheat streak mosaic virus, wheat mosaic virus, and Triticum mosaic virus. J. Econ. Entomol. 2017;110:711–718. doi: 10.1093/jee/tow255. [DOI] [PubMed] [Google Scholar]
- 68.Harvey TL, Seifers DL, Martin TJ, Brown-Guedira G, Gill BS. Survival of wheat curl mites on different sources of resistance in wheat. Crop Sci. 1999;39:1887–1889. [Google Scholar]
- 69.Bates, D., Mächler, M., Bolker, B. M. & Walker, S. C. Fitting linear mixed-effects models using lme4. J. Stat. Softw. 10.18637/jss.v067.i01 (2015).
- 70.Marçais G, Kingsford C. A fast, lock-free approach for efficient parallel counting of occurrences of k-mers. Bioinformatics. 2011;27:764–770. doi: 10.1093/bioinformatics/btr011. [DOI] [PMC free article] [PubMed] [Google Scholar]
- 71.Earl DA, vonHoldt BM. STRUCTURE HARVESTER: a website and program for visualizing STRUCTURE output and implementing the Evanno method. Conserv. Genet. Resour. 2012;4:359–361. [Google Scholar]
- 72.Jakobsson M, Rosenberg NA. CLUMPP: a cluster matching and permutation program for dealing with label switching and multimodality in analysis of population structure. Bioinformatics. 2007;23:1801–1806. doi: 10.1093/bioinformatics/btm233. [DOI] [PubMed] [Google Scholar]
- 73.Kopelman NM, Mayzel J, Jakobsson M, Rosenberg NA, Mayrose I. Clumpak: a program for identifying clustering modes and packaging population structure inferences across K. Mol. Ecol. Resour. 2015;15:1179–1191. doi: 10.1111/1755-0998.12387. [DOI] [PMC free article] [PubMed] [Google Scholar]
- 74.Danecek P, et al. The variant call format and VCFtools. Bioinformatics. 2011;27:2156–2158. doi: 10.1093/bioinformatics/btr330. [DOI] [PMC free article] [PubMed] [Google Scholar]
- 75.Li H. Minimap2: pairwise alignment for nucleotide sequences. Bioinformatics. 2018;34:3094–3100. doi: 10.1093/bioinformatics/bty191. [DOI] [PMC free article] [PubMed] [Google Scholar]
- 76.Zhang C, Dong SS, Xu JY, He WM, Yang TL. PopLDdecay: a fast and effective tool for linkage disequilibrium decay analysis based on variant call format files. Bioinformatics. 2019;35:1786–1788. doi: 10.1093/bioinformatics/bty875. [DOI] [PubMed] [Google Scholar]
Associated Data
This section collects any data citations, data availability statements, or supplementary materials included in this article.
Supplementary Materials
Supplementary Tables 1–17.
Data Availability Statement
The raw PacBio and Illumina sequences used for the assembly of Ae. tauschii accession TOWWC0106 have been submitted to the Genome Sequence Archive (GSA) of the National Genomics Data Center hosted by the Beijing Genomics Institute, Beijing, under the accession number CRA002681 and to NCBI under study number PRJNA730363. The genome assemblies and annotations of TOWWC0112 and TOWWC0106 are available from the Leibniz Institute of Plant Genetics and Crop Plant Research (IPK) at https://doi.ipk-gatersleben.de/DOI/4bb6f03f-3a15-429a-b542-9962cb676e63/953a2d8a-5ade-479a-9304-6fdd12da7ce4/2/1847940088. The 150-bp paired-end Illumina sequences for the 306 Ae. tauschii accessions, the 250-bp paired-end and mate-pair libraries for accession T0WW0112 and the RNA sequencing data for 8 Ae. tauschii accessions are available from NCBI, study number PRJNA685125. The 150-bp paired-end Illumina sequences for the hexaploid wheat accessions and the two additional Ae. tauschii accessions used in the Cmc4 and CmcTAM112 haplotype analysis (Fig. 4 and Extended Data Fig. 7b,c) are available from NCBI, study number PRJNA694980. The k-mer matrix for 305 Ae. tauschii accessions and the tetraploid donor T. durum Hoh-501 used to generate synthetic hexaploids can be obtained from https://doi.ipk-gatersleben.de/DOI/dfc2d351-b5fe-41e6-bd6c-efe96cfcc7aa/0cef0e89-acf2-451c-8efc-a71c0368fec4/2/1847940088. The variant call (SNP) file for 306 Ae. tauschii accessions based on the AL8/78 reference is available from Zenodo at 10.5281/zenodo.4317950. Counts of lineage-specific k-mers in wheat genome assemblies are available from Zenodo at 10.5281/zenodo.4474428. MEGAHIT assemblies for 303 Ae. tauschii accessions (including the 242 non-redundant accessions) are available from Zenodo at 10.5281/zenodo.4430803, 10.5281/zenodo.4430872 and 10.5281/zenodo.4430891. A 29,243-bp fragment extracted from contig 00015145 of the Ae. tauschii TOWWC0106 assembly was deposited in the NCBI GenBank along with the coordinates of the WTK4 transcript SV01 under study number MW295405. The SrTA1662 gene and transcript sequence have been deposited in NCBI Genbank under accession number MW526949. Figures that have associated raw data include Figs. 1–6 and Extended Data Figs. 1–9.
Scripts for SNP calling, k-mer matrix generation, redundancy analysis, determination of residual heterogeneity and phylogenetic tree construction, including iTOL.nwk files, admixture analysis, k-mer GWAS and SNP GWAS, can be found in the repository https://github.com/wheatgenetics/owwc.


