

Abstract
Petrophysical rock typing (PRT) and permeability prediction are of great significance for various disciplines of oil and gas industry. This study offers a novel, explainable data-driven approach to enhance the accuracy of petrophysical rock typing via a combination of supervised and unsupervised machine learning methods. 128 core data, including porosity, permeability, connate water saturation (Swc), and radius of pore throats at 35% mercury injection (R35) were obtained from a heterogeneous carbonate reservoir in Iran and used to train a supervised machine learning algorithm called Extreme Gradient Boosting (XGB). The algorithm output was a modified formation zone index (FZIM*), which was used to accurately estimate permeability (R2 = 0.97) and R35 (R2 = 0.95). Moreover, FZIM* was combined with an unsupervised machine learning algorithm (K-means clustering) to find the optimum number of PRTs. 4 petrophysical rock types (PRTs) were identified via this method, and the range of their properties was discussed. Lastly, shapely values and parameter importance analysis were conducted to explain the correlation between each input parameter and the output and the contribution of each parameter on the value of FZIM*. Permeability and R35 were found to be most influential parameters, where Swc had the lowest impact on FZIM*.
Subject terms: Environmental sciences, Solid Earth sciences
Introduction
Rock typing can be defined as dividing the reservoir into zones with identical petrophysical and flow characteristics1–3. Rock typing can be used in various industry disciplines, including finding thief zones in drilling, managing zones with high productivity index in the production phase, detecting zone of interest and building robust numerical reservoir models4–6. One of the most important usages of rock typing is predicting unknown reservoir properties, specifically permeability in uncored intervals7. Coring from several wells is an often unavoidable, essential task in order to obtain basic data on the field. However, coring in all wells of huge fields or from all zones of interest in a single well poses a substantial financial burden. Therefore, rock typing can be used as a method to alleviate these excessive expenses8.
Several approaches have been proposed in order to perform appropriate rock typing. Some methods are based on geological aspects of reservoirs such as the Lucia method9. Moreover, different petrophysical methods have been defined according to some reservoir properties such as porosity (φ), permeability (K), and capillary pressure (Pc). In addition, various empirical and also theoretical indices have been introduced for petrophysical rock typing (PRT), and the most practical ones are summarized in Table1. Rocks in each specific rock type have similar static (Pc, Swc, etc.) or dynamic (related to fluid flow behavior) i.e., Petrophysical Static Rock Typing (PSRT) and Petrophysical dynamic Rock Typing PDRT, respectively10. In the literature, the terms petrophysical rock types (PRTs) and Hydraulic flow units (HFU) have been interchangeably used. Kadkhodaie 2018 comprehensively reviewed various rock typing methods used in the literature and industry11. The formation zone index (FZI), which was a modification of Kozeny–Carman equation, expresses the correlation among micro-scale parameters like pore shape and size, pore throat radius, and aspect ratio to porosity and permeability as shown in Eq. (1), where is the average radius of the hydraulic unit, is the shape factor, and is the hydraulic tortuosity (the ratio of actual to the straight length ()). The correlation between these micro-scale attributes and macro-scale easy-to-measure parameters (i.e., porosity and permeability from RCAL) can be made by theoretical studies12. To calculate FZI using this method, Reservoir Quality Index (RQI) and normalized porosity (φz) need to be calculated using Eqs. (2) and (3). And finally, Eq. (4) can be used to calculate FZI.
| 1 |
| 2 |
| 3 |
| 4 |
Table 1.
The most common indices for rock typing.
Several researchers have tried to modify FZI by the inclusion or by reducing the number of parameters required to calculate the index13–16. One of the most critical applications of rock typing is to predict unknown reservoir properties for parts of formation where costly core samples are not available. Hence, various theoretical and empirical models are proposed by which different properties, most important of which is K and porosity (φ), can be estimated. Table 1 shows some theoretical and empirical indices commonly used for rock typing in the literature. In addition to FZI, Winland empirical equation, which relies upon pore throat radius when mercury saturation is 35%, is also a widely used index for rock typing. More recently, Mirzami-Piaman et al. proposed FZI* and TEM that rely on routine core analysis (RCAL) and special core analysis (SCAL)-driven properties such as viscosity and relative permeability of phases15,17.
Artificial intelligence (AI) is becoming an essential part of the engineering toolkit in recent years. It has been used to solve a range of problems including mobile computing22, solar radiation estimation23, assessment of discharge rate of streamflows24, forecasting weather25,26, and aquacultural engineering27. The use of AI, specifically data-driven/machine-learning (ML) algorithms, has gained much attention in the energy, oil, and gas industry28. These methods are generally used to estimate the number of parameters that are otherwise technically or theoretically challenging to obtain29,30. The data-driven approaches have been used in various disciplines of the industry, such as approximation of multiple parameters related to carbon capture and sequestration31,32, predicting oil recovery33. And estimation of rock and fluid properties32,34–36.
Recently, data-driven strategies have been used for rock typing/clustering of the reservoirs as well. Table 2 summarizes the application of different data-driven algorithms for rock typing purposes. Most previous studies used a variation of support vector machine (SVM) and artificial neural network (ANN) to classify the reservoir into homogenous clusters. Moreover, the majority of previous studies rely upon a combination of core data and well-logging/seismic data as inputs in their models37. Additionally, most of the previous researchers disregarded Swc in their indices due to the added complexity to the theoretical model or making the empirical results challenging to interpret (due to the high distribution of values for each rock type compared to porosity and permeability)38. Swc is known to play a crucial role in fluid flow in porous media due to its effect on the relative permeability of fluid Hence, omitting it from the equation may result in suboptimal rock types. Hence, in this research, a novel data-driven model (a combination of optimized supervised and unsupervised machine learning methods) that relies on core-data is utilized to propose a modified FZI number (FZIM*) that in addition to the basic petrophysical properties (K and φ) includes Swc and R35, both of which is proven to be of significance17. In this study, by using FZIM*, the heterogeneous carbonate reservoir of interest is classified into different PRTs. The developed model is explainable from statistics and petroleum engineering points of view. In addition, by using this approach, reservoir parameters such as K and R35 can be estimated for uncored parts of the formation.
Table 2.
Application of machine learning algorithms in reservoir studying.
| Authors | Applied algorithm | Input parameters | Prediction target | Performance |
|---|---|---|---|---|
| Ahmadi et al.39 | GA-FL, GA-LSSVM | DT, DEN, CNL, PHIT |
k |
|
| Jamshidian et al.40 | ANN-ICA | DT, NPHI, RHOB, log(RT), log(K) |
k |
|
| Ahmadi and Chen41 | LSSVM, FDT, ANN, HGAPSO-LSSVM | DT, NPHI, RHOB, PHIT, and the matched permeability and porosity in a core laboratory (RCAL) |
k |
|
| Zhong et al.42 | CNN | Gamma ray (GR), bulk density (DEN), the slopes of the GR and DEN curves, and shale content | k | |
| Zhang et al.43 | PSO-SVM | GR, DEN, DT, and their slopes | k | |
| Menke et al.44 | DBS-Decision Tree | Micro-CT images of estaillades limestone | k | |
| Topor45 | RF | Grain density, core porosity and permeability | k |
Methodology
The core data used in this study is obtained from reservoir X, a heterogeneous carbonate reservoir belonging to the Asmari Formation in the Ahvaz field located in the Zagros basin on the northern side of the Persian Gulf, southwestern Iran. Ahvaz field is one of the world’s largest oil fields, and the largest oil field in Iran, and more than 600 wells have been drilled to date. The general trend of the Ahvaz oil field is northwest-southeast resulted from the upward movement of Zagros main thrust-located in the Iranian plateau caused by the collision between Arabian and Indian plates. The main reservoir formations have been deposited during the Oligocene–Miocene and generated a production area of around 67 km long and 6 km wide. All 128 core plugs used in this study were taken at the regular half to one-foot intervals along the zones of interest. Capillary pressure measurements using oil–water centrifuge techniques and mercury injection capillary pressure were conducted on plugs. Table 3 summarizes the statistical background of the database (Fig. 1).
Table 3.
Statistical description of the database.
| Φ | k(md) | Swc | R35 | |
|---|---|---|---|---|
| Count | 128 | 128 | 128 | 128 |
| Mean | 0.15 | 8.87 | 0.22 | 1.34 |
| std | 0.05 | 19.08 | 0.11 | 1.28 |
| Min | 0.05 | 0.11 | 0.03 | 0.25 |
| 0.25 | 0.11 | 1.07 | 0.15 | 0.59 |
| 0.5 | 0.16 | 2.08 | 0.21 | 0.86 |
| 0.75 | 0.18 | 8.16 | 0.25 | 1.55 |
| Max | 0.26 | 122.67 | 0.77 | 7.64 |
Figure 1.

Location of reservoir X, a carbonate reservoir in Asmari formation located in Zagros basin, SW of Iran46.
In most of the previous studies, FZI is only dependent upon φ, K. However, since FZI is used for petrophysical rock type classification, effects of parameters such as pore throat size and connate water saturation come into play. Hence the modified FZI used in this study (FZIM*) can be defined as:
| 5 |
The database used in this study was created using φ (fraction), K(md), connate water saturation (Swc) in fraction, and R35 in microns as input parameters and FZIM* as output. Figure 2 illustrates the overall workflow of the process. The core data was used to train the model without any pre-processing or manipulation, i.e., removing outliers, standardization or normalization of the original data. The FZI to train our model using Eqs. (1)–(4) (Amufele equation20) was calculated using φ and K obtained from the core plugs and was fed to the model as the output. Next, the data was split into training (75% of the data) and test datasets (25%). The model used in this study is a type of gradient boosting algorithm coupled with the Bayesian optimization technique and is called Extreme Gradient Boosting (XGB). Model parameters used in this study are summarized in Table 4. The model is implemented using a scikit™ learn package47 run in python and is well-known for its speed and performance. The mathematical background of the model is comprehensively explained in work of Chen 201648. A typical schematic of gradient boosting algorithms such as XGB is shown on Fig. 3.
Figure 2.

The workflow of the process used in the current study.
Table 4.
Model parameters used in this study.
| Booster = 'dart' | Early_stopping_rounds = 5 |
| Gamma = 0.0 | Learning_rate = 0.2 |
| n-estimatores = 1000 | Objective = 'reg:squarederror' |
| Random_state = 123 | CROSS validation accuracy = 0.93 |
Figure 3.

the schematic of a typical griadient boosting algorithm51.
To ensure the model's performance is neither accidental nor due to overfitting of the training dataset, cross-validation process was conducted. Cross-validation is a method to test model validation to assess how statistical analysis results can be generalized to an independent data set. One round of cross-validation typically involves partitioning a sample of data into subsets, performing the analysis on one subset (training set), and validating the results on the other subset (testing set). Next, the same procedure is repeated to another subset; the analysis on each subset is run, and the error/accuracy of all rounds (iterations) is averaged and reported as the cross-validation score. In this study 75% of data is used as a training set, and the remaining 25% was utilized as a testing dataset (fourfold cross-validation).
An optimization process was conducted once the cross-validation results verified the model’s performance. The performance of data-driven/ML methods could be substantially enhanced using a proper optimization process. Various optimization techniques are available, including genetic algorithms, random grid search, and Bayesian optimization49. This study applied Bayesian optimization due to its structured nature, efficiency, and speed. It involves a structured method that accelerates finding global optimization problems. It builds a probabilistic model of the objective function that is then searched efficiently with an acquisition function before candidate samples are chosen to evaluate the real objective function. A full description and mathematical background of this method can be found in the work of Snoek et al.50. In the next step, the FZIM* was estimated using the testing data set, and the performance of the model was investigated using different model metrics, including r-squared (R2), relative error (R.E.), and mean absolute error (MAE) as follows:
| 6 |
| 7 |
| 8 |
where represents FZI and expresses FZI calculated from the model (FZIM*). One common issue with most data-driven methods previously applied in the industry is their black-box nature and unexplainability. Therefore, the model performance is explained through two analysis: parameter importance and shapely values. These techniques improve the model's explainability through qualitative investigation of the effect of each parameter on FZIM*. Lastly, from the model predicted FZIM*, petrophysical rock types (PRTs), i.e., zones of similar fluid transport properties, were identified. Moreover, permeability and r35 values were estimated using the model output. The estimated permeability and R35 values are essential for parts of the formation where (physical) core samples are not available. Lastly, models performance was explained using two different feature importance analysis (F-score and Shapely), and each feature's effect on the model output was elaborated.
Result and discussions
Figure 4 illustrates Poro-permeability, Lorenz plot, and frequency plots of porosity and permeability for the core data used in this study. It can be seen from porosity–permeability that no significant correlation between the two parameters can be observed. The Lorenz Coefficients (LC) of 0.66 further confirms the heterogeneous nature of the reservoir X. Porosity of the reservoir ranges from 0.11 to 0.26; The median for porosity is 0.17, and the majority of the data falls in the range of 0.15–0.19. From the combination of statistical description of permeability in Table 3 and frequency plot of Fig. 4b, more than 90% of the data have permeability lower than 10 md; moreover, the majority of the samples have permeability lower than 6.20 md. Hence, it can be concluded that reservoir X is a heterogenous, low permeability reservoir. In low permeability heterogeneous reservoirs specifically, petrophysical rock typing and permeability prediction is more challenging52,53. Therefore, an accurate estimation of PRTs and permeability is more crucial.
Figure 4.

Porosity frequency (a), permeability frequency (b), porosity vs permeability plot (c), Lorenz plot (d).
FZIM* prediction using XGB algorithms
XGB model accurately predicted FZIM* values (R2 > 0.97). Figure 5 shows the cross plot of FZI values measured using core plugs (FZI measured) versus those predicted from the model FZIM* (FZI estimated) for the training and test dataset. The dotted black line represents the unity line (R2 = 1). Hence, it can be observed that the model accurately predicts FZI in almost all data points. Moreover, a summary of the model performance (model metrics) is shown in Table 5. It should be noted that the model metrics (MAE, MRE, R2) generated from the test dataset are the ones that are of importance as they are based on the data points that the model had not seen previously. The inclusion of the training dataset in the results is merely to provide more insight into model performance. The high cross-validation in the training dataset proves that regardless of the chunk of the original dataset chosen to train the model, the model's performance is still accurate. In other words, high R2 scores of cross-validation indicate that the model performance is neither due to the overfitting nor random.
Figure 5.

Predicted (FZIM*) versus measured FZI values for Test (a) and Training (b) datasets.
Table 5.
Summary of model performance in Training and Test Dataset.
| Dataset | R2 | MAE | REMax (%) | REMIN (%) | REMean (%) | Mean cross validation |
|---|---|---|---|---|---|---|
| Test | 0.96 | 0.08 | 38.45 | 0.04 | 6.89 | N/A |
| Training | 0.99 | 0.01 | 7.00 | 0.01 | 1.84 | 0.95 |
Relative error (in percentage) of predicted FZI (FZIM*) in the training and test dataset is shown in Fig. 6. It can be seen in the figure that with the exception of one data point, all datapoints have a relative error of less than 25%, and the majority of the data both in training and test dataset has relative error lower than 10%. The low relative error indicates that the model performed well in predicting FZI.
Figure 6.
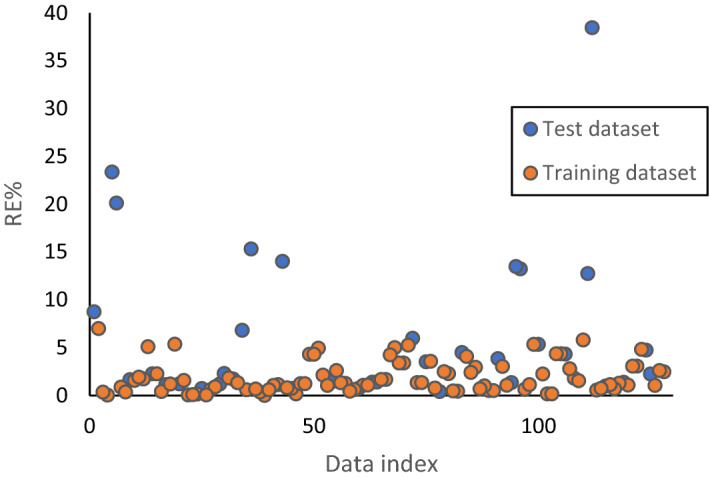
FZI relative error (in percentage) in test and training datasets.
Permeability and R35 prediction in uncored sections of the formation
Log data is usually readily available for all the wells. However, the permeability of rock can only be directly measured using cores, or if available, using well-testing methods. Using FZIM*, the permeability in uncored parts of the formation, or from correlated wells for which porosity data is available can be determined. This can be achieved by rearranging Eq. (5) for permeability:
| 9 |
Using the estimated FZIM* from the model and porosity values from the core (or log if available), the permeability can be accurately estimated. Figure 7 shows the predicted versus measured permeability values. To better show the dispersion of the values, logarithmic values are used on both axes as the superposition of most of the permeability values is between 0.12 and 10 md. R2 between the estimated and actual permeability values for the test and training dataset are 0.97 and 0.99, respectively. It therefore can be seen that using this method, permeability can be accurately predicted.
Figure 7.
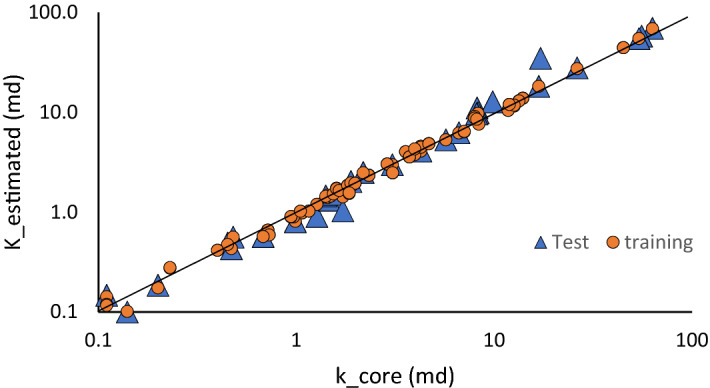
Estimated versus measured core permeabilities for training and test dataset.
R35 estimation
Once the permeability is calculated for uncored sections of the well or well-correlated formations of the same reservoir, R35 can be calculated from Winland R35 equation18:
| 10 |
The estimated values versus actual values of R35 are shown in Fig. 8. R2 between the actual and estimated R35 values is 0.98 and 0.99 for the test and training dataset, respectively. It can be seen that R35 values can be accurately estimated using a combination of FZIM* and Winland equation. This method of calculation of R35 could be of significance for dynamic rock typing using Winland equation in sections of well or parts of the formation for which SCAL data such as mercury injection capillary pressure (MICP) and permeability values are not available. There is a direct correlation between pore size and R35. Generally, the smaller the pore throat, the lower values of R35 and consequently higher capillary pressure (Pc). In low permeability formation, the Winland equation often fails to correctly classify the rock types54,55. However, it is still applicable to estimate pore throat radius in each geological zone and petrophysical rock type due to the linear relation between pore throat radius and R35 as follows:
| 11 |
where C1 is a function of the grain sorting degree in the rock sample56.
Figure 8.
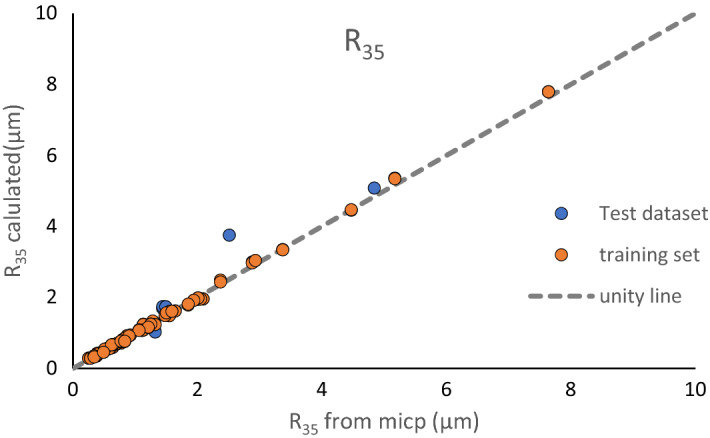
Cross plot of estimated versus measured R35 values for training and test datasets.
Petrophysical rock typing
Rocks with similar FZI values can be grouped into a single petrophysical rock type or dynamic rock types57. DRT equations and frequency plots are frequently used to cluster the units based on FZI-RQI plot58. However, none of these methods alone is sufficient to find the optimum number of flow zones or to efficiently define the boundaries of each zone59. To overcome these limitations, an unsupervised machine learning algorithm (K-means clustering method) is used with a frequency plot to find the optimum number of clusters. Clustering analysis initializes by setting the number of clusters to the number of samples, then gradually integrating the samples with similar FZIM* values into joint clusters. To do this, a parameter called inertia is calculated as each cluster is created. The optimum number of clusters could be specified when forming a new cluster, while not substantially reducing the inertia. As shown in Fig. 9, adding more clusters beyond 4 did not lower the inertia substantially. Hence, four PRTs were identified as the optimum number of clusters. Based on Frequency alone, six units were required. However, the combination of K-means and frequency plot resulted in a better PRT clustering compared to using frequency plot alone.
Figure 9.

PRT classification based on combination of Frequency and K-means algorithm.
To compare the performance of the method used in this study, PRT based on two other indices was conducted. Figure 10a,b illustrate petrophysical rock typing based on the well-known FZI20 and newly developed FZI*15,16. FZI method classifies the reservoir into 2 PRTs while FZI* results in 3 PRTs. PRT based on the FZI approach was more accurate compared to FZI*. However, it can be observed that the R2 of PRTs in both scenarios is considerably lower than PRTs using a combination of K-means and FZIM* developed in this study. Hence, the technique developed in the current study was able to classify the PRTs in the heterogeneous reservoir of interest more accurately.
Figure 10.

PRT classification based on (a) on FZI and (b) FZI*.
Cross-plots φ vs. log (K) based for each PRTs estimated using the abovementioned method are shown in Fig. 9. It can be observed that φ versus Log (K) shows a high coefficient of determination across all the zones (0.80 < R2 < 0.99). The highest R2 can be observed in the second PRT (R2 = 0.99), and the lowest is seen in the second zone (0.80). Table 6 summarizes the range of parameters for each induvial PRT. Moreover, the distribution of values for each input parameter (K,φ, Swc and R35) is presented in a series of box plots for each PRT (Fig. 11).
Table 6.
The permeability equations, r-squared (R2), and range of FZIM* values, for each PRT.
| Zones | FZIM* Range | Correlation | R2 |
|---|---|---|---|
| 1 | < 0.88 | k = 0.755φ3.714 | 0.79 |
| 2 | 0.88–1.39 | k = 10.764φ3.685 | 0.93 |
| 3 | 1.39–1.90 | k = 16.103φ2.880 | 0.99 |
| 4 | 1.90 > | k = 1.326φ3.338 | 0.86 |
Figure 11.

Box plots showing distribution φ, K, Swc and R35 for PRTs 1–4.
PRT 4 (yellow color) is characterized by the highest average porosity (up to 13.6%) and permeability (up to 38.1 md), and R35 values. This unit has the best storage and flow capacities. PRT 3 (grey color), with an average permeability of 18.3 md and an average porosity of 14.7, is still potentially a good quality zone. PRT 2 (green color), with average permeability of 6.36 and similar values of φ as PRT 3, is a lower quality reservoir. Finally, PRT 1, with an average permeability of 2.45 md and porosity similar to PRT2 and PRT3, is the zone with the lowest flow potential in reservoir X and hence is unlikely to contribute in the production. It can also be observed that the trends seen in R35 (Fig. 11d) and permeability (Fig. 11a) are similar. This is primarily due to the relationship between pore throat and permeability. The bigger the pore throat (at 35% of mercury injection in this case), the higher is the permeability of that specific cluster (zone). It should be mentioned that usually, in practice, a hybrid combination of clustering based on lithofacies and electrofacies and FZI is often as the best approach for clustering rather than relying upon one60. However, in the current study we tried to investigate clustering methods and parameter estimations (K, R35) by only relying on core-driven data61.
Parameter importance
The majority of machine learning methods applications in the literature are of a black-box nature. This means the correlation between each parameter and the output is unclear. Explainable machine-learning is gaining more attention nowadays30. To enhance the explainability of the model, two methods of parameter importance analysis, namely F-score and shapely analysis, were conducted. The feature importance using F-score can identify the most influential feature on the output. It estimated the extent to which the model's accuracy is reduced when omitted a specific feature(input). Hence, the input with the highest impact can be identified using this method. On the other hand, Shapley analysis can quantify how different values of inputs positively or negatively affect the output.
Figure 12 shows feature import analysis for the model used in this study. In Fig. 12, the most important feature is permeability, followed by R35 and the least important one is Swc. Figure 13 shows the shapely values for the testing dataset and full dataset (combination of training and test datasets). First, based on the shapely analysis, it can be seen that R35 is the most influential feature where higher values of R35 result in higher model outputs (FZI). This is also explainable from the point of view of petroleum engineering as R35 corresponds to pore throat radius at 35% mercury injection. Both R35 and k are functions of the pore size. The formation that has larger pores will have larger R35 values, as well as permeability values. Hence, both of the properties mentioned earlier positively impact the model output. The same trends can be observed for permeability (K) and Swc (connate water saturation).
Figure 12.

Feature importance of XGB model.
Figure 13.

Shapely analysis for Test (a) and test + training (b) datasets.
In the case of φ, as observed from Fig. 12, higher porosity values reduce the output. This can be explained through theories behind various FZI indices, as shown in Table 1. FZI represents the productivity/deliverability of a rock type (formation). Hence, for a given porosity, higher permeabilities result in better quality (more productive) zones. As shown in Table 1, the most commonly used FZI values are a function of K/φ. Hence, increasing the porosity results in decreasing the FZI.
Another point worth mentioning is that the same trends of Shapley values can be seen both for Fig. 13a,b. This indicates that the testing dataset (almost being blindly split from the original dataset) is fully representative of the whole dataset. The main advantage of Shapely over the feature importance analysis methods is that the former is model-agnostic. Shapely interpretation utilized game theory's SHAP values to estimate the extent to which each feature contributed to the prediction. The model-agnostic approach consists of using ML/AI models to study underlying structures without assuming that they can be accurately described by the model because of their nature. This reduces potential bias in interpretations62.
Conclusions
In this study, a modified formation zone index (FZIM*) was proposed that in addition to porosity and permeability, is a function of Swc and R35.
A supervised data-driven method (XGB) was used to train the model using the aforementioned parameters and to estimate the FZIM* as an output. The model predictions show a high correlation with the measured FZI values from the core data (R2 = 0.97, MAE = 0.08).
The predicted FZIM* values were then used to calculate permeability and R35, and the estimated values were compared to the measured in both cases high R2 between the predicted and estimated parameters was found. Estimated FZIM* values were utilized to create a frequency plot that was then used together with the K-means algorithm to find the optimum number of PRTs. Boxplots of parameters then were used to discuss ranges of parameters in each cluster.
Lastly, parameter importance and shapely analysis was used to quantify the effect of each input parameter on the output. The novel methodology used in this study (combination of supervised and unsupervised machine learning) can be used to improve petrophysical rock typing and enhance the estimation of parameters such as permeability and pore throat radius that otherwise require expensive cores or well testing.
The current study was conducted using a limited number of core data collected from a heterogeneous carbonate reservoir. The study could be further improved by applying this method to larger datasets. Moreover, including petrophysical parameters such as the cementation factor in the model, could potentially result in an optimized permeability prediction and improved petrophysical rock typing.
Supplementary Information
Acknowledgements
The authors wish to use the space to thank the Science and Technology Project of Heilongjiang Province (2020ZX05A01) China petroleum science and technology innovation fund project (2020D-5007-0106) for providing the funding for the current research.
Abbreviations
- FZI
Flow zone indicator
- MFZI
Modified flow zone indicator
- FZIM
Modified flow zone indicator
- FZIM*
Modified flow zone indicator developed in this study
- HFU
Hydraulic flow unit
- PRT
Petrophysical rock typing
- PDRT
Petrophysical dynamic rock typing
- PSRT
Petrophysical static rock typing
- LC
Lorenz coefficient
- R2
Regression coefficient
- RMSE
Root mean square error
- SCAL
Special core analysis
- RCAL
Routine core analysis
- AI
Artificial intelligence
- ML
Machine learning
- MICP
Mercury injection capillary pressure
- XGB
Extreme gradient boosting
- RE
Relative error
- MAE
Mean absolute error
- R35
Pore throat radius at mercury saturation of 35%
- DRT
Discrete (dynamic) rock typing
- RQI
Reservoir quality index
- TEM
True effective mobility
List of symbols
Effective porosity
Absolute permeability
- Pc
Capillary pressure
- Sw
Water saturation
Porosity
Mean hydraulic unit radius
- Fs
Shape factor
Hydraulic tortuosity
- La
Actual length
- L
Straight length
- Swc
Connate water saturation
Fluid dynamic viscosity
Relative permeability
- rth
Pore throat radius
Author contributions
E.M. conceptualization, programming, analysis, writing, editing; M.K., writing, analysis,; M.O. Review and Editing, B.L. Supervision, editing, M.S. Editing, writing. All authors reviewed the manuscript.
Data availability
The database and the python code used in the current study are available in Supplementary Information.
Competing interests
The authors declare no competing interests.
Footnotes
Publisher's note
Springer Nature remains neutral with regard to jurisdictional claims in published maps and institutional affiliations.
Contributor Information
Erfan Mohammadian, Email: Erfan.723@gmail.com.
Bo Liu, Email: liubo@nepu.edu.cn.
Supplementary Information
The online version contains supplementary material available at 10.1038/s41598-022-08575-5.
References
- 1.Aliakbardoust E, Rahimpour-Bonab H. Integration of rock typing methods for carbonate reservoir characterization. J. Geophys. Eng. 2013 doi: 10.1088/1742-2132/10/5/055004. [DOI] [Google Scholar]
- 2.Gomes, J. S., Ribeiro, M. T., Strohmenger, C. J., Negahban, S. & Kalam, M. Z. Carbonate reservoir rock typing - The link between geology and SCAL. In Soc. Pet. Eng.—13th Abu Dhabi Int. Pet. Exhib. Conf. ADIPEC 2008, vol. 3 1643–1656. 10.2118/118284-ms (2008).
- 3.Mukherjee, P., Singharay, D., Matar, S. & Meshari, D. M. A. Rock-typing: An integrated reservoir characterization tool for tight jurassic carbonates, West Kuwait*, vol. 70372. 10.1306/70372Mukherjee2018 (2018).
- 4.Dakhelpour-Ghoveifel J, Shegeftfard M, Dejam M. Capillary-based method for rock typing in transition zone of carbonate reservoirs. J. Pet. Explor. Prod. Technol. 2018;9(3):2009–2018. doi: 10.1007/s13202-018-0593-6. [DOI] [Google Scholar]
- 5.Chandra V, et al. Effective integration of reservoir rock-typing and simulation using near-wellbore upscaling. Mar. Pet. Geol. 2015;67:307–326. doi: 10.1016/j.marpetgeo.2015.05.005. [DOI] [Google Scholar]
- 6.Riazi Z. Application of integrated rock typing and flow units identification methods for an Iranian carbonate reservoir. J. Pet. Sci. Eng. 2018;160:483–497. doi: 10.1016/j.petrol.2017.10.025. [DOI] [Google Scholar]
- 7.Lis-Śledziona A. Petrophysical rock typing and permeability prediction in tight sandstone reservoir. Acta Geophys. 2019;67(6):1895–1911. doi: 10.1007/s11600-019-00348-5. [DOI] [Google Scholar]
- 8.Farshi M, Moussavi-Harami R, Mahboubi A, Khanehbad M, Golafshani T. Reservoir rock typing using integrating geological and petrophysical properties for the Asmari Formation in the Gachsaran oil field, Zagros basin. J. Pet. Sci. Eng. 2019;176:161–171. doi: 10.1016/j.petrol.2018.12.068. [DOI] [Google Scholar]
- 9.Jennings, J. W. & Lucia, F. J. Predicting permeability from well logs in carbonates with a link to geology for interwell permeability mapping (2001).
- 10.Skalinski M, Kenter JAM. Carbonate petrophysical rock typing: Integrating geological attributes and petrophysical properties while linking with dynamic behaviour. Geol. Soc. Spec. Publ. 2015;406(1):229–259. doi: 10.1144/SP406.6. [DOI] [Google Scholar]
- 11.Kadkhodaie A, Kadkhodaie R. A review of reservoir rock typing methods in carbonate reservoirs: Relation between geological, seismic, and reservoir rock types. Pet. Eng. Iran. J. Oil Gas Sci. Technol. 2018;7(4):13–35. [Google Scholar]
- 12.Davies, D. K. & Vessell, R. K. Flow unit characterization of a shallow shelf carbonate reservoir: North Robertson unit, West Texas. (1996).
- 13.Nooruddin HA, Hossain ME. Modified Kozeny–Carmen correlation for enhanced hydraulic flow unit characterization. J. Pet. Sci. Eng. 2011;80(1):107–115. doi: 10.1016/j.petrol.2011.11.003. [DOI] [Google Scholar]
- 14.Izadi M, Ghalambor A. A new approach in permeability and hydraulic-flow-unit determination. SPE Reserv. Eval. Eng. 2013;16(03):257–264. doi: 10.2118/151576-PA. [DOI] [Google Scholar]
- 15.Mirzaei-Paiaman A, et al. A further verification of FZI* and PSRTI: Newly developed petrophysical rock typing indices. J. Pet. Sci. Eng. 2019;175:693–705. doi: 10.1016/j.petrol.2019.01.014. [DOI] [Google Scholar]
- 16.Mirzaei-Paiaman A, Ostadhassan M, Rezaee R, Saboorian-Jooybari H, Chen Z. A new approach in petrophysical rock typing. J. Pet. Sci. Eng. 2018;166(March):445–464. doi: 10.1016/j.petrol.2018.03.075. [DOI] [Google Scholar]
- 17.Faramarzi-Palangar M, Mirzaei-Paiaman A. Investigating dynamic rock quality in two-phase flow systems using TEM-function: A comparative study of different rock typing indices. Pet. Res. 2021;6(1):16–25. doi: 10.1016/j.ptlrs.2020.08.001. [DOI] [Google Scholar]
- 18.Kolodzie, S. Analysis of pore throat size and use of the Waxman–Smits equation to determine OOIP in Spindle Field, Colorado (1980).
- 19.Pittman ED. Relationship of porosity and permeability to various parameters derived from mercury injection-capillary pressure curves for sandstone. Am. Assoc. Pet. Geol. Bull. 1992;76(2):191–198. [Google Scholar]
- 20.Amaefule, J. O., Altunbay, M., Tiab, D., Kersey, D. G., & Keelan, D. K. Enhanced reservoir description: using core and log data to identify hydraulic (flow) units and predict permeability in uncored intervals/ wells. In Proceedings—SPE Annual Technical Conference and Exhibition, vol. Omega, no. c, 205–220. 10.2523/26436-ms (1993).
- 21.Mirzaei-Paiaman A, Ostadhassan M, Rezaee R, Saboorian-Jooybari H, Chen Z. A new approach in petrophysical rock typing. J. Pet. Sci. Eng. 2018;166:445–464. doi: 10.1016/j.petrol.2018.03.075. [DOI] [Google Scholar]
- 22.Shamshirband S, Fathi M, Chronopoulos AT, Montieri A, Palumbo F, Pescapè A. Computational intelligence intrusion detection techniques in mobile cloud computing environments: Review, taxonomy, and open research issues. J. Inf. Secur. Appl. 2020;55:102582. [Google Scholar]
- 23.Zhang G, et al. Solar radiation estimation in different climates with meteorological variables using Bayesian model averaging and new soft computing models. Energy Rep. 2021;7:8973–8996. doi: 10.1016/j.egyr.2021.10.117. [DOI] [Google Scholar]
- 24.Shamshirband S, Rabczuk T, Chau K-W. A survey of deep learning techniques: Application in wind and solar energy resources. IEEE Access. 2019;7:164650–164666. doi: 10.1109/ACCESS.2019.2951750. [DOI] [Google Scholar]
- 25.Wu CL, Chau K-W. Prediction of rainfall time series using modular soft computingmethods. Eng. Appl. Artif. Intell. 2013;26(3):997–1007. doi: 10.1016/j.engappai.2012.05.023. [DOI] [Google Scholar]
- 26.Taormina R, Chau K-W. ANN-based interval forecasting of streamflow discharges using the LUBE method and MOFIPS. Eng. Appl. Artif. Intell. 2015;45:429–440. doi: 10.1016/j.engappai.2015.07.019. [DOI] [Google Scholar]
- 27.Banan A, Nasiri A, Taheri-Garavand A. Deep learning-based appearance features extraction for automated carp species identification. Aquac. Eng. 2020;89:102053. doi: 10.1016/j.aquaeng.2020.102053. [DOI] [Google Scholar]
- 28.Mohammadpour, M., Roshan, H., Arashpour, M. & Masoumi, H. The use of geophysical data for the mechanical characterization of coal measure rocks based on the machine learning technique. (2021).
- 29.Alfonso, C. E., Fournier, F. & Alcobia, V. A machine learning methodology for rock-typing using relative permeability curves. In Proceedings—SPE Annual Technical Conference and Exhibition, vol. 2021-Septe. 10.2118/205989-MS (2021).
- 30.Sircar A, Yadav K, Rayavarapu K, Bist N, Oza H. Application of machine learning and artificial intelligence in oil and gas industry. Pet. Res. 2021 doi: 10.1016/j.ptlrs.2021.05.009. [DOI] [Google Scholar]
- 31.Mohammadian E, et al. Application of extreme learning machine for prediction of aqueous solubility of carbon dioxide. Environ. Earth Sci. 2016;75(3):215. doi: 10.1007/s12665-015-4798-4. [DOI] [Google Scholar]
- 32.Tripathy A, Srinivasan V, Singh TN. A comparative study on the pore size distribution of different Indian shale gas reservoirs for gas production and potential CO2 sequestration. Energy Fuels. 2018;32(3):3322–3334. doi: 10.1021/acs.energyfuels.7b04137. [DOI] [Google Scholar]
- 33.Makhotin I, Orlov D, Koroteev D, Burnaev E, Karapetyan A, Antonenko D. Machine learning for recovery factor estimation of an oil reservoir: A tool for de-risking at a hydrocarbon asset evaluation. Petroleum. 2018 doi: 10.1016/j.petlm.2021.11.005. [DOI] [Google Scholar]
- 34.Madhubabu N, Singh PK, Kainthola A, Mahanta B, Tripathy A, Singh TN. Prediction of compressive strength and elastic modulus of carbonate rocks. Measurement. 2016;88:202–213. doi: 10.1016/j.measurement.2016.03.050. [DOI] [Google Scholar]
- 35.Nourani M, Alali N, Samadianfard S, Band SS, Chau K, Shu C-M. Comparison of machine learning techniques for predicting porosity of chalk. J. Pet. Sci. Eng. 2021;209:109853. doi: 10.1016/j.petrol.2021.109853. [DOI] [Google Scholar]
- 36.Sirdesai NN, Singh A, Sharma LK, Singh R, Singh TN. Development of novel methods to predict the strength properties of thermally treated sandstone using statistical and soft-computing approach. Neural Comput. Appl. 2019;31(7):2841–2867. doi: 10.1007/s00521-017-3233-z. [DOI] [Google Scholar]
- 37.Magid SA, Petrini F, Dezfouli B. Image classification on IoT edge devices: Profiling and modeling. Cluster Comput. 2020;23(2):1025–1043. doi: 10.1007/s10586-019-02971-9. [DOI] [Google Scholar]
- 38.Mirzaei-Paiaman A, Asadolahpour SR, Saboorian-Jooybari H, Chen Z, Ostadhassan M. A new framework for selection of representative samples for special core analysis. Pet. Res. 2020;5(3):210–226. doi: 10.1016/j.ptlrs.2020.06.003. [DOI] [Google Scholar]
- 39.Ahmadi M-A, Ahmadi MR, Hosseini SM, Ebadi M. Connectionist model predicts the porosity and permeability of petroleum reservoirs by means of petro-physical logs: Application of artificial intelligence. J. Pet. Sci. Eng. 2014;123:183–200. doi: 10.1016/j.petrol.2014.08.026. [DOI] [Google Scholar]
- 40.Jamshidian M, Hadian M, Zadeh MM, Kazempoor Z, Bazargan P, Salehi H. Prediction of free flowing porosity and permeability based on conventional well logging data using artificial neural networks optimized by Imperialist competitive algorithm—A case study in the South Pars gas field. J. Nat. Gas Sci. Eng. 2015;24:89–98. doi: 10.1016/j.jngse.2015.02.026. [DOI] [Google Scholar]
- 41.Ahmadi MA, Chen Z. Comparison of machine learning methods for estimating permeability and porosity of oil reservoirs via petro-physical logs. Petroleum. 2019;5(3):271–284. doi: 10.1016/j.petlm.2018.06.002. [DOI] [Google Scholar]
- 42.Zhong Z, Carr TR, Wu X, Wang G. Application of a convolutional neural network in permeability prediction: A case study in the Jacksonburg-Stringtown oil field, West Virginia, USA. Geophysics. 2019;84(6):B363–B373. doi: 10.1190/geo2018-0588.1. [DOI] [Google Scholar]
- 43.Zhang Z, Zhang H, Li J, Cai Z. Permeability and porosity prediction using logging data in a heterogeneous dolomite reservoir: An integrated approach. J. Nat. Gas Sci. Eng. 2021;86:103743. doi: 10.1016/j.jngse.2020.103743. [DOI] [Google Scholar]
- 44.Menke HP, Maes J, Geiger S. Upscaling the porosity–permeability relationship of a microporous carbonate for Darcy-scale flow with machine learning. Sci. Rep. 2021;11(1):1–10. doi: 10.1038/s41598-021-82029-2. [DOI] [PMC free article] [PubMed] [Google Scholar]
- 45.Topór T. Application of machine learning algorithms to predict permeability in tight sandstone formations. Naft. Gaz. 2021;2021(5):283–292. doi: 10.18668/NG.2021.05.01. [DOI] [Google Scholar]
- 46.Noorian Y, Moussavi-Harami R, Hollis C, Reijmer JJG, Mahboubi A, Omidpour A. Control of climate, sea-level fluctuations and tectonics on the pervasive dolomitization and porosity evolution of the Oligo-Miocene Asmari Formation (Dezful Embayment, SW Iran) Sediment. Geol. 2021;427:106048. doi: 10.1016/j.sedgeo.2021.106048. [DOI] [Google Scholar]
- 47.Pedregosa F, et al. Scikit-learn: Machine learning in Python. J. Mach. Learn. Res. 2011;12:2825–2830. [Google Scholar]
- 48.Chen Y, Chen T, Xu Z, Sun N, Temam O. DianNao family: Energy-efficient hardware accelerators for machine learning. Commun. ACM. 2016;59(11):105–112. doi: 10.1145/2996864. [DOI] [Google Scholar]
- 49.Hertel L, Collado J, Sadowski P, Ott J, Baldi P. Sherpa: Robust hyperparameter optimization for machine learning. SoftwareX. 2020;12:100591. doi: 10.1016/j.softx.2020.100591. [DOI] [Google Scholar]
- 50.Snoek, J., Larochelle, H. & Adams, R. P. Practical bayesian optimization of machine learning algorithms. Adv. Neural Inf. Process. Syst.25, 2951–2959 (2012).
- 51.Larestani A, Mousavi SP, Hadavimoghaddam F, Hemmati-Sarapardeh A. Predicting formation damage of oil fields due to mineral scaling during water-flooding operations: Gradient boosting decision tree and cascade-forward back-propagation network. J. Pet. Sci. Eng. 2022;208:109315. doi: 10.1016/j.petrol.2021.109315. [DOI] [Google Scholar]
- 52.Palabiran, M., Akbar, M. N. A. & Listyaningtyas, S. N. An analysis of rock typing methods in carbonate rocks for better carbonate reservoir characterization: A case study of minahaki carbonate formation, Banggai Sula Basin, Central Sulawesi. 4-Rock Typing. (2016).
- 53.Rebelle, M. & Lalanne, B. Rock-typing in carbonates: A critical review of clustering methods. In Soc. Pet. Eng.—30th Abu Dhabi Int. Pet. Exhib. Conf. ADIPEC 2014 Challenges Oppor. Next 30 Years, vol. 1 792–805. 10.2118/171759-ms (2014).
- 54.Palavecino, M. & Torres-Verdín, C. New method of petrophysical rock classification based on MICP and grain-size distribution measurements (2016).
- 55.Ismail A, Yasin Q, Du Q. Application of hydraulic flow unit for pore size distribution analysis in highly heterogeneous sandstone reservoir: A case study. J. Jpn. Pet. Inst. 2018;61(5):246–255. doi: 10.1627/jpi.61.246. [DOI] [Google Scholar]
- 56.FazelAlavi, M., FazelAlavi, M. & FazelAlavi, M. A novel technique for generation of accurate capillary pressure Pc curves from conventional logs and routine core data and new Pc endpoint functions after considering the sedimentary environment and pore throat size distribution shape PTSDS. (2016).
- 57.Prasad M. Velocity-permeability relations within hydraulic units. Geophysics. 2003;68(1):108–117. doi: 10.1190/1.1543198. [DOI] [Google Scholar]
- 58.Dezfoolian MA. Flow zone indicator estimation based on petrophysical studies using an artificial neural network in a southern Iran reservoir. Pet. Sci. Technol. 2013;31(12):1294–1305. doi: 10.1080/10916466.2010.542421. [DOI] [Google Scholar]
- 59.Dezfoolian MA, Riahi MA, Kadkhodaie-Ilkhchi A. Conversion of 3D seismic attributes to reservoir hydraulic flow units using a neural network approach: An example from the Kangan and Dalan carbonate reservoirs, the world’s largest non-associated gas reservoirs, near the Persian Gulf. Earth Sci. Res. J. 2013;17(2):75–85. [Google Scholar]
- 60.Liu B, et al. Lithofacies and depositional setting of a highly prospective lacustrine shale oil succession from the Upper Cretaceous Qingshankou Formation in the Gulong sag, northern Songliao Basin, northeast China. Am. Assoc. Pet. Geol. Bull. 2019;103(2):405–432. [Google Scholar]
- 61.Saputelli, L. et al. Deriving permeability and reservoir rock typing supported with self-organized maps Som and artificial neural networks ANN—Optimal workflow for enabling core-log integration. In Soc. Pet. Eng.—SPE Reserv. Characterisation Simul. Conf. Exhib. 2019, RCSC 2019. 10.2118/196704-ms (2019).
- 62.Lundberg, S. M. & Lee, S.-I. A unified approach to interpreting model predictions. In Proceedings of the 31st International Conference on Neural Information Processing Systems 4768–4777 (2017).
Associated Data
This section collects any data citations, data availability statements, or supplementary materials included in this article.
Supplementary Materials
Data Availability Statement
The database and the python code used in the current study are available in Supplementary Information.