

Abstract
Hsp70s are ubiquitous and highly conserved molecular chaperones. They play crucial roles in maintaining cellular protein homeostasis. It is well established that Hsp70s use the energy of ATP hydrolysis to ADP to power the chaperone activity regardless of the cellular locations and isoforms. Binding immunoglobin protein (BiP), the major member of Hsp70s in the endoplasmic reticulum, is essential for protein folding and quality control. Unexpectedly, our structural analysis of BiP demonstrated a novel ATP hydrolysis to AMP during crystallization under the acidic conditions. Our biochemical studies confirmed this newly discovered ATP to AMP hydrolysis in solutions. Unlike the canonical ATP to ADP hydrolysis observed for Hsp70s, this ATP hydrolysis to AMP depends on the substrate‐binding domain of BiP and is inhibited by the binding of a peptide substrate. Intriguingly, this ATP to AMP hydrolysis is unique to BiP, not shared by two representative Hsp70 proteins from the cytosol. Taken together, this novel and unique ATP to AMP hydrolysis may provide a potentially new direction for understanding the activity and cellular function of BiP.
Keywords: ADP, AMP, ATP, ATPase, BiP, heat shock proteins (HSPs), Hsp70, molecular chaperones, protein folding
Short abstract
PDB Code(s): 7N1R;
1. INTRODUCTION
Maintaining protein homeostasis and quality control is one of the most fundamental functions for all living organisms. The heat shock proteins 70 kDa (Hsp70s) constitute the most abundant and highly conserved molecular chaperones across all kingdoms of life. 1 , 2 , 3 , 4 , 5 , 6 , 7 , 8 , 9 , 10 , 11 , 12 As a key family of molecular chaperones, Hsp70s play an essential role in almost all the processes in maintaining protein homeostasis including protein folding, transportation, degradation, and assembly, and dissociating and preventing protein aggregation. Hsp70s are omnipresent. They are found in the cytosol of both eukaryotes and prokaryotes and various organelles of eukaryotic cells such as the endoplasmic reticulum (ER) and mitochondrion. There are 13 different Hsp70 homologs expressed in various cellular compartments of human cells. 4 , 13 Although Hsp70s are highly conserved and share functional redundancy, there are clear differences among these homologs. Binding immunoglobin protein (BiP) is a major Hsp70 residing in the lumen of the ER. BiP plays a key role in all the key functions of the ER including folding, assembly, and quality control for secreted and membrane proteins as well as regulating calcium homeostasis. 14 , 15 , 16 , 17 , 18 , 19 , 20 Besides these well‐established roles, BiP has been shown to be strongly expressed in cancer cells and localized on the surface of cancer cells but not normal tissues, 21 , 22 , 23 , 24 suggesting that BiP may be exploited as a potential cancer marker and anti‐cancer target. BiP is also called GRP78 (78‐kDa glucose‐regulated protein) as it was first discovered as a protein induced by glucose starvation 25 and later found to be an Hsp70 homolog. 18 Additionally, the BiP's functions are uniquely fine‐tuned by posttranslational modifications such as covalent ADP and AMP modifications. 26 , 27 , 28
Hsp70s are highly conserved in both amino acid sequence and protein structure. 1 , 2 , 3 , 4 , 5 , 6 , 7 , 8 , 9 , 10 , 11 , 29 All Hsp70s are comprised of two functional domains. At the N‐terminus is a nucleotide‐binding domain (NBD) and a substrate‐binding domain (SBD) is at the C‐terminus. Connecting these two functional domains is a short linker of 10–20 residues named the inter‐domain linker. Corresponding to the two functional domains are two intrinsic biochemical activities. NBD binds ATP and hydrolyzes ATP to ADP. The SBD prefers to bind polypeptides in the extended conformations that normally exist in the unfolded proteins. Through allosteric coupling between these two intrinsic activities, 30 , 31 , 32 , 33 ATP binding and hydrolysis provide energy to power the chaperone activity. In combination with various biochemical and biophysical studies, extensive structural efforts during the last three decades have revealed the molecular mechanisms of the key biochemical properties of Hsp70s including nucleotide binding, polypeptide substrate binding and allosteric coupling. 5 , 34 , 35 , 36 , 37 , 38 , 39 , 40 , 41 , 42 , 43 , 44 , 45 The NBD is made of two big lobes. Adenosine nucleotides ATP and ADP have been shown to bind between the two lobes. The SBD contains two subdomains: SBDβ and SBDα. Structural and biochemical studies have shown that the binding sites for peptide substrates are on the SBDβ. In the ATP‐bound state, extensive contacts between NBD and SBD were formed and these contacts resulted in conformational changes in both domains to module the intrinsic biochemical activities. In contrast, little contacts were observed for either the nucleotide‐free or ADP‐bound state.
In all known processes assisted by Hsp70s, two classes of functionally conserved cochaperones have been discovered: Hsp40s and nucleotide‐exchange factors (NEFs). 1 , 3 , 8 , 10 , 46 , 47 , 48 , 49 , 50 , 51 Hsp40s, also known as the J‐domain proteins, have been shown to stimulate the ATP hydrolysis by Hsp70s. 45 , 47 , 50 , 52 , 53 At the same time, accumulating evidence suggest that Hsp40s are essential in regulating the substrate binding specificities of Hsp70s by bringing substrates to Hsp70s through directly interacting with polypeptide substrates. 20 , 45 , 50 , 52 , 54 The function of NEFs is to facilitate the exchange of bound ADP for ATP after ATP hydrolysis by Hsp70s. 49
It is well established that Hsp70s hydrolyze ATP to ADP and use the energy to power their chaperone activity in maintaining protein homeostasis. 1 , 2 , 3 , 4 , 5 , 6 , 7 , 8 , 9 , 10 , 11 , 30 Surprisingly, in a new crystal structure of human BiP that we solved in this study, AMP was found to bind in the nucleotide binding pocket although only ATP was included in our crystallization conditions. Importantly, our solution studies have provided supports for this unusual ATP to AMP hydrolysis in the acidic conditions. Furthermore, our biochemical analysis demonstrated that this ATP to AMP hydrolysis not only has different properties from the classic ATP hydrolysis to ADP but also is unique to BiP.
2. RESULTS
2.1. A crystal structure of a human BiP revealed a novel ATP hydrolysis to AMP
To characterize the molecular mechanism of the allosteric coupling and chaperone cycle, previously, we have reported two crystal structures of a full‐length human BiP in complex with ATP: BiP‐ATP (PDB: 5E84) and BiP‐ATP2 (PDB: 6ASY). 55 , 56 The crystallization construct for BiP‐ATP2 only contains a single mutation in the SBD (the L3,4 modification) with an intact NBD (Figure 1a). The crystals were grown in a wide range of pH, from 4.2 to 7.0, in the presence of ATP. Our reported BiP‐ATP2 structure was primarily determined at pH 7.0 since this pH is more physiologically relevant. Surprisingly, when we analyzed the diffraction at pH 4.5, significant changes were observed for unit cell dimensions while the space group remained the same (Figure S1a). In order to characterize the structural difference between the different pH conditions, we solved a BiP structure at pH 4.5 to 2.03 Å using molecular replacement with the BiP‐ATP2 structure as a searching model (Table 1). Despite the significant difference in unit cell dimension, the overall structure of this new BiP structure is almost identical to the BiP‐ATP2 structure (rmsd = 0.223 Å for Cα, Figures 1b and S1b). To our surprise, clear electron density for AMP and an isolated phosphate (Pi) was observed in the nucleotide‐binding pocket instead of ATP in this new BiP structure (Figures 1c and S2). Hence, we named this new BiP structure as BiP‐AMP. Unlike the electron density observed previously for ATP, 55 , 56 the position corresponding to the β phosphate has little electron density. The α phosphate of AMP and free Pi in the BiP‐AMP structure share almost identical positions as the α and γ phosphates of ATP from the BiP‐ATP2 structure, respectively (Figure 1d). This is consistent with the almost identical conformation of the NBD (Figure 1b). The NBD is composed of two large lobes: I and II. The nucleotide is bound between the two lobes. Since we only included ATP in our crystallization condition, the clear AMP electron density in the BiP‐AMP structure suggested that the BiP protein has the potential to hydrolyze ATP to AMP. The free Pi observed could come from either the β or γ phosphate of ATP. This is unexpected since all previous publications including various crystallographic studies have established that Hsp70s hydrolyze ATP to ADP. 1 , 2 , 3 , 4 , 5 , 6 , 7 , 8 , 9 , 10 , 11 , 30 , 35 , 42 , 57
FIGURE 1.
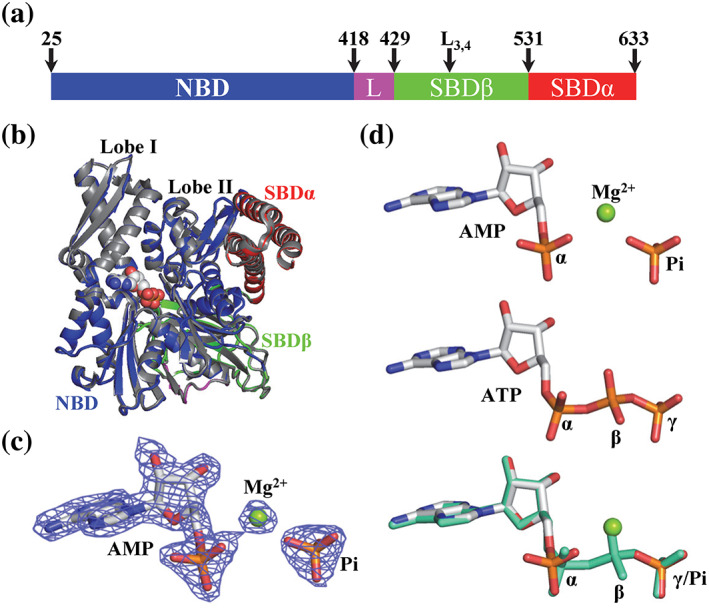
AMP is bound in the nucleotide‐binding pocket of a new Binding immunoglobin protein (BiP) crystal structure, BiP‐AMP. (a) Domain organization of BiP. The residue numbers at the domain boundaries and the L3,4 mutation are labeled on the top. L: the inter‐domain linker. (b) The overall structure of the new BiP‐AMP structure is almost identical to the previously published BiP‐ATP2 structure (PDB: 6ASY). The domain coloring of the BiP‐AMP structure is the same as in (a). The BiP‐ATP2 structure is in gray. The AMP and Pi in the BiP‐AMP structure were shown as spheres. The lobes I and II of the NBD are labeled. (c) The electron density for the bound AMP and Pi in the BiP‐AMP structure is well‐resolved. A 2Fo‐Fc map contoured at 2.0 sigma is shown as blue mesh. The AMP and Pi are shown as sticks and the bound Mg ion as a green ball. (d) Comparison of the AMP‐Pi in the BiP‐AMP structure with the ATP in the BiP‐ATP2 structure. Top: AMP‐Pi; Middle: ATP; bottom: superposition of AMP‐Pi (same color as the top panel) with ATP (green). The AMP‐Pi and ATP are shown as sticks and the bound Mg ion for AMP is highlighted as a green ball. The three phosphates in ATP are labeled as α, β, and γ. The α phosphate and free Pi are labeled as α and Pi, respectively
TABLE 1.
Data collection and refinement statistics
| BiP‐AMP | |
|---|---|
| Data collection a | |
| Space group | P1 |
| Cell dimension | |
| a, b, c (Å) | 75.988, 76.388, 79.917 |
| α, β, γ (°) | 84.881, 62.493, 63.17 |
| Wavelength (Å) | 0.979 |
| Resolution (Å) b | 50–2.00 (2.03–2.00) |
| R merge (%) b , c | 0.067 (0.367) |
| I/δ b | 16.4 (3.0) |
| Completeness (%) b | 97.2 (87.1) |
| Redundancy b | 1.9 (1.8) |
| cc1/2 b | 0.98 (0.76) |
| Refinement | |
| Resolution (Å) | 45.31–2.03 |
| No. reflections | 83,507 |
| R work/R free (%) | 17.43/22.32 |
| No. atoms | 10,811 |
| Protein | 9,586 |
| ATP | 46 |
| Water | 1,068 |
| Average B‐factors (Å2) | 32.90 |
| R.m.s. deviations | |
| Bond lengths (Å) | 0.010 |
| Bond angles (°) | 1.414 |
Abbreviation: BiP, Binding immunoglobin protein.
One crystal was used for the dataset.
Values in parentheses are for the highest‐resolution shell.
R merge = ∑|I ‐ < I > |/∑ I, where I is the integrated intensity of a given reflection.
Furthermore, like the BiP‐ATP2 structure (PDB: 6ASY), there are two molecules per asymmetric unit (Figure S1c). However, the relative position between the two protomers shifted significantly when compared to the BiP‐ATP2 structure. This shift is consistent with the difference in the unit cell dimensions observed above (Figure S1a). In both structures, only the NBDs form direct contacts between the two protomers. Relative to the BiP‐ATP2 structure, the NBDs in the BiP‐AMP structure slide relative to each other so that the SBDα subdomains are farther away from each other for the two protomers. The crystal contacts for each protomer remain largely similar for both structures.
2.2. BiP can hydrolyze ATP to AMP in solutions
To confirm this potential ATP to AMP hydrolysis observed in our BiP‐AMP crystal structure, we tested whether BiP can hydrolyze ATP to AMP in solutions using a single‐turnover ATPase assay. We first used the BiP‐L3,4 protein, our crystallization construct, and 20 °C, the crystallization temperature. Since AMP was observed for the crystals grown at pH 4.5 but not at pH 7.0, we tested a series of pH values ranging from 4.5 to 8.0. We used the protein concentrations at both the crystallization condition (10 mg/ml) and regular biochemical assays (1 mg/ml). Consistent with the crystallographic observation, at both protein concentrations, BiP hydrolyzed ATP to AMP robustly at pH 4.5 (Figure 2a,d, and Figure S3a). At 10 mg/ml, the AMP production was slightly faster than that of 1 mg/ml (Figure S3c). This AMP hydrolysis is due to the BiP protein since there is little ATP hydrolysis in the buffer control (Figure 2c,d). In contrast, little AMP was produced at and above pH 6.0 although ADP production was strong for all the pH conditions tested (Figure 2b,d,e and Figure S3a,b). At pH 5.0 and 5.5, there were significant AMP productions although both were weaker than that at pH 4.5. Between pH 4.5 and 5.5, the AMP production decreased significantly when pH increased. Moreover, the overall ATP hydrolysis rates (i.e., the combination of ADP and AMP hydrolysis) decreased with increasing pH (Figure 2f).
FIGURE 2.
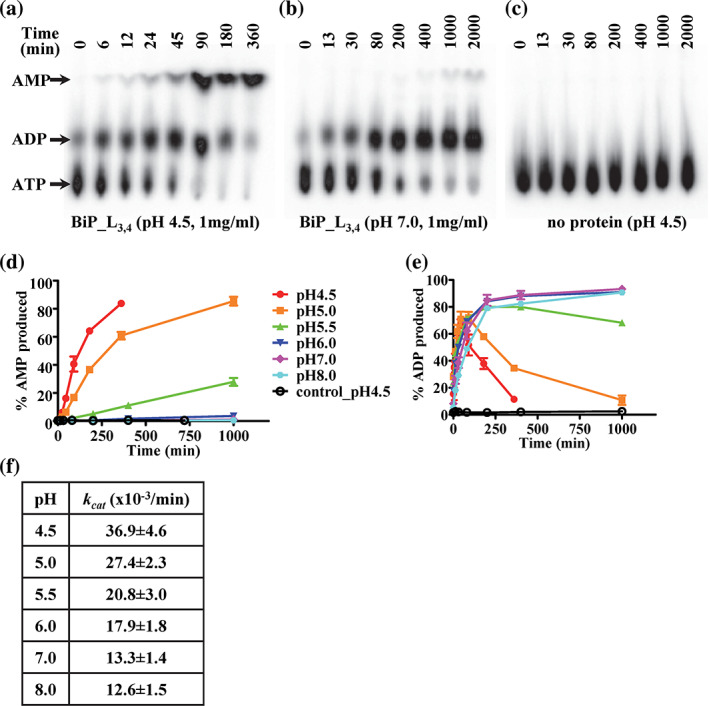
The Binding immunoglobin protein (BiP)‐L3,4 protein is able to hydrolyze ATP to AMP in solutions. (a–c) ATP is efficiently hydrolyzed to AMP by the BiP_L3,4 protein at pH 4.5 (a), but not pH 7.0 (b). Thin‐layer chromatography (TLC) plates were used to separate ATP, ADP, and AMP. The position of each nucleotide is indicated at the left. The time points for each reaction were labeled on the top of the TLC plates. (c) The no protein control for pH 4.5. (d,e) The ATP hydrolysis to AMP and ADP by the BiP_L3,4 protein (1 mg/ml) at a series of pH conditions. (d) AMP hydrolysis; (e) ADP hydrolysis. The pH values are labeled on the right in (d). control_pH 4.5: buffer only was used as a control for pH 4.5. The percentages of hydrolysis were plotted as a function of reaction time (mean ± SEM from three independent experiments with more than two different protein purifications). (f) The catalytic constants (k cat ) of the overall ATP hydrolysis by the BiP_L3,4 protein at 1 mg/ml. The k cat values were calculated by fitting data from (d) and (e) with a first‐order rate equation by nonlinear regression analysis. The summation of ADP and AMP produced was used for calculating the amount of overall ATP hydrolysis
When comparing the AMP production with the ADP amount during ATP hydrolysis at pH 4.5, ADP was first produced at the beginning of the time course of the reactions. Obvious ADP production was observed at the first time point of our reactions (6 min, Figures 2a and S3d). In contrast, AMP appeared at much later time points. AMP yield was only evident after 45 min incubation when ADP production almost reached maximum and only a small fraction of ATP was left. During the time course of the reaction, with the amount of AMP increasing, the amount of ADP decreased. These observations suggested that BiP first hydrolyzes ATP to ADP by removing the γ phosphate, and then removes the β phosphate from ADP to produce AMP.
After confirming the BiP‐L3,4 protein can hydrolyze ATP to AMP in solutions, we tested whether the wild‐type (WT) BiP has a similar activity. Based on Figure 2d, we focused on pH 4.5 using pH 7.0 as a control. A substantial hydrolysis to AMP was observed for the WT BiP protein at pH 4.5 although the hydrolysis rate to AMP for the WT BiP is significantly lower than that of the BiP‐L3,4 protein (Figure 3a). Consistent with the BiP‐L3,4 protein, there was little AMP production at pH 7.0 for the WT BiP protein. Both the WT and BiP‐L3,4 proteins hydrolyze ATP robustly (Figure 2b), and the overall ATP hydrolysis rates, the combination of the ATP hydrolysis to ADP and AMP, for the WT BiP protein were higher than those of the BiP‐L3,4 proteins to some extent (Figure S3e). Taken together, both the WT BiP and BiP‐L3,4 proteins hydrolyze ATP to AMP in solutions at the acidic conditions.
FIGURE 3.
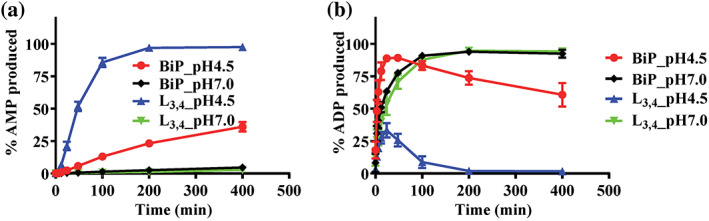
The wild‐type (WT) Binding immunoglobin protein (BiP) protein hydrolyzes ATP to AMP at a lower rate than that of the BiP_L3,4 protein. (a,b) The ATP hydrolysis to AMP and ADP, respectively. BiP: the WT BiP protein. L3,4: the BiP_L3,4 protein. pH 4.5 and 7.0 were tested. The data were presented as the percentages of AMP produced (mean ± SEM from more than three independent experiments using at least two different protein purifications)
2.3. The NBD–SBD contacts and allosteric coupling control the ATP to AMP hydrolysis by BiP
We characterized this newly discovered ATP to AMP hydrolysis biochemically. The above observation that the BiP‐L3,4 protein showed a significantly faster ATP hydrolysis to AMP than the WT BiP raised the possibility that the SBD and NBD–SBD contacts may have a role in this unique ATP to AMP hydrolysis since the L3,4 mutation is in the SBD. To test this hypothesis, we made two truncations: NBD alone (NBD) and NBD‐linker (NBDL) (Figure 4a). As shown in Figure 4b, neither NBD nor NBDL showed appreciable ATP to AMP hydrolysis although the ADP hydrolysis for both were robust (Figure S4a,c). Although surprisingly, this observation is consistent with our hypothesis. In fact, both the NBD and NBDL have much faster ATP to ADP hydrolysis rates than the full‐length BiP proteins, especially the NBDL truncation mutant. The fast ATP to ADP hydrolysis rate of the NBDL construct is consistent with the previous studies using DnaK that suggest the inter‐domain linker activates the ATPase activity. 44 , 58 , 59 However, the isolated NBD of DnaK has a similar ATPase rate as the full‐length protein whereas the ATPase rate of the isolated BiP NBD is about 10‐fold faster than that of the full‐length protein at pH 7.0 (Figures S3e and S4c), suggesting a significant difference in ATP hydrolysis by the isolated NBD between DnaK and BiP.
FIGURE 4.
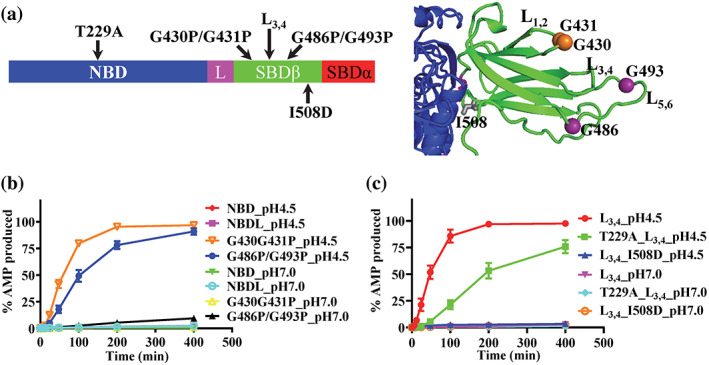
The nucleotide‐binding domain–substrate‐binding domain (NBD–SBD) contacts are required for the ATP to AMP hydrolysis by Binding immunoglobin protein (BiP). (a) The locations of the BiP mutations. Left, the BiP mutations were labeled in the domain organization of BiP. The domain coloring and labeling were the same as Figure 1a. Right, ribbon diagram of the BiP‐AMP structure. Only the SBDβ (green) and the part of the NBD (blue) forming contacts with SBDβ were shown. (b) The ATP hydrolysis to AMP was not observed without SBD but enhanced by the G430P/G431P and G486P/G493P mutations in the peptide‐binding site. (c) The T229A and I508D mutations compromised the ATP to AMP hydrolysis by BiP. For both (b) and (c), the AMP production was plotted over time at pH 4.5 and pH 7.0. Mean ± SEM from three independent experiments with more than two different protein purifications were used
Next, we tested whether any other mutations in the SBD besides the L3,4 modification can enhance the ATP to AMP hydrolysis by BiP. Besides affecting substrate binding, 38 , 56 , 60 a previous NMR study suggested that the L3,4 modification stabilizes the ATP‐bound conformation of the SBD. 61 Accordingly, we tested two mutations in the SBD that stabilize the ATP‐bound conformation: G430P/G431P and G486P/G493P 55 , 56 (Figure 4a). Interestingly, both mutations demonstrated a high ATP to AMP hydrolysis comparable to that of the BiP‐L3,4 protein (Figure 4b), further supporting an important role of the SBD in regulating this ATP to AMP hydrolysis by BiP.
To further confirm the role of NBD–SBD contacts in regulating the ATP to AMP hydrolysis by BiP, we introduced a I508D mutation to the BiP‐L3,4 protein. I508 is on the NBD–SBD interfaces (Figure 4a). Previous studies in DnaK demonstrated that I483D, an analogous mutation to BiP I508D, abolished the in vivo function of DnaK and disrupted the NBD–SBD contacts. 37 , 62 A significantly high rate of ATP hydrolysis to ADP was observed for the DnaK‐I483D mutant, supporting that the NBD–SBD contacts suppress the stimulation effect of the inter‐domain linker on the ATP hydrolysis. 37 , 59 , 62 Consistent with the DnaK results, the BiP‐L3,4‐I508D protein has a higher overall ATPase rate, supporting a disrupted NBD–SBD contact (Figure S4b,c). Interestingly, the ATP to AMP hydrolysis is almost completely abolished, supporting an essential role of the NBD–SBD contacts in regulating the ATP hydrolysis to AMP (Figure 4c).
Although regulated by the NBD–SBD contacts, the ATP to AMP hydrolysis must occur at the same site for the ADP hydrolysis in the NBD since the AMP molecule binds to the same site in the NBD as that of ATP (Figure 1b). In addition, based on the time courses shown in above figures, the hydrolysis to AMP is first through the hydrolysis to ADP. Then, mutations that affect the ADP hydrolysis must influence the ATP to AMP hydrolysis. To this end, we took advantage of the T229A mutation that has been shown to reduce the rate of ATP hydrolysis to ADP. 56 , 63 To see a robust hydrolysis to AMP, we put the T229A in the BiP‐L3,4 construct. As expected, this T229A mutation reduced the overall ATP hydrolysis at both pH 4.5 and 7.0 (Figure S4b,c). Consistent with our hypothesis, the hydrolysis to AMP is significant reduced for the T229A mutation (Figure 4c).
Taken together, this novel ATP to AMP hydrolysis by BiP is carried out by the NBD but is controlled by the NBD–SBD contacts.
2.4. Peptide substrate slows down the ATP hydrolysis to AMP whereas Hsp40 cochaperone has little influence
We tested how peptide substrate and Hsp40 cochaperone affect the ATP to AMP hydrolysis since both have been shown to stimulate the canonical ATP to ADP hydrolysis. 1 , 30 , 64 To test peptide substate, we used the NR peptide, a well‐characterized peptide substrate for Hsp70s. 36 Previously, we have shown that the NR peptide stimulated the ATP to ADP hydrolysis of BiP by more than 10 folds at 400 μM. 56 Unexpectedly, the NR peptide inhibited the ATP to AMP hydrolysis although the hydrolysis to ADP was stimulated at both pH 4.5 and 7 in our test for the WT BiP protein (Figures 5a and S5a,e). As a negative control, we tested the BiP‐L3,4 protein, which has shown little binding to the NR peptide. 56 Thus, we hypothesized that the NR peptide is not able to influence the ATP hydrolysis of the BiP‐L3,4 protein. As expected, neither the ATP to ADP nor ATP to AMP hydrolysis was affected appreciably by the NR peptide (Figure S5b,c,e), supporting the inhibiting effect of the NR peptide on the ATP hydrolysis to AMP by the WT BiP protein. The inhibition effect of the NR peptide is consistent with the low ATP to AMP hydrolysis rate observed for the WT BiP relative to the BiP‐L3,4 protein (Figure 3a). For the BiP‐L3,4 protein, we can achieve high purity with few contaminations. This is partially due to the lack of peptide substrate binding activity caused by the L3,4 mutation. However, the WT BiP protein binds peptide substrates with high affinities and it has been challenging to purify it without any significant contaminations. It is possible that the residual amount of the substrate contaminations in the purified WT BiP protein has already reduced the ATP to AMP hydrolysis as observed in our assay.
FIGURE 5.
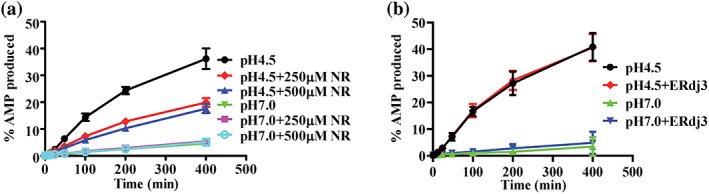
The influences of peptide substrate and ERdj3 on the ATP to AMP hydrolysis of Binding immunoglobin protein (BiP). (a) The NR peptide inhibits the ATP to AMP hydrolysis by BiP. The ATP hydrolysis to AMP by the wild‐type (WT) BiP protein was analyzed at pH 4.5 and pH 7.0 in the absence or presence of two different concentrations of the NR peptide (250 and 500 μM). Each data point was mean ± SEM from three independent experiments using more than two different protein purifications. (b) The Hsp40 cochaperone ERdj3 showed little influence on the ATP to AMP hydrolysis of BiP. The hydrolysis to AMP by the WT BiP protein was assayed in the presence of ERdj3 at pH 4.5 and 7.0. The data were presented as mean ± SD from three independent experiments using at least two different protein purifications)
There are about seven known Hsp40 cochaperones in the ER for BiP. 20 Among these Hsp40s, ERdj3 is the major Hsp40 cochaperone essential for assisting BiP in protein folding in the ER. Previous studies have shown that ERdj3 stimulates the ATP to ADP hydrolysis of BiP robustly. 56 , 65 Consistent with these observations, ERdj3 showed a significant stimulation on the ATP to ADP hydrolysis by BiP at pH 7.0 (Figure S5d,e). In contrast, little stimulation was observed for the AMP hydrolysis (Figure 5b). Interestingly, little effect on the hydrolysis from ATP to ADP was observed at pH 4.5 either. Taken together, the peptide substrate and Hsp40 cochaperone influence the AMP hydrolysis differently from the ADP hydrolysis.
2.5. Hydrolysis to AMP is unique to BiP, not conserved in other Hsp70s
We tested whether the hydrolysis of ATP to AMP at the acidic conditions is a general feature for Hsp70s. We tested two representative Hsp70s: DnaK from Escherichia coli and the human cytosolic Hsp70 (hHsp70). As the major Hsp70 in E. coli, DnaK not only represents prokaryotic Hsp70s, but also is a well‐studied model for Hsp70s in general. The hHsp70 is a representative for the eukaryotic Hsp70s in the cytosol. We have purified both the WT and the corresponding proteins with the L3,4 modification. As shown in Figure 6a,b, at both pH conditions tested, little AMP was observed for any of these Hsp70 proteins although strong ADP hydrolysis was observed for all these proteins as expected (Figure S6). Taken together, these data suggested that the ATP hydrolysis to AMP is special for the BiP protein, not conserved in Hsp70s in general.
FIGURE 6.
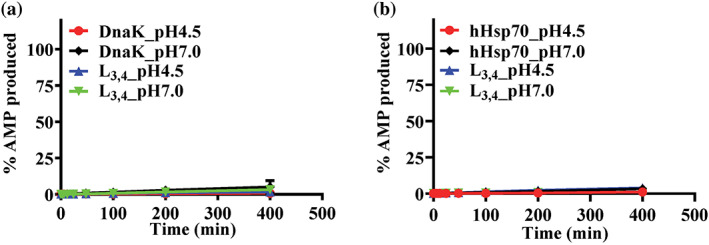
The ATP to AMP hydrolysis is not conserved in either DnaK or hHsp70. (a,b) Little hydrolysis to AMP was observed for DnaK (a) and hHsp70 (b). Both the wild‐type (WT) and corresponding L3,4 mutant proteins were tested. In (a), DnaK: the WT DnaK protein; L3,4: the DnaK protein carrying an analogous L3,4 mutation. In (b), hHsp70: the WT hHsp70 protein; L3,4: the hHsp70 protein carrying an analogous L3,4 mutation. The data were presented as the percentage of AMP produced (mean ± SEM from more than three independent experiments using at least two different protein purifications)
2.6. AMP has little influence on peptide substrate binding while low pH drastically speeds up the kinetics of peptide substrate binding to BiP but not DnaK
It is well established that Hsp70s have a high affinity for peptide substrates with slow kinetics in the nucleotide‐free (Apo) or ADP‐bound state. 30 , 31 In contrast, ATP binding drastically speeds up the kinetics for peptide substrate binding whereas the binding affinity is reduced by about two to three orders of magnitude. Since we have discovered that BiP hydrolyzes ATP to AMP only under the acidic conditions, we tested how AMP influences the peptide substrate binding affinity and kinetics at both pH 4.5 and 7.0. Consistent with previous studies, at both pH conditions, BiP binds the NR peptide with high affinities in the absence of nucleotide or in the presence of ADP; in contrast, the affinity decreased by more than 10 times when ATP was included in the assays (Table 2 and Figure S7a,b). In addition, ATP significantly enhanced the binding kinetics of BiP (Table 3 and Figure S8a,b). Interestingly, the binding kinetics at pH 4.5 were much faster than those at pH 7.0 (Table 3). The binding kinetics in the Apo state for pH 4.5 was almost 100 times faster than that of the Apo state at pH 7.0, even faster than that in the presence of ATP at pH 7.0. The binding in the presence of ATP at pH 4.5 was so fast that it exceeds the detection limit of our instrument. Despite this interesting difference between pH 4.5 and pH 7.0, AMP showed no appreciable influence on either the binding affinity or kinetics for the NR peptide at both pH conditions although we consistently observed slightly reduced kinetics in the presence of AMP.
TABLE 2.
The peptide binding affinities of BiP and DnaK
| K d (μM) | ||||
|---|---|---|---|---|
| BiP | DnaK | |||
| pH 4.5 | pH 7.0 | pH 4.5 | pH 7.0 | |
| ATP | 7.3 ± 0.3 | 10.4 ± 0.5 | 4.0 ± 0.2 | 13.9 ± 1.1 |
| ADP | 0.60 ± 0.02 | 0.40 ± 0.02 | 2.7 ± 0.1 | 0.44 ± 0.02 |
| AMP | 0.55 ± 0.02 | 0.57 ± 0.03 | 2.8 ± 0.1 | 0.52 ± 0.02 |
| Apo | 0.67 ± 0.02 | 0.56 ± 0.03 | 4.8 ± 0.2 | 0.47 ± 0.03 |
Note: The binding affinities (K d ) of peptide substrate for BiP and DnaK in the presence of different adenine nucleotides were determined at pH 4.5 and 7.0. The fluorescence polarization assay was carried out using the NR peptide labeled with fluorescein. The peptide binding in the absence of nucleotide was used as a control (Apo). The corresponding binding curves are shown in Figure S7. The K d values were mean ± SEM from two independent experiments with three parallel measurements for each experiment.
Abbreviation: BiP, Binding immunoglobin protein.
TABLE 3.
The binding kinetics of BiP and DnaK for the NR peptide
| k obs (×10−3/s) | ||||
|---|---|---|---|---|
| BiP | DnaK | |||
| pH 4.5 | pH 7.0 | pH 4.5 | pH 7.0 | |
| ATP | ND | 6.759 ± 0.218 | ND | ND |
| ADP | 81.0 ± 4.8 | 0.693 ± 0.018 | 12.5 ± 1.4 | 9.25 ± 1.14 |
| AMP | 35.1 ± 6.7 | 0.576 ± 0.007 | 7.51 ± 0.45 | 6.30 ± 0.52 |
| Apo | 55.6 ± 5.8 | 0.628 ± 0.055 | 20.0 ± 3.3 | 5.62 ± 0.44 |
Note: The binding kinetics (k obs ) were determined using the fluorescence polarization assay with the NR peptide labeled with fluorescein at two different pH conditions, 4.5 and 7.0. The binding in the absence of nucleotide was used as a control (Apo). ND: not determined due to the kinetics were too fast to calculate for our instrument. The k obs values were mean ± SEM determined from three independent experiments using more than two different protein purifications. One representative of the corresponding binding curves for each condition was shown in Figure S8.
Abbreviation: BiP, Binding immunoglobin protein.
Next, we tested whether this pH effect on the peptide substrate binding is conserved in DnaK. Like BiP, AMP has no appreciable influence on either the affinity or kinetics of DnaK binding to the NR peptide (Tables 2 and 3, Figures S7c,d and S8c,d). This is consistent with the tryptophan fluorescence results (Figure S9). DnaK has a single tryptophan in the NBD, Trp102. It is well‐established that ATP binding induces a close domain coupling in DnaK. 1 , 33 , 34 , 38 , 39 , 66 This results in a blue shift and decrease of intensity for the intrinsic fluorescence spectrum of Trp102 relative to the Apo and ADP‐bound states. 33 In the presence of AMP, the fluorescence spectra of DnaK behaved like that of the Apo state, suggesting that the AMP‐bound state shares a similar conformation as that of the Apo and ADP‐bound states. Intriguingly, the affinity of DnaK for the NR peptide showed little sensitivity to ATP at pH 4.5 although at pH 7.0, the ATP sensitivity is similar to that of BiP. In addition, the kinetics of the NR binding to DnaK showed limited difference between pH 4.5 and pH 7.0. Thus, BiP and DnaK response differently to pH 4.5. This is consistent with their difference in the ATP hydrolysis to AMP at pH 4.5.
3. DISCUSSION
In this study, we have discovered a novel and unique ATP hydrolysis to AMP by BiP. This is an intriguing biochemical property for BiP. Several aspects of this ATP to AMP hydrolysis are unique. First, this ATP to AMP hydrolysis occurs only at the acidic conditions for BiP. Second, the SBD and functional NBD–SBD contacts are required for this ATP hydrolysis to AMP whereas the NBD itself shows little activity. Third, peptide substrate inhibits this ATP to AMP hydrolysis whereas Hsp40 cochaperone ERdj3 has little impact on it. These properties are different from the classic and well‐established ATP to ADP hydrolysis by Hsp70s, which occurs at all the pH conditions tested. In addition, the NBD itself has a significant ADP hydrolysis activity, normally close to that of the full‐length Hsp70s. 44 , 58 , 59 The inter‐domain linker stimulates the ADP hydrolysis, whereas the SBD suppresses the stimulation effect of the inter‐domain linker. Both peptide substrates and Hsp40s enhance the ADP hydrolysis drastically. 1 , 3 , 4
One of the key questions on this unique ATP to AMP hydrolysis is: when and where does BiP hydrolyze ATP to AMP inside our cells? It is well‐established that BiP is an essential Hsp70 in the ER and plays a key role in all known processes of the ER functions. 14 , 15 , 16 , 17 , 18 , 19 , 20 However, the pH of the ER is normally around 7.2. At this pH, little ATP to AMP hydrolysis was observed for BiP by itself in our biochemical assays. Thus, it seems that the chance for BiP to hydrolyze ATP to AMP by itself is low in the ER. It is possible other unknown cellular factors may be able to facilitate the ATP to AMP hydrolysis of BiP at the neutral pH of the ER. Posttranslational modifications may also play a role since Hsp70s including BiP has been shown to be regulated by various posttranslational modifications such as AMPylation which influences the conformation of BiP. 28 , 67 , 68 Importantly, the cellular locations of BiP are not limited to the ER. 21 , 22 , 23 , 24 BiP has been found on the cell surface and secreted outside the cells. The pH of the secretory pathway is progressively acidic, normally from 6.7 to 5.2. 69 In our biochemical tests, a significant amount of ATP hydrolysis to AMP was observed between pH 4.5 and 5.5. Thus, it is possible that the ATP to AMP hydrolysis by BiP can occur when BiP goes through the secretory pathway to be expressed on the cell surface or outside the cells. Moreover, the microenvironment of many cancers normally results in acidosis and glucose starvation. The expression of BiP is induced by glucose starvation and this is reason why it was also named as 78‐kDa glucose‐regulated protein (GRP78). 18 , 25 The increased level of BiP in combination with acidosis in cancers may increase the chance of the AMP hydrolysis by BiP. Thus, this novel ATP to AMP hydrolysis may have more pronounced effects in cancer cells than normal cells. Since it seems that the cell surface and secreted BiP proteins have the best chance to hydrolyze ATP to AMP during the secretory pathway, some of these BiP molecules may bind AMP. It is possible that this BiP‐AMP complex may be important for the signaling function of BiP outside the cells, especially for cancer cells. 70 , 71
Our biochemical analysis suggested that the peptide substrate binding to BiP inhibits this unique ATP to AMP hydrolysis. Thus, this ATP hydrolysis to AMP by BiP most likely is influenced by the ER stress levels. This is because the ER stresses directly correlate with the level of unfolded proteins, the polypeptide substrates for BiP. Under the ER stresses when there are abundant polypeptide substrates for BiP, this AMP hydrolysis may be quite low. In contrast, in the absence of the ER stresses, this AMP hydrolysis most likely is more pronouncing. Especially at the end of the ER stresses, the protein level of BiP is still high, but the level of the unfolded proteins, which are substrates for BiP, is low. This condition seems to be best suited for the ATP to AMP hydrolysis by BiP based on our biochemical results.
Another intriguing question is: how does BiP hydrolyze ATP to AMP mechanistically? The properties of the ATP hydrolysis to AMP by BiP are different from those of the classic ATP to ADP hydrolysis. Based on our structural and biochemical analysis, this ATP hydrolysis to AMP is carried out by the NBD. However, NBD alone is not enough. It requires the SBD and functional NBD–SBD contacts. In contrast, the NBD alone is sufficient for the canonical ATP to ADP hydrolysis. Moreover, mutations that stabilize the NBD–SBD contacts including L3,4, G430P/G431P, and G486P/G493P enhance this ATP to AMP hydrolysis, whereas the ATP to ADP hydrolysis rates for these mutations are lower than that of the WT BiP. In addition, peptide substrate binding inhibits this ATP hydrolysis to AMP, but stimulates the ATP to ADP hydrolysis. The binding of peptide substrate destabilizes the NBD–SBD contacts, further supporting the importance of the NBD–SBD contacts for this ATP to AMP hydrolysis. Consistent with the important role of the NBD–SBD contacts on regulating the ATPase activity of Hsp70s, recent studies suggest that the ATPase activity of Hsp110s, distant homologs of Hsp70s, are tightly suppressed by the NBD–SBD contacts. 72 , 73 All these differences between the ATP to ADP and ATP to AMP hydrolysis suggest different mechanisms for these two types of ATP hydrolysis. The mechanism by which the NBD–SBD contacts facilitate this ATP to AMP hydrolysis remains to be explored. Furthermore, this hydrolysis to AMP is unique to BiP. It is a mystery where BiP is different from other Hsp70s that results in this unique ATP to AMP hydrolysis. Hsp70s are highly conserved in sequence and structure. All the classic Hsp70 structures in complex with ATP have revealed an essentially same overall and NBD conformations with almost identical NBD–SBD contacts. 5 , 34 , 38 , 39 , 55 , 56 It is possible that some subtle differences between BiP and other Hsp70s account for this unique ATP to AMP hydrolysis. In the NBD, there are 24 residues forming direct contacts with the bound ATP (Figure S10). 38 Except 3 residues, all the rest 21 residues are identical among all Hsp70s aligned. Even for the 3 residues that are not identical among Hsp70s, BiP shares the same residues with the hHsp70. Thus, it seems that the ATP contacting residues are most likely not the cause of the ATP to AMP hydrolysis for BiP. Consistent with this hypothesis, there is little hydrolysis to AMP by either the isolated NBD or the NBDL construct of BiP. One unique feature about BiP is: the isolated NBD of BiP has a much higher ATPase activity than the full‐length BiP, about 10‐fold higher at pH 7.0 (Figures S3e and S4c). This is different from DnaK, whose NBD has a similar ATPase activity as the full‐length protein. 44 , 58 , 59 This difference in NBD may partially contribute to this unique ATP hydrolysis to AMP while the NBD–SBD contacts most likely hold the key for ultimately releasing this ATP to AMP hydrolysis activity by BiP under the acidic conditions. Consistent with this hypothesis, pH 4.5 drastically speeds up the peptide substrate binding kinetics of BiP but not DnaK, supporting differences in the mechanism of the NBD–SBD contacts at pH 4.5 between BiP and DnaK. Another possibility could be the unique crystallographic dimer in the BiP‐AMP structure. In the two published DnaK‐ATP structures, DnaK packs as a similar crystallographic dimer. 38 , 39 The NBDs form extensive contacts while the SBDα from one protomer docks on the side of the NBD of the other protomer. This dimer arrangement was confirmed by disulfide bond formation in solution. 74 Our previously published BiP‐ATP structure showed a similar dimer as the DnaK dimer. 56 In contrast, the dimer arrangements in the BiP‐AMP and BiP‐ATP2 structures are quite different from the DnaK dimer. 55 As described above, only the NBDs form contacts whereas the SBDα does not touch the other protomer. This special dimer arrangement in combination with low pH may tweak the conformation of the NBD enough to position for the unique ADP to AMP hydrolysis for BiP after the canonical ATP to ADP hydrolysis.
4. MATERIALS AND METHODS
4.1. Protein expression and purification
The crystallization construct of BiP (BiP‐L3,4) was essentially the same as described before. 55 Briefly, the ORF of BiP corresponding to residues 25 to 633 was amplified using PCR and cloned into a pSMT3 vector (a generous gift from Dr Chris Lima). 75 The L3,4 modification (sequence change: TASDNQP → VGG) was introduced using the QuikChange Site‐Directed Mutagenesis Kit (Stratagene). The resulting construct was confirmed using DNA sequencing. BiP‐L3,4 was expressed as a Smt3 fusion protein with a His6 tag at the N‐terminus. After transforming into E. coli BL21(DE3) Gold competent cells, induction of expression was carried out in Luria–Bertani medium with 1 mM IPTG at 30 °C for 6 hr after the OD at 600 nm reached 0.6. The cell pellet was resuspended in lysis buffer (25 mM Hepes‐KOH, pH 7.5, 300 mM NaCl, 10% glycerol, and 1 mM TCEP). After breaking open the cells using sonication, the cell lysate was clarified by centrifugation and loaded onto a 5 ml HisTrap column. Elution was carried out with a linear gradient of 30–240 mM imidazole, and the fractions containing the His6‐Smt3‐BiP‐L3,4 fusion protein was pooled and dialyzed in the lysis buffer. To remove the Hi6‐Smt3 tag, the fusion protein was incubated with the Ulp1 protease for an overnight. The resulting BiP‐L3,4 protein was separated from the His6‐Smt3 tag on a second HisTrap column, and further purified using a 5 ml HiTrap Q and Superdex 200 16/600. All the columns are from GE Healthcare Life Sciences and all the purification steps were carried out at 4 °C. The purified BiP‐L3,4 protein was concentrated to ~30 mg/ml in a buffer containing 5 mM Hepes‐KOH, pH 7.5, and 10 mM KCl, and flash frozen in liquid nitrogen. All the BiP proteins used for biochemical assays were cloned, expressed, and purified essentially the same way as the BiP‐L3,4 protein except for removing the Superdex 200 16/600 step.
The DnaK proteins were expressed and purified as described previously. 38 , 76 Briefly, the DnaK proteins were expressed with a His6 tag at the C‐terminus using the pBB46 plasmid (amp R ) in the dnak deletion strain BB205 (cam R kan R ) at 30 °C with 1 mM IPTG. Purification was carried out using a HisTrap column followed by a HiTrap Q column using buffers containing 25 mM Hepes‐KOH, pH 7.5, and 1 mM DTT. For the purification of the hHsp70 proteins, the ORF of hHsp70 was cloned into the pSMT3 vector, expressed and purified the same way as the BiP‐L3,4 protein without the Superdex 200 16/600 step. To purify ERdj3, the ORF of ERdj3 without the signal sequence (the first 22 a.a.) was cloned into the pSMT3 vector and expressed as a His6‐Smt3‐ERdj3‐BCCP fusion. The ERdj3 ORF was a generous gift from Dr. Linda Hendershot. 65 Expression and purification were carried out in a similar way as the BiP‐L3,4 protein.
All the purified proteins were concentrated to >10 mg/ml, flash frozen in liquid nitrogen and stored in −80 °C freezer.
4.2. Crystallization and structure determination
The BiP‐L3,4 crystals for the BiP‐AMP structure were grown in the almost identical condition as that of the BiP‐ATP2 structure 55 except that the pH for the crystallization and cryoprotectant conditions was 4.5. Briefly, the purified BiP‐L3,4 protein was diluted to 10 mg/ml using a buffer containing 5 mM Hepes‐KOH, pH 7.5, 10 mM KCl, 5 mM Mg(OAc)2, and 2 mM ATP. Crystals were grown at 20 °C using a hanging‐drop vapor diffusion method. The mother liquor for crystallization contained 18–22% PEG 1000, 0.1 M phosphate citrate, pH 4.5, 0.2 M Li2SO4, and 2% (wt/vol) dioxane. Single crystals were obtained through micro‐seeding, and cryoprotected with 15% MPD in the mother liquor without adding ATP. After flash frozen in liquid nitrogen, crystals were brought to the Beamline X4C of the Brookhaven National Laboratory and a native diffraction data set was collected at 2.03 Å. HKL2000 was used for data indexing, integration, and scaling. Molecular replacement with Phaser was carried out to obtain a structure solution using the previously solved BiP‐ATP2 structure (PDB code: 6ASY) as a search model. Refinement was carried out using Phenix and Refmac.
4.3. Single‐turnover ATPase assay for determining ATP hydrolysis to ADP and AMP
The assay was carried out as described previously with some modifications. 55 , 56 Briefly, the Hsp70‐ATP complexes were formed after incubating Hsp70 proteins with [α‐32P] ATP (NEG503H250UC, 3,000 Ci/mmol; Perkin Elmer) for 2 min on ice in the ATPase buffer (10 mM buffers with different pH, 150 mM KOAc, 10 mM Mg(OAc)2, and 1 mM DTT). The buffers are: phosphate citrate for pH 4.5, 5.0, and 5.5; MES for pH 6.0 and 6.5; Hepes for pH 7.0; Tris for pH 8.0. After the free ATP was removed by a rapid gel filtration on G‐50 micro columns (GE Healthcare), the complexes were aliquoted, and flash frozen in liquid nitrogen. The ATPase assay was started by mixing equal volumes of the Hsp70‐ATP complexes with either buffer or ERdj3 or the NR peptide at the indicated concentrations. After incubating at 20 °C (for the initial pH tests on the BiP‐L3,4 protein) or 25 °C (for the rest assays in order to speed up reactions and shorten incubation times) as indicated, aliquots of 3 μl were withdrawn from each reaction at the indicated time points and added to 1 μl stop solution (4 M formic acid, 2 M LiCl, and 1 mM ATP) to stop the hydrolysis reaction. After mixing well, 1 μl of the stopped reactions were spotted onto PEI‐cellulose thin‐layer chromatography plates (Sigma‐Aldrich) and the nucleotides were separated using a mobile phase containing 1 M formic acid and 0.5 M LiCl. The amounts of the radioactive ATP, ADP, and AMP were visualized and quantified with a Typhoon phosphorimaging system (GE Healthcare). The rate of ATP hydrolysis (k cat ) was calculated using a first‐order rate equation by nonlinear regression with Prism (GraphPad). All results were averaged from more than three independent experiments with at least two different protein purifications.
4.4. Fluorescence polarization assay for measuring peptide substrate binding
The F‐NR peptide, the NR peptide labeled with fluorescein at the N‐terminus, was ordered from NEOBioscience (at >95% purity). The sequence of the NR peptide is NRLLLTG. The concentration of the NR peptide was determined based on the extinction coefficient of the fluorescein label. To determine peptide binding affinity, fluorescence polarization measurements were performed as described previously with some modifications. 55 , 56 Briefly, serial dilutions of BiP and DnaK proteins were incubated with a 20 nM concentration of the F‐NR in buffer D (25 mM phosphate citrate, pH 4.5, 150 mM KOAc, 10 mM Mg(OAc)2, 10% glycerol, and 1 mM DTT) for pH 4.5 or buffer E (25 mM Hepes, pH 7.0, 150 mM KOAc, 10 mM Mg(OAc)2, 10% glycerol, and 1 mM DTT) for pH 7.0. After the binding reached equilibrium, fluorescence polarization measurements were performed on a Beacon Fluorescence Polarization system (Invitrogen). Fluorescence polarization values were expressed in millipolarization (mP) units. Binding data analyses were performed using GraphPad Prism software and fitted to a one‐site binding equation to calculate dissociation constants (K d ).
For the kinetics analysis, we first diluted the BiP and DnaK protein to 20 μM with buffer D or E either with AMP or ADP or ATP or no nucleotide. Following an incubation for 2 min to allow nucleotide binding, the F‐NR peptide (final concentration of 20 nM) was quickly added to start binding, and fluorescence polarization measurements were recorded every 30 or 10 s to track binding. All the binding assays were repeated at least three times with more than two different protein preparations.
4.5. Tryptophan fluorescence assay for conformational changes in DnaK
The assay was performed as described previously with some modifications. 38 , 76 Briefly, purified DnaK protein was diluted in buffer D or E to a final concentration of 1 μM. ATP, ADP, or AMP was added. The final concentration of ATP was 2 mM. To prevent any significant contamination of ATP, ADP, and AMP were included at the final concentration of 50 μM. After incubating for 2 min at room temperature, fluorescence spectra were collected from 310 to 400 nm with excitation at 295 nm. All the spectra were collected on a PC1 Photon Counting Spectrofluorimeter from ISS Inc (Champaign, IL).
CONFLICT OF INTEREST
The authors declare no potential conflicts of interest.
AUTHOR CONTRIBUTIONS
Hongtao Li: Data curation (equal); formal analysis (lead); investigation (lead); methodology (lead); validation (equal); writing – review and editing (equal). Faik N. Musayev: Data curation (equal); formal analysis (equal); investigation (equal); validation (equal); writing – review and editing (equal). Jiao Yang: Data curation (equal); formal analysis (equal); investigation (equal); writing – review and editing (supporting). Jiayue Su: Data curation (supporting); investigation (supporting); writing – review and editing (supporting). Qingdai Liu: Data curation (supporting); investigation (supporting); writing – review and editing (supporting). Wei Wang: Investigation (supporting); writing – review and editing (supporting). Xianjun Fang: Data curation (supporting); investigation (supporting); writing – review and editing (supporting). Lei Zhou: Data curation (equal); formal analysis (equal); funding acquisition (equal); supervision (equal); writing – review and editing (equal). Qinglian Liu: Conceptualization (lead); data curation (lead); formal analysis (lead); funding acquisition (lead); project administration (lead); supervision (lead); methodology (lead); writing – original draft (lead); writing – review & editing (lead).
Supporting information
Appendix S1: Supporting Information
ACKNOWLEDGMENTS
The authors thank Dr. Linda Hendershot for suggestions, and staffs at the Beamline X4A and X4C of the Brookhaven National Laboratory (Qun Liu, John Schwanof, Randy Abramowitz, and Xiaochun Yang) for assisting collection of diffraction data. This work was supported by NIH (R01GM098592 and R21AI140006 to Qinglian. L.), VETAR award from VCU (to Qinglian. L.), and American Heart Association (17GRNT33660506 to Qinglian. L.). Drs. W. W. and X. F. are supported by NIH/NCI (R01CA229812).
Li H, Musayev FN, Yang J, Su J, Liu Q, Wang W, et al. A novel and unique ATP hydrolysis to AMP by a human Hsp70 Binding immunoglobin protein (BiP). Protein Science. 2022;31:797–810. 10.1002/pro.4267
Funding information American Heart Association, Grant/Award Number: 17GRNT33660506; Center for Strategic Scientific Initiatives, National Cancer Institute, Grant/Award Number: R01CA229812; Division of Intramural Research, National Institute of Allergy and Infectious Diseases, Grant/Award Number: R21AI140006; National Institute of General Medical Sciences, Grant/Award Number: R01GM098592; Virginia Commonwealth University
DATA AVAILABILITY STATEMENT
Atomic coordinates and structure factors have been deposited in the RSCB Protein Data Bank under the accession number 7N1R. The data that support the findings of this study are available from the corresponding author upon request.
REFERENCES
- 1. Mayer MP, Bukau B. Hsp70 chaperones: Cellular functions and molecular mechanism. Cell Mol Life Sci. 2005;62:670–684. [DOI] [PMC free article] [PubMed] [Google Scholar]
- 2. Brodsky JL, Chiosis G. Hsp70 molecular chaperones: Emerging roles in human disease and identification of small molecule modulators. Curr Top Med Chem. 2006;6:1215–1225. [DOI] [PubMed] [Google Scholar]
- 3. Young JC. Mechanisms of the Hsp70 chaperone system. Biochem Cell Biol. 2010;88:291–300. [DOI] [PMC free article] [PubMed] [Google Scholar]
- 4. Rosenzweig R, Nillegoda NB, Mayer MP, Bukau B. The Hsp70 chaperone network. Nat Rev Mol Cell Biol. 2019;20:665–680. [DOI] [PubMed] [Google Scholar]
- 5. Liu Q, Liang C, Zhou L. Structural and functional analysis of the Hsp70/Hsp40 chaperone system. Protein Sci. 2020;29:378–390. [DOI] [PMC free article] [PubMed] [Google Scholar]
- 6. Balchin D, Hayer‐Hartl M, Hartl FU. In vivo aspects of protein folding and quality control. Science. 2016;353:aac4354. [DOI] [PubMed] [Google Scholar]
- 7. Assimon VA, Gillies AT, Rauch JN, Gestwicki JE. Hsp70 protein complexes as drug targets. Curr Pharm Des. 2013;19:404–417. [DOI] [PMC free article] [PubMed] [Google Scholar]
- 8. Bukau B, Weissman J, Horwich A. Molecular chaperones and protein quality control. Cell. 2006;125:443–451. [DOI] [PubMed] [Google Scholar]
- 9. Clerico EM, Meng W, Pozhidaeva A, Bhasne K, Petridis C, Gierasch LM. Hsp70 molecular chaperones: Multifunctional allosteric holding and unfolding machines. Biochem J. 2019;476:1653–1677. [DOI] [PMC free article] [PubMed] [Google Scholar]
- 10. Fernandez‐Fernandez MR, Valpuesta JM. Hsp70 chaperone: A master player in protein homeostasis. F1000Res. 2018;7:1–10. [DOI] [PMC free article] [PubMed] [Google Scholar]
- 11. Craig EA. Hsp70 at the membrane: Driving protein translocation. BMC Biol. 2018;16:11. [DOI] [PMC free article] [PubMed] [Google Scholar]
- 12. Zuiderweg ER, Hightower LE, Gestwicki JE. The remarkable multivalency of the Hsp70 chaperones. Cell Stress Chaperones. 2017;22:173–189. [DOI] [PMC free article] [PubMed] [Google Scholar]
- 13. Radons J. The human HSP70 family of chaperones: Where do we stand? Cell Stress Chaperones. 2016;21:379–404. [DOI] [PMC free article] [PubMed] [Google Scholar]
- 14. Hammond C, Helenius A. Quality control in the secretory pathway. Curr Opin Cell Biol. 1995;7:523–529. [DOI] [PubMed] [Google Scholar]
- 15. Hendershot LM. The ER function BiP is a master regulator of ER function. Mt Sinai J Med. 2004;71:289–297. [PubMed] [Google Scholar]
- 16. Dudek J, Benedix J, Cappel S, et al. Functions and pathologies of BiP and its interaction partners. Cell Mol Life Sci. 2009;66:1556–1569. [DOI] [PMC free article] [PubMed] [Google Scholar]
- 17. Haas IG, Wabl M. Immunoglobulin heavy chain binding protein. Nature. 1983;306:387–389. [DOI] [PubMed] [Google Scholar]
- 18. Munro S, Pelham HR. An Hsp70‐like protein in the ER: Identity with the 78 kd glucose‐regulated protein and immunoglobulin heavy chain binding protein. Cell. 1986;46:291–300. [DOI] [PubMed] [Google Scholar]
- 19. Brodsky JL, Skach WR. Protein folding and quality control in the endoplasmic reticulum: Recent lessons from yeast and mammalian cell systems. Curr Opin Cell Biol. 2011;23:464–475. [DOI] [PMC free article] [PubMed] [Google Scholar]
- 20. Pobre KFR, Poet GJ, Hendershot LM. The endoplasmic reticulum (ER) chaperone BiP is a master regulator of ER functions: Getting by with a little help from ERdj friends. J Biol Chem. 2019;294:2098–2108. [DOI] [PMC free article] [PubMed] [Google Scholar]
- 21. Misra UK, Deedwania R, Pizzo SV. Activation and cross‐talk between Akt, NF‐kappaB, and unfolded protein response signaling in 1‐LN prostate cancer cells consequent to ligation of cell surface‐associated GRP78. J Biol Chem. 2006;281:13694–13707. [DOI] [PubMed] [Google Scholar]
- 22. Lee AS. GRP78 induction in cancer: Therapeutic and prognostic implications. Cancer Res. 2007;67:3496–3499. [DOI] [PubMed] [Google Scholar]
- 23. Ma Y, Hendershot LM. The role of the unfolded protein response in tumour development: Friend or foe? Nat Rev Cancer. 2004;4:966–977. [DOI] [PubMed] [Google Scholar]
- 24. Farshbaf M, Khosroushahi AY, Mojarad‐Jabali S, Zarebkohan A, Valizadeh H, Walker PR. Cell surface GRP78: An emerging imaging marker and therapeutic target for cancer. J Control Release. 2020;328:932–941. [DOI] [PubMed] [Google Scholar]
- 25. Shiu RP, Pouyssegur J, Pastan I. Glucose depletion accounts for the induction of two transformation‐sensitive membrane proteinsin Rous sarcoma virus‐transformed chick embryo fibroblasts. Proc Natl Acad Sci U S A. 1977;74:3840–3844. [DOI] [PMC free article] [PubMed] [Google Scholar]
- 26. Preissler S, Rato C, Perera L, Saudek V, Ron D. FICD acts bifunctionally to AMPylate and de‐AMPylate the endoplasmic reticulum chaperone BiP. Nat Struct Mol Biol. 2017;24:23–29. [DOI] [PMC free article] [PubMed] [Google Scholar]
- 27. Chambers JE, Petrova K, Tomba G, Vendruscolo M, Ron D. ADP ribosylation adapts an ER chaperone response to short‐term fluctuations in unfolded protein load. J Cell Biol. 2012;198:371–385. [DOI] [PMC free article] [PubMed] [Google Scholar]
- 28. Nitika, Porter CM, Truman AW, Truttmann MC. Post‐translational modifications of Hsp70 family proteins: Expanding the chaperone code. J Biol Chem. 2020;295:10689–10708. [DOI] [PMC free article] [PubMed] [Google Scholar]
- 29. Boorstein WR, Ziegelhoffer T, Craig EA. Molecular evolution of the HSP70 multigene family. J Mol Evol. 1994;38:1–17. [DOI] [PubMed] [Google Scholar]
- 30. Flynn GC, Chappell TG, Rothman JE. Peptide binding and release by proteins implicated as catalysts of protein assembly. Science. 1989;245:385–390. [DOI] [PubMed] [Google Scholar]
- 31. Schmid D, Baici A, Gehring H, Christen P. Kinetics of molecular chaperone action. Science. 1994;263:971–973. [DOI] [PubMed] [Google Scholar]
- 32. McCarty JS, Buchberger A, Reinstein J, Bukau B. The role of ATP in the functional cycle of the DnaK chaperone system. J Mol Biol. 1995;249:126–137. [DOI] [PubMed] [Google Scholar]
- 33. Buchberger A, Theyssen H, Schroder H, et al. Nucleotide‐induced conformational changes in the ATPase and substrate binding domains of the DnaK chaperone provide evidence for interdomain communication. J Biol Chem. 1995;270:16903–16910. [DOI] [PubMed] [Google Scholar]
- 34. Mayer MP, Gierasch LM. Recent advances in the structural and mechanistic aspects of Hsp70 molecular chaperones. J Biol Chem. 2019;294:2085–2097. [DOI] [PMC free article] [PubMed] [Google Scholar]
- 35. Flaherty KM, DeLuca‐Flaherty C, McKay DB. Three‐dimensional structure of the ATPase fragment of a 70K heat‐shock cognate protein. Nature. 1990;346:623–628. [DOI] [PubMed] [Google Scholar]
- 36. Zhu X, Zhao X, Burkholder WF, et al. Structural analysis of substrate binding by the molecular chaperone DnaK. Science. 1996;272:1606–1614. [DOI] [PMC free article] [PubMed] [Google Scholar]
- 37. Liu Q, Hendrickson WA. Insights into Hsp70 chaperone activity from a crystal structure of the yeast Hsp110 Sse1. Cell. 2007;131:106–120. [DOI] [PMC free article] [PubMed] [Google Scholar]
- 38. Qi R, Sarbeng EB, Liu Q, et al. Allosteric opening of the polypeptide‐binding site when an Hsp70 binds ATP. Nat Struct Mol Biol. 2013;20:900–907. [DOI] [PMC free article] [PubMed] [Google Scholar]
- 39. Kityk R, Kopp J, Sinning I, Mayer MP. Structure and dynamics of the ATP‐bound open conformation of Hsp70 chaperones. Mol Cell. 2012;48:863–874. [DOI] [PubMed] [Google Scholar]
- 40. Clerico EM, Tilitsky JM, Meng W, Gierasch LM. How hsp70 molecular machines interact with their substrates to mediate diverse physiological functions. J Mol Biol. 2015;427:1575–1588. [DOI] [PMC free article] [PubMed] [Google Scholar]
- 41. Bertelsen EB, Chang L, Gestwicki JE, Zuiderweg ER. Solution conformation of wild‐type E. coli Hsp70 (DnaK) chaperone complexed with ADP and substrate. Proc Natl Acad Sci U S A. 2009;106:8471–8476. [DOI] [PMC free article] [PubMed] [Google Scholar]
- 42. Chang YW, Sun YJ, Wang C, Hsiao CD. Crystal structures of the 70‐kDa heat shock proteins in domain disjoining conformation. J Biol Chem. 2008;283:15502–15511. [DOI] [PMC free article] [PubMed] [Google Scholar]
- 43. Pellecchia M, Montgomery DL, Stevens SY, et al. Structural insights into substrate binding by the molecular chaperone DnaK. Nat Struct Biol. 2000;7:298–303. [DOI] [PubMed] [Google Scholar]
- 44. Swain JF, Dinler G, Sivendran R, Montgomery DL, Stotz M, Gierasch LM. Hsp70 chaperone ligands control domain association via an allosteric mechanism mediated by the interdomain linker. Mol Cell. 2007;26:27–39. [DOI] [PMC free article] [PubMed] [Google Scholar]
- 45. Alderson TR, Kim JH, Markley JL. Dynamical structures of Hsp70 and Hsp70‐Hsp40 complexes. Structure. 2016;24:1014–1030. [DOI] [PMC free article] [PubMed] [Google Scholar]
- 46. Hartl FU, Hayer‐Hartl M. Converging concepts of protein folding in vitro and in vivo. Nat Struct Mol Biol. 2009;16:574–581. [DOI] [PubMed] [Google Scholar]
- 47. Kampinga HH, Craig EA. The HSP70 chaperone machinery: J proteins as drivers of functional specificity. Nat Rev Mol Cell Biol. 2010;11:579–592. [DOI] [PMC free article] [PubMed] [Google Scholar]
- 48. Schroder H, Langer T, Hartl FU, Bukau B. DnaK, DnaJ and GrpE form a cellular chaperone machinery capable of repairing heat‐induced protein damage. EMBO J. 1993;12:4137–4144. [DOI] [PMC free article] [PubMed] [Google Scholar]
- 49. Bracher A, Verghese J. The nucleotide exchange factors of Hsp70 molecular chaperones. Front Mol Biosci. 2015;2:10. [DOI] [PMC free article] [PubMed] [Google Scholar]
- 50. Kampinga HH, Andreasson C, Barducci A, et al. Function, evolution, and structure of J‐domain proteins. Cell Stress Chaperones. 2019;24:7–15. [DOI] [PMC free article] [PubMed] [Google Scholar]
- 51. Karunanayake C, Page RC. Cytosolic protein quality control machinery: Interactions of Hsp70 with a network of co‐chaperones and substrates. Exp Biol Med (Maywood). 2021;246:1419–1434. [DOI] [PMC free article] [PubMed] [Google Scholar]
- 52. Li J, Qian X, Sha B. Heat shock protein 40: Structural studies and their functional implications. Protein Pept Lett. 2009;16:606–612. [DOI] [PMC free article] [PubMed] [Google Scholar]
- 53. Fan CY, Lee S, Cyr DM. Mechanisms for regulation of Hsp70 function by Hsp40. Cell Stress Chaperones. 2003;8:309–316. [DOI] [PMC free article] [PubMed] [Google Scholar]
- 54. Cyr DM, Ramos CH. Specification of Hsp70 function by type I and type II Hsp40. Subcell Biochem. 2015;78:91–102. [DOI] [PubMed] [Google Scholar]
- 55. Yang J, Zong Y, Su J, et al. Conformation transitions of the polypeptide‐binding pocket support an active substrate release from Hsp70s. Nat Commun. 2017;8:1201. [DOI] [PMC free article] [PubMed] [Google Scholar]
- 56. Yang J, Nune M, Zong Y, Zhou L, Liu Q. Close and allosteric opening of the polypeptide‐binding site in a human Hsp70 chaperone BiP. Structure. 2015;23:2191–2203. [DOI] [PMC free article] [PubMed] [Google Scholar]
- 57. Sriram M, Osipiuk J, Freeman B, Morimoto R, Joachimiak A. Human Hsp70 molecular chaperone binds two calcium ions within the ATPase domain. Structure. 1997;5:403–414. [DOI] [PubMed] [Google Scholar]
- 58. Vogel M, Mayer MP, Bukau B. Allosteric regulation of Hsp70 chaperones involves a conserved interdomain linker. J Biol Chem. 2006;281:38705–38711. [DOI] [PubMed] [Google Scholar]
- 59. Kityk R, Vogel M, Schlecht R, Bukau B, Mayer MP. Pathways of allosteric regulation in Hsp70 chaperones. Nat Commun. 2015;6:8308. [DOI] [PMC free article] [PubMed] [Google Scholar]
- 60. Xu X, Sarbeng EB, Vorvis C, Kumar DP, Zhou L, Liu Q. The unique peptide substrate binding properties of 110 KDA heatshock protein (HSP110) determines its distinct chaperone activity. J Biol Chem. 2012;287:5661–5672. [DOI] [PMC free article] [PubMed] [Google Scholar]
- 61. Zhuravleva A, Gierasch LM. Substrate‐binding domain conformational dynamics mediate Hsp70 allostery. Proc Natl Acad Sci U S A. 2015;112:E2865–E2873. [DOI] [PMC free article] [PubMed] [Google Scholar]
- 62. Hendrickson WA. Theory of allosteric regulation in Hsp70 molecular chaperones. QRB Discov. 2020;1:1–12. [DOI] [PMC free article] [PubMed] [Google Scholar]
- 63. Wei J, Gaut JR, Hendershot LM. In vitro dissociation of BiP‐peptide complexes requires a conformational change in BiP after ATP binding but does not require ATP hydrolysis. J Biol Chem. 1995;270:26677–26682. [DOI] [PubMed] [Google Scholar]
- 64. Liberek K, Marszalek J, Ang D, Georgopoulos C, Zylicz M. Escherichia coli DnaJ and GrpE heat shock proteins jointly stimulate ATPase activity of DnaK. Proc Natl Acad Sci U S A. 1991;88:2874–2878. [DOI] [PMC free article] [PubMed] [Google Scholar]
- 65. Jin Y, Zhuang M, Hendershot LM. ERdj3, a luminal ER DnaJ homologue, binds directly to unfolded proteins in the mammalian ER: Identification of critical residues. Biochemistry. 2009;48:41–49. [DOI] [PMC free article] [PubMed] [Google Scholar]
- 66. Zhuravleva A, Clerico EM, Gierasch LM. An interdomain energetic tug‐of‐war creates the allosterically active state in Hsp70 molecular chaperones. Cell. 2012;151:1296–1307. [DOI] [PMC free article] [PubMed] [Google Scholar]
- 67. Truman AW, Bourboulia D, Mollapour M. Decrypting the chaperone code. J Biol Chem. 2021;296:100293. [DOI] [PMC free article] [PubMed] [Google Scholar]
- 68. Preissler S, Rohland L, Yan Y, Chen R, Read RJ, Ron D. AMPylation targets the rate‐limiting step of BiP's ATPase cycle for its functional inactivation. Elife. 2017;6(29428):1–28. [DOI] [PMC free article] [PubMed] [Google Scholar]
- 69. Paroutis P, Touret N, Grinstein S. The pH of the secretory pathway: Measurement, determinants, and regulation. Physiology (Bethesda). 2004;19:207–215. [DOI] [PubMed] [Google Scholar]
- 70. Li R, Yanjiao G, Wubin H, et al. Secreted GRP78 activates EGFR‐SRC‐STAT3 signaling and confers the resistance to sorafeinib in HCC cells. Oncotarget. 2017;8:19354–19364. [DOI] [PMC free article] [PubMed] [Google Scholar]
- 71. Chen L, Zheng H, Yu X, et al. Tumor‐secreted GRP78 promotes the establishment of a pre‐metastatic niche in the liver microenvironment. Front Immunol. 2020;11:584458. [DOI] [PMC free article] [PubMed] [Google Scholar]
- 72. Li H, Hu L, Cuffee CW, et al. Interdomain interactions dictate the function of the Candida albicans Hsp110 protein Msi3. J Biol Chem. 2021;297:101082. [DOI] [PMC free article] [PubMed] [Google Scholar]
- 73. Kumar V, Peter JJ, Sagar A, et al. Interdomain communication suppressing high intrinsic ATPase activity of Sse1 is essential for its co‐disaggregase activity with Ssa1. FEBS J. 2020;287:671–694. [DOI] [PubMed] [Google Scholar]
- 74. Sarbeng EB, Liu Q, Tian X, et al. A functional DnaK dimer is essential for the efficient interaction with Hsp40 heat shock protein. J Biol Chem. 2015;290:8849–8862. [DOI] [PMC free article] [PubMed] [Google Scholar]
- 75. Mossessova E, Lima CD. Ulp1‐SUMO crystal structure and genetic analysis reveal conserved interactions and a regulatory element essential for cell growth in yeast. Mol Cell. 2000;5:865–876. [DOI] [PubMed] [Google Scholar]
- 76. Kumar DP, Vorvis C, Sarbeng EB, Cabra Ledesma VC, Willis JE, Liu Q. The four hydrophobic residues on the Hsp70 inter‐domain linker have two distinct roles. J Mol Biol. 2011;411:1099–1113. [DOI] [PMC free article] [PubMed] [Google Scholar]
Associated Data
This section collects any data citations, data availability statements, or supplementary materials included in this article.
Supplementary Materials
Appendix S1: Supporting Information
Data Availability Statement
Atomic coordinates and structure factors have been deposited in the RSCB Protein Data Bank under the accession number 7N1R. The data that support the findings of this study are available from the corresponding author upon request.