Abstract
Background: Spatially fractionated radiotherapy (GRID) could effectively de-bulk tumor volumes for shallow and deep-seated locally advanced tumors. A new treatment planning method using the three-dimensional-volumetric modulated arc therapy (VMAT) technique combined with a novel, software-generated, virtual GRID block (VGB) was developed which allows better conformity plans (VMAT-GRID) and maintain the GRID dosimetric characteristics. The dosimetric metrics calculated via the valley/peak ratio (Dmin/Dmax), D90/D10, gross tumor volume (GTV) mean dose (Dmean), GTV equivalent uniform dose (EUD), and normal tissue maximum dose. Methods: Twenty-five patients with tumor volumes ranging between 71.6 cc and 4683 cc at various tumor sites were retrospectively studied. The prescription was 20 Gy to the maximum point of GTV in a single fraction, and the VMAT-GRID plan was generated using 6 MV/10 MV flattening-filter-free beams. Results: The optimized VGB was designed with the median center-to-center distance of 27 mm, and 9 mm for the median diameter of the opening area in this study. These 2 values can be used to design any optimized VGB, the final VGB may be modified to generate a patient-specific VGB. The median GTV mean dose was 918 (877- 938) cGy, and the median GTV EUD dose was 818 (597-916) cGy. In terms of dose inhomogeneity, the median valley-to-peak dose ratio was 0.07 (0.02-0.26); and the median ratio of D90/D10 was 0.70 (0.38-0.94). For the organ-at-risk doses, there was a rapid dose drop-off in the normal tissue area immediately adjacent to the target, and the maximum global doses were all located inside the GTV. Conclusion: Our results indicated that the VMAT-GRID planning approach could successfully deliver dose with acceptable GRID dose metric while sparing the normal tissue especially in the region near the target due to the rapid dose drop-off and restricting maximum dose inside the target.
Keywords: spatially fractionated radiotherapy, volumetric modulated arc therapy, dosimetry, virtual GRID block
Introduction
Spatially fractionated radiotherapy (GRID) has been used to treat bulky tumors for decades. The clinical outcomes have been shown that this specially designed radiation modality can effectively de-bulk a large tumor volume.1–4 However, the techniques used for GRID radiotherapy have not evolved at the same rate as other radiotherapy techniques. Conventional GRID radiotherapy usually delivers the dose using a collimated field with a GRID block. The GRID block is either a cerrobend-alloy or brass physical block or made by the multileaf collimator (MLC). 5 The GRID block constricts the delivered dose in a checkerboard or honeycomb pattern by delivering the radiation beam only through open portions of the block and creates a dose gradient, the valley dose, across the shielded area. Our previous study developed a novel method using helical tomotherapy for GRID radiotherapy6,7 using an MLC-based virtual GRID block (VGB) generated by DICOMan software 8 to replace the conventional 3D GRID radiotherapy. Similarly, with the development of the volumetric modulated arc therapy (VMAT) techniques and the availability of flattening-filter-free (FFF) beams, it is now feasible to deliver GRID therapy using the VMAT.
Therefore, this study focused on the feasibility study of 3D-VMAT-based GRID radiotherapy (VMAT-GRID) using software-generated VGBs. The shape of the VGB was customized by software corresponding to tumor-specific shape and location. The VMAT technique was used to optimize the plan to be as conformal as possible and simultaneously keep GRID therapy dosimetric characteristics (ie, spatially fractionated peak and valleys doses, peak doses in open channels, and valley dose gradient across the closed channels).
Methods
Twenty-five patients were chosen among the previously treated with GRID therapy in our clinic between the years 2012 and 2017. These patients represent a large range of tumor volumes, various tumor sites, and both shallow and deeply seated tumors. Patient characteristics are listed in Table 1.
Table 1.
Main characteristics of the tumors studied in this work.
| Pt # | Location | Volume (cc) | Max dimension (S-I, cm) |
Max dimension (R-L, cm) |
Depth a (cm) |
|---|---|---|---|---|---|
| 1 | Neck | 525.10 | 10.22 | 10.40 | 0.00 |
| 2 | Pelvis | 234.70 | 13.41 | 5.90 | 0.81 |
| 3 | Shoulder | 653.70 | 12.30 | 9.80 | 2.54 |
| 4 | Chest | 1014.20 | 15.80 | 14.4 | 1.67 |
| 5 | Chest | 4683.90 | 19.50 | 20.6 | 2.29 |
| 6 | Abdomen | 643.10 | 15.70 | 9.70 | 3.38 |
| 7 | Neck | 185.00 | 8.06 | 7.10 | 0.39 |
| 8 | Extremity | 3859.50 | 35.90 | 14.7 | 0.00 |
| 9 | Head&neck | 155.00 | 7.40 | 7.60 | 0.48 |
| 10 | Neck | 346.20 | 11.10 | 10.0 | 0.18 |
| 11 | Shoulder | 439.90 | 9.80 | 13.6 | 0.20 |
| 12 | Neck | 629.70 | 11.60 | 9.10 | 0.15 |
| 13 | Chest | 390.00 | 9.90 | 8.70 | 0.13 |
| 14 | Chest | 336.00 | 7.50 | 7.70 | 0.50 |
| 15 | Abdomen | 3066.20 | 22.70 | 17.7 | 2.80 |
| 16 | Pelvis | 720.70 | 14.60 | 10.4 | 2.67 |
| 17 | Pelvis | 469.50 | 11.10 | 9.70 | 6.27 |
| 18 | Neck | 105.00 | 7.10 | 4.50 | 0.46 |
| 19 | Head&neck | 387.00 | 12.10 | 8.20 | 0.00 |
| 20 | Pelvis | 481.30 | 9.90 | 9.10 | 1.83 |
| 21 | Neck | 71.60 | 5.10 | 4.80 | 0.38 |
| 22 | Shoulder | 295.70 | 6.00 | 8.40 | 0.32 |
| 23 | Head&neck | 316.00 | 13.50 | 10.4 | 0.13 |
| 24 | Pelvis | 1417.10 | 12.10 | 15.6 | 4.50 |
| 25 | Head&neck | 440.30 | 8.90 | 10.0 | 0.00 |
Abbreviations: S-I, superior to inferior; R-L, the right to left.
Distance from the skin to the proximal edge of the target.
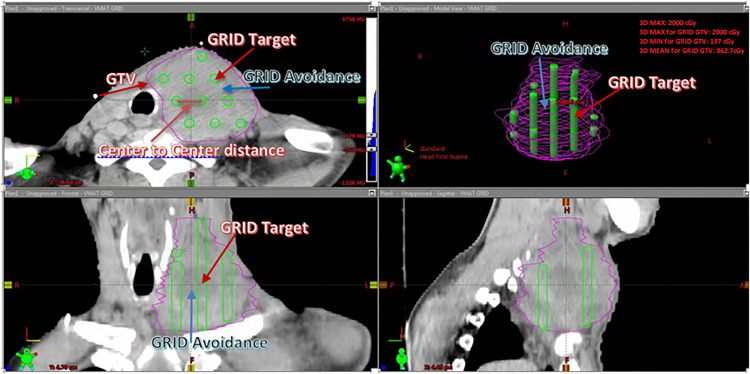
An “MLC-based VGB” was generated by DICOMan software and it consists of 2 new structures, GRID target and GRID avoidance. Both the GRID target and GRID avoidance were inside the gross tumor volume (GTV). The GRID target mimics the open area of the cerrobend-alloy physical GRID block, and the GRID avoidance mimics the blocked area of the physical GRID block. The VGB constricted the dose distribution allowing only high dose (peak dose) inside the cylindrical opened areas and low dose (valley dose) within the blocked areas. The user can define the GRID target's opening diameter and center-to-center distance. The 2 new contours (GRID target and GRID avoidance) generated in DICOMan were transferred to the Eclipse planning system (v.15.6) for optimization. The prescription is optimized to deliver the dose to the GRID target. The GRID avoidance is used in the planning process as an avoidance structure to create the low dose or valleys within the target volume (Figure 1). The VGB needs to be optimized by first adjusting the values of dopen and dc-c to fit the individual patient's anatomy. Once the dose is calculated, the plan is evaluated to assure that the set clinical goals are met. These clinical goals include target mean dose, EUD, achieving a minimum valley/peak dose ratio, D90/D10, and doses to the organ-at-risks (OARs). Finally, the design of the VGB needs to be further optimized by adjusting the values of dopen and dc-c, or adding/removing the numbers of open areas if the clinical goals are not met. More details of generating a patient-specific VGB can be found in our previous studies.6–9
Figure 1.
Illustration of a virtual GRID block (VGB) generated by the DICOMan software 8 .
For each selected patient in this study, a VMAT-GRID treatment plan was generated using Eclipse treatment planning software. Treatment plans were created for Varian Truebeam linear accelerators with high definition MLC with the central leaves’ width of 2.5 mm. The prescription was 2000 cGy to the maximum point of GTV in a single fraction. Treatment plans were optimized with the VMAT technique using 2 to 4 arcs with a collimator of 90° and 270°, and 6 MV flattening-filter-free (FFF) beams with 1400 MU/min or 10 MV FFF beams with 2400 MU/min dose rate. Here, we took advantage of the fact that the FFF beam allows high dose rate delivery, which can significantly reduce the treatment time and reduce the possibility of patient motion.
The planning goal for GTV dose constraints was as follows: the maximum dose of GRID target (the opening area on the VGB) was 2000 cGy; the GTV mean dose was between 800 and 1000 cGy; this value was based on our previous experience of treating conventional Linac-GRID patients.6,7,9 The equivalent uniform dose (EUD) was used to further evaluate the target dose coverage. The definition of EUD was used as the following 10 :
| (1) |
where vi is the partial volume corresponding to dose Di. SF2 = 0.5 for moderately radiosensitive tumor target with a reference dose of 2 Gy per fraction. For a more detailed calculation method, please refer to the paper by Niemierko. 10
Normal tissue doses were optimized to receive a rapid dose drop-off in the normal tissue area immediately adjacent to the target. Two new planning structures, ring 1 and ring 2, represented 2 different normal tissue areas close to the target to evaluate the dose drop-off. Ring 1 represented the area that was 5 mm away from the GTV surface and extended outward by 5 mm to estimate the normal tissue doses immediately near the target. Ring 2 represented the area that extends outward of 1 cm from the outer circumference of ring 1.
In summary, dosimetric evaluation parameters included GTV mean dose (Dmean), GTV EUD, GTV inhomogeneity including the valley to peak ratio, which is the ratio of the minimum dose to the maximum dose (Dmin/Dmax) inside the target, and the ratio of D90/D10, and normal tissue doses (ring 1 and ring 2). The Dmax is defined as the maximum dose in 0.5 cc of the target, and the Dmin is the minimum dose covering 100% of the target volume (D100). In this study, all plans were reviewed and approved by a single physician.
Results
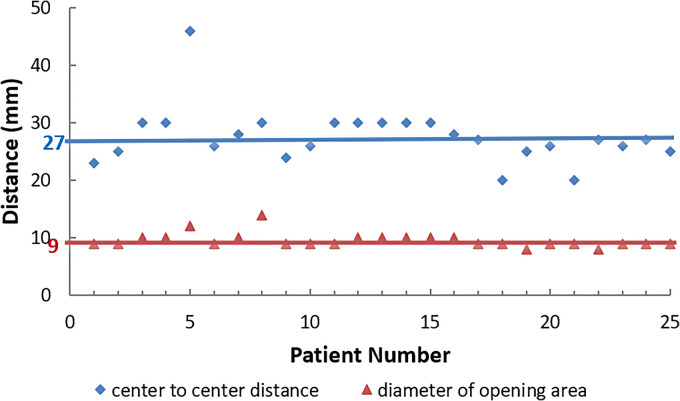
Figure 2 shows the achieved optimized VGB parameters: the center-to-center distances (dc−c), and the diameters of the opening area (dopen) for each VGB used in this study.
Figure 2.
Virtual GRID block (VGB): center-to-center distance (diamonds), diameter of opening area (triangles). The horizontal lines represent the optimized median values for center-to-center distance (27 mm), and for the diameter of the opening area (9 mm).
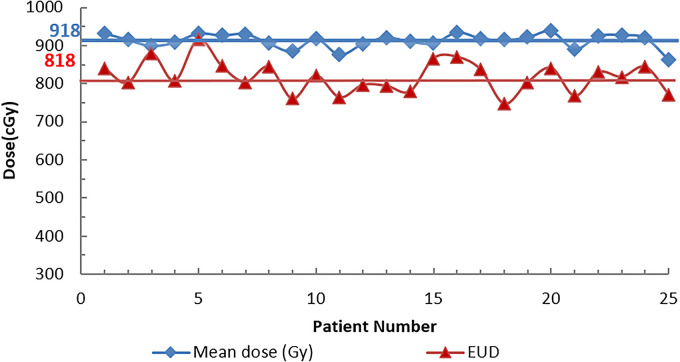
Figure 2 also shows that the median center-to-center distance was around 27 mm, and the median diameter of the opening area was 9 mm for all 25 patients. Figure 3 and Table 2 show the results of the GTV mean dose, GTV EUD. Table 2 also shows the GTV inhomogeneity (Dmin/Dmax and D90/D10), and the normal tissue doses (ring 1 and ring 2).
Figure 3.
GTV mean dose and GTV EUD for all 25 patients: GTV mean dose (diamonds); GTV EUD (triangles). The horizontal lines represent the median mean doses (918 cGy) and EUD doses (818 cGy).
Abbreviations: GTV, gross tumor volume; EUD, equivalent uniform dose.
Table 2.
GTV Dmean, EUD, D90/D10, valley to peak ratio (Dmin/Dmax), and normal tissue doses (ring 1 and ring 2).
| Patient # | GTV Dmean (cGy) |
GTV EUD (cGy) |
GTV (D90/D10) a | GTV (Dmin/Dmax) b |
Normal tissue ring1 c (cGy) | Normal tissue ring2 d (cGy) |
|---|---|---|---|---|---|---|
| 1 | 933.10 | 841.00 | 0.65 | 0.05 | 395.40 | 254.70 |
| 2 | 915.60 | 802.00 | 0.73 | 0.07 | 361.00 | 245.00 |
| 3 | 899.80 | 879.00 | 0.67 | 0.07 | 420.80 | 299.80 |
| 4 | 908.50 | 807.00 | 0.67 | 0.07 | 468.60 | 344.20 |
| 5 | 932.20 | 916.50 | 0.94 | 0.26 | 644.90 | 519.40 |
| 6 | 927.00 | 846.00 | 0.82 | 0.06 | 579.00 | 436.00 |
| 7 | 931.00 | 804.00 | 0.65 | 0.10 | 407.00 | 248.00 |
| 8 | 906.20 | 844.00 | 0.75 | 0.05 | 502.60 | 383.10 |
| 9 | 885.00 | 760.80 | 0.70 | 0.06 | 431.70 | 281.20 |
| 10 | 918.60 | 821.20 | 0.59 | 0.08 | 451.80 | 284.00 |
| 11 | 876.60 | 764.30 | 0.69 | 0.02 | 464.10 | 309.90 |
| 12 | 905.20 | 797.00 | 0.67 | 0.06 | 402.50 | 272.00 |
| 13 | 921.40 | 794.30 | 0.66 | 0.02 | 476.50 | 360.00 |
| 14 | 911.20 | 780.24 | 0.70 | 0.04 | 430.90 | 276.00 |
| 15 | 906.20 | 866.40 | 0.91 | 0.09 | 577.80 | 477.60 |
| 16 | 935.00 | 870.00 | 0.87 | 0.19 | 549.00 | 405.00 |
| 17 | 919.30 | 837.00 | 0.86 | 0.14 | 532.00 | 393.00 |
| 18 | 915.00 | 747.70 | 0.47 | 0.16 | 387.00 | 232.00 |
| 19 | 922.00 | 804.00 | 0.75 | 0.05 | 410.40 | 302.00 |
| 20 | 938.00 | 841.00 | 0.38 | 0.07 | 527.00 | 376.80 |
| 21 | 891.20 | 768.00 | 0.71 | 0.04 | 376.70 | 210.10 |
| 22 | 925.80 | 830.00 | 0.82 | 0.11 | 475.80 | 315.00 |
| 23 | 928.00 | 818.00 | 0.79 | 0.08 | 500.60 | 325.00 |
| 24 | 920.40 | 844.00 | 0.78 | 0.15 | 453.30 | 107.30 |
| 25 | 862.70 | 771.40 | 0.70 | 0.10 | 353.00 | 233.00 |
Abbreviations: GTV, gross tumor volume; EUD, equivalent uniform dose.
D90 is the dose to cover 90% of the target volume and D10 is the dose to cover 10% of the target volume.
Dmax is defined as the maximum dose in 0.5 cc of the target and the Dmin is the minimum dose covering 100% of the target volume (D100).
Ring 1: the area that was 5 mm away from the GTV surface and extended outward by 5 mm to estimate the normal tissue doses immediately near the target.
Ring 2: the area that extends outward of 1 cm from the outer circumference of ring 1.
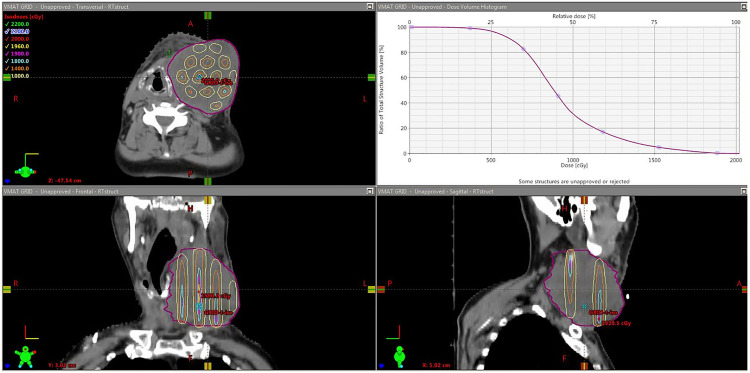
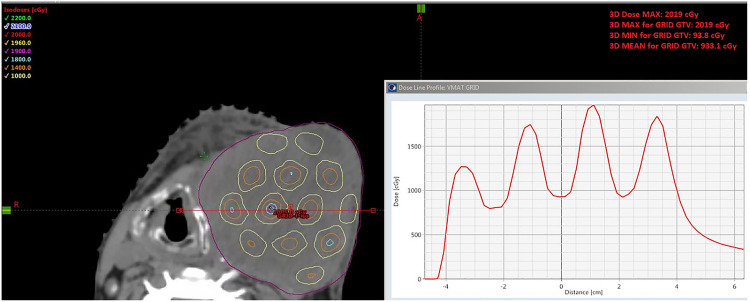
Table 2 shows that the median mean GTV dose was 918 cGy with the range from 876.6 cGy to 938 cGy, and the median GTV EUD dose was 818 cGy with the range from 740 cGy to 916 cGy. The global median maximum dose was 2043 cGy with the range of 1915 cGy to 2104 cGy and all the maximum doses were located inside the GTV. For the dose inhomogeneity, the median valley to peak dose ratio was 0.098, with the range of 0.03 to 0.26; and the median ratio of D90/D10 was 0.70 with the range of 0.38 to 0.94. Figure 4 shows an example of the GTV dose distribution for a typical VMAT-GRID therapy treatment plan, and the GTV mean dose was around 900 cGy, which was the planning goal in this study. Figure 5 shows an example of GTV dose inhomogeneity with the peak and valley dose distribution for the same patient as Figure 4.
Figure 4.
illustration of Head and Neck VMAT-GRID patient isodose distribution and its respective dose-volume histogram (DVH) for the GTV, showing the mean dose around 900 cGy.
Abbreviations: VMAT, volumetric modulated arc therapy; GRID, spatially fractionated radiotherapy; GTV, gross tumor volume.
Figure 5.
illustration of dose inhomogeneity for the same Head and Neck VMAT-GRID patient in the Figure 4, showing one profile with valley to peak dose distribution.
Abbreviations: VMAT, volumetric modulated arc therapy; GRID, spatially fractionated radiotherapy.
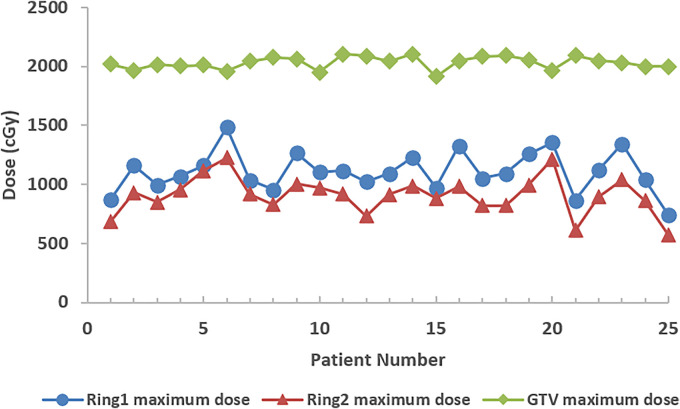
Regarding normal tissue doses, the median of the mean doses was 453.3 cGy (361-644.9 cGy) for ring 1 and was 302 cGy (210-519.4 cGy) for ring 2. The median of the maximum doses was 1093 cGy (865.8-1485 cGy) for ring 1 and 916.4 cGy (612-1225 cGy) for ring 2 (Figure 6).
Figure 6.
The maximum dose in gross tumor volume (GTV; diamonds) and normal tissue Ring 1 (circles) & Ring 2 (triangles).
Discussion
A feasibility study of a VMAT-based GRID plan using a customized VGB has been performed. Generally, conventional GRID therapy using a physical GRID block collimator has the limitation of higher normal tissue dose, especially near or beyond the target location where the maximum dose may fall outside of the target on occasion. It is also challenging to use a conventional GRID therapy plan for a large deeply seated bulky tumor, because of large entrance and exit dose streaks. 11 Some studies have reported that the traditional 3D GRID therapy lacked the ability to develop a conformal plan, especially for irregular tissue geometries or deep targets. 6 In this study, a large range of tumor volumes from 71.6 to 4683 cc and various tumor sites such as head & neck, shoulder, chest, abdomen, pelvis, and extremity were studied. In addition, both shallow and deeply seated tumors were included, with distances from the proximal edge of the target to the skin surface ranging from 0 (skin surface) to 6.27 cm. Gram et al 12 showed a planning approach for using VMAT-GRID on 2 cases of large bulky tumors. The author's planning technique differs from ours because the GRID targets are placed manually, and the maximum doses are much higher than prescription (up to 56% higher). In our opinion, this approach is more akin to lattice therapy. 13
One of this study's salient features is that all VMAT-GRID plans employed a VGB, which was first optimized by adjusting dopen and dc-c to fit the individual tumor shape, tumor volume, and tumor location. The final optimized VGB was achieved by assuring that the clinical goals are met. These clinical goals include target mean dose, EUD, achieving a minimum valley/peak dose ratio, D90/D10, and doses to the OARs. Optimization of the physical GRID block is not possible. The VGB design can be further modified by adding or removing open areas during treatment planning to spare the critical OARs, taking into account the trade-off between the plan quality and delivery time. In this study, the VGB has the median value of dopen of 9 mm, and the median value of dc-c of 27 mm (Figure 2). The commercially available cerrobend-alloy physical GRID block has a dopen of 14 mm and dc-c of 21 mm at the isocenter plane (Radiation Products Design, Inc.). The VGB used in this study had smaller dopen and larger dc-c. The reasons for this are the following: the VGB was generated using MLC. The dose under the blocked area consisted of beam penetration directly through the virtually blocked areas, the adjacent open-area exposure, and the dose leakage from the MLC. Larger dopen and smaller dc-c would increase the dose under the blocked area, thus increase the valley dose in our case. The biological factors related to these parameters are unknown, especially how this might affect the tumor response, however, in terms of overall tumor cell kill, it has been reported that the therapeutic ratio advantage of GRID therapy is related to the design of GRID collimator.14,15
For each patient plan, the VGB was optimized to fit the patient's anatomy and form an acceptable GRID beam pattern. Gholami et al 16 reported that GRID blocks with hole diameters of 1.0 and 1.25 cm may lead to about 19% higher therapeutic ratio relative to the GRIDs with hole diameters smaller than 1.0 cm or larger than 1.25 cm (with 95% confidence interval). Besides a therapeutic ratio advantage, there are other considerations related to the design of GRID collimator, such as the values of dopen and dc-c is directly related to the target volume and target shape, the MLC leaf width will also need to evaluate when designing a VGB with an opening diameter of <1.0 cm. However, no criteria are currently available regarding the optimal center-to-center distance and opening diameter.
In this study, the virtual GRID beam pattern mimics the GRID beam pattern using the physical block and modifying the parameters based on patient-specific anatomy and tumor shape. A wide range of tumor volumes and locations was selected in this study. The median value of dopen = 9 mm, and the median value of dc-c = 27 mm. Our study indicates that the 2 median values can be used as the starting parameters to design the VGB. After the biological co-relationship of GRID therapy parameters become known, ultimately these features may be tailored to each patient's tumor type, biology, and other concomitant treatments being administered (chemotherapy or immunotherapy). Figure 2 also showed that the diameter of the openings was nearly constant corresponding to various center-to-center distances. So, the other option was to keep the open diameter fixed (dopen = 9 mm) and change the distance between the 2 opening areas to accommodate treatment planning goals.
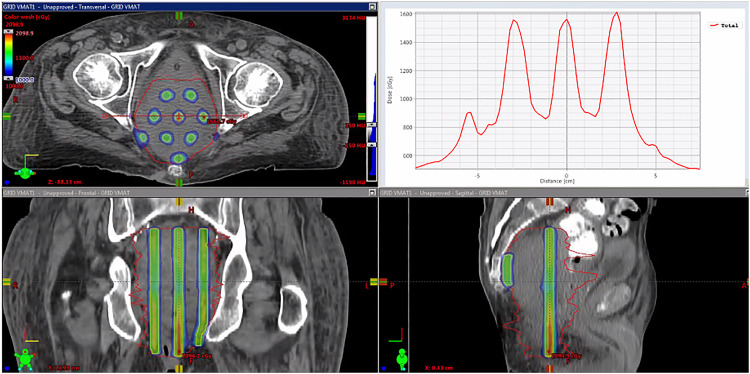
Valley-to-peak ratio is a critical dosimetric parameter to evaluate the GRID therapy treatment plan. The VMAT-GRID therapy generally had a higher valley-to-peak ratio than the conventional cerrobend-alloy GRID block because of the higher dose under the GRID blocking area. The valley-to-peak dose ratio is remarkably consistent across the axial plane for the traditional GRID therapy, but this ratio is variable corresponding to different targets in VMAT-GRID therapy. Figure 7 shows a VMAT-GRID beam that achieved similar peak/valley values compared to conventional cerrobend block GRID therapy.
Figure 7.
Example of an ideal VMAT-GRID therapy plan (pelvis): 3-planes’ view and dose profile. This case example is considered ideal due the similar peak/valley distribution as in a conventional GRID block.
Abbreviations: VMAT, volumetric modulated arc therapy; GRID, spatially fractionated radiotherapy.
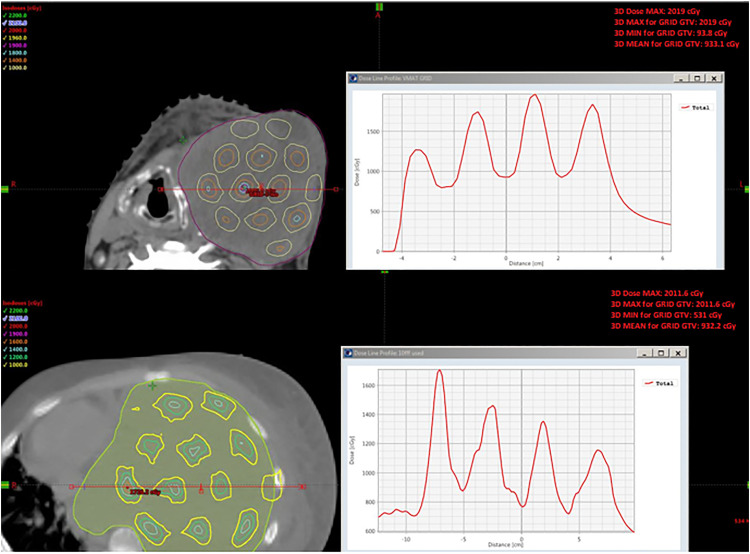
Some patients received a suboptimal GRID beam pattern because of the patient-specific anatomical constraints. Figure 8 shows an example of dose profiles (1 H&N, patient No. 1 and 1 chest, patient No. 5) with suboptimal beam profiles. The valley-to-peak ratio was significantly changed across the axial plane, especially for the chest VMAT-GRID plan compared to the relative ideal VMAT-GRID plan in Figure 7. This chest patient had a larger tumor volume (4683.9 cc) among all patients selected in this study, and it also had an irregular tumor shape. This result indicated that the valley-to-peak ratio may not be the only parameter to evaluate the beam inhomogeneity for all patients, such as the example of patients shown in Figure 8. In this study, we also calculated D90/D10 to further evaluate the GRID beam pattern. A white paper for GRID therapy physics-related guidelines was recently published by the Radiosurgery Society (RSS) GRID therapy working group.17,18 Dosimetric metrics have been recommended, including both the valley-to-peak ratio and D90/D10. However, no tolerance range was established for any individual parameter by the RSS group. Researchers and clinicians still use an in-house standard to evaluate their GRID therapy treatment plan.
Figure 8.
Examples of VMAT-GRID dose profiles with suboptimal GRID beam. (Upper: H&N, bottom: Chest). The suboptimal GRID beam means the nonuniform peak/valley ratio in the dose distribution inside the GTV.
Abbreviations: VMAT, volumetric modulated arc therapy; GRID, spatially fractionated radiotherapy; GTV, gross tumor volume.
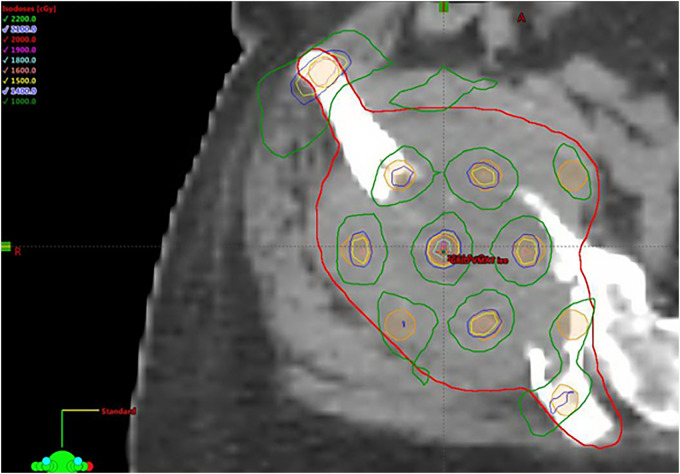
Because of the intended dose inhomogeneity of GRID therapy, traditional dose coverage evaluations such as D95 are not appropriate for evaluating GRID therapy plans. In this study, GTV mean dose and GTV EUD were calculated to evaluate the GTV coverage. The GTV mean dose constraint was set to 800 to 1000 cGy, and this value was based on our previous experience of treating conventional Linac-GRID patients. Figure 3 showed the GTV mean doses and GTV EUDs for all patients from this study. Of note is that the GTV EUD doses had a relatively large dose variation compared to the GTV mean doses (Figure 3). This is due to the suboptimal GRID beam pattern with heterogeneous valley doses delivered to some VMAT-GRID patients. Figure 9 shows an isodose distribution for one of the patients with the lowest EUD in this study. This target volume had a very irregular shape, and the VGB generated from the software did not have any resulting open holes at the 2 elongated ends. A possible option would be that the VGB can be modified during Eclipse planning by adding open spots to increase the dose in these areas; however, even in this case, the plan still had some low doses around these 2 areas because of the suboptimal GRID pattern.
Figure 9.
Example of isodose distribution for irregular GTV. Suboptimal GRID beam pattern because of the irregular shape of the GTV at the 2 elongated ends.
Abbreviations: GTV, gross tumor volume; GRID, spatially fractionated radiotherapy.
To further investigate the considerable variation of EUD, more patient numbers and dosimetric parameters are needed, such as the peak-to-peak distance, and these will be included in our upcoming iterations of the planning approach in future work.
There is a well-known issue for conventional GRID therapy where the maximum dose often falls outside of the target volume. In these cases, OARs adjacent to the target may receive relatively higher doses that could exceed their tolerance. In this study, the global maximum dose was evaluated to determine whether the maximum dose was located inside the GTV or not. In addition, 2 normal tissue structures surrounding the GTV were defined to investigate the normal tissue dose drop-off from the target (ring 1 was set at 0.5 cm away from the target surface and ring 2 was set at 1.5 cm away from the target surface). In this study, all results had the maximum doses located inside the GTV, and there was a rapid dose drop-off from target to ring 1 (Figure 6). The median of the maximum doses inside the target was 2043 cGy (1914.7-2104.5 cGy), and the median of the maximum doses inside the 0.5 cm margin set by ring 1 was 1093 cGy (865.8-1485 cGy). Normal tissue dose within 1.5 cm at ring 2 was comparable to other non-GRID radiotherapy plans (Dmedian-ring2 = 302 cGy). This was primarily because VMAT techniques were used to optimize the plan to meet the plan goal.
Conclusions
We have developed a novel treatment planning method for GRID therapy using 3D-VMAT techniques. The VMAT-GRID plan was generated using software-generated VGBs, and the VGB can be further customized to fit the individual tumor anatomy and tumor shape. The average values of preliminary optimized parameters (dopen = 9 mm and dc-c = 27 mm) can be applied as the starting point to design the VGB, and such to reduce the required planning time to obtain a more robust VMAT-GRID plan.
More dosimetric parameters are needed to further correlate with the clinical benefits as suggested by the RSS GRID therapy working group. Nonetheless, VMAT-GRID can potentially spare normal tissue better than a conventional 3D GRID therapy plan based on the use of optimization structures to reduce the dose to normal tissue adjacent to the target. In addition, evidence of this potential was found in the GTV maximum point doses being inside the GTV target for all patients, and the sharp dose fall-off immediately outside the target.
Acknowledgments
The authors acknowledge physicists and dosimetrists from the Department of Radiation Oncology, University of Arkansas for Medical Science, for providing support for this study.
Abbreviations:
- EUD
equivalent uniform dose
- FFF
flattening-filter-free
- GRID
spatially fractionated radiotherapy
- GTV
gross tumor volume
- MLC
multileaf collimator
- RSS
Radiosurgery Society
- VGB
virtual GRID block
- VMAT
volumetric modulated arc therapy.
Footnotes
Authors Contribution: All the authors participated in data analysis and manuscript composition.
Declaration of Conflicting Interests: The authors declared no potential conflicts of interest with respect to the research, authorship, and/or publication of this article.
Ethical Statement: This study did not require an ethical board approval because it did not need human participation. No tissue or blood samples were used in this study. It was retrospective in nature only collecting dosimetric data. It would not bring risks to the physiology of the patients. The personal privacy of patients would not be reveled in this study.
Funding: The authors received no financial support for the research, authorship, and/or publication of this article.
ORCID iD: Xin Zhang https://orcid.org/0000-0002-5582-3501
References
- 1.Mohiuddin M, Stevens JH, Reiff JE, Huq MS, Suntharalingam N. Spatially fractionated (GRID) radiation for palliative treatment of advanced cancer. Radiat Oncol Invest. 1996;4(1):41-47. [Google Scholar]
- 2.Snider JW, Molitoris J, Shyu S, et al. Spatially fractionated radiotherapy (GRID) prior to standard neoadjuvant conventionally fractionated radiotherapy for bulky, high-risk soft tissue and osteosarcomas: feasibility, safety, and promising pathologic response rates. Radiat Res. 2020;194(6):707-714. [DOI] [PubMed] [Google Scholar]
- 3.Zhang H, Wang JZ, Mayr N, Kong X, Yuan J, Gupta N. Fractionated GRID therapy in treating cervical cancers: conventional fractionation or hypofractionation? Int J Radiat Oncol Biol Phys. 2008;70(1):280-288. [DOI] [PubMed] [Google Scholar]
- 4.Buckey C, Stathakis S, Cashon K, et al. Evaluation of a commercially-available block for spatially fractionated radiation therapy. J Appl Clin Med Phys. 2010;11(3):2-11. [DOI] [PMC free article] [PubMed] [Google Scholar]
- 5.Ha JK, Zhang GW, Naqvi SA, Regine WF, Yu CX. Feasibility of delivering GRID therapy using a multileaf collimator. Med Phys. 2006;33(1):76-82. [DOI] [PubMed] [Google Scholar]
- 6.Zhang X, Penagaricano J, Yan Y, et al. Application of spatially fractionated radiation (GRID) to helical tomotherapy using a novel TOMOGRID template. Technol Cancer Res Treat. 2016;15(1):91-100. doi: 10.7785/tcrtexpress.2013.600261 [DOI] [PubMed] [Google Scholar]
- 7.Zhang X, Penagaricano J, Yan Y, et al. Spatially fractionated radiotherapy (GRID) using helical tomotherapy. J Appl Clin Med Phys. 2016;17(1):396-407. doi: 10.1120/jacmp.v17i1.5934 [DOI] [PMC free article] [PubMed] [Google Scholar]
- 8.Yan Y, Penagaricano J, Corry P, et al. Spatially fractionated radiation therapy (GRID) using a tomotherapy unit [abstract]. Med Phys. 2011;38(6):3369. doi: 10.1118/1.3611467. DICOMan Website: https://sites.google.com/site/dicomantx/home. [DOI] [Google Scholar]
- 9.Penagaricano JA, Moros EG, Ratanatharathorn V, Yan Y, Corry P. Evaluation of spatially fractionated radiotherapy (GRID) and definitive chemoradiotherapy with curative intent for locally advanced squamous cell carcinoma of the head and neck: initial response rates and toxicity. Int J Radiat Oncol Biol Phys. 2010;76(5):1369-1375. doi: 10.1016/j.ijrobp.2009.03.030 [DOI] [PubMed] [Google Scholar]
- 10.Niemierko A. A reporting and analyzing dose distributions: a concept of equivalent uniform dose. Med Phys. 1997;24(1):103-110. [DOI] [PubMed] [Google Scholar]
- 11.Mohiuddin M, Fujita M, Regine WF, et al. High-dose spatially-fractionated radiation (GRID): a new paradigm in the management of advanced cancers. Int J Radiat Oncol Biol Phys. 1999;45(3):721-727. [DOI] [PubMed] [Google Scholar]
- 12.Grams MP, Owen D, Park S, et al. VMAT GRID therapy: a widely applicable planning approach. Pract Radiat Oncol. 2021;11(3):e339-e347. doi: 10.1016/j.prro.2020.10.007 [DOI] [PubMed] [Google Scholar]
- 13.Wu X, Perez N, Zheng Y, et al. The technical and clinical implementation of LATTICE radiation therapy. Radiat Res. 2020;164(6):737-746. PMID: 33064814. [DOI] [PubMed] [Google Scholar]
- 14.Narayanasamy G, Zhang X, Meigooni A, et al. Therapeutic benefits in GRID irradiation on Tomotherapy for bulky, radiation-resistant tumors. Acta Oncol. 2017;56(8):1043-1047. doi: 10.1080/0284186X.2017.1299219 [DOI] [PubMed] [Google Scholar]
- 15.Zwicker RD, Meigooni A, Mohiuddin M. Therapeutic advantage of GRID irradiation for large single fractions. Int J Radiat Oncol Biol Phys. 2004;58(4):1309-1315. [DOI] [PubMed] [Google Scholar]
- 16.Gholami S, Nedaie HA, Longo F, Ay MR, Wright S, Meigooni AS. Is GRID therapy useful for all tumors and every GRID block design? J Appl Clin Med Phys. 2016;17(2):206-219. [DOI] [PMC free article] [PubMed] [Google Scholar]
- 17.Zhang H, Wu XD, Zhang X, et al. Photon GRID radiation therapy: a physics and dosimetry white paper from the radiosurgery society (RSS) GRID/lattice, microbeam and flash radiotherapy working group. Radiat Res. 2020;194(6):665-677. doi: 10.1667/RADE-20-00047.1 [DOI] [PubMed] [Google Scholar]
- 18.Griffin RJ, Ahmed MM, Amendola B, et al. Understanding high-dose, ultra-high dose rate, and spatially fractionated radiation therapy. Int J Radiat Oncol Biol Phys. 2020;107(4):766-778. doi: 10.1016/j.ijrobp.2020.03.028. Epub April 13, 2020. PMID: 32298811. [DOI] [PubMed] [Google Scholar]


