

Abstract
Background:
Osgood-Schlatter disease (OSD) is an apophysitis of the tibial tubercle caused by repeated traction of the patellar tendon during adolescence. Although OSD is associated more with sports such as soccer, it remains unclear whether the kicking motion itself is related to OSD onset.
Purpose:
To prospectively evaluate the kicking motion in adolescent soccer players who later developed OSD.
Study Design:
Case-control study.
Methods:
The authors observed 47 Japanese adolescent male soccer players (mean age, 12 years) over 6 months in 2018-2019; none of the participants had OSD at study onset. The players underwent tibial tubercle ultrasound at baseline, and their kicking motion was evaluated using 3-dimensional (3D) motion analysis with 65 reflective markers. The 3D angle of the lumbar spine, thorax, and pelvis and the angular velocity of the hips, knees, and ankles were calculated for the support leg. The kicking motion was divided into 8 phases, and ball speed, kicking time, and positions of the support (nonkicking) leg and center of mass (COM) from the ball were calculated for each phase. Six months later, the players underwent another ultrasound and were divided into 2 groups: those diagnosed with OSD in the support leg (OSD group) and those without OSD (normal [NRL] group). All factors calculated using the kicking motion analysis at the baseline were compared between groups.
Results:
There were 19 players in the OSD group and 28 players in the NRL group. Anthropometric measurements, ball speed, and kicking time were similar between the 2 groups. The forward translation of the COM and the support leg, the flexion angle of the thorax, and the rotation angle of the pelvis before impact with the ball were all significantly smaller in the OSD group than in the NRL group (P < .05). Moreover, the knee extension angular velocity of the support leg was significantly larger in the OSD group (P < .05) at ball impact.
Conclusion:
A kicking motion with small COM translation, small thoracic flexion, and small pelvic rotation before ball impact, as well as large knee extension angular velocity of the support leg at ball impact, may be associated with OSD onset.
Keywords: Osgood-Schlatter disease, knee, pediatric sports medicine, kicking motion analysis, soccer
Osgood-Schlatter disease (OSD) is an apophysitis during adolescence wherein inflammation occurs in the epiphyseal cartilage of the tibial tubercle as a result of repeated traction of the patellar tendon due to quadriceps femoris muscle contraction. 19,21 OSD is more associated with sports that involve jumping, kicking, and running, such as soccer. 6,14 Greater activation of the quadriceps femoris muscle of the support leg over the kicking leg has been reported to occur during ball impact in soccer, 2 and adolescent soccer players more often have OSD in the support leg than in the kicking leg. 26 Additionally, higher knee extension moments are seen during a single-leg landing compared with other motions (eg, running or cutting motion) in soccer. 11
The kicking motion may contribute to OSD onset in the support leg because soccer players reportedly prefer 1 leg for ball kicking, which generates asymmetric lower extremity loading patterns. 8 However, whether the soccer kicking motion itself is related to OSD onset in the support leg remains unclear. Although a study reported a relationship between the backward shifting of the center of mass (COM) during kicking and OSD onset, 26 no studies have reported any detailed dynamics during the kicking motion that are related to OSD onset in the support leg. In addition, based on the 3-dimensional (3D) biomechanics of the soccer kick, several factors have been clarified to be related to the development of ball speed (eg, forward COM translation, 22 pelvic rotation 12 before the ball impact phase, and knee extension angular velocity of the support leg at ball impact 1,10 ). However, these factors have not yet been evaluated in relation to the development of OSD.
In this study, we aimed to evaluate the soccer kicking motion characteristics associated with OSD onset in the support leg in a prospective cohort study by analyzing 3D biomechanical kicking motion, especially the dynamics of the support leg, COM translation, and pelvic rotation. Our hypothesis was that the dynamics of the support leg and trunk during the kicking motion would differ between players who develop OSD in the support leg and those who do not.
Methods
Participants
A cohort of Japanese junior high school male soccer players from a single soccer team were observed over 6 months in 2018-2019. The team was part of a local recreational league, and the participants attended regular soccer training after school and on the weekends. We initially enrolled 57 boys (age, 12.5 ± 0.5 years; height, 151.5 ± 7.6 cm; body weight, 42.1 ± 8.0 kg; body mass index, 18.3 ± 2.2), all of whom were in the first year of junior high school. The players had 5.4 ± 1.8 years of soccer experience, and they were all in good health and free from musculoskeletal disorders influencing kicking motion.
Study Design
This study was approved by the local ethics committee and was conducted in accordance with the Declaration of Helsinki. All participants and their parents provided signed informed consent before study participation. All measurements were made at the institution of this study.
At baseline, all players underwent a medical examination and ultrasonography of the tibial tubercle by an orthopaedic surgeon (Su.T.). We also collected anthropometric and real-time measurements of the kicking motion using a 3D motion analysis system (Qualisys Track Manager; Qualisys AB) on the same day. Players who had tenderness and swelling of the tibial tubercle and whose stage of the tibial tubercle was apophyseal or epiphyseal were diagnosed with OSD as previously reported. 5,9,17 Players who were diagnosed with OSD at the baseline were excluded from further analysis.
The participants were followed for 6 months, at which time a medical examination and tibial tubercle ultrasonography were conducted, again by the same orthopaedic surgeon. Players diagnosed with OSD in the support leg were assigned to the OSD group. Players who did not develop OSD were assigned to the normal (NRL) group.
Kicking Motion Analysis
Based on a previous report, 25 65 spherical reflective markers (14 mm in diameter) were placed on each participant (Figure 1) using a combination of 3 marker placement models: the Helen Hayes marker system for the whole body, 3 the point cluster technique for the lower legs, 4 and a technique for the spine as reported by previous studies. 22 –24 Reflective tape markers were attached to the ball to calculate ball velocity. The kick-motion trials were conducted in a gymnasium, and the participants were asked to kick a regulation soccer ball (Fédération Internationale de Football Association standard) 3 times with maximal effort toward a small indoor soccer goal (3.0 × 2.0 m) 14 m from where the ball was placed. The participants performed an adequate warm-up (jogging for 5 minutes) before the trial. Each trial was recorded using 10 motion-capture cameras (Oqus; Qualisys AB) set at 240 Hz to measure the position of the spherical markers. Kicking motion and ball velocity data were analyzed from all 3 kicks using the Qualisys Track Manager, and the noise was filtered from the raw data using a 6-Hz low-pass filter. For each player, the kicking motion resulting in the fastest ball speed among the 3 attempts was selected for analysis.
Figure 1.
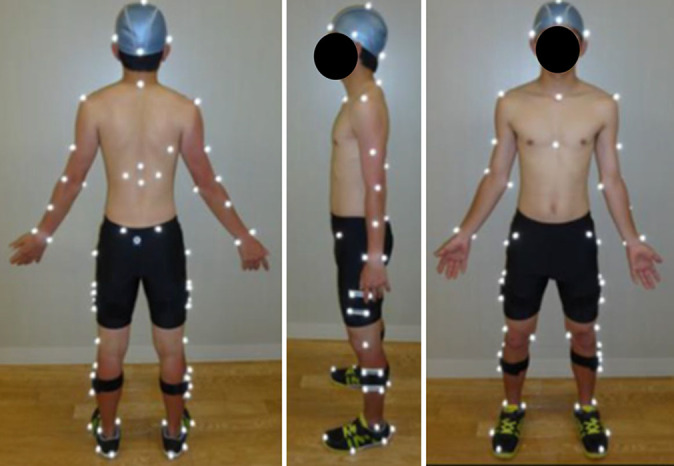
Location of the 65 reflective markers on the body.
Biomechanics analysis software Visual3D (C-Motion Inc) was used to calculate the 3D angle of the lumbar spine, pelvis, thorax, hip, knee, and ankle of the support leg, as well as the 3D angular velocity of the hip, knee, and ankle of the support leg. The kicking motion was divided into 8 phases based on previous reports 10,16,27 : ground contact of the kicking leg (phase 1), toe-off of the kicking leg (phase 2), maximum hip extension of the kicking leg (phase 3), ground contact of the support leg (phase 4), maximum knee flexion of the kicking leg (phase 5), maximum knee flexion of the support leg (phase 6), ball impact (phase 7), and maximum hip flexion of the kicking leg (phase 8) (Figure 2). For each phase, we calculated the ball speed, kicking time, position of the support leg from the ball, and position of the COM from the ball.
Figure 2.

The 8 phases related to the motions of the kicking leg and support leg.
Statistical Analysis
A statistical power analysis was conducted for sample size estimation. According to a previous study, 26 the estimated intragroup standard deviation of the forward COM translation was 5 cm, and the estimated difference between the OSD and NRL group was >5 cm. This study required >16 players with OSD to achieve 90% power and an alpha of .05.
The following variables were compared between the OSD and NRL groups: (1) anthropometric measurement at baseline, growth increase at 6-month follow-up, and years of soccer experience; (2) kicking time, maximum ball speed, and phase duration (calculated as a percentage of the overall kicking motion); (3) forward translation of the COM and the support leg between the kicking phases, where the COM was normalized to height and the position of the support leg was normalized to leg length; (4) sagittal tilt angle (flexion/extension) and rotation angles of the lumbar spine, pelvis, and thorax at each phase and any dynamic changes; and (5) for the support leg, the sagittal flexion/extension angle and angular velocity of the hip, knee, and ankle at each kicking phase.
All statistical analyses were conducted using SPSS for Windows (Version 26.0; IBM Corp). Differences between the 2 groups (OSD vs NRL) were assessed using the unpaired t test or Mann-Whitney U test, as appropriate. Differences were considered significant for P values <.05.
Results
At baseline, 8 of the 57 players were diagnosed with OSD, and 2 players did not participate in the follow-up assessment; thus, 47 players were able to be evaluated. Of these participants, 19 boys were diagnosed with OSD and assigned to the OSD group: 12 boys had unilateral OSD (only in the support leg), and 7 boys had bilateral OSD. However, no boys had OSD only in the kicking leg. The remaining 28 boys were assigned to the NRL group.
There were no significant differences between the NRL and OSD groups in anthropometric measurements at baseline, growth changes 6 months later, or soccer experience (Table 1). No significant differences were noted in ball speed, kicking time, or duration of each kicking phase between the 2 groups (Table 2).
TABLE 1.
Comparison of Anthropometry and Soccer Experience a
| NRL (n = 28) | OSD (n = 19) | P | |
|---|---|---|---|
| Baseline | |||
| Age, y | 12.0 ± 0.2 | 12.2 ± 0.4 | .102 |
| Height, cm | 150.6 ± 6.8 | 153.4 ± 7.6 | .18 |
| Body weight, kg | 40.9 ± 6.9 | 44.2 ± 9.2 | .174 |
| Body mass index | 18.1 ± 2.3 | 18.6 ± 2.4 | .535 |
| 6-mo assessment | |||
| Increase in height, cm | 3.3 ± 1.4 | 3.5 ± 1.4 | .735 |
| Increase in weight, kg | 3.2 ± 1.2 | 3.5 ± 1.7 | .438 |
| Soccer experience, y | 6.2 ± 1.7 | 6.8 ± 1.7 | .219 |
a Data are reported as mean ± SD. NRL, normal group; OSD, Osgood-Schlatter disease group.
TABLE 2.
Comparison of Ball Speed, Kicking Time, and Phase Duration of 8 Kicking Phases a
| NRL | OSD | P | |
|---|---|---|---|
| Ball speed, m/s | 22.4 ± 2.3 | 22.5 ± 2.7 | .953 |
| Kicking time, ms | 571.7 ± 87.9 | 558.3 ± 65.3 | .575 |
| Duration of kicking phase, % b | |||
| Phase 1 → 2 | 29.6 ± 4.4 | 29.1 ± 5.6 | .705 |
| Phase 1 → 3 | 45.6 ± 5.3 | 46.0 ± 3.9 | .767 |
| Phase 1 → 4 | 53.4 ± 5.6 | 53.2 ± 3.7 | .89 |
| Phase 1 → 5 | 60.7 ± 5.9 | 60.2 ± 4.4 | .77 |
| Phase 1 → 6 | 65.9 ± 7.1 | 65.8 ± 4.6 | .994 |
| Phase 1 → 7 | 73.5 ± 6.6 | 73.5 ± 4.7 | .972 |
a Data are reported as mean ± SD. NRL, normal group; OSD, Osgood-Schlatter disease group.
b Duration of phase 1 → 8 = 100%.
Regarding the kicking motion analysis, the COM (Figure 3A) and the support leg (Figure 3B) at phases 1 and 3, respectively, were significantly closer to the ball in the OSD group than in the NRL group. The forward translation of the COM between phases 1 and 4 and phases 3 and 6 was significantly smaller in the OSD group than in the NRL group (P = .003 and P = .023, respectively). Moreover, the forward translation of the support leg between phases 3 and 6 in the OSD group was significantly smaller than that in the NRL group (P = .038) (Table 3).
Figure 3.

(A) Position of the center of mass from the ball (normalized to height). (B) Position of the support leg from the ball (normalized to leg length). *Statistically significant difference between groups (P < .05). COM, center of mass; NRL, normal group; OSD, Osgood-Schlatter disease group.
TABLE 3.
Comparison of Center of Mass and Support Leg Translation a
| NRL | OSD | P | |
|---|---|---|---|
| Translation of center of mass, m b | |||
| Phase 1 → 4 | 0.69 ± 0.07 | 0.61 ± 0.09 | .003 |
| Phase 3 → 6 | 0.25 ± 0.05 | 0.22 ± 0.04 | .023 |
| Translation of support leg, m c | |||
| Phase 3 → 6 | 0.29 ± 0.13 | 0.18 ± 0.22 | .038 |
a Data are reported as mean ± SD. P values indicate a statistically significant difference between groups (P < .05, t test). NRL, normal group; OSD, Osgood-Schlatter disease group.
b Normalized to height.
c Normalized to leg length.
The sagittal tilt angle of the lumbar spine, thorax, and pelvis at each kicking phase was similar between the 2 groups (Figure 4, A-C). The thorax started to flex (Figure 4B), and the pelvis started to tilt backward (Figure 4C) from phase 5 during the kicking motion before the ball impact (phase 7). The range of the flexion angle of the thorax from phase 5 to 7 was significantly smaller in OSD compared with NRL (P = .027) (Table 4). No differences in the change of lumbar tilt were noted between 2 groups.
Figure 4.

Sagittal tilt of the (A) lumbar spine, (B) thorax, and (C) pelvis. Positive values indicate backward tilt, and negative values indicate forward tilt. Rotation of the (D) lumbar spine, (E) thorax, and (F) pelvis. Positive values indicate rotation toward the side of the support leg, and negative values indicate rotation toward the side of the kicking leg. Circles indicate outliers. NRL, normal group; OSD, Osgood-Schlatter disease group.
TABLE 4.
Comparison of Range of Motion in Thoracic Sagittal Tilt and Pelvic Rotation a
| NRL | OSD | P | |
|---|---|---|---|
| Thoracic sagittal tilt, deg b | |||
| Phase 5 → 7 | –15.6 (–21.8 to –5.0) | –12.8 (–18.7 to 7.5) | .027 |
| Pelvic rotation, deg c | |||
| Phase 3 → 4 | 2.9 (–0.6 to 30.1) | 0.8 (–1.6 to 10.8) | .005 |
| Phase 3 → 6 | 22.0 (2.7 to 41.3) | 13.2 (2.4 to 30.8) | .017 |
a Data are reported as mean (range). P values indicate a statistically significant difference between groups (P < .05, Mann-Whitney U test). NRL, normal group; OSD, Osgood-Schlatter disease group.
b Positive values indicate backward tilt, and negative values indicate forward tilt.
c Positive values indicate rotation toward the side of the support leg, and negative values indicate rotation toward the side of the kicking leg.
The rotation angle of the lumbar spine, thorax, and pelvis at each kicking phase was similar between the 2 groups (Figure 4, D-F). During the kicking motion, the pelvis started to rotate toward the side of the support leg from phase 3 (Figure 4F) as the thorax started to rotate toward the side of the kicking leg after phase 3 (Figure 4E). The rotation angle of the pelvis from phase 3 to 4 and phase 3 to 6 was significantly smaller in the OSD group versus the NRL group (P = .005 and P = .017, respectively) (Table 4). No differences were noted in the change of lumbar rotation between the groups.
The flexion/extension angle of the knee, hip, and ankle in the support leg at each kicking phase was similar between the 2 groups (Figure 5, A-C). Figure 5A describes the dynamic motion of the knee in the support leg. The flexion angle of the knee in the support leg increased after the support leg contacted the ground (phase 4). After maximum knee flexion (phase 6), the knee in the support leg extended toward the ball. At ball impact (phase 7), the knee extension angular velocity of the support leg was significantly larger in the OSD group (P = .026) (Table 5). The flexion angle of the knee and hip in the support leg increased from phase 1 to 2, before ground contact of the support leg. The knee flexion angle of the support leg was significantly smaller in the OSD group at phase 1 (P = .042) (Table 5).
Figure 5.

Flexion/extension angle of the (A) knee, (B) hip, and (C) ankle for the support leg. Positive values indicate flexion, and negative values indicate extension. Circles indicate outliers. NRL, normal group; OSD, Osgood-Schlatter disease group.
TABLE 5.
Comparison of Knee Flexion or Extension Angular Velocity in the Support Leg a
| NRL | OSD | P | |
|---|---|---|---|
| Knee angular velocity in support leg, deg/s b | |||
| Phase 1 | 631.4 (74.3 to 1223.9) | 528.8 (–14.8 to 827.3) | .042 |
| Phase 7 | –92.7 (–434.9 to –154.7) | –218.2 (–392.0 to 448.4) | .026 |
a Data are reported as median (range). P values indicate a statistically significant difference between groups (P < .05, Mann-Whitney U test). NRL, normal group; OSD, Osgood-Schlatter disease group.
b Positive values indicate flexion, and negative values indicate extension. The flexion or extension angular velocity of the hip and ankle in the support leg at each kicking phase was similar between the 2 groups.
Discussion
This prospective study compared kicking motion before OSD onset between players who developed OSD in the support leg and those who did not after a 6-month follow-up. This study was the first to prospectively investigate the risk factors in developing OSD by analyzing a 3D kicking motion at each kicking phase focused on the dynamics of the support leg, COM translation, and pelvic rotation. The main findings of this study were that the COM translation, the dynamic changes of pelvic rotation and thoracic flexion, and the angular velocity of knee extension in the support leg during kicking motion were significantly different between the OSD and NRL groups. Moreover, no differences were noted in ball speed, kicking time, and phase duration of the kicking phase between the 2 groups. The COM forward shift and support leg translation, as well as the range of motion in thoracic flexion and pelvic rotation, were significantly smaller in the OSD group before the ball impact phase. Furthermore, the knee extension angular velocity of the support leg was significantly larger in the OSD group at the ball impact phase. Thus, focusing on these characteristics of kicking motion may help prevent or treat OSD.
The forward COM shift was smaller in the OSD group compared with that in the NRL group before ball impact. In the current study, the positions of the COM and support leg were measured at each kicking phase from the beginning of the kicking motion (phase 1), and the forward COM shift between the kicking phases was evaluated. The COM position at the beginning of the kicking motion (phase 1) and the position of the support leg right before ground contact (phase 3) were significantly closer to the ball in the OSD group. Furthermore, the range of motion in thoracic flexion just before ball impact was also smaller in the OSD group than in the NRL group. Consequently, the OSD group may have presented a small forward COM shift and obtained less anterior-posterior force from the beginning of the kicking motion until ball impact compared with the NRL group. A previous study reported that anterior-posterior force and forward COM shift increase ball speed, 18,22 which indicates that skilled kickers can present dynamic forward COM shift to increase ball speed. Therefore, the OSD group may not be skilled enough to present an anterior-posterior force before ball impact, which transfers to force that improves ball speed, potentially resulting in overload of the support leg. In support of this, Watanabe et al 26 reported that backward COM shifting during kicking increased the risk of OSD onset, which represents the lack of anterior-posterior force necessary for gaining ball speed. Their study is compatible with the current results that players who developed OSD could not produce enough anterior-posterior force via COM translation to gain ball speed during kicking.
Additionally, the OSD group performed less pelvic rotation before ball impact compared with the NRL group, which is an ineffective motion-obtaining force to improve ball speed. Skilled kickers have been reported to use a maximal or close to maximal pelvic range of motion during kicking, and a large range of motion in the pelvis increases ball speed. 12,13,15 Lees et al 13 indicated that a large change in the pelvic rotation was found just before ball impact, suggesting that muscles around the trunk are acting to increase the rotational speed of the pelvis, which leads to high ball speed. As a summary of the characteristics of kicking motion in the OSD group before ball impact, the dynamic motions of the trunk (eg, forward COM shift, range of pelvic rotation) were insufficient compared with those in the NRL group, which is considered as an unskilled motion to achieve high ball speed.
At the ball impact phase, the OSD group produced faster knee extension angular velocity of the support leg compared with the NRL group. Several studies have reported that the faster knee extension velocity of the support leg at ball impact contributes to the increase in ball velocity. 1,10 The intervention study of Augustus et al 1 indicated that the greater knee extension in the support leg during the final extension phase (ball impact) of the kicking stride served to vertically lift the hip in the support leg and promote the downward swing of the foot of the kicking leg toward the ball. Therefore, the faster knee angular velocity at ball impact may have improved the ball speed in the OSD group. Since the OSD group lacked a dynamic motion (small forward COM shift, small thoracic flexion, and pelvic rotation) at the preparation phase (before ball impact), the faster knee angular velocity at the ball impact may have been compensatory to produce the same ball speed as the NRL group. A previous study reported that greater activation of the quadriceps femoris muscle of the support leg occurs than that of the kicking leg during ball impact of the kicking motion. 2 Moreover, the fast knee extension of the support leg at ball impact may have increased the traction stress of the tibial tubercle through the quadriceps femoris muscle and resulted in OSD of the support leg. Additionally, Itoh et al 11 revealed that single-leg landing produced the highest knee extension moment compared with other motions during soccer training. Moreover, the knee extension moment of the support leg during the kicking motion is predicted to be higher than that during running or cutting.
According to the characteristics of the kicking motion of the players who developed OSD as revealed in the present study, the pathology of OSD onset is considered to be the following mechanisms. Even though the players cannot transmit energy because of COM translation generated by the run-up and the trunk rotation to the ball is insufficient before the ball impact phase, the same ball speed as that of the controls is achieved by enhancing power with the reaction force from the floor, obtained by stepping on the support leg (fast knee extension from 1-leg stand) as a compensatory action at ball impact, which seems to put more mechanical stress on the extensor mechanism of the support leg and thus influences development of OSD (Figure 6).
Figure 6.

Characteristics of the kicking motion in adolescent male soccer players developing Osgood-Schlatter disease.
Such kicking motion, depending on the knee extension velocity of the support leg at ball impact, can be an OSD risk factor for the support leg. The kicking motion with small trunk motion or small shift of COM may reflect the player’s lack of ability to produce the force from translation of COM, possibly resulting in overload of the support leg. Moreover, extending the supporting leg at the ball impact phase with fast speed directly causes more stress on the tibial tubercle and can be considered as an inherent risk during the kicking motion. Thus, adolescent soccer players are encouraged during training to focus on improving dynamic motion (forward COM shift, thoracic flexion, and pelvic rotation) before the ball impact phase rather than trying to extend the knee in the support leg more quickly at ball impact. Several studies have reported that kicking performance improved after trunk strengthening exercises 20,28 or manipulative intervention that improved the range of motion of the trunk. 7 Further studies are necessary to find the cause of the small COM translation and small trunk motion in the OSD group (eg, decreased flexibility or trunk strength, impaired motor coordination) because the years of soccer experience were similar between the OSD and NRL groups. Furthermore, we need to conduct a kicking technique intervention study to evaluate whether focusing on kicking mechanics may help prevent OSD.
This study had several limitations. First, it was conducted in a specific population of Japanese boys who regularly played soccer on the same team. Further studies with a larger number of participants are needed to confirm the current findings. Second, a force plate could not be used to measure ground-reaction force while the measurement to derive the maximum kicking motion was conducted at the gymnasium. Thus, the knee extension moment was not evaluated in this study. An experimental setting with a large force plate will be necessary to measure the ground-reaction force because the position of the ground contact of the support leg varies in each player and the distance of the kicking stride is also different. Third, as we did not perform a kicking motion analysis 6 months later, we should consider the possibility that the players could have changed their kicking form or technique by the end of the season. Finally, this study investigated the kicking motion characteristics associated with OSD onset in the support leg. Thus, another investigation for OSD onset in the kicking leg should be considered in the future.
Conclusion
A kicking motion with a small COM shift before ball impact and a fast knee extension angular velocity for the support leg at ball impact was associated with OSD onset in the support leg. Thoracic flexion and pelvic rotation before ball impact were also smaller in players who developed OSD. Adolescent male soccer players with a kicking motion that relies on the power gained via the knee extension of the support leg at ball impact may have an increased risk of developing OSD in the support leg.
Acknowledgment
The authors sincerely thank the players who participated in this study. They also thank Nao Shinoda, Satoshi Iizuka, Toshiharu Tsutsui, Hiroaki Sekino, and Wataru Sakamaki for their assistance in organizing examinations and Shinsuke Yoshioka and Hiroaki Nunome for their valuable advice on kicking motion analysis.
Footnotes
Final revision submitted November 10, 2021; accepted November 29, 2021.
One or more of the authors has declared the following potential conflict of interest or source of funding: This study was sponsored by a grant from the Mizuno Sports Promotion Foundation. AOSSM checks author disclosures against the Open Payments Database (OPD). AOSSM has not conducted an independent investigation on the OPD and disclaims any liability or responsibility relating thereto.
Ethical approval for this study was obtained from The University of Tokyo (No. 2018079NI).
References
- 1. Augustus S, Mundy P, Smith N. Support leg action can contribute to maximal instep soccer kick performance: an intervention study. J Sports Sci. 2017;35(1):89–98. [DOI] [PubMed] [Google Scholar]
- 2. Brophy RH, Backus SI, Pansy BS, Lyman S, Williams RJ. Lower extremity muscle activation and alignment during the soccer instep and side-foot kicks. J Orthop Sports Phys Ther. 2007;37(5):260–268. [DOI] [PubMed] [Google Scholar]
- 3. Burnett DR, Campbell-Kyureghyan NH, Topp RV, Quesada PM. Biomechanics of lower limbs during walking among candidates for total knee arthroplasty with and without low back pain. Biomed Res Int. 2015;2015:142562. [DOI] [PMC free article] [PubMed] [Google Scholar]
- 4. Cappello A, Cappozzo A, Palombara PFL, Lucchetti L, Leardini A. Multiple anatomical landmark calibration for optimal bone pose estimation. Human Mov Sci. 1997;16(2-3):259–274. [Google Scholar]
- 5. Czyrny Z. Osgood-Schlatter disease in ultrasound diagnostics—a pictorial essay. Med Ultrason. 2010;12(4):323–335. [PubMed] [Google Scholar]
- 6. de Lucena GL, dos Santos Gomes C, Guerra RO. Prevalence and associated factors of Osgood-Schlatter syndrome in a population based sample of Brazilian adolescents. Am J Sports Med. 2011;39(2):415–420. [DOI] [PubMed] [Google Scholar]
- 7. Deutschmann KC, Jones AD, Korporaal CM. A non-randomised experimental feasibility study into the immediate effect of three different spinal manipulative protocols on kicking speed performance in soccer players. Chiropr Man Therap. 2015;23(1):1. [DOI] [PMC free article] [PubMed] [Google Scholar]
- 8. Fousekis K, Τsepis E, Vagenas G. Lower limb strength in professional soccer players: profile, asymmetry, and training age. J Sports Sci Med. 2010;9(3):364–373. [PMC free article] [PubMed] [Google Scholar]
- 9. Hirano A, Fukubayashi T, Ishii T, Ochiai N. Magnetic resonance imaging of Osgood-Schlatter disease: the course of the disease. Skeletal Radiol. 2002;31(6):334–342. [DOI] [PubMed] [Google Scholar]
- 10. Inoue K, Nunome H, Sterzing T, Shinkai H, Ikegami Y. Dynamics of the support leg in soccer instep kicking. J Sports Sci. 2014;32(11):1023–1032. [DOI] [PubMed] [Google Scholar]
- 11. Itoh G, Ishii H, Kato H, Nagano Y, Hayashi H, Funasaki H. Risk assessment of the onset of Osgood-Schlatter disease using kinetic analysis of various motions in sports. PLoS One. 2018;13(1):e0190503. [DOI] [PMC free article] [PubMed] [Google Scholar]
- 12. Lees A, Asai T, Andersen TB, Nunome H, Sterzing T. The biomechanics of kicking in soccer: a review. J Sports Sci. 2010;28(8):805–817. [DOI] [PubMed] [Google Scholar]
- 13. Lees A, Steward I, Rahnama N, Barton G. Understanding lower limb function in the performance of the maximal instep kick in soccer. In: Reilly T, Atkinson G, eds. Proceedings of the 6th International Conference on Sport, Leisure and Ergonomics. Routledge; 2009:149–160. [Google Scholar]
- 14. Le Gall F, Carling C, Reilly T, Vandewalle H, Church J, Rochcongar P. Incidence of injuries in elite French youth soccer players: a 10-season study. Am J Sports Med. 2006;34(6):928–938. [DOI] [PubMed] [Google Scholar]
- 15. Levanon J, Dapena J. Comparison of the kinematics of the full-instep and pass kicks in soccer. Med Sci Sports Exerc. 1998;30(6):917–927. [DOI] [PubMed] [Google Scholar]
- 16. Nunome H, Asai T, Ikegami Y, Sakurai S. Three-dimensional kinetic analysis of side-foot and instep soccer kicks. Med Sci Sports Exerc. 2002;34(12):2028–2036. [DOI] [PubMed] [Google Scholar]
- 17. Omodaka T, Ohsawa T, Tajika T, et al. Relationship between lower limb tightness and practice time among adolescent baseball players with symptomatic Osgood-Schlatter disease. Orthop J Sports Med. 2019;7(5):2325967119847978. [DOI] [PMC free article] [PubMed] [Google Scholar]
- 18. Orloff H, Sumida B, Chow J, Habibi L, Fujino A, Kramer B. Ground reaction forces and kinematics of plant leg position during instep kicking in male and female collegiate soccer players. Sports Biomech. 2008;7(2):238–247. [DOI] [PubMed] [Google Scholar]
- 19. Osgood RB. Lesions of the tibial tubercle occurring during adolescence: 1903. Clin Orthop Relat Res. 1993;286:4–9. [PubMed] [Google Scholar]
- 20. Prieske O, Muehlbauer T, Borde R, et al. Neuromuscular and athletic performance following core strength training in elite youth soccer: role of instability. Scand J Med Sci Sports. 2016;26(1):48–56. [DOI] [PubMed] [Google Scholar]
- 21. Schlatter C. Injury to the “pecker-shaped” appendage of the upper tibial epiphysis. Article in German. BeitrKlin Chir. 1903;8:874–887. [Google Scholar]
- 22. Tojima M, Ogata N, Yozu A, Sumitani M, Haga N. Novel 3-dimensional motion analysis method for measuring the lumbar spine range of motion: repeatability and reliability compared with an electrogoniometer. Spine. 2013;38(21):1327–1333. [DOI] [PubMed] [Google Scholar]
- 23. Tojima M, Takei S, Torii S. Factors associated with ball velocity and low back pain during kicking in adolescent soccer players. Open Access J Sports Med. 2020;11:133–143. [DOI] [PMC free article] [PubMed] [Google Scholar]
- 24. Tojima M, Torii S. Changes in lumbopelvic rhythm during trunk extension in adolescent soccer players. Gait Posture. 2017;52:72–75. [DOI] [PubMed] [Google Scholar]
- 25. Tojima M, Torii S. Difference in kick motion of adolescent soccer players in presence and absence of low back pain. Gait Posture. 2018;59:89–92. [DOI] [PubMed] [Google Scholar]
- 26. Watanabe H, Fujii M, Yoshimoto M, et al. Pathogenic factors associated with Osgood-Schlatter disease in adolescent male soccer players: a prospective cohort study. Orthop J Sports Med. 2018;6(8):2325967118792192. [DOI] [PMC free article] [PubMed] [Google Scholar]
- 27. Watanabe K, Nunome H, Inoue K, Iga T, Akima H. Electromyographic analysis of hip adductor muscles in soccer instep and side-foot kicking. Sports Biomech. 2020;19(3):295–306. [DOI] [PubMed] [Google Scholar]
- 28. Young WB, Rath DA. Enhancing foot velocity in football kicking: the role of strength training. J Strength Cond Res. 2011;25(2):561–566. [DOI] [PubMed] [Google Scholar]