

Abstract
Objectives:
This article aims to examine the disparities in dental service utilization among 3 age groups: younger adults (20–49 y), middle-aged adults (50–64 y), and older adults (65+ y), among Whites, Hispanics, Blacks, Asians, American Indians or Alaska Natives (AIAN), and Native Hawaiian or other Pacific Islanders (NHOPI).
Methods:
Weighted logistic regression models were conducted to analyze 9 waves of cross-sectional survey data (2002–2018) from the Behavioral Risk Factor Surveillance System. We estimated age group- and race/ethnic–specific prevalences of dental service utilization adjusting sociodemographics and self-rated health for each wave and compared with crude analysis. Next, we performed linear regression analysis of the trend of adjusted prevalences over time and the average level by race/ethnicity and age groups.
Results:
Racial/ethnic disparities increased with age, even though the adjusted prevalences of dental service utilization were less apparent than the crude analysis. The all-wave average prevalence was 71%. Black older adults had the lowest level of dental service utilization (65%) as compared with the 2 highest groups: White older adults (79%) and Asian older adults (76%). The general younger adult populations had low prevalences, with the lowest among Asian younger adults (65%). AIAN and NHOPI individuals from all age groups tended to have average or below average prevalences. In addition, a decreasing trend of dental service utilization was observed among White individuals of all age groups (0.2%–0.3% lower per year, P < 0.01) and AIAN younger adults (0.5% lower per year, P < 0.01).
Conclusion:
Health policy, federal funding, and community-based programs should address the needs of dental service utilization for racial/ethnic minorities including Blacks, AIANs, and NHOPIs.
Knowledge Transfer Statement:
Our study offers insights into our understanding of disparities in dental service utilization among minority racial/ethnic groups. As health policy, federal funding, and community-based programs seek to improve oral health, there is a need to address access to and utilization of dental service for Blacks, American Indians or Alaska Natives, and Native Hawaiian or other Pacific Islanders.
Keywords: oral health, minority groups, social class, cross-sectional studies, Medicaid, health surveys
Introduction
Oral health is an essential component of an individual’s overall health and has an impact on their quality of life throughout the life span (Shuman et al. 2017; Henshaw et al. 2018). Strong evidence shows that engaging in regular dental checkups can prevent oral diseases and promote oral health outcomes (Griffin et al. 2012). However, significant unmet dental care needs exist in adult populations and in racial/ethnic minorities in particular (Shi et al. 2010; Shelley et al. 2011; Zhang 2016; Zhang et al. 2019), because of reasons such as financial barriers (Bhoopathi et al. 2020), lack of transportation, and assistance in navigating the health care system (Montini et al. 2014). As a result, there are substantial disparities in tooth loss (Wu et al. 2012; Luo et al. 2015), tooth decay (Wu et al. 2011; Liang et al. 2013; Hybels et al. 2016), and oral health–related quality of life (Huang and Park 2015) among U.S. minority populations.
Limited studies have been conducted on dental service utilization across age groups in the adult population. Studies conducted in Europe showed patterns of declining utilization of dental services with age in middle-aged and older adults (Åstrøm et al. 2013; Åstrøm et al. 2014). Using 5 waves of data from the Health and Retirement Study, Zhang and colleagues (2019) found that annual dental service utilization peaked at about 75 to 80 y of age among adults (50+ y) in the United States. Some evidence also suggests that the rate of dental care use has declined among the adult population in recent years. Using the Medical Expenditure Panel Survey, one study found that there was a steady decline of dental care utilization among adults (age 19–64 y) from 41.2% in 2003 to 37.0% in 2010, and Hispanics and Blacks were less likely to visit a dentist as compared with Whites (Vujicic and Nasseh 2014).
There is a scarcity of literature on the use of dental services among Native Americans, namely, American Indians, Alaska Natives, and Native Hawaiians. Based on the Survey of Elders administered by the National Resource Center on Native American Aging, the prevalence of annual dental care utilization increased from 49.1% (2008–2011) to 56.7% (2014–2017) among older Native Americans (age 65+ y); however, these figures are still lower than the national average, which was 62.7% in 2015 (Schroeder et al. 2019). In addition, a population-based survey found similar racial/ethnic disparities in dental care utilization between 1999 and 2008 among middle-aged and older adults (Wu et al. 2013).
To our knowledge, no studies to date have examined dental service utilization across age groups, including younger, middle-aged, and older adults, for all racial/ethnic groups in the United States. Using 9 waves of even-year Behavioral Risk Factor Surveillance System (BRFSS) data between 2002 and 2018, this study aimed to address the knowledge gap by conducting a trend analysis of dental service utilization among U.S. adults for 3 age groups: 20 to 49, 50 to 65, and 65 y or older and 6 major racial/ethnic groups: Whites, Hispanics, Blacks, Asians, American Indians or Alaska Natives (AIANs), and Native Hawaiian or other Pacific Islanders (NHOPI). We hypothesized that the disparities in dental service utilization would persist among the 6 racial/ethnic groups within all age groups and that there would be a decline in dental care utilization after 2009, because dental coverage was reduced to emergency care only for adults enrolled in the Medicaid program in 2009.
Methods
Data Source
The BRFSS is a nationally representative, annual telephone survey conducted by the Centers for Disease Control and Prevention (CDC). BRFSS collects state data about the U.S. noninstitutionalized population aged18 y and older regarding their health-related risk behaviors, chronic health conditions, and use of preventive services. BRFSS collects data in all 50 states as well as the District of Columbia, American Samoa, Palau, Puerto Rico, the U.S. Virgin Islands, and Guam. Data collection is conducted separately by each state. The sampling design uses state-level, random-digit-dialed probability samples of the adult population. All projects use a disproportionate stratified sample design, except for Guam, Puerto Rico, and the U.S. Virgin Islands, which use a simple random sample design. From the 1980s to 2010, BRFSS surveys data were conducted on landlines using poststratification weighting strategy. Since 2011, the BRFSS conducts surveys on both landline and cell phone numbers, and the weighting strategy has moved to the iterative proportional fitting (raking) method. The final sample is weighted to 8 margins: gender by age group, race/ethnicity, education, marital status, tenure, gender by race/ethnicity, age group by race/ethnicity, and phone ownership. Geographic region was also considered in the weighting process. The sample size ranges from ~250,000 to 500,000 per wave from 2002 to 2018. CDC has determined that the collection of information in the BRFSS is exempt from institutional review. Verbal consent is obtained during the initial contact and screening process, and all publicly available survey data are de-identified.
Measures
Dependent variable
The dependent variable was dental service utilization within the past year (i.e., if the participant visited a dentist or a dental clinic for any reason within the past year, including visits to dental specialists, such as orthodontists). This question was asked annually from 1995 to 2006 and biannually in even years since 2008; therefore, we used even-year survey data for the analysis. Even-year survey data from 2002 to 2018 were included in the study, because Asian and NHOPI were disaggregated only in 2001, and the dental questionnaire was asked in even years since 2008.
Exposure variables: race/ethnicity, age, and survey year
Six racial/ethnic groups were included in the study: Whites, Hispanics, Blacks, Asians, AIANs, and NHOPIs. Age was aggregated into 3 groups: younger (20–49 y), middle-aged (50–64 y), or older (65+ y) adults, because of limited sample sizes for Asians, AIANs, and NHOPIs. Participants aged 18 to 19 y were excluded because of different dental care coverage between the child and adult population (children 19 y or younger can be covered by the CHIP Medicaid program).
Covariates included sex (male or female), educational attainment (high school or lower, 1–3 y of college, or 4 y or more of college), marital status (married or partnered, divorced or separated, widowed, or never married), income level (less than $15,000, $15,000–$24,999, $25,000–$34,999, $35,000–$40,999, $50,000 or higher, or unknown), employment status (employed for wages, self-employed, out of work, homemaker, student, retired, or unable to work), had health care coverage or not, self-rated general health (excellent, very good, good, fair, or poor), and number of teeth removed (0, 1–5, or 6–31). Edentulous participants who had no teeth were excluded from the analysis. The derivation of the final analytic samples is presented in Figure 1.
Figure 1.
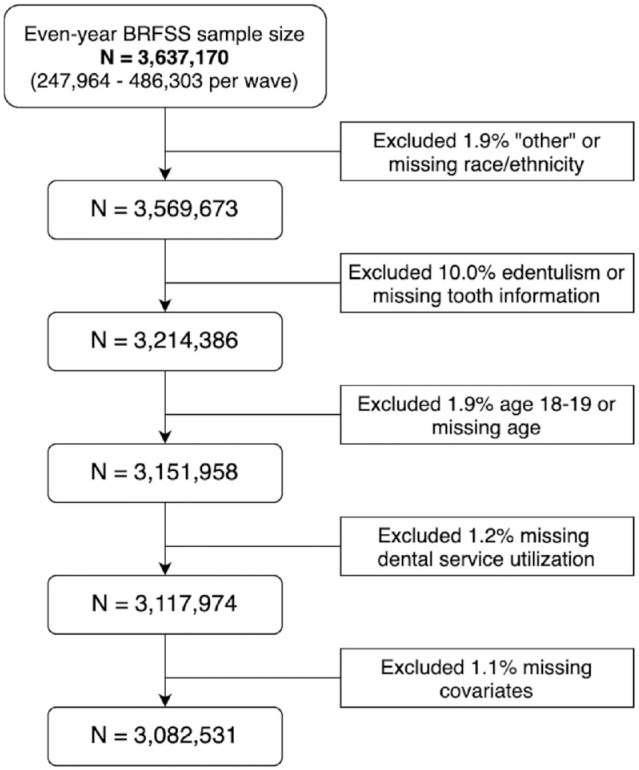
Derivation of analytical sample size of even-year Behavioral Risk Factor Surveillance System data from 2002 to 2018.
Statistical Analysis
We performed a separate analysis for each wave because of the large sample sizes and the changes in survey sampling strategy in 2011. Descriptive analyses were first carried out to examine sample characteristics for all samples and for each racial/ethnic group. We then estimated age and the racial/ethnic–specific crude prevalence of dental service utilization and the corresponding 95% confidence intervals (CIs). Adjusted age group– and racial/ethnic–specific prevalences were calculated from multivariable logistic regression models, with an interaction between age and race/ethnicity controlling all covariates. All of the above analyses were weighted to account for the complex survey design. Lastly, we conducted piecewise linear regression analysis to test whether there was a slope change in the adjusted prevalence between 2002 to 2008 and 2010 to 2018 for each age and racial/ethnic group. The slope of change was only marginally significant (βˆ = 0.87%, P = 0.10) among older Asian adults (65+ y); therefore, we performed linear regression analysis to estimate the mean prevalence and the rate of change (slope) from 2002 to 2018.
This study of cross-sectional data conformed to the STROBE guidelines, as indicated in Appendix Table 4.
Results
Sample Characteristics
Appendix Table 1 shows the sample size by race/ethnicity and by age group for all waves from 2002 to 2018. The total analytical sample was 3,082,531, including 80% Whites, 7.7% Hispanics, 8.1% Blacks, 2.1% Asians, 1.6% AIANs, and 0.5% NHOPIs. The proportions for younger, middle-aged, and older adults were 40.6%, 31.6%, and 27.8%, respectively. The proportion of older adults increased gradually from 17.0% in 2002 to 33.1% in 2018. Weight summary statistics of all variables by race/ethnicity for each wave are available upon request. In general, Hispanics had the highest proportion of high school or lower educational attainment, ranging from 56.6% to 62.4% in the nine waves, whereas Asians had the lowest proportions ranging from 12.3% to 19.5%. About half of Blacks and AIANs and a quarter of Whites had high school or lower educational attainment. Similar patterns were found for household income, with ~50% of Whites and Asian but 20% to 30% of Hispanics, Blacks, and AIANs having an annual household income greater than $50,000.
Crude and Adjusted Prevalence
As illustrated in Figure 2, the adjusted dental service utilization disparities among race/ethnicity were less apparent than in the crude analysis. Appendix Table 2 shows the crude and adjusted prevalences of dental service utilization with 95% CIs by age group and race/ethnicity and the difference between crude and adjusted numbers and their respective means. The average adjusted prevalences for Hispanics were 12% higher than the crude analysis among young adults and 12.2% and 8.7% higher among middle-aged and older adults, respectively. And the changes were the biggest among all racial/ethnic groups. Similar patterns were found among Blacks, AIANs and NHOPIs with differences between 6.9%- 9.0%, 6.1-9.0%, and 2.3%-2.9%, respectively. On the contrary, the adjusted prevalence of dental service use among Whites and Asians were lower than the crude prevalences with mean differences between 0.2%-0.8% for Whites and 1.1%-5.4% for Asian. Further, the figured showed that the racial/ethnic disparities increased by age.
Figure 2.

Crude and adjusted prevalence of dental service utilization from 2002 to 2018 for Whites, Blacks, Hispanics, Asian, American Indians or Alaska Natives, and Native Hawaiian or other Pacific Islanders younger (20–49 y), middle-aged (50–64 y), and older adults (65+ y).
Age and Racial/Ethnic Disparities
Figure 3 plots the mean prevalences of dental service utilization versus the rate of prevalence change per year by age group and race/ethnicity obtained from linear regression analysis (see Appendix Table 3 for numeric values). The bottom-left area shows the groups with a low mean prevalence with decreasing trends over time, and the top-right corner area lists the groups with a high mean prevalence with increasing trends. White and Asian middle-aged and older adults appeared to have the highest prevalences (76%–79%), about 10% higher than their counterpart younger adults. Hispanics of all age groups (71.1%–74%) had an above-average prevalence of 71%, while Blacks of all age groups (64%–70%) had a below-average prevalence. AIANs and NHOPIs also tended to have average or below-average prevalences, with a decreasing trend overtime. In addition, younger adults generally had low prevalences. Overall, among all of the groups, Black adults and Asian younger adults had the lowest prevalences (64% and 65%, respectively). In addition, we observed a decreasing trend in dental visits among Whites of all age groups (0.2%–0.3% lower per year, P < 0.01) and AIAN younger adults (0.5% lower per year, P < 0.01).
Figure 3.

Mean prevalence (y-axis) and rate of change per year (y-axis) of dental service utilization from 2012 to 2018 for White, Black, Hispanic, Asian, American Indians or Alaska Native, and Native Hawaiian or other Pacific Islander (NHOPI) younger (20–49 y), middle-aged (50–64 y), and older adults (65+ y) estimated from the linear regression analysis of the adjusted wave-specific prevalences. Dotted lines are the 95% confidence intervals (CIs) for the point estimates. The 95% CI for the NHOPI middle-aged and older groups were omitted because of very large intervals.
Discussion
In analyzing the BRFSS data from 2002 to 2018, we examined racial/ethnic disparities in dental service utilization among younger (20–49 y), middle-aged (50–64 y), and older (65+) adults in the United States. We found that the disparities were less apparent after adjusting for sex, education, income, marital status, and employment status but more noticeable among older adults. The AIAN/NHOPI populations had rates of dental services utilization that were lower than the national average, and Black older adults and Asian younger adults had the lowest rate among all groups. There was no sufficient evidence to support a decline in dental care utilization after dental coverage was reduced to emergency care only for adults enrolled in the Medicaid program in 2009.
Our study findings are consistent with previous studies highlighting the significant disparities in dental service utilization across racial/ethnic groups in the BRFSS (Shi et al. 2010; Shelley et al. 2011; Zhang 2016; Zhang et al. 2019). To expand beyond the previous studies, we included AIANs and NHOPIs in our comparison. This is partially because of their high level of unmet dental needs (Horner-Johnson et al. 2015). Although one recent study found a significant increase in dental visits in the proportion of AIAN elders between 2008 and 2017 (Schroeder et al. 2019), our findings suggest that AIANs, along with NHOPIs and Blacks, still reported the lowest rate of dental service use in general, and these disparities were largely explained by their socioeconomic status and lack of dental insurance. Access to dental care is a particular challenge for Native Americans. Indian Health Services (IHS) is the main federal agency providing health care for AIANs in the United States. Recruitment and retention of dental health care professionals is a continuing and worsening problem for IHS because of low salaries, length of commitment required, more attractive employment opportunities elsewhere, and other factors. Furthermore, not long ago, most older Native Americans received dental care only for the relief of symptoms, and fewer than one-third who sought care had a routine oral examination (Jones et al. 2000); it is unclear whether this practice has changed over the past decade.
For Blacks, a low utilization of dental services reflects their accumulated disadvantages across the life span. Many Blacks face the challenges of structural and financial barriers of accessing dental care as well as potential racial discriminations that could affect their health-seeking behaviors. In addition, Blacks are underrepresented in dental professionals. It is essential to improve access care for minority populations by expanding dental coverage, developing culturally appropriate services, and increase the diversity of the dental care workforce. Given the fact that the BRFSS does not interview Asian Americans in their native language, this survey is most likely to exclude individuals who have limited proficiency of English and, consequently, by large exclude those with lower socioeconomic status. Therefore, the actual disparity in dental service utilization could be even wider. The Asian population in the United States warrants attention from researchers, as it is growing at a faster rate than any other ethnic groups and is exceptionally diverse.
Although it may be physically and financially challenging to provide adequate dental care to this population, the implementation of innovative programs and services will be critically important to prevent oral health diseases and conditions. Recently, efforts have been made at the federal level to induce health care profession schools to introduce students to career opportunities offered by the IHS. From a research perspective, to date, many fundamental aspects of AIANs’ health, including oral health, have not been systematically addressed. One study, for instance, revealed that having health insurance was significantly related to a past-year dental visit for Hispanics, regardless of their immigration and acculturation status (Akinkugbe et al. 2020). In addition to insurance status, another overlooked factor to reduce disparities is to improve the workforce racial/ethnic diversity of dental providers. Along this line, one study suggests that to meet the needs of the AIAN population, the number of AIAN dentists needs to increase more than 7-fold (Mertz et al. 2017).
Our findings support the cumulative advantage/disadvantage theory (Dannefer 2003) and show that racial/ethnic disparities in dental service utilization are more substantial in older age groups than in younger groups. When racial/ethnic disparities are largely explained by sociodemographic covariates for the younger age groups, disparities remain substantial for those 65 y and older. This finding is in line with results from prior research on older adults (Åstrøm et al. 2013; Åstrøm et al. 2014; Zhang et al. 2019). These findings may reflect the increased need for dental care services as people get older. Previous studies found that oral health problems and diseases accumulate over the life course, and oral health problems may be more common in old age (Dye et al. 2007; Luo et al. 2015). On the other hand, because Medicare does not cover dental expenses, and most dental costs are covered either by private dental insurance or paid out of pocket, the affordability of dental care reflects much on individuals’ financial resources; thus, the gap of the issue with regard to dental care affordability is more prominent among older adults and among minority older adults in particular. Although the cross-sectional nature of our data prevents us from identifying the effect of age, our findings suggest that there might be a systemic tendency for divergence in dental service use as people age because of cumulative advantage/disadvantage in resources. This may be especially true for racial/ethnic minorities such as Blacks, AIANs, and NHOPIs, whose disparities in dental service use become more substantial in older age than in younger age.
There are several limitations of this study that need to be addressed. First, our data are cross-sectional; thus, we were unable to make causal inference or investigate the temporal relation between service use and age. The trend over 20 y could be confounded by cohort effects; however, the sample sizes were not sufficient for an age-period-cohort analysis. In addition, survey data are susceptible to nonresponse and recall bias. For example, the dental service use measure was self-reported and might be subject to measurement error. Because of the small sample sizes for NHOPI, data might not be generalizable to the entire population. The trends for the White population and younger adults in all racial ethnic groups were more stable and linear than in other groups. This might be partially due to the much large sample sizes of the White and younger adult groups. Furthermore, BRFSS did not collect data on the reasons for a dental visit; therefore, we were unable to identify whether the use of a particular service was for a regular checkup, dental treatment, or dental diagnosis. Moreover, despite carefully controlling for as many confounders as possible, there is still a possibility of residual confounding by other variables that were not included in the survey (i.e., social support and health behaviors). Despite these limitations, our study is innovative, as it offers insights into our understanding of disparities in dental service use by examining disparities among minority racial/ethnic groups. As health policy, federal funding, and community-based programs seek to improve oral health, there is a need to address the access to and utilization of dental service for Blacks, AIANs, and NHOPIs.
Author Contributions
Y.Y. Wu, W. Zhang, B. Wu, contributed to conception, design, data acquisition, analysis, and interpretation, drafted and critically revised the manuscript. All authors gave final approval and agree to be accountable for all aspects of the work.
Supplemental Material
Supplemental material, sj-pdf-1-jct-10.1177_23800844211012660 for Disparities in Dental Service Use among Adult Populations in the United States by Y.Y. Wu, W. Zhang and B. Wu in JDR Clinical & Translational Research
Footnotes
A supplemental appendix to this article is available online.
Declaration of Conflicting Interests: The authors declared no potential conflicts of interest with respect to the research, authorship, and/or publication of this article.
Funding: The authors disclosed receipt of the following financial support for the research, authorship, and/or publication of this article: B.W. is supported by the National Institute of Dental & Craniofacial Research of the National Institutes of Health under award U01DE027512 and the National Institute on Aging under award 1R56AG067619. The content is solely the responsibility of the authors and does not necessarily represent the official views of the National Institutes of Health.
ORCID iD: B. Wu  https://orcid.org/0000-0002-6891-244X
References
- Akinkugbe AA, Raskin SE, Donahue EE, Youngblood ME, Laniado NN, Perreira KM. 2020. Prevalence and patterns of dental care utilization among us-born and non-us born hispanics in the hispanic community health study/study of latinos. JDR Clin Trans Res. 6(2):222–233. [DOI] [PMC free article] [PubMed] [Google Scholar]
- Åstrøm AN, Ekback G, Nasir E, Ordell S, Unell L. 2013. Use of dental services throughout middle and early old ages: a prospective cohort study. Community Dent Oral Epidemiol. 41(1):30–39. [DOI] [PubMed] [Google Scholar]
- Åstrøm AN, Ekback G, Ordell S, Nasir E. 2014. Long-term routine dental attendance: influence on tooth loss and oral health-related quality of life in swedish older adults. Community Dent Oral Epidemiol. 42(5):460–469. [DOI] [PubMed] [Google Scholar]
- Bhoopathi V, Luo H, Moss M, Bhagavatula P. 2020. Unmet dental care need and associated barriers by race/ethnicity among us adults. JDR Clin Trans Res. 6(2):213–221. [DOI] [PubMed] [Google Scholar]
- Dannefer D. 2003. Cumulative advantage/disadvantage and the life course: cross-fertilizing age and social science theory. J Gerontol B Psychol Sci Soc Sci. 58(6):S327–S337. [DOI] [PubMed] [Google Scholar]
- Dye BA, Tan S, Smith V, Lewis BG, Barker LK, Thornton-Evans G, Eke PI, Beltrán-Aguilar ED, Horowitz AM, Li CH. 2007. Trends in oral health status: United states, 1988-1994 and 1999-2004. Vital Health Stat. 11(248):1–92. [PubMed] [Google Scholar]
- Griffin SO, Jones JA, Brunson D, Griffin PM, Bailey WD. 2012. Burden of oral disease among older adults and implications for public health priorities. Am J Public Health. 102(3):411–418. [DOI] [PMC free article] [PubMed] [Google Scholar]
- Henshaw MM, Garcia RI, Weintraub JA. 2018. Oral health disparities across the life span. Dent Clin North Am. 62(2):177–193. [DOI] [PubMed] [Google Scholar]
- Horner-Johnson W, Dobbertin K, Beilstein-Wedel E. 2015. Disparities in dental care associated with disability and race and ethnicity. J Am Dent Assoc. 146(6):366–374. [DOI] [PubMed] [Google Scholar]
- Huang DL, Park M. 2015. Socioeconomic and racial/ethnic oral health disparities among us older adults: oral health quality of life and dentition. J Public Health Dent. 75(2):85–92. [DOI] [PMC free article] [PubMed] [Google Scholar]
- Hybels CF, Wu B, Landerman LR, Liang J, Bennett JM, Plassman BL. 2016. Trends in decayed teeth among middle-aged and older adults in the united states: socioeconomic disparities persist over time. J Public Health Dent. 76(4):287–294. [DOI] [PMC free article] [PubMed] [Google Scholar]
- Jones DB, Niendorff WJ, Broderick EB. 2000. A review of the oral health of american indian and alaska native elders. J Public Health Dent. 60(suppl 1):256–260. [DOI] [PubMed] [Google Scholar]
- Liang J, Wu B, Plassman B, Bennett J, Beck J. 2013. Racial disparities in trajectories of dental caries experience. Community Dent Oral Epidemiol. 41(6):517–525. [DOI] [PMC free article] [PubMed] [Google Scholar]
- Luo H, Pan W, Sloan F, Feinglos M, Wu B. 2015. Forty-year trends of tooth loss among american adults with and without diabetes mellitus: an age-period-cohort analysis. Prev Chronic Dis. 12:E211. [DOI] [PMC free article] [PubMed] [Google Scholar]
- Mertz E, Wides C, Gates P. 2017. The american indian and alaska native dentist workforce in the united states. J Public Health Dent. 77(2):125–135. [DOI] [PMC free article] [PubMed] [Google Scholar]
- Montini T, Tseng TY, Patel H, Shelley D. 2014. Barriers to dental services for older adults. Am J Health Behav. 38(5):781–788. [DOI] [PubMed] [Google Scholar]
- Schroeder S, Adamsen C, Ward C. 2019. Dental care utilization and service needs among american indian/alaska native/native hawaiian elders: 2008 to 2017. J Aging Health. 31(10):1917–1940. [DOI] [PubMed] [Google Scholar]
- Shelley D, Russell S, Parikh NS, Fahs M. 2011. Ethnic disparities in self-reported oral health status and access to care among older adults in nyc. J Urban Health. 88(4):651–662. [DOI] [PMC free article] [PubMed] [Google Scholar]
- Shi L, Lebrun LA, Tsai J. 2010. Access to medical care, dental care, and prescription drugs: the roles of race/ethnicity, health insurance, and income. South Med J. 103(6):509–516. [DOI] [PubMed] [Google Scholar]
- Shuman S, Chen X, Friedman PK, Ghezzi EM, Saunders MJ, Wu B. 2017. Oral health: an essential element of healthy aging. Washingon (DC): Gerontological Society of America. Accessed 2020 Nov 11. https://www.geron.org/images/gsa/documents/oralhealth.pdf [Google Scholar]
- Vujicic M, Nasseh K. 2014. A decade in dental care utilization among adults and children (2001-2010). Health Serv Res. 49(2):460–480. [DOI] [PMC free article] [PubMed] [Google Scholar]
- Wu B, Liang J, Luo H, Furter R. 2013. Racial and ethnic variations in preventive dental care utilization among middle-aged and older americans, 1999-2008. Front Public Health. 1:65. [DOI] [PMC free article] [PubMed] [Google Scholar]
- Wu B, Liang J, Plassman BL, Remle RC, Bai L. 2011. Oral health among white, black, and mexican-american elders: an examination of edentulism and dental caries. J Public Health Dent. 71(4):308–317. [DOI] [PMC free article] [PubMed] [Google Scholar]
- Wu B, Liang J, Plassman BL, Remle C, Luo X. 2012. Edentulism trends among middle-aged and older adults in the united states: comparison of five racial/ethnic groups. Community Dent Oral Epidemiol. 40(2):145–153. [DOI] [PMC free article] [PubMed] [Google Scholar]
- Zhang W, Wu YY, Wu B. 2019. Racial/ethnic disparities in dental service utilization for foreign-born and U.S.-born middle-aged and older adults. Res Aging. 41(9):845–867. [DOI] [PMC free article] [PubMed] [Google Scholar]
- Zhang Y. 2016. Racial/ethnic disparity in utilization of general dental care services among us adults: medical expenditure panel survey 2012. J Racial Ethn Health Disparities. 3(4):565–572. [DOI] [PubMed] [Google Scholar]
Associated Data
This section collects any data citations, data availability statements, or supplementary materials included in this article.
Supplementary Materials
Supplemental material, sj-pdf-1-jct-10.1177_23800844211012660 for Disparities in Dental Service Use among Adult Populations in the United States by Y.Y. Wu, W. Zhang and B. Wu in JDR Clinical & Translational Research