Abstract
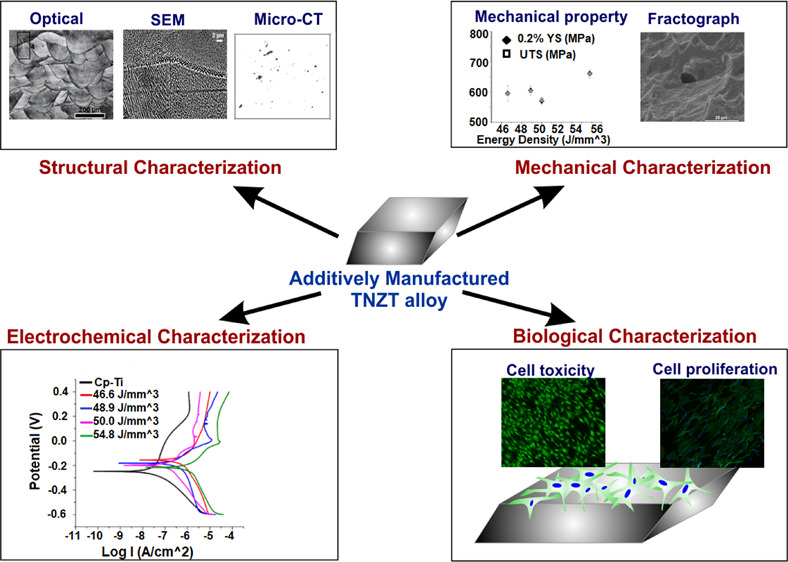
Laser powder bed fusion (L-PBF) was attempted here to additively manufacture a new generation orthopedic β titanium alloy Ti–35Nb–7Zr–5Ta toward engineering patient-specific implants. Parts were fabricated using four different values of energy density (ED) input ranging from 46.6 to 54.8 J/mm3 through predefined laser beam parameters from prealloyed powders. All the conditions yielded parts of >98.5% of theoretical density. X-ray microcomputed tomography analyses of the fabricated parts revealed minimal imperfections with enhanced densification at a higher ED input. X-ray diffraction analysis indicated a marginally larger d-spacing and tensile residual stress at the highest ED input that is ascribed to the steeper temperature gradients. Cellular to columnar dendritic transformation was observed at the highest ED along with an increase in the size of the solidified features indicating the synergetic effects of the temperature gradient and solidification growth rate. Density measurements indicated ≈99.5% theoretical density achieved for an ED of 50.0 J/mm3. The maximum tensile strength of ≈660 MPa was obtained at an ED of 54.8 J/mm3 through the formation of the columnar dendritic substructure. High ductility ranging from 25 to 30% was observed in all the fabricated parts irrespective of ED. The assessment of cytocompatibility in vitro indicated good attachment and proliferation of osteoblasts on the fabricated samples that were similar to the cell response on commercially pure titanium, confirming the potential of the additively manufactured Ti–35Nb–7Zr–5Ta as a suitable material for biomedical applications. Taken together, these results demonstrate the feasibility of L-PBF of Ti–35Nb–7Zr–5Ta for potentially engineering patient-specific orthopedic implants.
1. Introduction
Laser powder bed fusion (L-PBF) additive manufacturing (AM) methods offer flexibility and convenience for the rapid production of small-sized engineering components used in critical applications such as aerospace and healthcare industries.1−5 Rapid developments in laser technologies have established L-PBF technology as the most mature technology in the AM industry.6,7 In medical technology, the production of implants by L-PBF has emerged as an attractive strategy that could fully leverage the advantages offered by AM. AM technologies can be used for fabricating customized parts to meet the needs of individual patients and implants with complex geometry that are otherwise difficult to achieve using traditional manufacturing routes. Significant interest has been focused on the development of orthopedic implants from novel materials that could eliminate the limitations associated with the current generation of biomaterials.8−10
The current generation of metallic orthopedic implant materials essentially includes stainless steel, Ti–6Al–4V, and cobalt–chromium alloys.11−13 Even though these materials are still the preferred choice in many applications, the mismatch in the elastic modulus of the biomaterial with that of human cortical bone persists as a concern. The elastic modulus is an important mechanical property that dictates the transfer of stress from the metallic implant to the adjacent bone. A metallic material with an elastic modulus close to that of human cortical bone can avoid stress shielding that can otherwise lead to bone atrophy, poor osseointegration, and aseptic loosening of the implant as the high-modulus biomaterial primarily bears the load.14,15 As a result, together with good strength and fatigue properties, implant materials with a low elastic modulus are of significant interest in orthopedic devices.
Titanium and its alloys are widely preferred in orthopedic and dental implants compared to other metallic biomaterials due to their relatively lower stiffness, good cytocompatibility, high corrosion resistance, and high strength-to-modulus ratio.16,17 Titanium is an allotropic material with a high-temperature body-centered cubic (BCC) β phase displaying a lower strength and stiffness compared to the room-temperature α phase.18 The need for Ti alloys with an elastic modulus closer to that of human cortical bone has motivated the development of β-titanium alloys. These alloys usually contain nontoxic refractory elements such as niobium, zirconium, and tantalum as the constituent elements. The β-stabilizing elements such as niobium and tantalum facilitate the β phase formation at a lower temperature.19 Zirconium is believed to have a neutral effect on the phase transformation in titanium; however, it has been reported that in the presence of other β-stabilizing elements, Zr can also serve as the β stabilizer.20 There has been unprecedented interest, in recent years, in the development of β titanium alloys for next-generation implants with better clinical outcomes.21,22 The widespread adoption of β titanium alloys for preparing implants has been limited by the poor fatigue resistance of these alloys. Besides, AM has emerged as a disruptive technology in the field of manufacturing, particularly in the field of medical devices, offering a viable route to prepare customized component fabrication.23−25 β-Ti alloys have attracted enormous interest in the biomaterial field, but AM of these alloys is still in its infancy.18
As L-PBF is an emerging manufacturing strategy for novel materials such as the β-Ti alloy Ti–35Nb–7Zr–5Ta (TNZT), the determination of optimal parameters to manufacture dense parts for this alloy is highly desirable. This is further required to fabricate parts that offer the best combination of properties for engineering implants. There are several process parameters involved in L-PBF that must be optimized for the manufacturing of defect-free parts.26,27 Nondimensional numbers, which are widely used in conventional mechanical engineering, have been recommended by many researchers28,29 as a successful tool in optimizing the process parameters for L-PBF by considering a global parameter set. The energy density (ED), defined as the ratio of laser power to the product of laser beam scan speed, thickness of the layers, and the spacing between consecutive hatches, is now widely recognized to be an effective global parameter.30,31
The aim of the present study was the fabrication of dense components of a β titanium alloy Ti–35Nb–7Zr–5Ta using L-PBF AM toward the broader objective of engineering medical implants. ED was systematically varied to study its effect on the prepared parts. The parts prepared at four different values of ED were characterized to assess their density and presence of defects due to AM. The microstructure, tensile properties, corrosion resistance, and cytocompatibility were systematically evaluated.
2. Results
2.1. Microstructural Features
The composition (wt %) of the alloy powder used here was determined to be Ti 55.5, Zr 6.95, Nb 34.0, and Ta 4.64. The elemental compositions of the samples fabricated at different EDs were measured using wavelength dispersive spectroscopy (WDS) in an electron probe microanalyzer (EPMA) system and are tabulated in Table 1. The compiled results indicate that the elemental compositions were nearly identical independent of the changes in ED used here.
Table 1. EPMA WDS Analysis of the Elemental Composition of Fabricated Samples.
| ED (J/mm3) | Ti (wt %) | Nb (wt %) | Zr (wt %) | Ta (wt %) |
|---|---|---|---|---|
| 46.6 | 54.44 | 34.60 | 6.45 | 4.51 |
| 48.9 | 54.72 | 34.56 | 6.36 | 4.36 |
| 50.0 | 54.51 | 34.56 | 6.45 | 4.48 |
| 54.8 | 54.53 | 34.51 | 6.49 | 4.47 |
Alloy samples were manufactured by L-PBF of the alloy powder using a range of processing parameters determined from proprietary software. Parameters such as density, thermal conductivity, specific heat, latent heat, and laser absorptivity of the material were considered for calculating the ED. Four different ED values (46.6, 48.9, 50.0, and 54.8 J/mm3) were used within the range recommended by the software. The average surface roughness value (Ra) of the additively manufactured alloys was determined to be ≈6 μm. After polishing and etching, the Ra values were reduced to ≈108 and ≈100 nm, respectively.
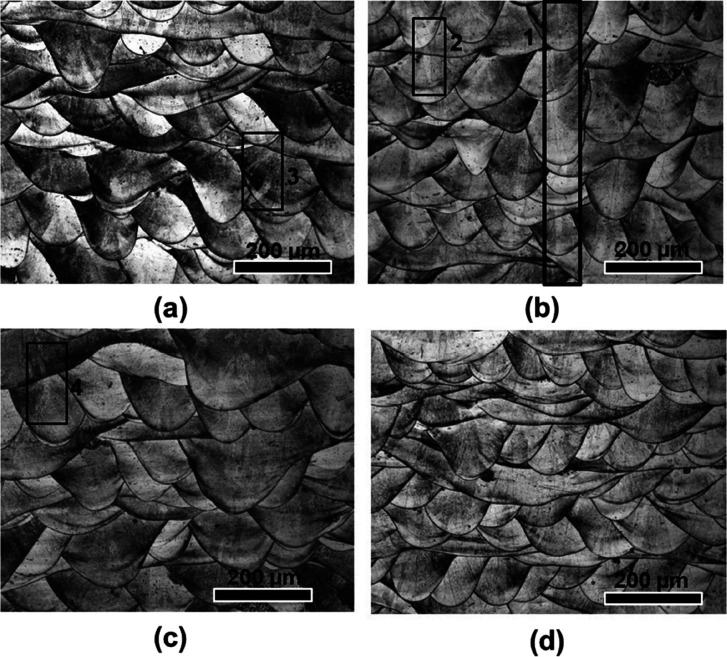
Representative optical micrographs along the build direction (BD) of the TNZT alloy for the different EDs are presented in Figure 1. The microstructures reveal the arrangement of the melt pools in the successive layers. The micrographs also confirm the 67° rotational strategy utilized during the fabrication of the samples.32 Within the individual melt pools, columnar grains can be observed, which formed perpendicular to the melt pool boundary. The grains in the middle of an individual melt pool grew nearly parallel to the BD as a narrow columnar grain, which is shown (marked as 1 and 2) within the boxes in Figure 1a,b. One of the narrow columnar grains in the middle of the melt pool is seen extended across multiple layers through strong epitaxial growth, as depicted by the region shown within box 1. Another grain, which is shown inside box 2, appears to have grown within two melt pools. It can be noted that the grains seen inside boxes 3 and 4 reveal a different morphology. These grains appear to have different morphological orientations while growing from the bottom to the top layer with the deposition of successive layers to match the direction of maximum heat flow. From the optical micrographs, it can be noted that the variation in ED within the range of 46 to 55 J/mm3 did not significantly affect the microstructural evolution along BD.
Figure 1.
Optical micrographs representing the build direction (transverse) of the samples fabricated using different ED (J/mm3) values (a) 46.6, (b) 48.9, (c) 50.0, and (d) 54.8.
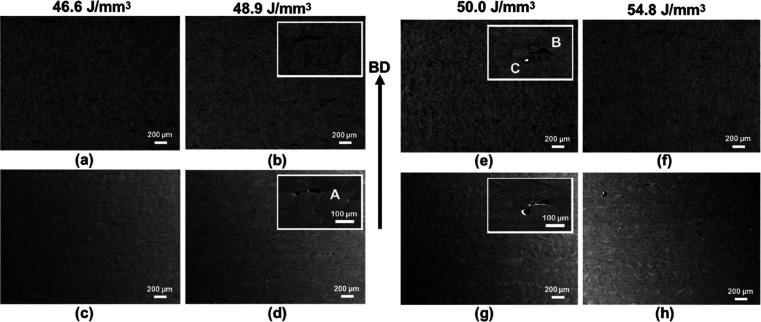
Figure 2 includes representative back-scattered electron (BSE) and secondary electron (SE) images taken from the same location of the alloy for the different ED values in order to identify the regions with and without defects. In contrast to other parameters, samples processed with an ED of 50.0 J/mm3 reveal fewer defects. For identifying the types of defects, two high magnification micrographs are also shown within the inset for two intermediate ED values. The combination of SE and BSE images provides insight into the different defects in the various samples. The defects identified as A and B in Figure 2b,d,e,g lie close to the bottom of the melt pools, and their morphologies are nearly identical. From the morphology and the location, these defects conform to the lack of fusion defects33 caused by the insufficient penetration of a molten pool into a previously deposited layer, causing void formation. Another defect is identified and shown in Figure 2e,g) marked as C. The BSE micrograph shows a melted and separated region nearly spherical in shape. Such defects occur through the balling phenomenon34 in response to the capillary instability within a melt pool.
Figure 2.
(a,b,e,f) Low-magnification back-scattered electron (BSE) and (c,d,g,h) secondary electron (SE) micrographs captured using an SEM indicating the defect population within the samples fabricated using different Eds; enlarged views shown in the insets reveal the types of defects (A,B—lack of fusion and C—balling).
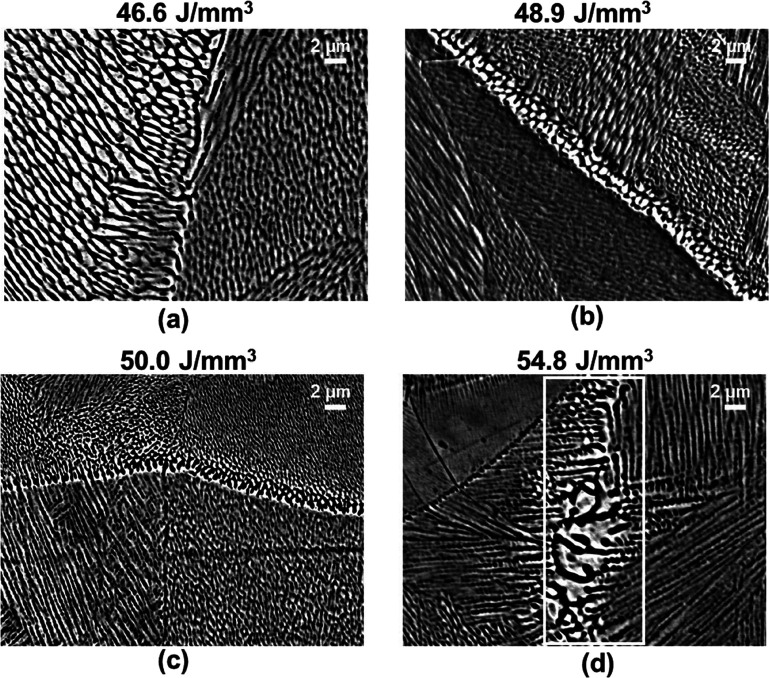
Microstructural features at a higher magnification are shown in Figure 3. It can be noted that, on a finer scale, all four EDs led to similar microstructure evolution. The microstructures reveal solidification features consisting of columnar and cellular dendrites. This observation is attributed to an effect of the rotational scan strategy utilized, which is attributed to different combinations of the temperature gradient (G) and the solidification growth rate (R) values at different locations within the samples. The development of solidification microstructure is dependent on the ratio G/R and the product G × R experienced at the different locations within the samples.35
Figure 3.
Microstructure evolution for the different EDs: (a) 46.6 J/mm3, (b) 48.9 J/mm3, (c) 50.0 J/mm3, and (d) 54.8 J/mm3) at a higher magnification.
The boundaries of the melt pool consist of coarser features compared to the interior regions. Figure 3d reveals that the sample fabricated with the highest ED value displays more columnar dendrites compared to the lower ED sample. However, cellular dendrites are in abundance for the lowest ED values. Cellular growth of dendrites occurs at higher values of G/R ratios in comparison with the columnar dendrites. Finer cellular dendritic features indicate that the cooling rate, the product G × R (cooling rate), increases with the increase in ED. For the highest ED input (Figure 3d), columnar dendrites had grown significantly (as shown within a white box), indicating a reverse trend. The size increase of the columnar dendrites occurs due to a decrease in the cooling rate. Such microstructural transformations can occur at high ED values owing to the increased amount of heat contained during fabrication aided by the poor thermal conductivity of Ti alloys. Effectively, the change occurs from a high G/R and G × R value to a low G/R and G × R value with the increase in ED. Such a morphological and size change of the solidification features with the changes in ED occurs as a synergetic effect from the variations in G and R values.
2.2. Structure and Defects
The analysis of X-ray diffraction (XRD) patterns revealed the characteristic peaks of the BCC β phase of titanium for all the samples. The full width at half-maximum (FWHM) for the first four peaks was calculated using a reference Si sample, as compiled in Table S1. The Scherrer equation was used to calculate the size of the crystallite (D in nm). Dislocation density and the microstrain present in the samples were calculated from the values of D and FWHM. It may be noted that a uniform crystallite size irrespective of the peak position was only observed at the highest ED.
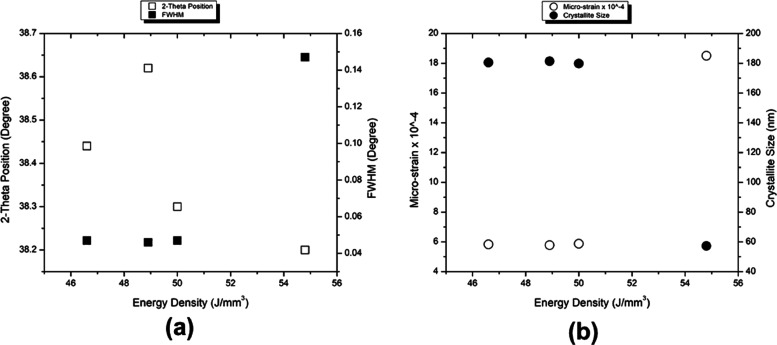
Faster and slower XRD scans confirmed the presence of only the β phase in the as-fabricated samples. The variations of the 2θ position, FWHM, microstrain, and crystallite size with respect to the change in ED for the BCC-110 peak are given in Figure 4. Except at the highest ED input, other conditions displayed similar values for FWHM, microstrain, and crystallite size. For the specific diffraction peak, the 2θ for the (110) peak followed an increasing trend up to an ED of 48.9 J/mm3. With the further increase in ED, a decrease in 2θ was observed. The decrease in the value of 2θ correlates with an increase in d-spacing, which in turn indicates the presence of residual stresses in the sample processed at the highest ED. The high ED input might correspond to high temperatures and, hence, steep temperature gradients. Further confirmation about this trend reversal at the highest ED can be observed as an increase in the value of microstrain. The shift in the 2θ for the peak was accompanied by a change in FWHM. For the sample processed under the highest ED condition, the FWHM increased significantly; hence, the crystallite size was reduced.
Figure 4.
XRD results depicting the variation of (a) 2θ position and FWHM and (b) microstrain and crystallite size with the ED for the BCC-110 peak.
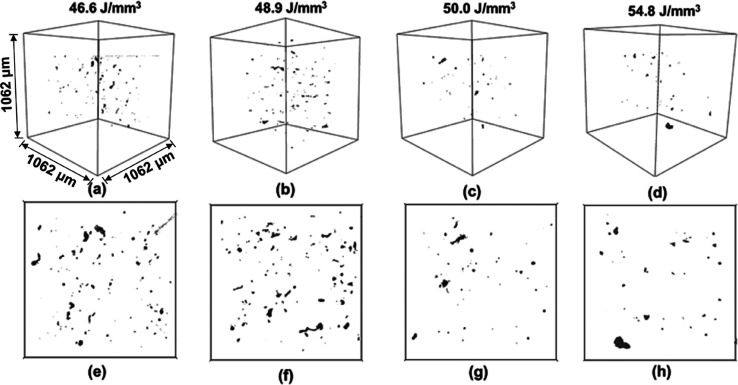
The results from X-ray μCT characterization are depicted in Figure 5 as an extracted subvolume and a projection from this volume. It can be observed that the defect density is the highest when the ED values are the lowest. With the increase in ED, defect density reduced significantly. Samples fabricated with the highest EDs of 50.0 and 54.8 J/mm3 revealed the least number of defects. It can also be noted that the types of defects (as inferred from the shape of the defects) are different at the lowest and highest EDs.
Figure 5.
(a–d) μCT characterization results from an extracted 3D subvolume and (e–h) representative projection from this subvolume, for the samples fabricated using different EDs. All 3D subvolumes have the same volume size as indicated in (a).
μCT analysis was performed under similar experimental conditions on a single location in the samples, and the results were extracted from a subvolume of approximately 1.2 mm3. For the L-PBF-fabricated TNZT alloy with refractive elements as the alloying constituents, better bonding between the layers was expected with an increase in ED. However, the process parameters need to be limited within the constraints of laser fusion. The general trend was a decrease in the defect density with increased ED. To compare the part density evaluation using μCT analysis, results obtained from the density measurement using the Archimedes principle are compiled in Table 2. In agreement with the corresponding SE/BSE micrographs, the sample fabricated using an ED of 50.0 J/mm3 revealed the maximum part density of ≈99.5% of theoretical density.
Table 2. Density Calculated Using the Archimedes Method and Comparison of the Elastic Modulus Obtained from Nanoindentation and Tensile Testing.
| ED (J/mm3) | part density (% of theoretical density) | elastic modulus from nanoindentation (GPa) (mean ± SD) for n = 6 | elastic modulus from stress–strain curve (GPa) (mean ± SD) for n = 3 |
|---|---|---|---|
| 46.6 | 98.93 | 77 ± 2 | 81 ± 2.85 |
| 48.9 | 98.94 | 75 ± 2 | 80 ± 3.3 |
| 50.0 | 99.52 | 77 ± 2 | 83 ± 1.4 |
| 54.8 | 98.78 | 78 ± 4 | 85 ± 0.26 |
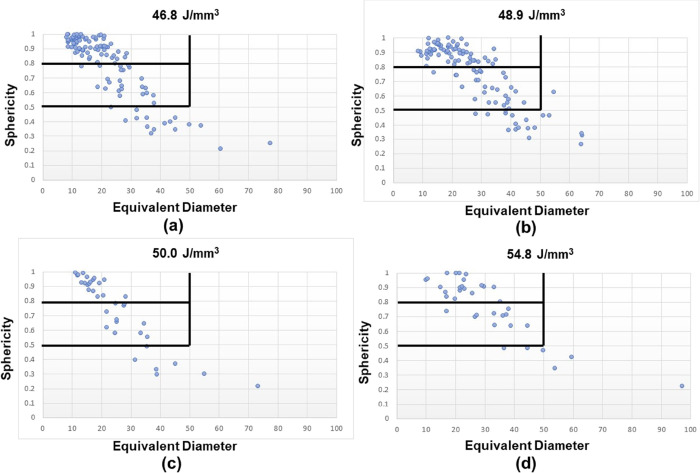
A detailed quantitative analysis of the defects was performed. Sphericity36 was utilized to assess the types of defects present in the samples. A plot representing the equivalent diameter of a defect and sphericity is depicted in Figure 6. Threshold values of 0.5 and 0.8 were set for sphericity to separate the types of defects caused due to lack of fusion (nonspherical) and porosity (spherical). For a threshold value of 0.8, nonspherical defects dominate in the samples fabricated using the lowest ED inputs in comparison with the spherical defects. However, the equivalent diameter of the nonspherical defects is lower. By applying a low threshold of 0.5, the nonspherical defects are dominant at lower ED inputs. At the same time, the ratio of the number of spherical to nonspherical defects increases for the highest ED. Different types of porosities are the dominant spherical defects during AM.37,38 Porous defects include the inherent porosities arising from the powder preparation process and the gas-induced porosities during the melting and solidification. Relative dominance of spherical defect formation with the increase in ED indirectly indicates that the defects due to the lack of fusion reduced as the energy input increased. Some of these inherent spherical pores are difficult to avoid during component fabrication. Hence, postprocessing techniques such as hot isostatic processing39 are typically applied after manufacturing.
Figure 6.
Defect distribution in the samples fabricated using different EDs: (a) 46.6 J/mm3, (b) 48.9 J/mm3, (c) 50.0 J/mm3, and (d) 54.8 J/mm3, plotted as sphericity vs equivalent diameter; horizontal (0.5 and 0.8) and vertical lines (50 μm) in the plots depict the threshold values used in the analysis.
2.3. Mechanical Properties
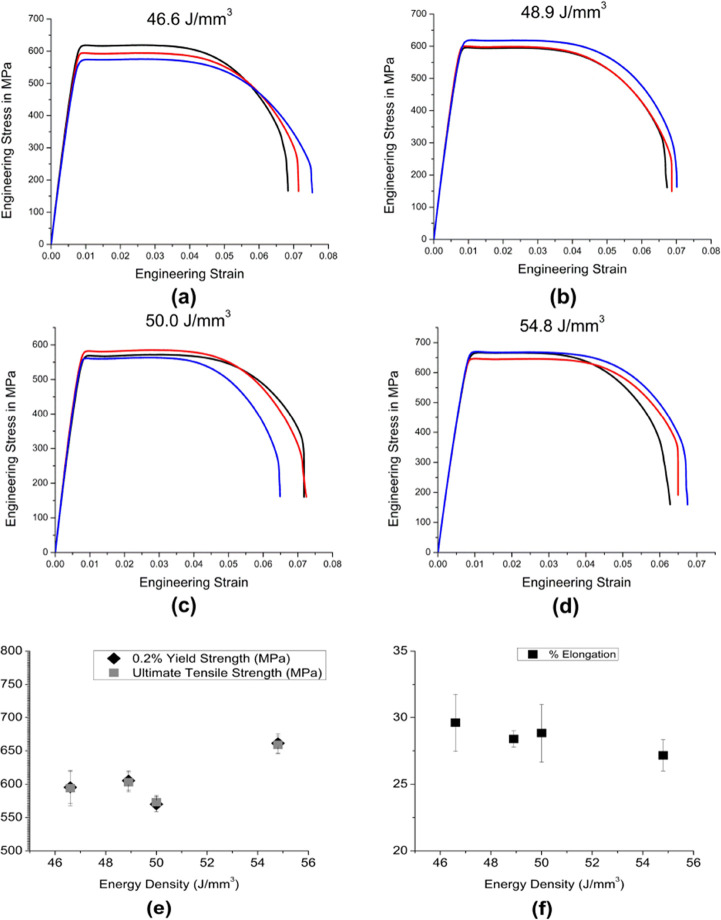
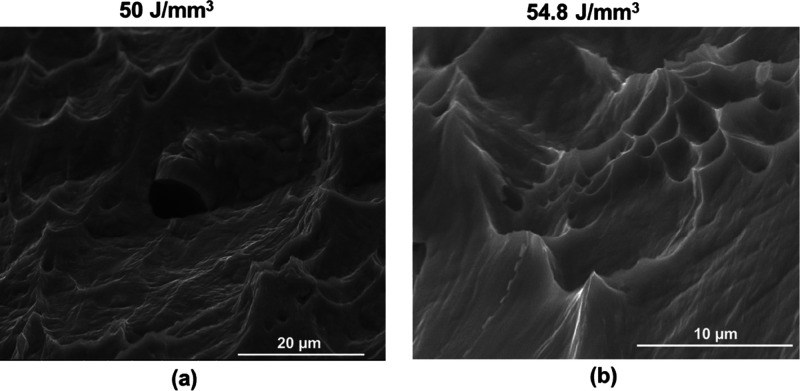
The elastic moduli determined from the slope of stress–strain curves and the nanoindentation tests are compiled in Table 2. The values determined from the two tests are similar. All the elastic modulus values were in the range of 75 to 85 GPa. Results of the other relevant mechanical properties obtained from the tensile tests are presented in Figure 7. The values of yield strength (YS) and ultimate tensile strengths (UTS) for the different EDs are compiled in Figure 7e, and % elongation at fracture is plotted in Figure 7f. The alloy exhibited close values of UTS and YS for all the processing conditions, indicating low work hardening. The alloy at an ED of 54.8 J/mm3 showed a significantly high YS (605 ± 12.2 MPa) and UTS (603 ± 12.81 MPa) in comparison to the other ED conditions (46.6 J/mm3 (p < 0.01), 48.9 J/mm3 (p < 0.001), and 50.0 J/mm3 (p < 0.01)). All the samples showed good ductility prior to the fracture (Figure 7f). Figure 7e reveals a marginal increase in the YS and UTS at the highest ED compared to the other samples. Elongation to break was more than 25% for all the EDs, with the highest ductility observed at the lowest ED. Figure 8 reveals that the fracture surface of the samples showed dimples of different sizes, confirming the ductile fracture with a good amount of ductility prior to the fracture.
Figure 7.
Results from the tensile tests: (a–d) plots of three replicates for each ED, (e) plot of the variation of 0.2% yield strength and ultimate tensile stress with ED, and (f) plot of the variation of percentage elongation with ED.
Figure 8.
Fractographs (secondary electron images) depicting the ductile fracture for the samples processed at ED of (a) 50.0 J/mm3 and (b) 54.8 J/mm3.
2.4. Electrochemical Response
Electrochemical test results are compiled in Table 3 and Figure 9. Figure 9 shows the Tafel extrapolation plots for the fabricated materials and their performance in comparison with the commercial pure (CP) titanium. CP-Ti is widely used as a biomaterial and was used as a reference here. The corrosion potential (Ecorr) and corrosion current density (Icorr) are given in Table 3. There were marginal differences in the open circuit potential (OCP) values of the samples (Figure 9). The ED conditions of 46.6 J/mm3 (p < 0.001), 48.9 J/mm3 (p < 0.05), and 50.0 J/mm3 (p < 0.01) showed significant differences in comparison to CP-Ti, whereas 54.8 J/mm3 showed no statistically significant difference with respect to CP-Ti. However, the OCP values were ∼−0.2 V for CP-Ti and TNZT. TNZT samples exhibit passivation behavior similar to CP-Ti in simulated body fluid (SBF). Corrosion potential values are comparable for the CP-Ti and TNZT. The corrosion currents of the TNZT alloys at all the ED values are higher than those of CP-Ti but not statistically significantly different from that of CP-Ti. However, the values are low, indicating good corrosion resistance, and these additively manufactured alloys are promising materials for use in biomedical applications.
Table 3. Electrochemical Properties.
| ED (J/mm3) | Ecorr (V)a | Icorr (μA/cm2)a |
|---|---|---|
| 46.6 | –0.16 ± 0.005 | 0.25 ± 0.02 |
| 48.9 | –0.19 ± 0.004 | 0.12 ± 0.03 |
| 50.0 | –0.19 ± 0.01 | 0.43 ± 0.3 |
| 54.8 | –0.22 ± 0.01 | 0.67 ± 0.57 |
| CP-Ti | –0.25 ± 0.003 | 0.033 ± 0.02 |
All data are shown as mean ± SD for n = 3.
Figure 9.
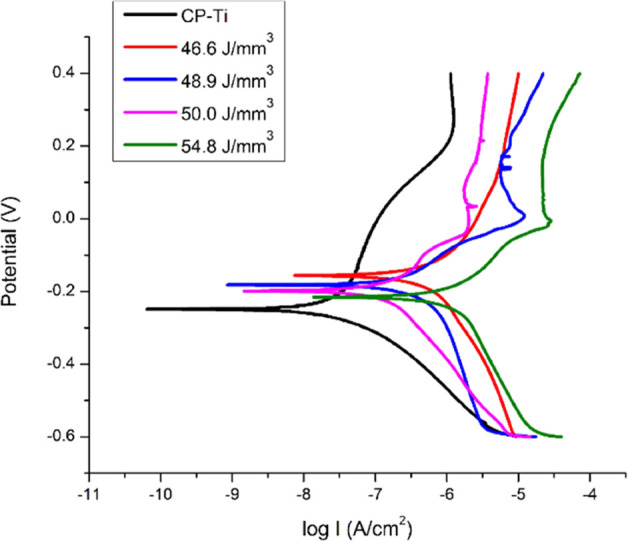
Electrochemical corrosion results shown as Tafel plots for different EDs and comparison with CP-Ti as the reference.
2.5. Biological Response
An important consideration for the use of materials for biomedical applications is their biocompatibility when implanted. Owing to their excellent corrosion resistance, many of the titanium alloys do not exhibit toxicity or adverse inflammatory response. The cytotoxicity of the alloys prepared by L-PBF herein was evaluated in vitro using MC3T3-E1 cells, which are mouse calvarial preosteoblasts. Cell toxicity was assessed qualitatively and quantitatively by live–dead assay (LDA) and 3-[4,5-dimethylthiazol-2-yl]-2,5-diphenyl tetrazolium bromide (MTT) assay, respectively. Figure 10 compiles the MTT results on all five metal samples wherein CP-Ti was used as the control. All five metallic samples showed statistically similar attachment of MC3T3-E1 cells on day 1 after seeding. All the samples supported the growth of the cells from day1 to day 4 with marginal differences; 48.9 J/mm3 showed significantly higher values (p < 0.05) followed by 50.0 J/mm3 in comparison to CP-Ti and other ED conditions. On day 7, an ED of 50.0 J/mm3 showed the highest value among all the samples. The results indicated that all the metallic samples were able to support the growth of cells without any toxicity; however, the ED condition 50.0 J/mm3 appears to be the best in supporting the proliferation of cells.
Figure 10.
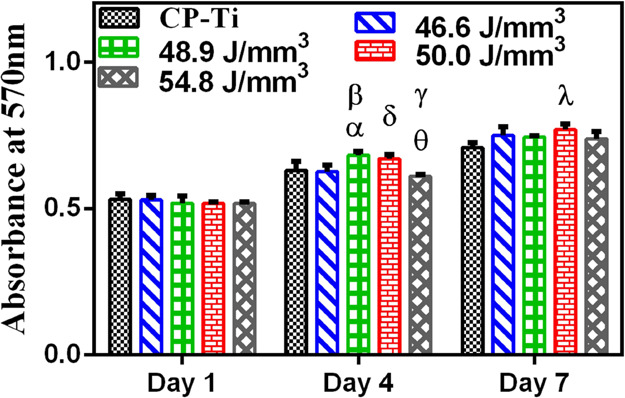
Cell adhesion and proliferation of MC3T3-E1 cells on the samples at days 1, 4, and 7. All data are shown as mean ± SD for n = 3, and statistically significant differences are marked by symbols (ANOVA multiple comparison test showing a significant difference p < 0.05 (*) between CP-Ti and 48.9 J/mm3 (α) and 46.6 and 50.0 J/mm3 (δ); p < 0.01 between 46.6 and 48.9 J/mm3 (β) and 50.0 and 54.8 J/mm3 (γ); p < 0.001 between 48.9 and 54.8 J/mm3 (θ) at day 4; and p < 0.01 between CP-Ti and 50.0 J/mm3 at day 7).
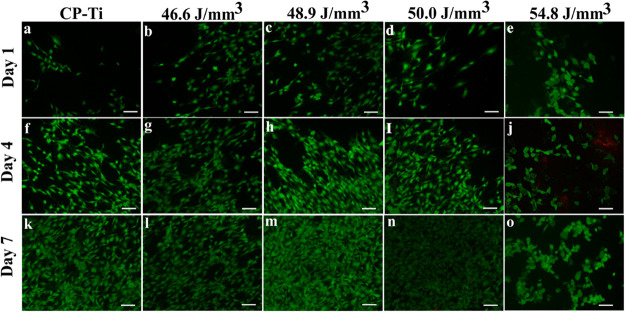
Figure 11 compiles the fluorescence micrographs assessed by LDA up to 7 days and corroborates the MTT data above in Figure 10. The control CP-Ti and the L-PBF manufactured samples showed the abundance of a large fraction of live cells (revealed by the green fluorescence) in comparison to a few dead cells (revealed by the red color). The results from the MTT assay and LDA indicated that the TNZT samples of different ED conditions are cytocompatible and their cytocompatibility is comparable to that of CP-Ti.
Figure 11.
Fluorescence micrographs showing the toxicity of MC3T3-E1 cells on the metal samples: (a,f,k) Cp-titanium, (b,g,l) 46.6 J/mm3, (c,h,m) 48.9 J/mm3 , (d,i,n) 50.0 J/mm3, and (e,j,o) 54.8 J/mm3 revealed by the live (green)–dead (red) assay at days 1, 4, and 7 on CP-Ti and TNZT prepared by L-PBF at different EDs (scale bar = 100 μm).
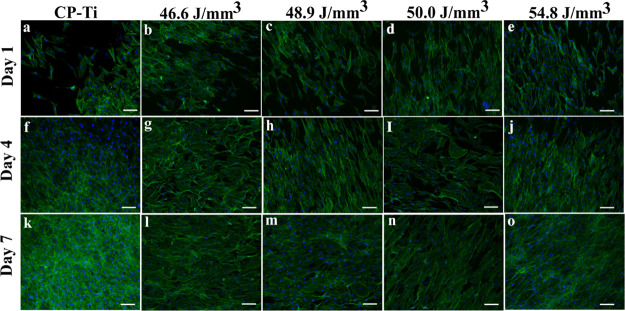
The morphology of the cell on a substrate is widely taken as a measure of the cell response to the material. The cell morphology and cytoskeleton reorganization of the cells on the L-PBF-fabricated TNZT samples was assessed by fluorescence microscopy, and the representative fluorescence micrographs of the samples at days 1, 4, and 7 are compiled in Figure 12. The cells showed well-spread morphology on all the samples, and there seem to be no observable differences in the cell morphology or their density, indicating that all the substrates are equally efficient in supporting the attachment and growth of cells. The cell numbers appeared to increase from day 1 to day 7 on all samples. Initially, at days 1 and 4, few cells exhibited spread and stretched morphology, whereas some cells were elongated. However, the cells showed elongated morphology on all samples with full confluency by day 7. Thus, these results indicate that the TNZT samples are as cytocompatible as CP-Ti and are also efficient in supporting the attachment of cells. Thus, the TNZT manufactured by L-PBF is a promising candidate material for orthopedic implants.
Figure 12.
Fluorescence micrograph at 10× showing the morphology of MC3T3-E1 cells on the metal samples: (a,f,k) Cp-titanium, (b,g,l) 46.6 J/mm3, (c,h,m) 48.9 J/mm3, (d,i,n) 50.0 J/mm3, and (e,j,o) 54.8 J/mm3 stained for F-actin (green) and nuclei (blue) at days 1, 4, and 7 (scale bar = 100 μm).
3. Discussion
In this work, ED was systematically varied to determine the optimal conditions for manufacturing a β-Ti by L-PBF. The analysis of elemental compositions by WDS clearly revealed that the chemical composition is unaffected by the variation in ED, thereby revealing the adequacy of the parameters used during L-PBF of TNZT. The results of XRD corroborated the same as the fabricated material at all the ED values is in the fully β phase. However, the porosity level, as indicated by the results of μCT, was varied with ED, with a higher ED resulting in fewer pores. Batalha40 used a relatively higher ED of 58.3 J/mm3 than values in the present study to fabricate parts with a density of 99.0% relative to an as-cast reference sample of TNZT alloy. In the present study, densification of 99.5% of the theoretical density was achieved at a relatively lesser ED of 50.0 J/mm3.
Modulus measurements confirmed that the alloy exhibits an elastic modulus that is lower than that of conventional alloys such as Ti–6Al–4V and is comparable to that of many other orthopedic β alloys that have been developed to minimize stress shielding.18 Tensile testing revealed an increasing trend for the tensile strength with an increase in ED with high elongation that marginally decreased with an increase in the ED. The maximum observed tensile strength is ≈660 MPa, and the values reported here are comparable to those reported for the single β phase.41 We and others have observed higher strength values in the range of 800 to 1200 MPa, or even higher values occasionally, in some β alloys, were reported earlier.42−45 However, the high strengths are attributed to the presence of fine precipitates of harder phases, such as α or ω within the β matrix.
The combination of microstructural investigation, microtomography, and density measurement clearly revealed the fewest defects and the highest part density for samples prepared using an ED of 50.0 J/mm3, whereas the highest strength was obtained at an ED of 54.8 J/mm3. This has been attributed to the microstructural differences arising from changes in the ED. In the former case, cellular dendrites dominated the microstructure of the sample. In the case of the highest ED (54.8 J/mm3) sample, columnar dendrites and a network of these dendrites are observed in abundance, with some of them grown significantly by forming tertiary arms. The presence of columnar dendrites or cellular dendrites will likely offer different barriers to the dislocation movement, thereby affecting the strength and ductility in the alloy.
As discussed above, the strength of the alloy fabricated here is low compared to several other alloys. In the TNZT alloy processed through conventional wrought processing, the specially designed thermo-mechanical processing strategy has been reported to impart higher strength.41,46 In additively manufactured materials, suitably designed postprocessing heat treatments and surface treatments have been found effective in enhancing the strength and ductility. Unique heat treatment cycles for optimization of mechanical properties could be developed for L-PBF-manufactured TNZT in a manner similar to that proposed by Sabban et al. for Ti–6Al–4V.47 In a recent study, Batalha et al.48 fabricated thin-walled tubes with oligocrystalline microstructures in the biocompatible TNZT alloy by combining AM and heat treatment. Thus, there is significant scope for microstructural engineering of the additively manufactured TNZT alloys for engineering high-performance patient-specific implants. Surface engineering strategies, such as dealloying,49 nanocrystallization,50,51 etc., can also be utilized to enhance the biomechanical and biological performances of these alloys but remain largely unexplored for additively manufactured β-Ti alloys.
Electrochemical tests revealed good corrosion resistance in SBF of the additively manufactured TNZT parts. The Icorr values are similar to those we observed for wrought Ti–Nb–Ta–Zr–O and Ti–Nb–Ta–O alloys tested in a similar manner.52,53 Rao et al.54 reported on the corrosion behavior of the TNZT samples in Hank’s solution and observed stable passive polarization behavior, as observed here. The corrosion rate of the hot-rolled TNZT alloy samples in Hanks’s solution reported by Rao et al.54 was lower than that of hot-rolled CP-Ti, which they attributed to the ability of Nb in stabilizing the surface films. The different corrosion behavior observed in the present study could be due to the different manufacturing processes, hot rolling, and L-PBF. Layer by layer manufacturing through repeated melting and solidification can retain high tensile residual stresses comparable to the YS of the material during L-PBF.55 The presence of residual stresses on the surface has been reported to enhance the corrosion resistance of the metallic samples.56 Thus, the development of tensile residual stresses in L-PBF-manufactured samples, as revealed from the XRD analysis above, can enhance the corrosion rate compared to hot-rolled samples.
Cell studies confirmed that the TNZT samples manufactured by L-PBF were nontoxic and were as efficient as CP-Ti in supporting the attachment and proliferation of the cells in vitro. Donato et al.57 reported good in vitro biocompatibility of the as-cast and heat-treated TNZT alloy. Excellent biocompatibility of the TNZT alloys in terms of effective osteoblast adhesion with no significant impact on cell differentiation, apoptosis, inflammatory response, and biomineralization was also reported by Sun et al.58 We have also observed that wrought Ti–Nb–Ta–Zr–O and Ti–Nb–Ta–O alloys exhibit cytocompatibility that is comparable to that of CP-Ti.51−53
4. Conclusions
L-PBF was attempted on a novel β titanium alloy Ti–35Nb–7Zr–5Ta from alloy powder. Specimens were fabricated using four different ED values and were found to contain the β phase alone. L-PBF at a lower ED resulted in poor fusion between the successive layers in the BD, and fewer defects were observed at the higher ED values of 50.0 and 54.8 J/mm3. Cellular to columnar dendritic morphology transformation was observed at the highest ED with an increase in the size of the columnar dendrites depicting the simultaneous effects from the temperature gradient and solidification growth rate. A tensile strength of up to 660 MPa and good ductility (elongation to break >23%) were observed. A higher ED resulted in a higher strength with a marginal decrease of ductility. All the samples exhibited good corrosion resistance and supported the attachment and growth of preosteoblasts similar to that reported for the wrought alloy of similar composition. Taken together, this work demonstrates the feasibility of preparing dense parts of TNZT by L-PBF that may be further developed for engineering patient-specific medical devices.
5. Experimental Section
5.1. Fabrication Using L-PBF
Raw powder of the Ti–35Nb–7Zr–5Ta alloy was prepared at Tosoh SMD, Inc. (OH, United States) by an atomization method. Particle size distribution analysis revealed particle sizes between 8 and 300 μm with a mean size of 90 μm. Tosoh has developed a new technology for the successful production of powders from the TNZT alloy with the cast ingots as the starting material, and the details are available elsewhere.59 Solid rectangular blocks were fabricated with an EOS M280 L-PBF machine at Intech Additive Solutions (Bangalore, India). The AMOptoMet proprietary software developed at Intech Additive Solutions was used to predetermine and optimize the laser beam parameters for AM. The 67° rotational scan strategy was utilized for the fabrication of all the samples that are, hereafter, identified by the ED utilized. Four different ED values, 46.6, 48.9, 50.0, and 54.8 J/mm3, were used, where ED is defined as follows,
Samples of dimensions of 25 mm × 25 mm × 15 mm (length × width × height) were fabricated on a steel support plate and later removed by electro-discharge machining. Preliminary investigation revealed that the build planes were free of detrimental defects such as porosity and lack of fusion, which are common in L-PBF AM. Hence, the focus of characterization in the present study is focused on the sample BD in the transverse cross-section.
5.2. Materials Characterization
Specimens for microstructural characterization were prepared by the conventional metallographic procedure followed by final polishing using a colloidal silica suspension of 0.05 μm particle size. Polished samples were characterized before and after etching. Kroll’s reagent containing 10 mL of nitric acid and 5 mL of hydrofluoric acid in 85 mL of distilled water was used as the etchant. Roughness measurements were performed with a noncontact optical profilometer (WYKO NT1100). Optical images were taken with a Metallovert optical microscope (Carl Zeiss). SE and BSE micrographs were recorded on a scanning electron microscope (SEM) with an EPMA, JEOL JXA-8530F. Energy-dispersive spectroscopy and WDS facilities available in the same microscope were used for analyzing the elemental composition.
The phases present in the samples were determined using XRD with an XPERTPro, PANalytical X-ray diffractometer. The sample was scanned in the 2θ range of 30° to 90° (175 s per step) for indexing of the processed state of the alloy. Slower scans (350 s per step) were carried out to determine the crystallite size and microstrain present in the samples. Analysis of the XRD data was carried out using X-Pert Hi-Score plus software. The Scherrer equation60 was used to quantify the crystallite size and the associated microstrain.
5.3. Density Measurement Using Micro-CT
To assess the density of fabricated samples, X-ray microcomputed tomography (μCT) was performed with a transmission X-ray microscope (Versa XRM-500, XRADIA). Imaging was performed at 4× magnification on cylindrical samples of 6 mm diameter and 10 mm height with a total of 1601 projections per sample. The reconstructed images were analyzed using Avizo 9.5 software (Thermofischer Scientific). The first sample fabricated with a lower ED was taken as the reference, and a systematic procedure was followed for the digital image processing of reconstructed 3D volume for visualizing and quantifying the imperfections.
5.4. Modulus Measurement
The elastic modulus of the alloys was measured using a nanoindentation tester (CSM) with a Berkovich indenter. The maximum applied load was fixed at 200 mN and held for 2 s. These measurements were performed on the plane perpendicular to the BD. The samples were electropolished prior to the measurement. Unloading curves were analyzed using the Oliver and Pharr method to calculate the elastic modulus values. Six measurements were done for each sample.
5.5. Tensile and Corrosion Testing
Tensile testing was carried out with an Instron 5567 screw-driven universal testing machine. For a gauge length of 6 mm, a crosshead speed of 0.006 mm/s was used, corresponding to a strain rate of 10–3 s–1. Three replicates were tested for each ED. Fractography of the samples after the tensile test was performed with an ESEM Quanta (FEI) SEM.
The corrosion behavior of the additively manufactured samples in the SBF medium was investigated by the Tafel extrapolation method of electrochemical corrosion testing.52,61 Metallographic sample preparation prior to the corrosion testing consisted of final polishing with P2000 grit-sized SiC paper. A three-electrode potentiostat system was used for the testing with platinum as the counter electrode and a saturated calomel electrode as the reference electrode. Prior to the start of every test, samples were immersed in SBF for 3 h to obtain a stable OCP. A scan rate of 12 mV/min in a voltage range −600 to +400 mV, with respect to OCP, was chosen for the Tafel extrapolation plot. Corrosion potential (Ecorr) and current density (Icorr) were calculated using these plots.
5.6. In Vitro Cytocompatibility Evaluation
5.6.1. Cell Culture
MC3T3-E1 mouse calvarial preosteoblasts (ATCC) were cultured in the α-minimum essential medium (α-MEM) containing 10% (v/v) fetal bovine serum (FBS, Gibco, Life Technologies). Antibiotic penicillin–streptomycin (Sigma) was added at 1% (v/v) concentration. Cells were passaged with trypsin–EDTA (Sigma) and subsequently subcultured. Cells of passage 43 were used for all the reported studies.
5.6.2. Cytocompatibility
The cytocompatibility of the TNZT samples fabricated with different ED values was determined by culturing the MC3T3-E1 cells on the samples where commercially pure titanium (CP-Ti) was used as the control. Then, 5 mm × 5 mm square samples of 1 mm thickness were polished and prepared up to P2000 grade of SiC prior to the biological analysis. Subsequently, all the samples were presterilized in 70% ethanol for 30 min under ultraviolet radiation in a laminar hood and conditioned in the complete culture medium for 1 h prior to the cell seeding. Finally, 1 × 10³ cells per well were seeded in each well of a 96-well plate and incubated at 37 °C in a humidified 5% CO2 atmosphere.
Cell adhesion and proliferation of MC3T3-E1 cells on metal samples were studied by the 3-[4,5-dimethylthiazol-2-yl]-2,5-diphenyl tetrazolium bromide (MTT) colorimetric assay (Sigma). MC3T3-E1 cells were seeded directly onto the alloy, as described above. To evaluate cell viability, samples were washed with PBS and incubated in media containing 4 mg/mL MTT for 4 h. Formazan crystals formed by viable cells were dissolved in dimethyl sulfoxide. The absorbance of purple-colored formazan was recorded with a spectrophotometer (Biotek) at 570 nm. The experiments were done in triplicate for each condition.
Furthermore, LDA was also performed to analyze the cell toxicity of metal samples qualitatively. MC3T3-E1 cells were seeded and cultured on all the metallic samples, as above. After 1, 4, and 7 days of incubation, cells were washed with PBS and incubated with Calcein-AM and ethidium homodimer-1 (live–dead cell staining kit, Invitrogen) by following the instructions from the manufacturer and imaged using an epi-fluorescence microscope (Olympus).
5.6.3. Assessment of Cellular Morphology and Cytoskeleton Structure
The cells were seeded and cultured for 1, 4, and 7 days onto the metallic samples, as above. The cells were washed with PBS and fixed with 3.7% formaldehyde in PBS (pH 7.4) at room temperature for 15 min. Then, 0.1% Triton X-100 (Sigma) in PBS was added for 10 min to permeabilize the cells. Finally, the samples were incubated in 1 μg/mL of 4,6-diamidino-2-phenylindole (DAPI, Sigma) and 10 μg/mL fluorescein isothiocyanate (FITC)-conjugated phalloidin (ThermoFisher) for 30 min at room temperature. DAPI and FITC-conjugated phalloidin dyes were used for visualization of the nuclei and F-actin, respectively, using an inverted epi-fluorescence microscope.
Acknowledgments
This work was supported by the Department of Science and Technology (DST), Government of India (DST/NM/NB/2018/119(G)) and the Biodesign and Bioengineering Initiative II program of the Department of Biotechnology (DBT), Government of India. We are grateful to Mr. Kantharaju, Mrs. Deepika, Mr. Krishnamurthy, Mr. Kuldeep Singh, and Dr. Srijan Acharya for technical help. We thank Dr. Harish Barshilia at NAL, Bangalore, for access to equipment for modulus measurement. We thank Prof. Satish Kailas for access to the profilometer and Dr. Prince Raj for help with the measurements.
Supporting Information Available
The Supporting Information is available free of charge at https://pubs.acs.org/doi/10.1021/acsomega.1c06261.
X-ray diffraction analysis results (PDF)
The authors declare no competing financial interest.
Supplementary Material
References
- Liu R.; Wang Z.; Sparks T.; Liou F.; Newkirk J.. Aerospace applications of laser additive manufacturing. In Laser additive manufacturing; Elsevier, 2017; pp 351–371. [Google Scholar]
- Uriondo A.; Esperon-Miguez M.; Perinpanayagam S. The present and future of additive manufacturing in the aerospace sector: A review of important aspects. Proc. Inst. Mech. Eng., Part G 2015, 229, 2132–2147. 10.1177/0954410014568797. [DOI] [Google Scholar]
- Yakout M.; Cadamuro A.; Elbestawi M.; Veldhuis S. C. The selection of process parameters in additive manufacturing for aerospace alloys. Int. J. Adv. Manuf. Technol. 2017, 92, 2081–2098. 10.1007/s00170-017-0280-7. [DOI] [Google Scholar]
- Ventola C. L. Medical applications for 3D printing: current and projected uses. Pharm. Ther. 2014, 39, 704. [PMC free article] [PubMed] [Google Scholar]
- Gibson I.; Rosen D. W.; Stucker B.. Medical applications for additive manufacture. In Additive Manufacturing Technologies; Springer, 2010; pp 400–414. [Google Scholar]
- Khorasani A.; Gibson I.; Veetil J. K.; Ghasemi A. H. A review of technological improvements in laser-based powder bed fusion of metal printers. Int. J. Adv. Manuf. Technol. 2020, 108, 191–209. 10.1007/s00170-020-05361-3. [DOI] [Google Scholar]
- Levy G. N. The role and future of the laser technology in the additive manufacturing environment. Phys. Procedia 2010, 5, 65–80. 10.1016/j.phpro.2010.08.123. [DOI] [Google Scholar]
- Luo J.-P.; Jia X.; Zheng D.-L.; Wang G.; Sun J.-F.; Yan M. A novel approach to achieving a low Young’s modulus in titanium-based metallic glasses. Emerging Mater. Res. 2019, 8, 22–28. 10.1680/jemmr.16.00098. [DOI] [Google Scholar]
- Wątroba M.; Bednarczyk W.; Kawałko J.; Mech K.; Marciszko M.; Boelter G.; Banzhaf M.; Bała P. Design of novel Zn-Ag-Zr alloy with enhanced strength as a potential biodegradable implant material. Mater. Des. 2019, 183, 108154 10.1016/j.matdes.2019.108154. [DOI] [Google Scholar]
- Mat-Baharin N. H.; Razali M.; Mohd-Said S.; Syarif J.; Muchtar A. Influence of alloying elements on cellular response and in-vitro corrosion behavior of titanium-molybdenum-chromium alloys for implant materials. J. Prosthodont. Res. 2020, 64, 490–497. 10.1016/j.jpor.2020.01.004. [DOI] [PubMed] [Google Scholar]
- Malhotra R.; Dhawan B.; Garg B.; Shankar V.; Nag T. C. A comparison of bacterial adhesion and biofilm formation on commonly used orthopaedic metal implant materials: An In vitro study. Indian J. Orthop. 2019, 53, 148–153. 10.4103/ortho.IJOrtho_66_18. [DOI] [PMC free article] [PubMed] [Google Scholar]
- Rony L.; Lancigu R.; Hubert L. Intraosseous metal implants in orthopedics: A review. Morphologie 2018, 102, 231–242. 10.1016/j.morpho.2018.09.003. [DOI] [PubMed] [Google Scholar]
- Niinomi M.; Liu Y.; Nakai M.; Liu H.; Li H. Biomedical titanium alloys with Young’s moduli close to that of cortical bone. Regener. Biomater. 2016, 3, 173–185. 10.1093/rb/rbw016. [DOI] [PMC free article] [PubMed] [Google Scholar]
- Naidubabu Y.; Kondaiah V.; Dumpala R.; Sunil B. R.. Assessing the Material-Dependent Stress Distribution in Fractured Bone and Orthopedic Fixing Plate by Finite. Advances in Materials and Manufacturing Engineering: Proceedings of ICAMME, 2019, vol 2020, p 337.
- Darwich A.; Nazha H.; Abbas W. Numerical study of stress shielding evaluation of hip implant stems coated with composite (carbon/PEEK) and polymeric (PEEK) coating materials. Biomed. Res. 2019, 30, 169–174. 10.35841/biomedicalresearch.30-18-1048. [DOI] [Google Scholar]
- Kaur M.; Singh K. Review on titanium and titanium based alloys as biomaterials for orthopaedic applications. Mater. Sci. Eng., C 2019, 102, 844–862. 10.1016/j.msec.2019.04.064. [DOI] [PubMed] [Google Scholar]
- Attar H.; Bermingham M.; Ehtemam-Haghighi S.; Dehghan-Manshadi A.; Kent D.; Dargusch M. Evaluation of the mechanical and wear properties of titanium produced by three different additive manufacturing methods for biomedical application. Mater. Sci. Eng., A 2019, 760, 339–345. 10.1016/j.msea.2019.06.024. [DOI] [Google Scholar]
- Bahl S.; Suwas S.; Chatterjee K. Comprehensive review on alloy design, processing, and performance of β Titanium alloys as biomedical materials. Int. Mater. Rev. 2021, 66, 114–139. 10.1080/09506608.2020.1735829. [DOI] [Google Scholar]
- Eisenbarth E.; Velten D.; Müller M.; Thull R.; Breme J. Biocompatibility of β-stabilizing elements of titanium alloys. Biomaterials 2004, 25, 5705–5713. 10.1016/j.biomaterials.2004.01.021. [DOI] [PubMed] [Google Scholar]
- Kolli R. P.; Devaraj A. A review of metastable beta titanium alloys. Metals 2018, 8, 506. 10.3390/met8070506. [DOI] [Google Scholar]
- Taddei E.; Henriques V.; Silva C.; Cairo C. Production of new titanium alloy for orthopedic implants. Mater. Sci. Eng., C 2004, 24, 683–687. 10.1016/j.msec.2004.08.011. [DOI] [Google Scholar]
- Yu Z. T.; Wang G.; Ma X. Q.; Dargusch M. S.; Han J. Y.; Yu S. Development of biomedical Near β Titanium alloys. Mater. Sci. Forum 2009, 618-619, 303–306. 10.4028/www.scientific.net/MSF.618-619.303. [DOI] [Google Scholar]
- Wysocki B.; Maj P.; Sitek R.; Buhagiar J.; Kurzydłowski K. J.; Święszkowski W. Laser and electron beam additive manufacturing methods of fabricating titanium bone implants. Appl. Sci. 2017, 7, 657. 10.3390/app7070657. [DOI] [Google Scholar]
- Wang X.; Xu S.; Zhou S.; Xu W.; Leary M.; Choong P.; Qian M.; Brandt M.; Xie Y. M. Topological design and additive manufacturing of porous metals for bone scaffolds and orthopaedic implants: A review. Biomaterials 2016, 83, 127–141. 10.1016/j.biomaterials.2016.01.012. [DOI] [PubMed] [Google Scholar]
- Gupta S. K.; Shahidsha N.; Bahl S.; Kedaria D.; Singamneni S.; Yarlagadda P. K.; Suwas S.; Chatterjee K. Enhanced biomechanical performance of additively manufactured Ti-6Al-4V bone plates. J. Mech. Behav. Biomed. Mater. 2021, 119, 104552 10.1016/j.jmbbm.2021.104552. [DOI] [PubMed] [Google Scholar]
- Trevisan F.; Calignano F.; Aversa A.; Marchese G.; Lombardi M.; Biamino S.; Ugues D.; Manfredi D. Additive manufacturing of titanium alloys in the biomedical field: processes, properties and applications. J. Appl. Biomater. Funct. Mater. 2018, 16, 57–67. 10.5301/jabfm.5000371. [DOI] [PubMed] [Google Scholar]
- Oliveira J. P.; LaLonde A.; Ma J. Processing parameters in laser powder bed fusion metal additive manufacturing. Mater. Des. 2020, 193, 108762 10.1016/j.matdes.2020.108762. [DOI] [Google Scholar]
- Mukherjee T.; Manvatkar V.; De A.; DebRoy T. Dimensionless numbers in additive manufacturing. Int. J. Appl. Phys. 2017, 121, 064904. 10.1063/1.4976006. [DOI] [Google Scholar]
- Van Elsen M.; Al-Bender F.; Kruth J. P. Application of dimensional analysis to selective laser melting. Rapid Prototyp. J. 2008, 14, 15–22. 10.1108/13552540810841526. [DOI] [Google Scholar]
- Mishurova T.; Artzt K.; Haubrich J.; Requena G.; Bruno G. New aspects about the search for the most relevant parameters optimizing SLM materials. Addit. Manuf. 2019, 25, 325–334. 10.1016/j.addma.2018.11.023. [DOI] [Google Scholar]
- Guo M.; Gu D.; Xi L.; Zhang H.; Zhang J.; Yang J.; Wang R. Selective laser melting additive manufacturing of pure tungsten: role of volumetric energy density on densification, microstructure and mechanical properties. Int. J. Refract. Hard Met. 2019, 84, 105025 10.1016/j.ijrmhm.2019.105025. [DOI] [Google Scholar]
- Nadammal N.; Mishurova T.; Fritsch T.; Serrano-Munoz I.; Kromm A.; Haberland C.; Portella P. D.; Bruno G. Critical role of scan strategies on the development of microstructure, texture, and residual stresses during laser powder bed fusion additive manufacturing. Addit. Manuf. 2021, 38, 101792 10.1016/j.addma.2020.101792. [DOI] [Google Scholar]
- Mukherjee T.; DebRoy T. Mitigation of lack of fusion defects in powder bed fusion additive manufacturing. J. Manuf. Process. 2018, 36, 442–449. 10.1016/j.jmapro.2018.10.028. [DOI] [Google Scholar]
- Li R.; Liu J.; Shi Y.; Wang L.; Jiang W. Balling behavior of stainless steel and nickel powder during selective laser melting process. J. Adv. Manuf. Technol. 2012, 59, 1025–1035. 10.1007/s00170-011-3566-1. [DOI] [Google Scholar]
- Nadammal N.; Cabeza S.; Mishurova T.; Thiede T.; Kromm A.; Seyfert C.; Farahbod L.; Haberland C.; Schneider J. A.; Portella P. D. Effect of hatch length on the development of microstructure, texture and residual stresses in selective laser melted superalloy Inconel 718. Mater. Des. 2017, 134, 139–150. 10.1016/j.matdes.2017.08.049. [DOI] [Google Scholar]
- Wadell H. Volume, shape, and roundness of quartz particles. J. Geol. 1935, 43, 250–280. 10.1086/624298. [DOI] [Google Scholar]
- Sanaei N.; Fatemi A.; Phan N. Defect characteristics and analysis of their variability in metal L-PBF additive manufacturing. Mater. Des. 2019, 182, 108091 10.1016/j.matdes.2019.108091. [DOI] [Google Scholar]
- Vastola G.; Pei Q.; Zhang Y.-W. Predictive model for porosity in powder-bed fusion additive manufacturing at high beam energy regime. Addit. Manuf. 2018, 22, 817–822. 10.1016/j.addma.2018.05.042. [DOI] [Google Scholar]
- Amato K.; Gaytan S.; Murr L. E.; Martinez E.; Shindo P.; Hernandez J.; Collins S.; Medina F. Microstructures and mechanical behavior of Inconel 718 fabricated by selective laser melting. Acta Mater. 2012, 60, 2229–2239. 10.1016/j.actamat.2011.12.032. [DOI] [Google Scholar]
- Batalha R. L. Selective laser melting of a biocompatible Ti-35Nb-7Zr-5Ta alloy. J. Mater. Res. 2019, 35, 1143–1153. [Google Scholar]
- Ozan S.; Lin J.; Li Y.; Zhang Y.; Munir K.; Jiang H.; Wen C. Deformation mechanism and mechanical properties of a thermomechanically processed β Ti–28Nb–35.4 Zr alloy. J. Mech. Behav. Biomed. Mater. 2018, 78, 224–234. 10.1016/j.jmbbm.2017.11.025. [DOI] [PubMed] [Google Scholar]
- Wan W.; Liu H.; Jiang Y.; Yi D.; Yi R.; Gao Q.; Wang D.; Yang Q. Microstructure characterization and property tailoring of a biomedical Ti–19Nb–1.5 Mo–4Zr–8Sn alloy. Mater. Sci. Eng., A 2015, 637, 130–138. 10.1016/j.msea.2015.04.020. [DOI] [Google Scholar]
- Ma X.-Q.; Niu H.-Z.; Yu Z.-T.; Yu S.; Wang C. Microstructural adjustments and mechanical properties of a cold-rolled biomedical near β– Ti alloy sheet. Rare Met. 2018, 37, 846–851. 10.1007/s12598-016-0801-9. [DOI] [Google Scholar]
- Bahl S.; Das S.; Suwas S.; Chatterjee K. Engineering the next-generation tin containing β titanium alloys with high strength and low modulus for orthopedic applications. Mech. Behav. Biomed. Mater. 2018, 78, 124–133. 10.1016/j.jmbbm.2017.11.014. [DOI] [PubMed] [Google Scholar]
- Okulov I.; Bönisch M.; Okulov A.; Volegov A.; Attar H.; Ehtemam-Haghighi S.; Calin M.; Wang Z.; Hohenwarter A.; Kaban I. Phase formation, microstructure and deformation behavior of heavily alloyed TiNb-and TiV-based titanium alloys. Mater. Sci. Eng., A 2018, 733, 80–86. 10.1016/j.msea.2018.07.047. [DOI] [Google Scholar]
- Li S.; Cui T.; Hao Y.; Yang R. Fatigue properties of a metastable β-type titanium alloy with reversible phase transformation. Acta Biomater. 2008, 4, 305–317. 10.1016/j.actbio.2007.09.009. [DOI] [PubMed] [Google Scholar]
- Sabban R.; Bahl S.; Chatterjee K.; Suwas S. Globularization using heat treatment in additively manufactured Ti-6Al-4V for high strength and toughness. Acta Mater. 2019, 162, 239–254. 10.1016/j.actamat.2018.09.064. [DOI] [Google Scholar]
- Batalha R. L.; Pauly S.; Kühn U.; Kosiba K.; Bolfarini C.; Kiminami C. S.; Gargarella P. Oligocrystalline microstructure in an additively manufactured biocompatible Ti-Nb-Zr-Ta alloy. Mater. Lett. 2020, 262, 127149 10.1016/j.matlet.2019.127149. [DOI] [Google Scholar]
- Okulov I. V.; Joo S.-H.; Okulov A. V.; Volegov A. S.; Luthringer B.; Willumeit-Römer R.; Zhang L.; Mädler L.; Eckert J.; Kato H. Surface functionalization of biomedical Ti-6Al-7Nb alloy by liquid metal dealloying. Nanomaterials 2020, 10, 1479. 10.3390/nano10081479. [DOI] [PMC free article] [PubMed] [Google Scholar]
- Acharya S.; Suwas S.; Chatterjee K. Review of recent developments in surface nanocrystallization of metallic biomaterials. Nanoscale 2021, 13, 2286–2301. 10.1039/D0NR07566C. [DOI] [PubMed] [Google Scholar]
- Bahl S.; Meka S. R. K.; Suwas S.; Chatterjee K. Surface severe plastic deformation of an orthopedic Ti–Nb–Sn alloy induces unusual precipitate remodeling and supports stem cell osteogenesis through Akt signaling. ACS Biomater. Sci. Eng. 2018, 4, 3132–3142. 10.1021/acsbiomaterials.8b00406. [DOI] [PubMed] [Google Scholar]
- Acharya S.; Panicker A. G.; Laxmi D. V.; Suwas S.; Chatterjee K. Study of the influence of Zr on the mechanical properties and functional response of Ti-Nb-Ta-Zr-O alloy for orthopedic applications. Mater. Des. 2019, 164, 107555 10.1016/j.matdes.2018.107555. [DOI] [Google Scholar]
- Acharya S.; Bahl S.; Dabas S. S.; Hassan S.; Gopal V.; Panicker A. G.; Manivasagam G.; Suwas S.; Chatterjee K. Role of aging induced α precipitation on the mechanical and tribocorrosive performance of a β Ti-Nb-Ta-O orthopedic alloy. Mater. Sci. Eng., C 2019, 103, 109755 10.1016/j.msec.2019.109755. [DOI] [PubMed] [Google Scholar]
- Nageswara Rao G.; Hanumantha Rao M.; Appa Rao B.; Sagar P. Electrochemical characterization of biomedical titanium alloy Ti-35Nb-7Zr-5Ta. Int. J. Adv. Eng. Technol. 2012, 3, 217–222. [Google Scholar]
- Thiede T.; Cabeza S.; Mishurova T.; Nadammal N.; Kromm A.; Bode J.; Haberland C.; Bruno G. Residual stress in selective laser melted Inconel 718: influence of the removal from base plate and deposition hatch length. Mater. Perform. Charact. 2018, 7, 717–735. 10.1520/MPC20170119. [DOI] [Google Scholar]
- Takakuwa O.; Soyama H. Effect of residual stress on the corrosion behavior of austenitic stainless steel. Adv. Chem. Eng. Sci. 2014, 5, 62. 10.4236/aces.2015.51007. [DOI] [Google Scholar]
- Donato T. A.; de Almeida L. H.; Nogueira R. A.; Niemeyer T. C.; Grandini C. R.; Caram R.; Schneider S. G.; Santos A. R. Jr. Cytotoxicity study of some Ti alloys used as biomaterial. Mater. Sci. Eng., C 2009, 29, 1365–1369. 10.1016/j.msec.2008.10.021. [DOI] [Google Scholar]
- Sun Y.; Song Y.; Zuo J.; Wang S.; Gao Z. Biocompatibility evaluation of novel β-type titanium alloy (Ti–35Nb–7Zr–5Ta) 98 Si 2 in vitro. RSC Adv. 2015, 5, 101794–101801. 10.1039/C5RA19767H. [DOI] [Google Scholar]
- Ivanov E.; del Rio E.; Kapchemnko I.; Nyström M.; Kotila J. Development of bio-compatible beta Ti alloy powders for additive manufacturing for application in patient-specific orthopedic implants. Key Eng. Mater. 2018, 770, 9–17. 10.4028/www.scientific.net/KEM.770.9. [DOI] [Google Scholar]
- Scherrer P.Bestimmung der inneren Struktur und der Größe von Kolloidteilchen mittels Röntgenstrahlen. In Kolloidchemie Ein Lehrbuch; Springer, 1912, pp 387–409. [Google Scholar]
- Kokubo T.; Yamaguchi S. Novel bioactive materials developed by simulated body fluid evaluation: Surface-modified Ti metal and its alloys. Acta Biomater. 2016, 44, 16–30. 10.1016/j.actbio.2016.08.013. [DOI] [PubMed] [Google Scholar]
Associated Data
This section collects any data citations, data availability statements, or supplementary materials included in this article.


