

Abstract
Massachusetts has one of the highest cumulative incidence rates of coronavirus disease 2019 (COVID-19) cases in the US. Understanding which specific demographic, economic, and occupational factors have contributed to disparities of COVID-19 is critical to inform public health strategies. We performed a cross-sectional study of 351 Massachusetts towns/cities (01/01/2020–05/06/2020) and found that a 10 percentage point increase in the Black population was associated with a 312.3 increase in COVID-19 cases per 100,000, while a 10 percentage point increase in the Latino population was associated with an increase of 258.2 cases per 100,000. Independent predictors of higher COVID-19 rates included the proportion of foreign-born non-citizens living in a community, mean household size, and share of food service workers. After adjustment for these variables, the association between the Latino population and COVID-19 rates was attenuated. In contrast, the association between the Black population and COVID-19 rates persisted, and may be explained by other systemic inequities. Public health and policy efforts that improve care for foreign born non-citizens, address crowded housing, and protect food-service workers may help mitigate the spread of COVID-19 among minority communities.
The United States is now the epicenter of the global coronavirus disease 2019 (COVID-19) pandemic. Massachusetts had one of the highest case and death rates in the country for much of the spring,1 and early reports suggest that Black and Latino persons are being disproportionately affected, similar to patterns observed in other states.2–4 In response to the unequal burden of the disease, Massachusetts lawmakers recently passed Bill H.4672,5 which aims to understand the racial and ethnic health inequities that have emerged amid the pandemic.
Although Black and Latino communities in Massachusetts have shouldered a larger burden of COVID-19,2,4 evidence regarding the community-level factors that may be contributing to these disparities remains sparse. Furthermore, because most data collected by Departments of Health focus on only a few demographic factors such as age, sex, and race/ethnicity, there has been a paucity of objective data on whether COVID-19 cases are characterized by disparities along other important dimensions. There is growing concern, for example, that lower-income and Black and Latino persons may be at greater risk of exposure to COVID-19 because they are more likely to be essential workers, and also tend to live in densely-populated areas and multigenerational households.6–8 Among immigrant communities, there are reports of foreign born non-citizens avoiding care (including testing and advice regarding COVID-19-like symptoms) for fear of deportation or risking their future legal resident status based on new federal “public charge” regulations.9,10
Finally, long-standing historical inequities and structural racism, which have led to adverse outcomes including residential segregation and differences in access to health care, may also contribute to these disparities.11–13 Therefore, an understanding of the factors leading to increased case rates among minority communities is urgently needed to inform strategies to mitigate the ongoing spread of the disease.
This study has two key objectives. First, we sought to characterize the association between the proportion of Black or Latino persons and COVID-19 cases in cities and towns across Massachusetts. Second, we evaluated what other demographic, occupational, and economic factors are associated with elevated community risk for COVID-19, and which of these factors—if any—are contributing to potential racial and ethnic disparities.
Study Data And Methods
DATA SOURCES
The Massachusetts Department of Public Health database, which is publicly available on the Mass.gov website, was used to obtain the number of confirmed COVID-19 cases per 100,000 residents by city or town between January 1, 2020 to May 6, 2020.14 The state has released exact counts of confirmed cases for most towns, including those with 0 cases, but it censors values for towns with between 1 and 4 total cases and simply reports “<5 cases”; for these towns (representing 0.8% of our weighted sample), we imputed the absolute rate at the median of this range at 2.5, and divided by the population total to convert to a rate per 100,000.
The 2013–2018 American Community Survey was used to obtain demographic, economic, and occupational variables at the city and town level.15 The primary variables of interest were the proportions of people in one of four mutually-exclusive racial/ethnic groups (based on self-report): Hispanic or Latino ethnicity (referred to as Latino for brevity); Black non-Latino; White non-Latino; and Other non-Latino (approximately 70% of whom are Asian-American or Pacific Islander). Other demographic, economic, and occupational variables at the community-level were total population; average age; average household size; median household income; and the proportions of people who were age 60 years or older, male, were employed as essential workers, were foreign-born non-citizens, and completed less than a high school degree. Most foreign-born non-citizens in Massachusetts are from Latin America (44.9%), Asia (30.7%), Europe (13.9%), and Africa (7.5%).15
We classified employed residents into essential workers and non-essential workers based on the state’s classification in the governor’s March 2020 emergency order.16 The following occupations were defined as essential: health care practitioners, technical occupations, and support services; construction and extraction; installation, maintenance, and repair; material moving occupation; production services; transportation; building and grounds cleaning and maintenance; food preparation and serving-related occupation; personal care and service occupation; and protective services.
STATISTICAL ANALYSIS
We categorized cities and towns in our sample into quartiles based on the proportion of Black residents, and then analyzed population-weighted descriptive statistics. We repeated this based on the proportion of Latino residents.
Next, we estimated linear regression models to assess the association between the proportions of each racial/ethnic group with the number of COVID-19 cases per 100,000 people in each city or town. Models were weighted by the population size of each town. We first performed a series of univariate analyses using each demographic, economic, and occupational variable as a predictor with COVID-19 case rates as the dependent variable. Analyses that focused on a specific race/ethnicity (e.g. proportion Black residents) as a predictor adjusted for the proportion of other racial/ethnic minority residents in a town (e.g. proportion Latino, proportion other non-Latino). Then, we performed multivariable linear regression to assess what factors were independently associated with differences in COVID19 case rates, and which of those factors—if any—attenuated the observed racial/ethnic disparities after adjustment. We present two versions of the multivariable model—first, using natural units for each covariate (e.g. proportion of people by race/ethnicity, foreign-born non-citizens, essential workers, over age 60 years old, and those with less than a high school education; number of people for household size; dollars for median income; total number of people in city or town); and second using normalized z-scores, which enable an apples-to-apples comparison of the strength of the associations for a one-standard deviation increase in each covariate.
Several sensitivity analyses were performed. Since the “essential occupations” designation aggregates a heterogeneous set of jobs that likely have different levels of risk, we tested a model that separately identified the three most common categories of essential work in our sample—healthcare-related, food services, and construction/extraction jobs.
To examine whether our results were being driven by a small number of large population areas (particularly Boston), we performed sensitivity analyses with multivariable regression models limited to the top 50 largest towns and cities, and separately, limited to the smaller towns (all other towns not in the top 50). All analyses were repeated using the logarithm of the COVID-19 rate as the outcome, and we also tested using the log of average household income as a covariate. We also tested whether excluding towns with censored COVID rates between 1 and 4 affected our results.
In addition, because data on deaths at the city/town level are not publicly available, we performed county-level analyses to assess the association between proportion of Black or Latino population and the number of confirmed COVID-19 cases and deaths per 100,000 population within a county. We also assessed the correlation between COVID-19 case rates and COVID-19 death rates within counties.14
The Harvard T.H. Chan School of Public Health Institutional Review Board deemed this study non-human-subjects research given the use of aggregated publicly available data. Analysis was performed using STATA Version 14.0.
LIMITATIONS
There are important limitations to this study. First, in Massachusetts—as in most states and localities to our knowledge—individual-level data by race/ethnicity and other demographic, economic, and occupational variables are not currently publicly available. Since our analysis focused on community-level variables, these population-level findings may be subject to ecological fallacy. However, the broad pattern of our findings on race/ethnicity match closely the individual-level disparities evident in other patient-level data sources.17,18 Moreover, in the absence of individual-level demographic, economic, and occupational data, our evaluation of these factors at the level of the city of town provides the most granular level of analysis currently possible, and improves considerably over county or state-based analyses.
Second, although Massachusetts is a COVID-19 “hot-spot,” these findings may not be generalizable to other U.S. states. While our single-state study may limit its generalizability, there is wide variation across states in testing availability and guidelines, which may bias rates of confirmed COVID-19.19 Therefore, this analysis’s focus on a single state likely improved its internal validity to assess the predictors of COVID-19 case rates. In addition, Massachusetts has the fourth highest median income of any state and the highest level of health coverage in the nation,20,21 though it is unclear whether insurance coverage has any mitigating effect on rates of COVID-19 transmission and disparities.
Third, we focused on confirmed COVID-19 cases, since town and city COVID-19 death rates are not publicly available. Our county level analysis indicates that COVID-19 case rates and deaths rates were highly correlated, suggesting the pattern seen here for cases is likely similar for death rates. Unlike death rates, however, variation in cases could potentially be affected by differences in testing patterns across localities or other sociodemographic factors. Given known disparities in health care access and COVID-19 testing availability, the communities that we identified as being at higher risk for COVID-19 may—if anything—be less likely to receive adequate testing,19,22 which suggests that our results likely underestimate disparities in case rates. Finally, underlying differences in comorbidities across minority groups were not captured in our study; however, this would be more likely to affect disparities in death rates rather than case rates.
Study Results
CHARACTERISTICS OF TOWNS AND CITIES
All 351 towns and cities in Massachusetts were included in the analysis. Towns with a higher proportion of Black residents and Latino residents had larger populations on average, fewer high school graduates, lower median incomes, younger residents, and more foreign-born non-citizens than towns with fewer minorities (online supplemental exhibit 1).23 Average household size was slightly smaller among high-Latino and high-Black communities compared to other communities (2.5 vs. 2.6). The proportion of people working in essential service occupations was higher among high-Black and high-Latino communities, including food and service preparation and building, grounds cleaning and maintenance services.
RACE/ETHNICITY
Towns with a higher proportion of Black residents or Latino residents generally had a higher number of COVID-19 cases per 100,000 population (supplemental exhibits 2 and 3).23 Notably, the state’s 5 towns with the highest COVID-19 rates are all majority-minority, including Chelsea, which has a population that is two-thirds Latino and has the highest confirmed infection rate in the state—nearly 6 times higher than the state average.24
In the unadjusted analyses of race/ethnicity (with White non-Latino the omitted group), a 10 percentage point increase in the Black population was associated with an increase of 312.3 [95% CI 241.9 to 383.0, p < 0.001] cases per 100,000 (supplemental exhibit 4).23 A 10 percentage point increase in the Latino population was associated with an increase of 258.2 [95% CI 217.0 to 300.3, p < 0.001] cases per 100,000, while a 10 percentage point increase in the Other non-Latino population was associated with an increase of 86.5 [95% CI 7.2 to 169.9, p = 0.03] cases per 100,000.
After multivariable adjustment, the association between the Black population and case rates persisted with a 10 percentage point higher population associated with an additional 307.2 cases [95% CI 219.6 to 394.7, p < 0.001] per 100,000. In contrast, the association between the Latino population and case rates was substantially attenuated and no longer statistically significant (50.4, [95% CI −19.0 to 119.8], p = 0.15). Meanwhile, after adjustment, the association between the proportion of Other non-Latino race and case rates became significantly negative (−216.4, [95% CI −321.4 to −111.3], p < 0.001).
DEMOGRAPHIC, ECONOMIC, AND OTHER FACTORS
Several factors were significantly associated with higher COVID-19 case rates across towns and cities in unadjusted models: higher average household size; and larger shares of essential workers, foreign-born non-citizens, and non-high school graduates. After multivariable adjustment, mean household size and proportion of foreign-born non-citizens were still independently associated with higher COVID-19 rates. The model using normalized values for these covariates showed that the largest absolute risk factor was the share of foreign-born non-citizens (310.4 per standard deviation, 95% CI 253.5 to 367.2) and then mean household size (236.4 per SD, 95% CI 131.9 to 340.9). Older age was also associated with additional cases while larger population size was associated with slightly fewer cases but both were weaker predictors.
Although the overall proportion of essential service workers was no longer associated with case rates in our multivariable analysis, an exploratory analysis of the three most common occupations found that employment in food service was significantly associated with higher case rates (71.4 per standard deviation, 95% CI 7.2 to 135.7) (appendix exhibit 1).23
SENSITIVITY ANALYSES
We observed a similar association between race/ethnicity and COVID-19 case rates in the multivariable analysis when we stratified the sample into the largest 50 towns and cities and all other (smaller) towns (appendix exhibit 2).23 The proportion of foreign-born non-citizens remained the strongest predictor of case rates in the largest towns and cities, while in smaller towns, a larger mean household size was significantly associated with higher case rates. Results were generally similar using the logarithm of the COVID-19 case rate as an outcome, when excluding towns with censored values for cases between 1 and 4 individuals, when excluding Boston from the sample, and when measuring income using the logarithm of average household income (data not reported).
We also performed additional county-level analyses and found that a higher proportion of Black or Latino residents within a county was associated with a significant increase in county-level cases and deaths (appendix exhibits 3 and 4).23 There was also a strong positive correlation between the number of county-level cases and county-level deaths (Pearson’s coefficient, 0.82, p < 0.001) (appendix exhibit 5).23
Discussion
Across Massachusetts’ cities and towns, Latino and Black communities are experiencing much higher rates of COVID-19 cases. Several factors measured in our data (foreign-born non-citizen status, household size, and job type) appear to explain the higher COVID-19 case rates among Latino communities in Massachusetts. It appears that these factors may not be the primary reason for higher case rates in Black communities.
While the extent of racial and ethnic disparities has already been documented,25–27 our study identifies important factors that are independently associated with higher COVID-19 case rates in the state. The proportion of foreign-born non-citizens was the strongest predictor of the burden of COVID-19 cases within a community, and in Massachusetts, this population includes sizable numbers of both Latin American (44.9%) and Asian individuals (30.7%).15 Furthermore, under the Trump Administration’s revised “Public Charge” Rule, which took effect in early 2020, lawfully present immigrants who use public benefits from local, state, or federal governments may be at risk of being denied permanent residency status. Although the U.S. Citizenship and Immigration Services website now encourages immigrants to seek care for COVID-19-like symptoms, enrollment in Medicaid at the time of COVID-19-related care may still be used in the Public Charge analysis.28 Recent studies suggest that immigrant families have strong incentives not to enroll in public health insurance like Medicaid and may avoid seeking medical care if they develop COVID-19-like symptoms and require testing.10 In the absence of a positive test, these individuals are less likely to isolate and quarantine, which may impede public health efforts to control the spread of COVID-19.29,30
These issues are likely only magnified by the fact that immigrants tend to live in larger households,31 which we also found to be an independent predictor of COVID-19 case rates. Policy approaches that reduce barriers to accessing medical care for immigrant populations and that address crowded housing—particularly when individuals have tested positive and need to be isolated—could be important avenues for reducing disparities and slowing the spread of infection.
Our work also sheds important insights into the factors that may be contributing to the higher rates of COVID-19 cases among Latino communities. As noted above, many immigrants in the Latino community may be deferring necessary care for fear of risking citizenship under the Public Charge rule or possible deportation. In addition, Latino persons tend to be disproportionately employed in essential services that are public facing, particularly in the food service industry, which we found to be associated with higher COVID-19 rates. As the state moves to cautiously re-open more businesses, greater worker protections to reduce potential exposures may be needed in these jobs. Many low-income minority workers also do not have the luxury of working from home,25 and less than half of Latino workers in the U.S. have jobs with paid sick leave.32 While Congress recently expanded the availability of paid sick leave under the CARES Act in March 2020, the law exempted workers in large firms and health care organizations, which may leave many essential workers unprotected if they contract COVID-19.33
Meanwhile, our results show large disparities in infection rates associated with Black communities, but these disparities do not appear to be primarily explained by the factors that we examined. Other factors not examined in this study may explain the disparate impact of COVID-19 in Black communities.12,13 Structural inequities, such as disproportionately high incarceration rates,34 residence in areas with a higher concentration of multiunit residential buildings,35 and de facto neighborhood segregation, which may lead to disparities in health care access and greater exposure to environmental hazards, may contribute to the spread of COVID-19 in these communities. Transportation use may also increase the risk of exposure to COVID-19, as Black workers are more likely to use public transit to commute to work.36
Evidence emerging from other U.S. cities and states has similarly described that Black and Latino populations are being disproportionately affected by COVID-19.3,25,26 In addition, preliminary work from Massachusetts suggests that these populations also have substantially higher death rates.37 Our study expands upon these findings in several ways. We identify important factors (proportion of foreign-born non-citizens in a community, household size, food service occupation) that are strongly associated with the risk of developing COVID-19. In addition, we characterize the extent to which these factors, among others, may be contributing to the higher number of COVID-19 cases in Black and Latino communities. Because we evaluate each of these unique populations separately, we find that some factors, such as occupation in an essential service field, may not affect Black and Latino communities in a similar manner. Our findings provide important insights that may inform and help tailor public health and policy strategies to address the ongoing COVID-19 pandemic.
Conclusion
Across Massachusetts cities and towns, significant COVID-19 disparities are evident along multiple dimensions—particularly race/ethnicity, foreign-born non-citizen status, household size, and job type. Higher proportions of Black or Latino residents within a community was significantly associated with higher rates of COVID-19 cases. The factors examined in our study explained this relationship for Latino communities but did not appear to explain the higher rates among black communities. Further research into the social and economic factors underlying COVID-19-related disparities and new policies to address risk factors and institutional racism will be critical to controlling the epidemic and improving health equity.
Supplementary Material
Supplemental Exhibit 1. Characteristics of Cities/Towns in Massachusetts by Proportion Black or Latino Population
Supplemental Exhibit 2. Proportion Black non-Latino Population and Number of COVID-19 Cases per 100,000 Population Across Massachusetts Cities and Towns
Supplemental Exhibit 3. Proportion Latino Population and Number of COVID-19 Cases per 100,000 Population Across Massachusetts Cities and Towns
Supplemental Exhibit 4. Association of Race/Ethnicity, Demographic, Economic, and Occupational Factors with COVID-19 Case Rates across Massachusetts Cities and Towns
Acknowledgments
This work was partially funded by the Robert Wood Johnson Foundation Policies for Action. Jose Figueroa reports receiving grants from the Commonwealth Fund and Robert Wood Johnson Foundation for other work unrelated to this project. Rishi Wadhera reported receiving research support from the National Heart, Lung, and Blood Institute (grant K23HL148525-1) and previously serving as a consultant for Regeneron. Robert Yeh reported receiving research support from the National Heart, Lung, and Blood Institute (grant R01HL136708); serving as a consultant to Biosense Webster; and serving as a consultant to and receiving grants from Abbott Vascular, AstraZeneca, Boston Scientific, and Medtronic. Benjamin Sommers reported receiving funding from the Commonwealth Fund, the Robert Wood Johnson Foundation, the National Institutes of Health (R01MD014970).
Appendix Exhibit 1.
Association of Race/Ethnicity, Demographic, Economic, and Occupational Factors with COVID-19 Case Rates across Massachusetts Cities and Towns (Including 3 Most Common Essential Service Occupations)
| City/town variable | Increases in cases per 100,000 | |||||
|---|---|---|---|---|---|---|
| Multivariable Analysisa | Multivariable Analysis using Z-scoresb | |||||
| Estimate | 95% CI | p-value | Estimate | 95% CI | p-value | |
| Proportion of Black non-Latino Population | 323.9 | 225.0 to 422.8 | <0.001 | 134.1 | 93.1 to 175.0 | <0.001 |
| Proportion of Latino Population | 49.7 | −25.6 to 125.0 | 0.195 | 40.1 | −20.6 to 100.7 | 0.195 |
| Proportion of Other Non-Latino Population | −212.2 | −324.2 to −100.2 | <0.001 | −120.0 | −183.4 to −56.7 | <0.001 |
| City/town population size | −4.5 | −8.2 to −0.70 | 0.02 | −18.8 | −34.6 to −3.0 | 0.020 |
| Age, Proportion age >60 years | 165.7 | 42.5 to 288.9 | 0.009 | 123.8 | 31.8 to 215.9 | 0.009 |
| Household size | 839.1 | 499.1 to 1179.5 | <0.001 | 223.8 | 133.1 to 314.5 | <0.001 |
| Proportion with < HS education | 88.4 | −70.7 to 247.4 | 0.275 | 41.4 | −33.1 to 116.0 | 0.275 |
| Median income | −8.9 | −45.6 to 27.8 | 0.633 | −26.7 | −136.4 to 83.1 | 0.633 |
| Proportion of non-citizens | 670.1 | 514.4 to 825.7 | <0.001 | 288.9 | 221.8 to 356.1 | <0.001 |
| Proportion of food service workers | 313.1 | 31.4 to 594.8 | 0.029 | 71.4 | 7.2 to 135.7 | 0.029 |
| Proportion of essential healthcare workers | −74.7 | −334.5 to 185.0 | 0.572 | −20.8 | −93.1 to 51.5 | 0.572 |
| Proportion of construction/extraction workers | −61.4 | −381.0 to 258.2 | 0.706 | −19.5 | −120.9 to 82.0 | 0.706 |
Source: Authors’ analyses of Massachusetts Department of Public Health Data 2020 and American Community Survey
Caption:
- Changes in case rates reflect a per 10 percentage point increase in the following variables: Proportion Black non-Latino, Latino, Other non-Latino population, age over 60 years, people with less than a high school education, foreign-born non-citizens, and proportion of food service workers, essential healthcare workers, or construction/extraction workers.
- For city/town population size, changes in case rates reflect a per 10,000 people increase
- For average household size, changes in case rates reflect a 1 person increase
- For median income, changes in case rates reflect a per $10,000 increase
Adjusted z-scores reflect changes in case rates per 1 standard deviation increase for all town/city variables
Appendix Exhibit 2.
Association of Race/Ethnicity, Demographic, Economic, and Occupational Factors with COVID-19 Case Rates Across Larger Cities vs. Smaller Towns in Massachusetts
| City/town variable | Increases in COVID-19 Cases per 100,000 | |||||
|---|---|---|---|---|---|---|
| Large cities (Top 50 most populated cities only) | Smaller towns (excluding 50 most populated cities) | |||||
| Estimate | 95% CI | p-value | Estimate | 95% CI | p-value | |
| Proportion of Black Non-Latino Population | 251.3 | 15.5 to 487.1 | 0.037 | 353.3 | 190.3 to 516.3 | <0.001 |
| Proportion of Latino Population | −17.6 | −237.5 to 202.3 | 0.872 | 54.1 | −87.6 to 195.8 | 0.453 |
| Proportion of Other Non-Latino Population | −300.2 | −639.9 to 39.6 | 0.082 | −92.3 | −209.9 to 25.3 | 0.124 |
| City/town population size | −0.8 | −10.4 to 8.8 | 0.868 | 177.1 | 127.8 to 226.5 | <0.001 |
| Age, Proportion age >60 years | 91.6 | −691.9 to 875.0 | 0.814 | 48.7 | −50.8 to 148.3 | 0.336 |
| Average Household size | 1233.7 | −512.9 to 2,980.2 | 0.161 | 390.9 | 48.2 to 733.7 | 0.026 |
| Proportion with < HS education | 35.9 | −549.9 to 621.7 | 0.902 | 30.3 | −150.6 to 211.1 | 0.742 |
| Median income | 6.6 | −232.3 to 245.6 | 0.955 | −40.4 | −74.6 to −6.1 | 0.021 |
| Proportion of non-citizens | 765.1 | 385.2 to 1,144.9 | <0.001 | 203.4 | −177.6 to −0.9 | 0.048 |
| Proportion of essential workers | 98.9 | −544.9 to 742.6 | 0.758 | −89.3 | −22.7 to 429.5 | 0.078 |
Source: Authors’ analyses of Massachusetts Department of Public Health Data 2020 and American Community Survey
- Changes in case rates reflect a per 10 percentage point increase in the following variables: Proportion Black, Latino, Other non-Latino population, age over 60 years, people with less than a high school education, foreign-born non-citizens, essential non-healthcare workers, and essential healthcare workers.
- For city/town population size, changes in case rates reflect a per 10,000 people increase
- For average household size, changes in case rates reflect a 1 person increase
- For median income, changes in case rates reflect a per $10,000 increase
Appendix Exhibit 3.
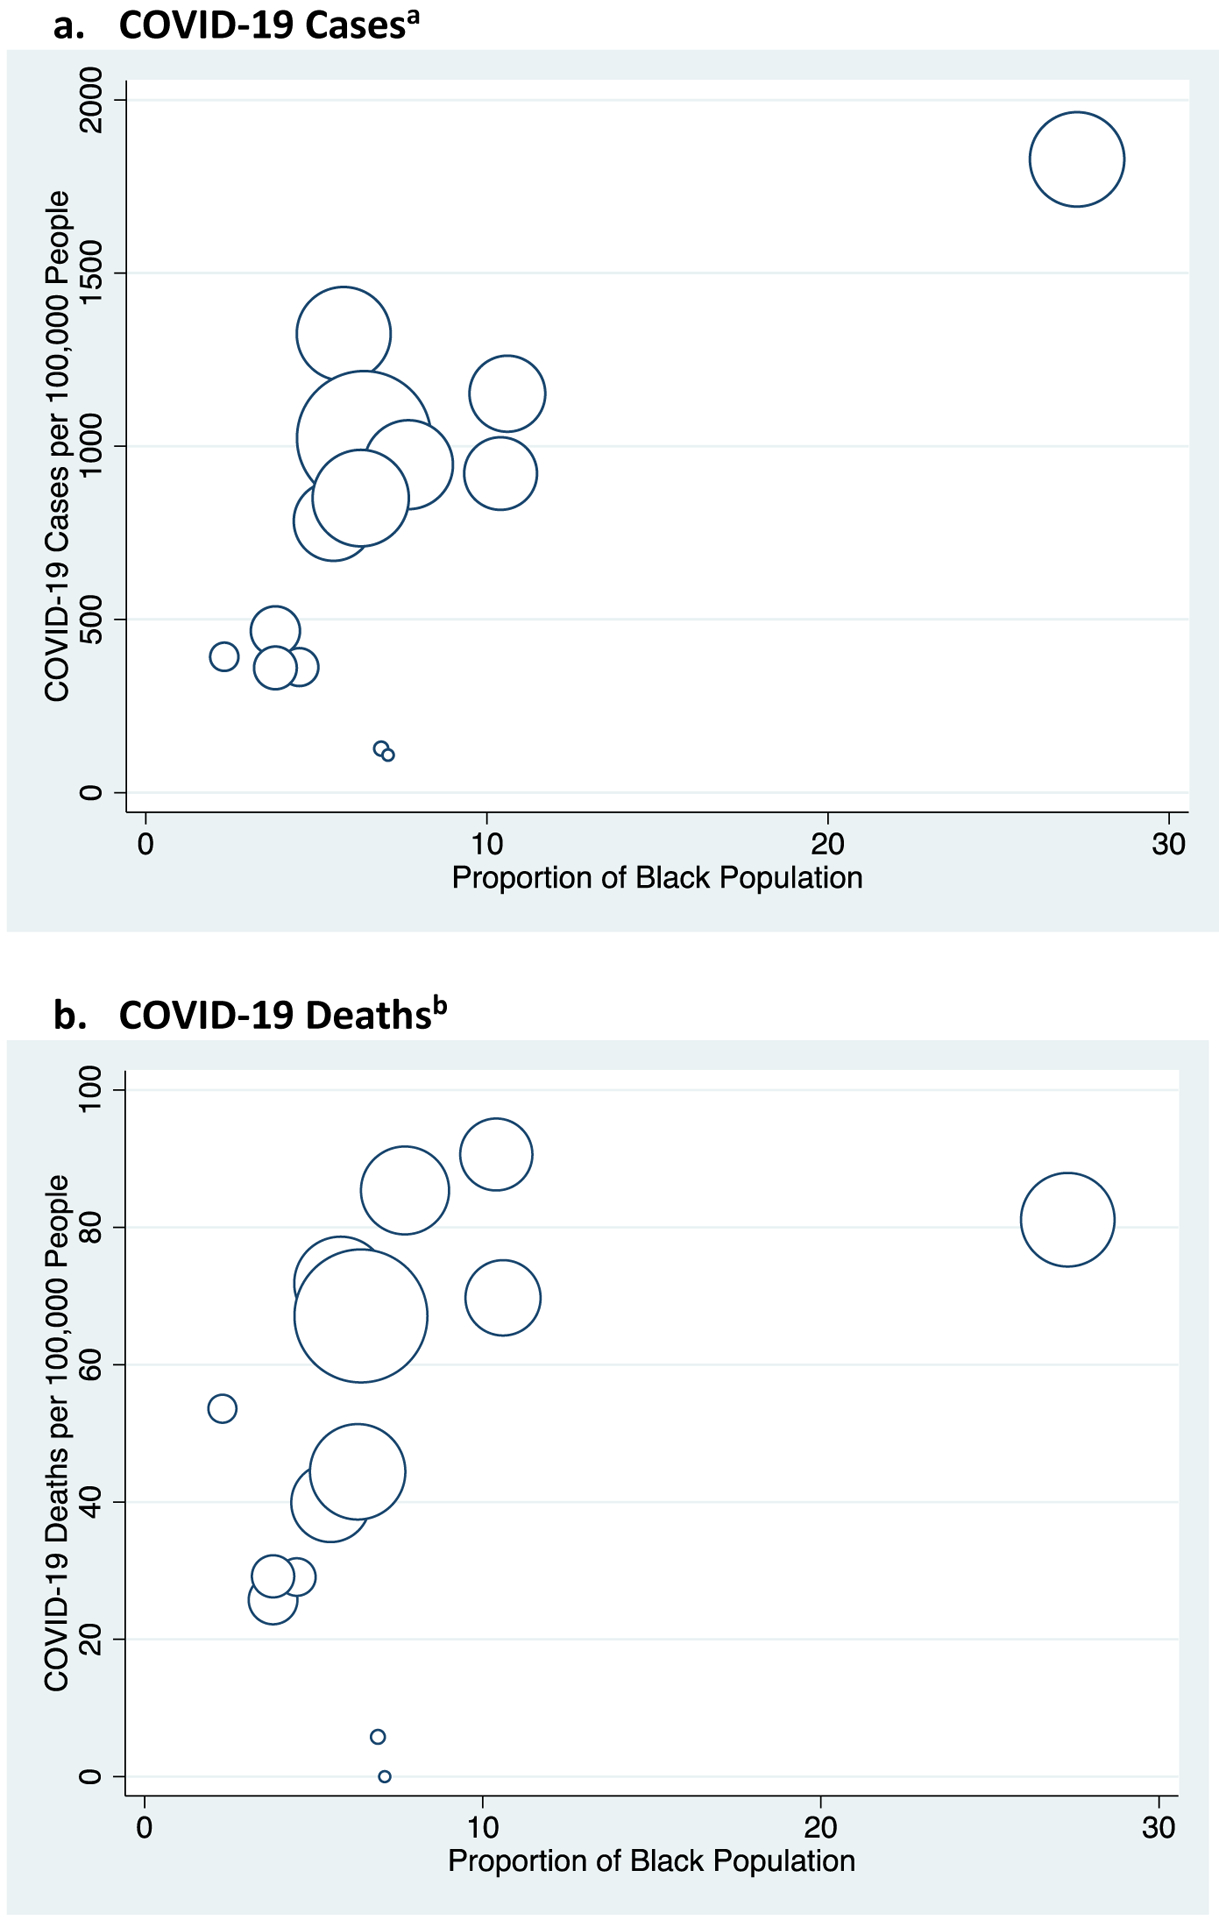
Proportion Black Population and Number of COVID-19 Cases and Deaths per 100,000 Population Across Massachusetts Counties
Source: Authors’ analyses of Massachusetts Department of Public Health Data 2020 and American Community Survey
Caption: Massachusetts counties include: Barnstable, Berkshire, Bristol, Dukes, Essex, Franklin, Hampden, Hampshire, Middlesex, Nantucket, Norfolk, Plymouth, Suffolk, Worchester. Size of data points correspond to the relative county population sizes.
Data from January 1st to May 6th, 2020 from Massachusetts Department of Public Health.
a Pearson Correlation Coefficient, 0.72 (p-value = 0.004)
b Pearson Correlation Coefficient, 0.45 (p-value = 0.02)
Appendix Exhibit 4.
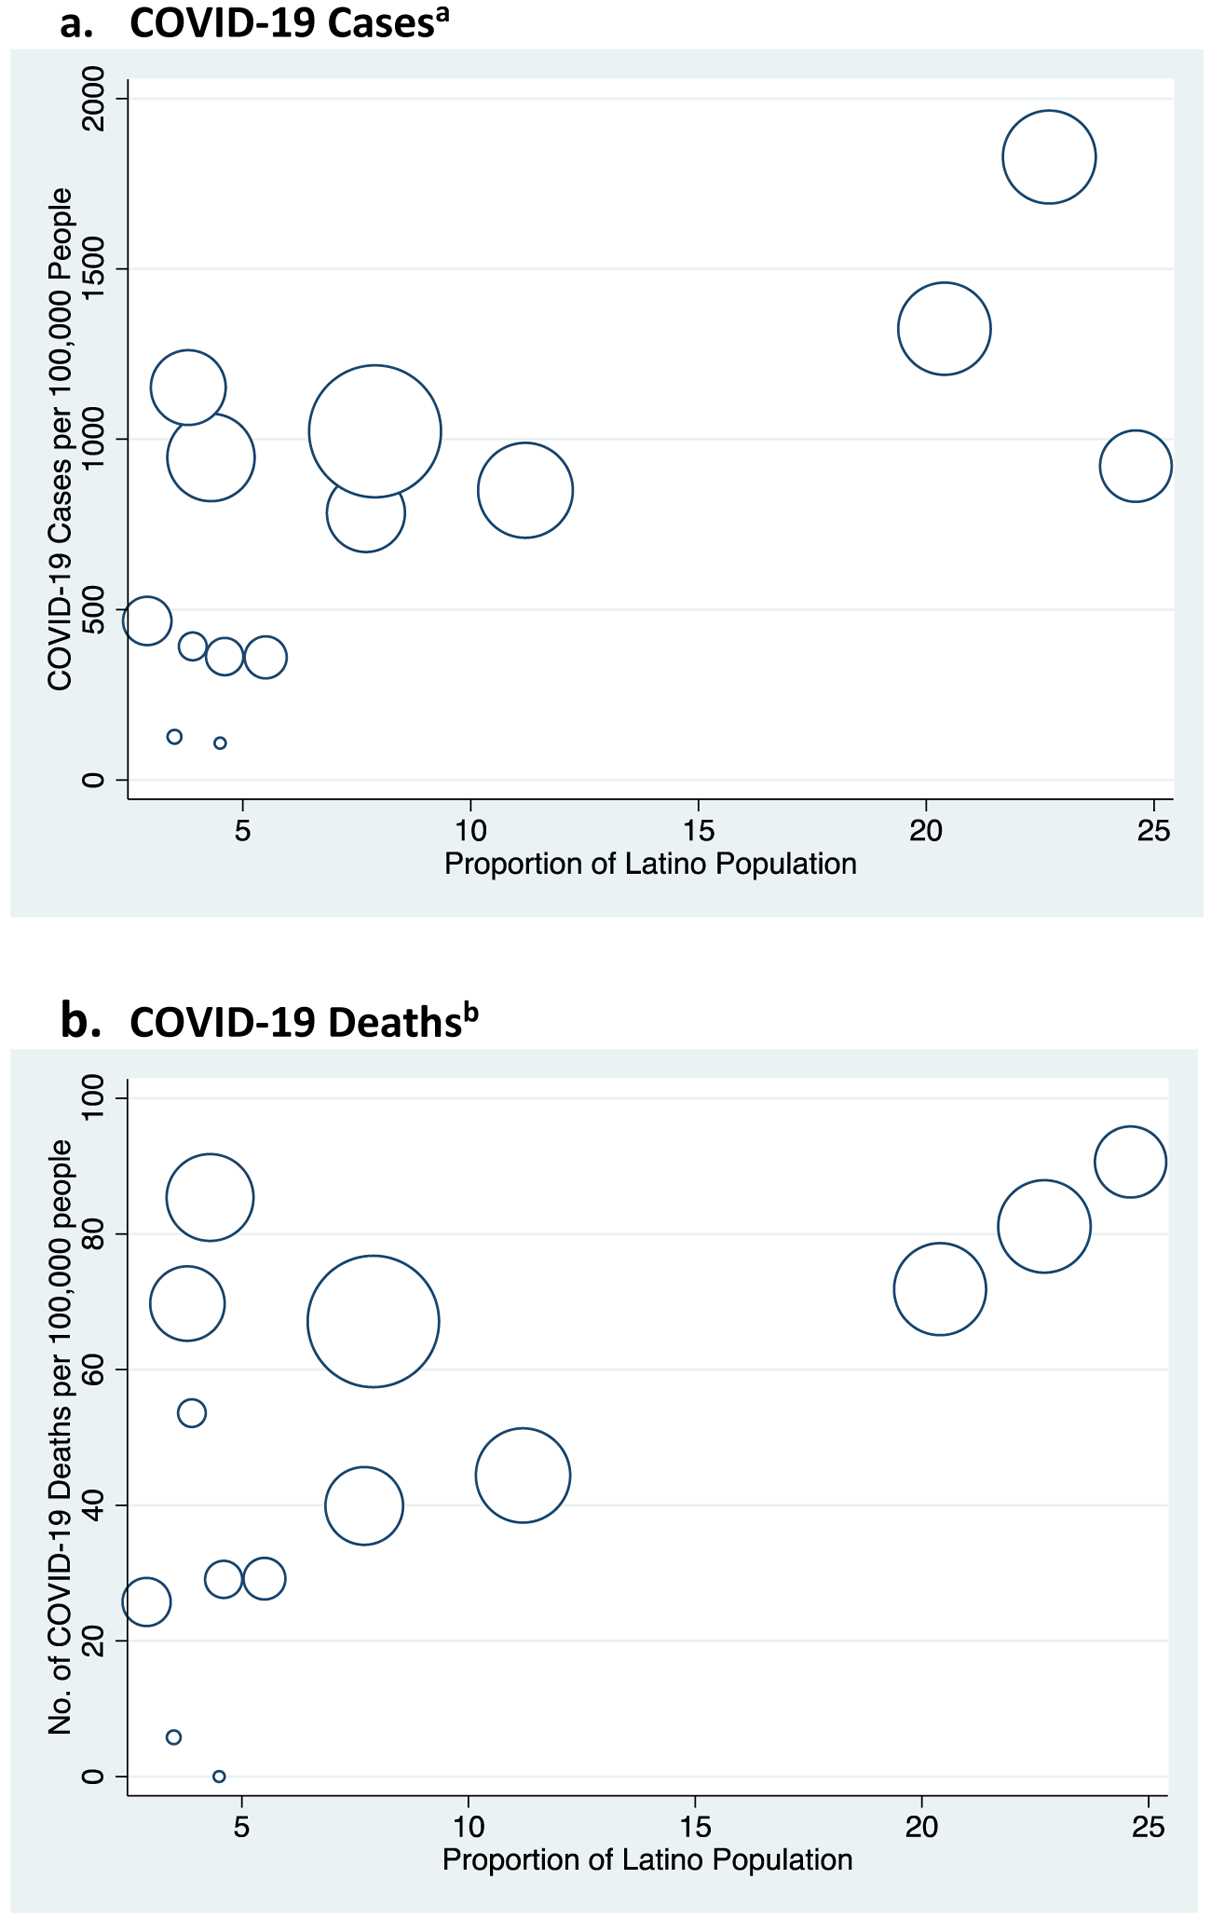
Proportion Latino Population and Number of COVID-19 Cases and Deaths per 100,000 Population Across Massachusetts Counties
Source: Authors’ analyses of Massachusetts Department of Public Health Data 2020 and American Community Survey
Notes: Counties include: Barnstable, Berkshire, Bristol, Dukes, Essex, Franklin, Hampden, Hampshire, Middlesex, Nantucket, Norfolk, Plymouth, Suffolk, Worchester. Size of data points correspond to the relative county population sizes.
Data from January 1st to May 6th, 2020 from Massachusetts Department of Public Health.
a Pearson Correlation Coefficient, 0.69 (p-value=0.006)
b Pearson Correlation Coefficient, 0.61 (p-value=0.020)
Appendix Exhibit 5.
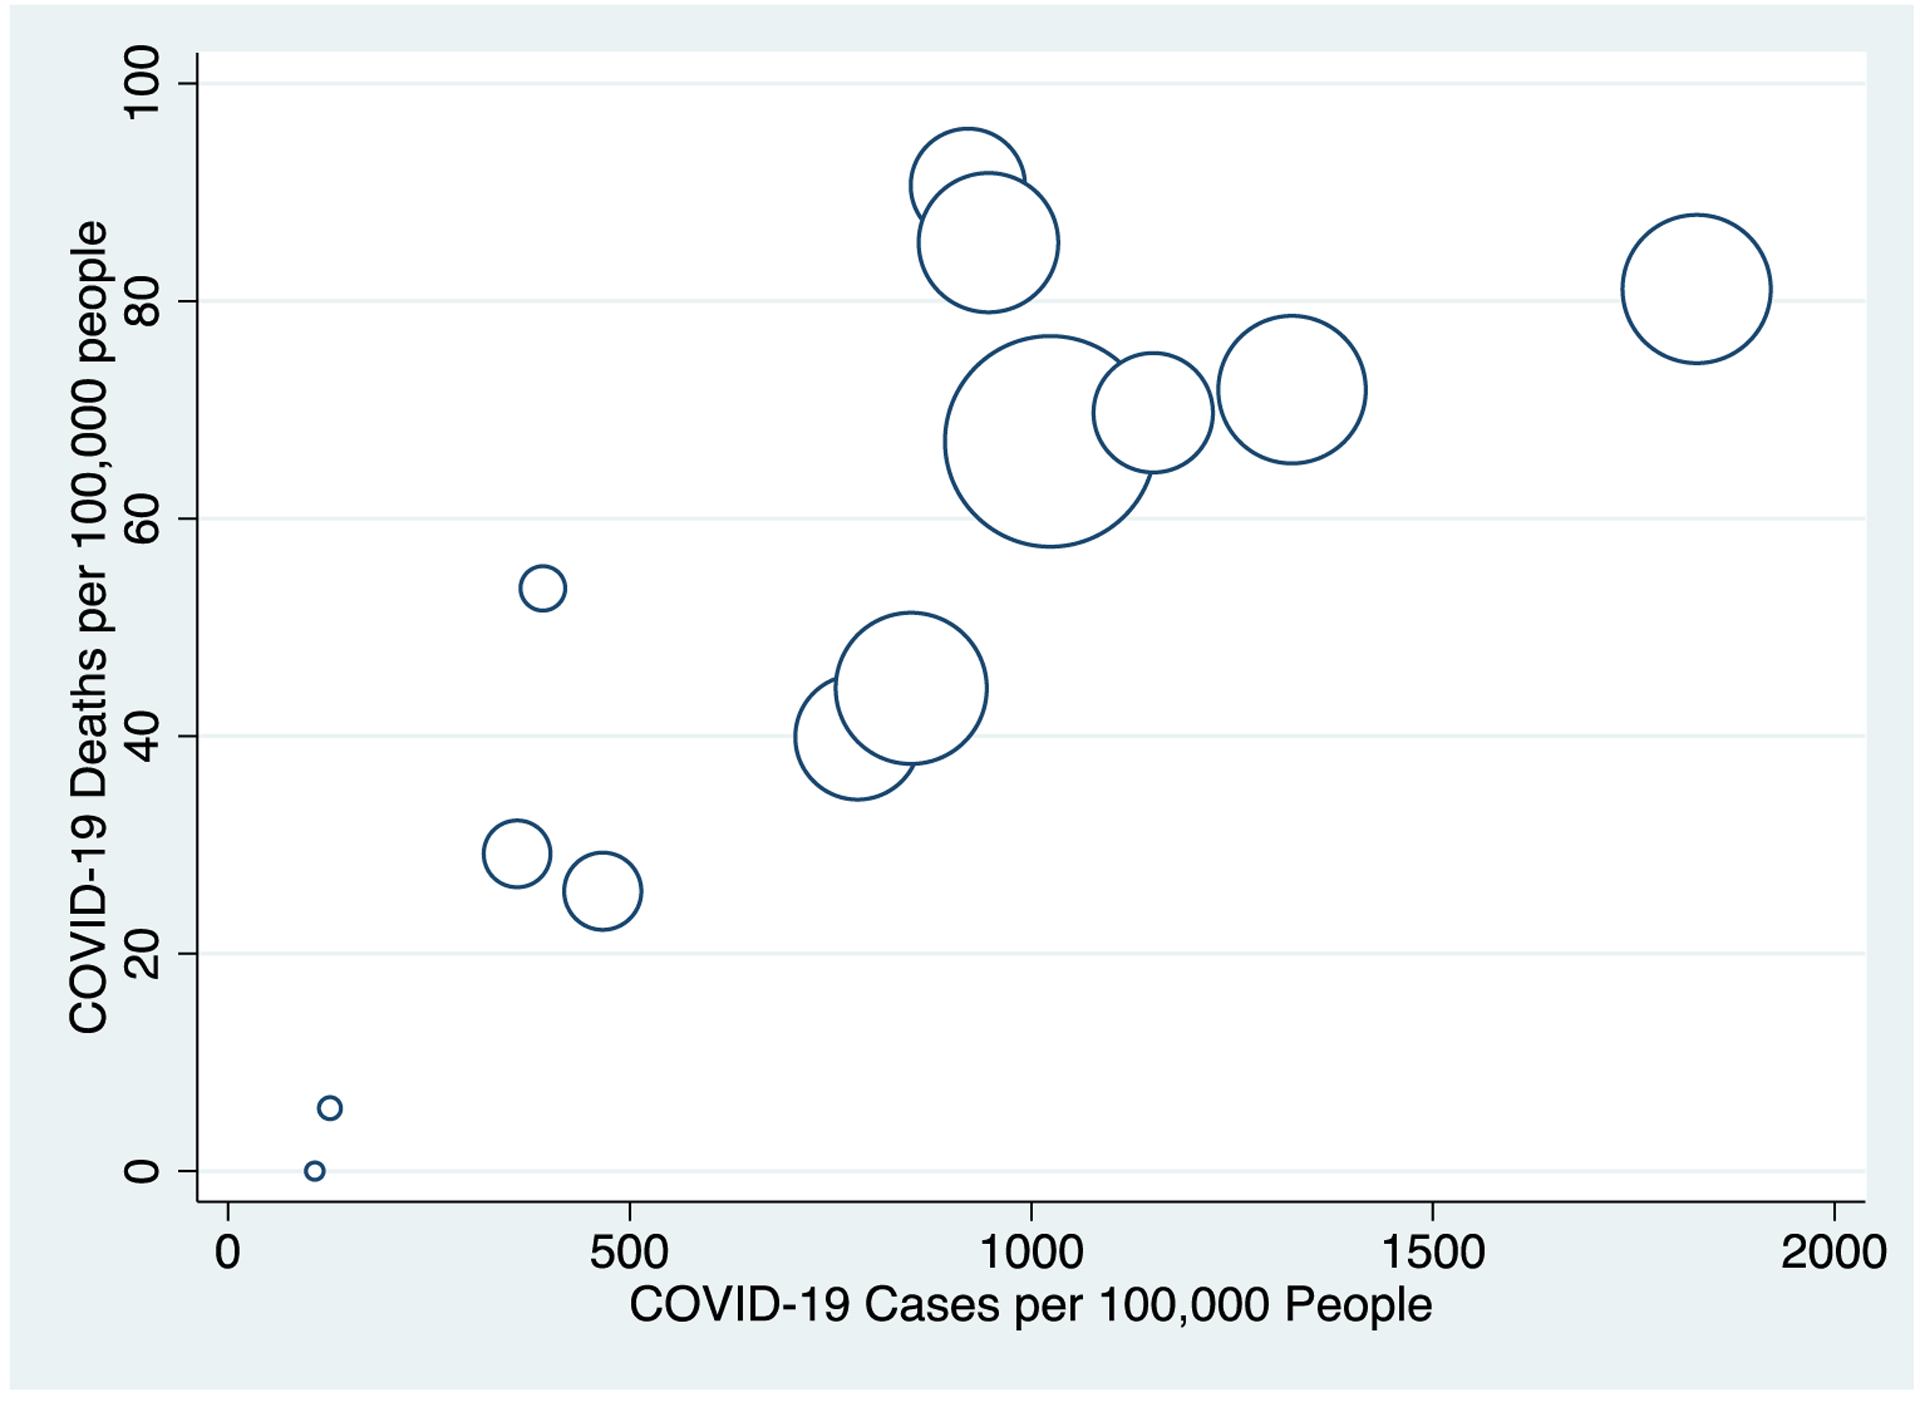
Number of COVID-19 Cases per 100,000 Population and Number of COVID-19 Deaths per 100,000 Population Across Massachusetts Countiesa
Source: Authors’ analyses of Massachusetts Department of Public Health Data 2020 and American Community Survey
Notes: Massachusetts counties include: Barnstable, Berkshire, Bristol, Dukes, Essex, Franklin, Hampden, Hampshire, Middlesex, Nantucket, Norfolk, Plymouth, Suffolk, Worchester. Size of data points correspond to the relative county population sizes.
Data from January 1st to May 6th, 2020 from Massachusetts Department of Public Health.
aPearson Correlation Coefficient for COVID-19 Case Rates and Death Rates = 0.82 (p<0.001)
Contributor Information
Jose F. Figueroa, Department of Health Policy and Management, Harvard T. H. Chan School of Public Health, in Boston, Massachusetts..
Rishi K. Wadhera, Division of Cardiology, Department of Medicine, Beth Israel Deaconess Medical Center, in Boston, Massachusetts..
Dennis Lee, Department of Health Policy and Management, Harvard T. H. Chan School of Public Health..
Robert W. Yeh, Division of Cardiology, Department of Medicine, Beth Israel Deaconess Medical Center..
Benjamin D. Sommers, Department of Health Policy and Management, Harvard T. H. Chan School of Public Health..
NOTES
- 1.Coronavirus Resource Center. Coronavirus COVID-19 global cases [Internet]. Baltimore (MD): Center for Systems Science and Engineering, Johns Hopkins University and Medicine; 2020. [cited 2020 April 1]. Available from: https://coronavirus.jhu.edu/map.html [Google Scholar]
- 2.Boston Public Health Commission. Boston COVID-19 report—Weekly report [Internet]. Boston (MA); 2020. [cited 2020 May 9]. Available from: https://bphc.org/whatwedo/infectious-diseases/Documents/COVID19%20Boston%20Report_2020_Week16.pdf [Google Scholar]
- 3.Wadhera RK, Wadhera P, Gaba P, Figueroa JF, Joynt Maddox KE, Yeh RW. Variation in COVID-19 hospitalizations and deaths across New York City boroughs. JAMA. 2020; 323(21):2192–5. [DOI] [PMC free article] [PubMed] [Google Scholar]
- 4.Massachusetts Department of Public Health. COVID-19 dashboard [Internet]. Boston (MA): Mass.gov; 2020. May [cited 2020 May 10]. Available from: https://www.mass.gov/doc/covid-19-dashboard-may-10-2020/download [Google Scholar]
- 5.An act addressing COVID-19 data collection and disparities in treatment. Bill No. H.4672. Commonwealth of Massachusetts. 191st Session 2020. [Google Scholar]
- 6.Centers for Disease Control and Prevention. Health equity considerations and racial and ethnic minority groups [Internet]. Atlanta (GA): CDC; 2020. [cited 2020 May 5]. Available from: https://www.cdc.gov/coronavirus/2019-ncov/need-extra-precautions/racial-ethnic-minorities.html [Google Scholar]
- 7.Lofquist DA. Multigenerational households: 2009–2011 [Internet]. Washington (DC): US Department of Commerce, Economics and Statistics Administration, US Census Bureau; 2012. Oct [cited 2020 May 10]. (Report No. ACSBR/11–03). Available from: https://www.census.gov/library/publications/2012/acs/acsbr11-03.html [Google Scholar]
- 8.ACLU Massachusetts. Data show COVID-19 is hitting essential workers and people of color hardest [Internet]. Boston (MA): ACLU Massachusetts; 2020. Apr [cited 2020 May 5]. Available from: https://www.aclum.org/en/publications/data-show-covid-19-hitting-essential-workers-and-people-color-hardest [Google Scholar]
- 9.Bernstein H, Gonzalez D, Karpman M, Zuckerman S. One in seven adults in immigrant families reported avoiding public benefit programs in 2018 [Internet]. Washington (DC): Urban Institute; 2019. [cited 2020 May 10]. Available from: https://www.urban.org/research/publication/one-seven-adults-immigrant-families-reported-avoiding-public-benefit-programs-2018#:~:text=About%20one%20in%20seven%20adults,adults%20in%20low%2Dincome%20immigrant [Google Scholar]
- 10.Sommers BD, Allen H, Bhanja A, Blendon RJ, Orav EJ, Epstein AM. Assessment of perceptions of the public charge rule among low-income adults in Texas. JAMA Network Open. 2020;3(7):e2010391. [DOI] [PMC free article] [PubMed] [Google Scholar]
- 11.Kijakazi K COVID-19 racial and health disparities highlight why we need to address structural racism [Internet]. Washington (DC): Urban Institute; 2020. Apr 10 [cited 2020 May 10]. Available from: https://www.urban.org/urban-wire/covid-19-racial-health-disparities-highlight-why-we-need-address-structural-racism [Google Scholar]
- 12.Chowkwanyun M, Reed AL. Racial health disparities and Covid-19—Caution and context. N Engl J Med. 2020;383(3):201–3. [DOI] [PubMed] [Google Scholar]
- 13.Boyd RW, Lindo EG, Weeks LD, McLemore MR. On racism: A new standard for publishing racial health inequities. Health Affairs Blog [blog on the Internet]. 2020. Jul 2 [cited 2020 May 9]. Available from: https://www.healthaffairs.org/do/10.1377/hblog20200630.939347/full/ [Google Scholar]
- 14.Commonwealth of Massachusetts. COVID-19 response reporting [Internet]. Boston (MA): Commonwealth of Massachusetts; 2020. [cited 2020 May 9]. Available from: https://www.mass.gov/info-details/covid-19-response-reporting [Google Scholar]
- 15.Census Bureau. American Community Survey Data [Internet]. Washington DC: Census Bureau; 2020. [cited 2020 May 9]. Available from: https://www.census.gov/programs-surveys/acs/data.html [Google Scholar]
- 16.Commonwealth of Massachusetts. COVID-19: Essential services [Internet]. Boston (MA): Commonwealth of Massachusetts; 2020. Mar [cited 2020 May 19]. Available from: https://www.mass.gov/info-details/covid-19-essential-services [Google Scholar]
- 17.Richardson S, Hirsch JS, Narasimhan M, Crawford JM, McGinn T, Davidson KW, et al. Presenting characteristics, comorbidities, and outcomes among 5700 patients hospitalized with COVID-19 in the New York City area. JAMA. 2020;323(20):2052–9. [DOI] [PMC free article] [PubMed] [Google Scholar]
- 18.Price-Haywood EG, Burton J, Fort D, Seoane L. Hospitalization and mortality among black patients and white patients with Covid-19. N Engl J Med. 2020;382(26):2534–43. [DOI] [PMC free article] [PubMed] [Google Scholar]
- 19.Rader B, Astley CM, Sy KTL, Sewalk K, Hswen Y, Brownstein JS, et al. Geographic access to United States SARS-CoV-2 testing sites highlights healthcare disparities and may bias transmission estimates. J Travel Med. 2020. May 15:taa076. [DOI] [PMC free article] [PubMed] [Google Scholar]
- 20.Figueroa JF, Zheng J, Orav EJ, Epstein AM, Jha AK. Medicare program associated with narrowing hospital readmission disparities between black and white patients. Health Aff (Millwood). 2018;37(4): 654–61. [DOI] [PubMed] [Google Scholar]
- 21.Kaiser Family Foundation. Health insurance coverage of the total population [Internet]. San Francisco (CA): Kaiser Family Foundation; 2020. Jul 22 [cited 2020 July 26, 2020]. (State Health Facts). Available from: https://www.kff.org/other/state-indicator/total-population/?currentTimeframe=0&sortModel=%7B%22colId%22:%22Location%22,%22sort%22:%22asc%22%7D#notes [Google Scholar]
- 22.Kim SR, Vann M, Bronner L, Manthey G. Want a COVID test? It’s much easier to get in wealthier, whiter neighborhoods [Internet]. New York (NY): FiveThirtyEight; 2020. Jul 22 [cited 2020 July 24, 2020]. Available from: https://fivethirtyeight.com/features/white-neighborhoods-have-more-access-to-covid-19-testing-sites/ [Google Scholar]
- 23.To access the appendix, click on the Details tab of the article online.
- 24.Del Real JA. In an immigrant community battling coronavirus, “essential” means “vulnerable.” Washington Post [serial on the Internet]. 2020. May 9 [cited 2020 May 18]. Available from: https://www.washingtonpost.com/national/in-an-immigrant-community-battling-coronavirus-essential-means-vulnerable/2020/05/08/c25cdb4e-8e1e-11ea-a9c0-73b93422d691_story.html [Google Scholar]
- 25.Webb Hooper M, Napoles AM, Perez-Stable EJ. COVID-19 and racial/ethnic disparities. JAMA. 2020;323(24):2466–7. [DOI] [PMC free article] [PubMed] [Google Scholar]
- 26.Yancy CW. COVID-19 and African Americans. JAMA. 2020;323(19): 1891–2. [DOI] [PubMed] [Google Scholar]
- 27.Owen WF Jr., Carmona R, Pomeroy C. Failing another national stress test on health disparities. JAMA. 2020;323(19):1905–6. [DOI] [PubMed] [Google Scholar]
- 28.Immigration and Compliance Briefing: COVID-19 summary of government relief and potential “Public Charge Rule” impact on nonimmigrant and immigrant Visa applications. National Law Review; [serial on the Internet]. 2020. May 12 [cited 2020 May 18]. Available from: https://www.natlawreview.com/article/immigration-and-compliance-briefing-covid-19-summary-government-relief-and-potential [Google Scholar]
- 29.Perreira KM, Yoshikawa H, Oberlander J. A new threat to immigrants’ health—The Public-Charge rule. N Engl J Med. 2018;379(10): 901–3. [DOI] [PubMed] [Google Scholar]
- 30.Page KR, Venkataramani M, Beyrer C, Polk S. Undocumented U.S. immigrants and Covid-19. N Engl J Med. 2020;382:e62. [DOI] [PubMed] [Google Scholar]
- 31.Taylor P, Kochhar R, Cohn D, Passel JS, Velasco G, Motel S, Patten E. Fighting poverty in a tough economy, Americans move in with their relatives [Internet]. Washington (DC): Pew Research Center; 2011. Chapter 3, Demographics of multi-generational households; [cited 2020 May 18]. Available from: https://www.pewsocialtrends.org/2011/10/03/chapter-3-demographics-of-multi-generational-households/#native-born-and-foreign-born [Google Scholar]
- 32.Institute for Women’s Policy Research. Paid sick days access and usage rates vary by race/ethnicity, occupation, and earnings. Washington (DC): IWPR; 2016. Feb. [Google Scholar]
- 33.Sommers BD, Coburn BE. Prescribing paid sick leave—An important tool for primary care in the epidemic. JAMA Health Forum. 2020;324(4):324–5. [DOI] [PubMed] [Google Scholar]
- 34.Gramlich J The gap between the number of blacks and whites in prison is shrinking [Internet]. Washington (DC): Pew Research Center; 2019. Apr 30 [cited 2020 Aug 19]. Available from: https://www.pewresearch.org/fact-tank/2019/04/30/shrinking-gap-between-number-of-blacks-and-whites-in-prison/ [Google Scholar]
- 35.Census Bureau. American Housing Survey [Internet]. Washington (DC): Census Bureau; 2020. [cited 2020 May 15]. Available from: https://www.census.gov/programs-surveys/ahs/data.html [Google Scholar]
- 36.Anderson M Who relies on public transit in the U.S [Internet]. Washington (DC): Pew Research Center; 2016. Apr [cited 2020 May 14]. Available from: https://www.pewresearch.org/fact-tank/2016/04/07/who-relies-on-public-transit-in-the-u-s/ [Google Scholar]
- 37.Chen JT, Waterman PD, Krieger N. COVID-19 and the unequal surge in mortality rates in Massachusetts, by city/town and ZIP Code measures of poverty, household crowing, race/ethnicity, and racialized economic segregation [Internet]. Boston (MA): Harvard Center for Population and Development Studies; 2020. May [cited 2020 May 14]. (Working Paper Vol. 19, No. 2). Available from: https://cdn1.sph.harvard.edu/wp-content/uploads/sites/1266/2020/05/20_jtc_pdw_nk_COVID19_MA-excess-mortality_text_tables_figures_final_0509_with-cover-1.pdf [Google Scholar]
Associated Data
This section collects any data citations, data availability statements, or supplementary materials included in this article.
Supplementary Materials
Supplemental Exhibit 1. Characteristics of Cities/Towns in Massachusetts by Proportion Black or Latino Population
Supplemental Exhibit 2. Proportion Black non-Latino Population and Number of COVID-19 Cases per 100,000 Population Across Massachusetts Cities and Towns
Supplemental Exhibit 3. Proportion Latino Population and Number of COVID-19 Cases per 100,000 Population Across Massachusetts Cities and Towns
Supplemental Exhibit 4. Association of Race/Ethnicity, Demographic, Economic, and Occupational Factors with COVID-19 Case Rates across Massachusetts Cities and Towns