

SUMMARY
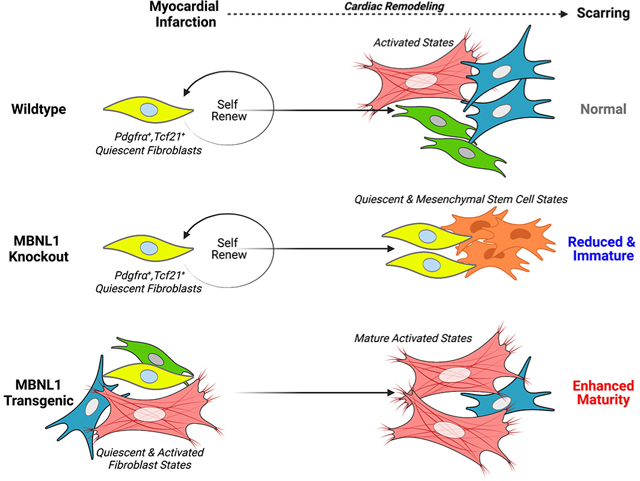
Dynamic fibroblast to myofibroblast state transitions underlie the heart’s fibrotic response. Because transcriptome maturation by Muscleblind-like 1 (MBNL1) promotes differentiated cell states, this study investigated whether tactical control of MBNL1 activity could alter myofibroblast activity and fibrotic outcomes. In healthy mice cardiac fibroblast-specific overexpression of MBNL1 transitioned the fibroblast transcriptome to that of a myofibroblast and after injury promoted myocyte remodeling and scar maturation. Both fibroblast and myofibroblast-specific loss of MBNL1 limited scar production and stabilization, which was ascribed to negligible myofibroblast activity. The combination of MBNL1 deletion and injury caused quiescent fibroblasts to expand and adopt features of cardiac mesenchymal stem cells; whereas, transgenic MBNL1 expression blocked fibroblast proliferation and drove the population into a mature myofibroblast state. These data suggest MBNL1 is a post-transcriptional switch controlling fibroblast state plasticity during cardiac wound healing.
ETOC blurb
Bugg and colleagues demonstrate that following myocardial infarction MBNL1 expression regulates cardiac fibroblast proliferation but also the transition to and maintenance of an activated myofibroblast state, which was associated with altered production and maturation of fibrotic scaring and cardiac muscle remodeling.
Graphical Abstract
INTRODUCTION
Central to heart disease is the replacement of healthy muscle with fibrotic scar. While scarring prevents cardiac rupture following myocardial infarction (MI), it also causes hemodynamic dysfunction and arrhythmias that result in failure (Gianluigi Savarese and Lars H Lund, 2017). Scarring results from dynamic state changes in resident cardiac fibroblasts of the Tcf21 and Pdfgrα lineages that respond to injury by proliferating and then transitioning into myofibroblasts- cell defined by the expression of Periostin (Postn), α-smooth muscle actin (αSMA), and fibrotic extracellular matrix (ECM) (Davis and Molkentin, 2014). Lineage reporter studies suggest myofibroblast states are unstable and reversible following exposure to pro-fibrotic stimuli by yet unresolved molecular mechanisms (Kanisicak et al., 2016).
An understudied control point for these state transitions is transcriptome maturation, which is mediated by RNA binding proteins like Muscleblind-like 1 (MBNL1). MBNL1 modulates transcriptomes by stabilizing, splicing, polyadenylating, and localizing its target mRNAs (Batra et al., 2014; Pascual et al., 2006; Wang et al., 2012). Dysfunctional MBNL1 causes myotonic dystrophy as well as defective erythrocyte and myofibroblast development which was recently linked to dysfunctional wound healing (Cheng et al., 2014; Davis et al., 2015). Indeed, global MBNL1 knockout mice have decreased myofibroblast density and fibrotic scarring following injury (Davis et al., 2015). During the transition of fibroblasts into myofibroblasts transcripts like serum response factor (SRF) and calcineurin (CnA), which are required for this process, are stabilized or alternatively spliced by MBNL1. While together these data suggest MBNL1 plays an essential role in driving profibrotic states and fibrosis in the heart, this has yet to be definitively proven in vivo. Hence this study tested the following hypothesis: MBNL1 post-transcriptionally regulates cardiac fibroblast states underlying fibrotic and myocardial remodeling following injury.
MBNL1 expression was upregulated in Periostin (Postn) lineage traced myofibroblasts after MI and in failing human cardiac fibroblasts. At baseline cardiac fibroblast-specific expression of MBNL1 induced a mature myofibroblast transcriptional identity, which in turn accelerated scar stabilization and maladaptive dilated remodeling with MI. Despite this fate transition, fibrotic scarring was restrained due to an MBNL1-dependent impairment of cardiac fibroblast selfrenewal. During the injury response MBNL1 was required for the induction and maintenance of all activated myofibroblast and epicardial states, which resulted in smaller immature scars. Moreover, coupling MBNL1 deletion with MI redeployed epicardial to mesenchymal transition (EMT) genes and expanded quiescent subtypes especially those with a cardiac mesenchymal stem cell phenotype (Chong et al., 2011; Noseda et al., 2015; White and Chong, 2020).
RESULTS
MBNL1 Is Upregulated In Cardiac Myofibroblasts
Principal component analysis (PCA) of cardiac fibroblast transcriptomes revealed time-dependent shifts in transcriptional space following MI (Figure 1A), matching know transitions between proliferative (days 1–4), myofibroblast (days 4–14), and matrifibrocyte (days 14–21) states during infarct repair (Daseke et al., 2020; Fu et al., 2018; Mouton et al., 2019). Most of the variance between sham and MI was in the first component while time after injury drove shifts in the second (Figure 1A). The associated heatmap (Figure 1B) depicts 5,141 differentially expressed genes where the colored bars and numbers represent Gene Ontology (GO) clusters (Raudvere et al., 2019). Genes involved in normal fibroblast function were downregulated over time (Figure 1C), those associated with the ECM were upregulated (Figure 1D), and cell cycle genes were highly expressed at day 4 but regressed thereafter (Figure 1E).
Figure 1: MBNL1 expression coincides with MI-induced myofibroblast formation.

(A) PCA of cardiac fibroblast transcriptomes from sham and 4, 14, and 28 day MI hearts. (B) Pairwise correlation heatmap of differentially expressed genes between timepoints and color coded by GO clustering: 1 (Salmon) = Biological Processes, 5 (Light Blue) = ECM, and 6 (Pink) = Cell Cycle. (C-E) GO clustering (left) and mean expression ± 95%CI of genes within each cluster across infarct repair (right). (F) Breeding scheme used to derive the myofibroblast lineage reporter mice (PostniCre-mT/mG): (top) PostniCre knockin mice, (bottom) mice expressing a dual fluorescent reporter (mT/mG) from the Rosa26 locus. (G) Timeline of Tam dosing and experimental endpoints. Fold change in (H) Col1a1, (I) Acta2, and (J) Mbnl1 gene expression in cardiac myofibroblasts and quiescent fibroblasts using the ΔΔCt method. Groups are compared to day 4 fibroblasts and were normalized to 18s expression, dots represent biological replicates, n=3–4 mice per group, bars are mean±SEM, ANOVA + Tukey post hoc comparisons. Numbers represent significant pairwise comparisons, p<0.05: 1- 4d Fibroblast, 2- 4d Myofibroblast, 3- 14d Fibroblast, 4- 14d Myofibroblast, 5- 28d Fibroblast, 6- 28d Myofibroblast. Fold change in (K) MBNL1 and (L) ACTA2 gene expression in healthy and failing human fibroblasts using the ΔΔCt method. Dots are biological replicates, n=3, bars are mean±SEM, unpaired t-test, *p<0.05.
To compare gene expression profiles between quiescent and activated cardiac fibroblasts, Postn lineage reporter mice (PostniCre-mT/mG), generated by crossing mice containing a tamoxifen (Tam)-inducible Cre recombinase in the Postn locus (PostniCre) with mice containing a membrane-targeted dual fluorescent reporter in the Rosa26 locus (mT/mG, Figure 1F), were used to segregate both states by fluorescence activated cell sorting (FACS) (Kanisicak et al., 2016). Tam labeling began at surgery and was maintained until each endpoint (Figure 1G). Postn-traced fibroblasts had a significant upregulation of canonical myofibroblast genes like Col1a1 and Acta2 relative to unlabeled quiescent fibroblasts at all time points following MI (Figure 1H–I). Owing to previous work identifying MBNL1 as an activator of myofibroblast differentiation (Davis et al., 2015), Mbnl1 gene expression was also examined and found elevated in Postn-traced myofibroblasts at day 4 and 14 when compared to quiescent fibroblasts (Figure 1J). Also, cardiac fibroblasts from failing human hearts, a tissue source rich in myofibroblasts (Farris et al., 2017, Willems et al., 1994), had a significant upregulation of Mbnl1 and Acta2 (Figure 1K–L) suggesting MBNL1 activity is associated with myofibroblast formation in both humans and mice.
MBNL1 Promotes A Myofibroblast Phenotype
To examine whether MBNL1 overexpression transitions cardiac fibroblasts into myofibroblasts, conditional MBNL1 transgenic (Tg) mice were crossed with a cardiac fibroblast-specific Cre driver that was engineered by knocking a Tam-inducible Cre recombinase into the Tcf21 locus (Tcf21iCre, Figure 2A, Acharya et al., 2011, 2012). Non transgenic (NTG-Tcf21iCre) and Tg-Tcf21iCre littermates were administered Tam for 2-weeks (Figure 2B), and then FACS sorted cardiac fibroblasts were analyzed by RNA sequencing (RNAseq) which identified 420 differentially expressed genes between groups (Figure 2C). Several transcripts upregulated in Tg fibroblasts and previously identified as MBNL1targets were myofibroblast signature genes like Lox, Postn, Fn1, and Ccn4 (Figure S1A, Davis et al., 2015). PCA demonstrated that forced MBNL1 expression transitioned cardiac fibroblasts into the same transcriptional space as NTG fibroblasts from infarcted hearts (Figure 2D). Over the course of infarct repair, 2,803 transcripts were differentially expressed in NTG fibroblasts (Figure S1B). Of those, 270 transcripts were shared between Tg and infarcted NTG fibroblasts with the greatest amount of overlap observed at day 14 in which 10% were in common (Figure S1B). Given that days 4–14 represents the period of maximal myofibroblast differentiation (Fu et al., 2018), these data provided further evidence that MBNL1 expression is sufficient to transition the cardiac fibroblast transcriptome to that of a myofibroblast without an injury. GO term analysis of differentially expressed genes revealed an enrichment in ECM and cardiovascular developmental pathways (Figure 2E). Further examination of this RNAseq data set demonstrated several fundamental myofibroblast transcriptional markers (Acta2, Postn, Fn1, Lox, and Col5a2) were among the top 25 differentially expressed genes in uninjured MBNL1 Tg-Tcf21iCre fibroblasts when compared to NTGs (Figure 2F). Despite Tg fibroblasts having a profibrotic myofibroblast transcriptome (Figure 2D & F), no differences were identified in cardiac fibrosis (Figure 2G–H), αSMA+ myofibroblast number (Figure 2G & I), or cardiac structure (Figure 2J) and function (Figure 2K) when comparing groups. Perhaps an additional stimulus is needed to achieve physiologic myofibroblast phenotypes. Thus, cardiac fibroblasts were isolated from Tam-treated NTG and MBNL1 TgTcf21iCre mice and immunofluorescent imaging used to quantify the number of cardiac fibroblasts with αSMA+ stress fibers, a physiologic marker of differentiated myofibroblasts (Figure 2L, Bretherton et al., 2020). At baseline there was a 2-fold increase in αSMA+ fibroblasts in the Tg versus NTG group suggesting Tg fibroblasts are poised to become bona fide myofibroblasts. Stimulation by transforming growth factor-β (TGFβ) in conjunction with the rigidity of tissue culture plastic did not additively increase αSMA+ fibroblast numbers in the Tg group (Figure 2L). This differed from NTGs that required TGFβ to reach the same percentage of αSMA+ fibroblasts measured in Tgs at baseline (Figure 2L). These results imply additional profibrotic cues like the stiffness are needed to fully transform MBNL1 Tg fibroblasts to a physiologic myofibroblast state. Previously, we demonstrated that TGFβ-mediated induction of myofibroblast genes requires serum response factor (SRF), a transcript stabilized by MBNL1 binding to its 3’ UTR (Davis et al., 2012, 2015). Acute shRNA knockdown of SRF blocked TGFβ-mediated myofibroblast differentiation in both MBNL1 Tg-Tcf21iCre and NTG-Tcf21iCre cardiac fibroblasts demonstrating that SRF transcriptional activity acts downstream of MBNL1.
Figure 2: Cardiac fibroblast specific MBNL1 overexpression induces a myofibroblast phenotype.

(A) Breeding scheme for generating MBNL1 Tg-Tcf21iCre mice: (top) Tcf21iCre mice, (bottom) conditional MBNL1 transgenic mice (Tg-Tcf21iCre). (B) Tam dosing timeline and experimental endpoints. (C) Scatterplot of differentially expressed cardiac fibroblast genes. NTG = Non transgenic, purple dots are significantly upregulated genes and green dots are significantly down regulated genes in Tg-Tcf21iCre. (D) PCA of sham and injured Tg-Tcf21iCre and NTG cardiac fibroblasts. (E) Functional clustering of differentially expressed cardiac fibroblast genes between Tg-Tcf21iCre and NTG at baseline. Size of circle = number of differentially expressed (DE) genes per cluster. (F) Heatmap of the top 14 differentially expressed myofibroblast genes at baseline. (G) Sirius Red/Fast Green-stained (left) and immunofluorescent imaging of myofibroblasts (right) in myocardial sections following 14 days of Tam. (H) Quantification of cardiac fibrosis identified in (G, left). Dots are biological replicates, bars are mean±SEM, unpaired t-tests, p=0.3551. (I) Quantification of myofibroblast density from (G, right). Myofibroblasts are αSMA (red) positive and negative for the endothelial marker isolectinB4 (green). Nuclei are blue. Scalebar = 50μm. Dots are biological replicates, Tg-Tcf21iCre (n=6), NTG (n=5), bars are mean±SEM, unpaired ttests, p=0.1730. Quantification of (J) left ventricular diastolic diameter, p=0.0828 and (K) fractional shortening, p=0.8372. Dots are biological replicates, Tg-Tcf21iCre (n=5), NTG (n=7), bars represent mean±SEM, unpaired t-tests. (L) Quantification of the percentage of Tg-Tcf21iCre and NTG cardiac fibroblasts treated with vehicle, TGFβ, or adenovirally transduced with SRF shRNA that are αSMA+ mice. Dots are biological replicates (n=18), bars are mean±SEM, ANOVA statistical test with Tukey post hoc comparisons, p<0.05: 1- NTG Vehicle, 2- Tg-Cre Vehicle, 3- NTG TGFβ, 4- Tg-Cre TGFβ, 5- NTG shSRF, 6- Tg-Cre shSRF. See also Figure S1.
MBNL1 Blocks MI-Induced Cardiac Fibroblast Proliferation And Enhances Scar Stability
To bring out the fibrotic phenotype, MBNL1 Tg-Tcf21iCre and NTG mice were subjected to MI following 2-weeks of Tam (Figure 3A). MI significantly upregulated several collagen genes (Col1a1, Col1a2, Col3a1, Col5a1, and Col5a2, Figure 3B) in cardiac fibroblasts from Tg relative to NTG hearts matching a CLIPseq study that showed MBNL1 localizes mRNAs for secreted factors like collagens and fibronectins (Wang et al., 2012). Immunocytochemistry with Col3a1 and Col5a1 antibodies was performed on Tg and NTG myocardial sections to verify these changes. No differences were observed in Col3a1 staining, but Col5a1 was slightly elevated in MBNL1 TgTcf21iCre hearts (Figure S2A–C). Similarly, myofibroblast density and overall fibrosis were not different between genotypes (Figure 3C–F). Since more mature myofibroblast fates stabilize fibrotic ECM (Fu et al., 2018), collagen birefringence was measured in Sirius Red/Fast Green stained myocardial sections, which also showed no differences in the proportion of mature red versus immature green collagen fibers 2 weeks following MI (Figure 3E & G). Scar morphology was also analyzed by second harmonic generation (SHG) in decellularized mouse hearts. Here no differences in collagen fiber number, alignment, or width were detected (Figure S2D–F), although collagen fibers in the border zone of Tg hearts were significantly shorter (Figure 3H). The biomechanical ramifications of short collagen fibers are unclear, but in Tg mice fractional shortening dropped by 10% along with slightly more ventricular dilation (Figure 3I–J). Alternatively, this depressed systolic function could be from signaling between Tg fibroblasts and myocytes that initiate cell death or contractile dysfunction. TUNEL staining of myocytes colabeled with αActinin showed no differences in apoptosis between genotypes (Figure 3K), but infarcted Tg myocytes had more robust contractile function and faster relaxation when compared to NTGs (Figure S3A–D). Specifically, Tg myocytes produced larger and faster contractions (Figure 3LM) with a more severe dilated morphology characterized by increased cell length and decreased width (Figure 3N–O). Because sarcomere lengths were not different between groups (Figure S3E), the severe myocyte dilation was ascribed to serial sarcomere addition, which likely drives the heightened function of Tg myocytes under unloaded conditions.
Figure 3: Overexpression of MBNL1 in cardiac fibroblasts prevents MI-dependent fibroblast proliferation.

(A) Timeline of Tam dosing, MI surgery, and experimental endpoints. (B) Volcano plot of differentially expressed collagens 7 days post MI. Yellow dots are upregulated genes and purple dots are downregulated genes in Tg-Tcf21iCre cardiac fibroblasts. (C) Immunofluorescent imaging and (D) quantification of myofibroblasts in myocardial sections 14 days following MI. Myofibroblasts are αSMA (red) positive and negative for the endothelial marker isolectinB4 (green). Nuclei are stained blue. Arrows show αSMA+IB4− cells. Scalebar = 50μm. Dots are biological replicates, Tg-Tcf21iCre (n=10), NTG (n=9), bars are mean±SEM, unpaired t-tests, p=0.3791. (E) Brightfield (top) and 40x polarized light (bottom, Scalebar = 20 μm) images and (F) quantification of fibrosis and (G) collagen birefringence in Sirius Red/Fast Green-stained myocardial sections. Dots are biological replicates, Tg-Tcf21iCre (n=10), NTG (n=9), unpaired ttests, p<0.05. (H) Quantification of collagen fiber length by second harmonic generation in decellularized hearts 30 days post MI. Dots are biological replicates, Tg-Tcf21iCre (n=3), NTG (n=4), bars are mean±SEM, t-tests, *p<0.05. Quantification of left ventricular (I) fractional shortening, **p<0.01, and (J) diastolic diameter, p=0.0828. Dots are biological replicates, TgTcf21iCre (n=7), NTG (n=8), bars are mean±SEM, unpaired t-tests. (K) Quantification of apoptotic myocytes (αActinin+ Tunel+) as a percentage of total in cardiac sections 2 days post MI. Dots are biological replicates, Tg-Tcf21iCre (n=7), NTG (n=6), bars are mean±SEM, and unpaired t-tests, p=0.2450. Isolated myocyte (L) fractional shortening, (M) rate of contraction, (N) length, and (O) width measured 14 days post MI. Dots are individual myocytes (30–40/mouse), Tg-Tcf21iCre (n=3), NTG (n=3) mice, bars are mean±SEM, unpaired t-tests, ****p<0.0001, ***p<0.0001, **p<0.01. (P) Timeline of Tam dosing scheme for 3 months of recovery from MI. (Q) Images and (R) quantification of collagen birefringence in Sirius Red/Fast Green-stained myocardial sections from Tg-Tcf21iCre (n=4) and NTG (n=4). Scalebar= 20 μm. Bars are mean±SEM, unpaired t-test: Red/White fibers p=0.0062, Red/Orange fibers p=0.0670, Green fibers p=0.0447. (S) Quantification of apoptotic fibroblasts (PDGFRα+ Tunel+) as a percentage of total in cardiac sections 2 days post MI. Dots are biological replicates, Tg-Tcf21iCre (n=7), NTG (n=6), bars are mean±SEM, unpaired t-tests, p=0.7797. (T) Immunofluorescent staining and (U) quantification of proliferating fibroblasts (PDGFRα+,EdU+) 2 days post MI in Tg-Tcf21iCre (n=8) and NTG (n=7) hearts. PDGFRα (green), EdU (pink), Nuclei (blue), and arrows show PDGFRα+,EdU+ fibroblasts. Scalebar = 50μm. Dots are biological replicates, bars are mean±SEM, unpaired t-tests,**p<0.01. (V) Quantification of in vitro fibroblast proliferation in low serum. Dots are technical replicates, Tg Tcf21iCre (n=11), NTG (n=11). Bars are mean±SEM, unpaired t-test, ***p<0.001. See also Figure S2–S4.
Aging MBNL1 Tg-Tcf21iCre mice promotes interstitial fibrosis in the absence of injury (Davis et al., 2015), and so additional cohorts of Tg and NTG mice were subjected to MI and examined 3 months later when the infarct scar has fully remodeled (Figure 3P). While the total area of fibrotic scarring, myofibroblast density, and myocardial remodeling were indistinguishable between genotypes (Figure S4A–F), scars in Tg mice were more mature as indicated by the greater percentage of Red/White collagen fibers detected by collagen birefringence imaging (Figure 3Q–R). This enhanced scar maturation in MBNL1 Tg-Tcf21iCre mice is consistent with the increased expression of matrix maturation factors like Lox and Runx1, which were overexpressed in Tg cardiac fibroblasts at baseline (Figure 2F). Possible explanations for the modest change in myofibroblast number and quantity of fibrosis after MI is that forced expression of MBNL1 limits fibroblast number by inducing apoptosis or inhibiting the proliferative phase of wound healing. Two days after MI, TUNEL staining of cardiac fibroblasts colabeled with PDGFRα detected no differences in the amount of fibroblast cell death between groups (Figure 3S). To measure proliferation mice were given 5-ethynyl-2’-deoxyuridine (EdU) over the 2 days following injury, and then proliferating fibroblasts were identified in myocardial sections by measuring the number of PDGFRα+,EdU+ cells (Figure 3T–U). Tg mice had 20% fewer proliferating PDGFRα+,EdU+ cardiac fibroblasts relative to NTGs (Figure 3U). Proliferation was also measured in vitro under differentiation conditions (Figure 3V, 2% Serum), and similar to the in vivo findings, Tg cardiac fibroblasts had significantly reduced proliferative capacity when compared to NTGs (Figure 3V). Moreover, RNAseq analysis showed that positive cell cycle regulators like Ccnb2, Ccna2, Birc5, and Kif23 were all downregulated in Tg cardiac fibroblasts 4 days after MI while cell cycle inhibitors like Cxcl1 and Cdkn1a were significantly upregulated (Figure S4G). Collectively, these data suggest decreased fibroblast proliferation in MBNL1 Tg-Tcf21iCre mice prevented additive effects of MBNL1 expression and injury on myofibroblast density and scarring.
Loss Of MBNL1 Blocks Myofibroblast Differentiation, Fibrosis, And Scar Maturation
Conditional MBNL1 knockouts (MBNL1Fl/Fl) were crossed with Tcf21iCre mice to examine the requirement for MBNL1 in cardiac fibroblast to myofibroblast state transitions (Figure 4A). Western blotting of TGFβ-treated cardiac fibroblasts show robust deletion of MBNL1 with Tam induction in MBNL1Fl/Fl-Tcf21iCre mice (Fl-Tcf21iCre) when compared to MBNL1Fl/Fl littermates (Figure 4B). At baseline cardiac fibroblast-specific deletion of MBNL1 did not affect heart function (data not shown), but after MI Fl-Tcf21iCre mice were protected from ventricular dilation (Figure 4C–D). Neither genotype exhibited differences in systolic function by echocardiography (Figure 4E), but speckle tracking of global longitudinal strain (GLS) revealed Fl-Tcf21iCre mice had improved systolic function (Figure 4F). Fibrosis and myofibroblast density were reduced by 40% in Fl-Tcf21iCre versus MBNL1Fl/Fl controls demonstrating MBNL1 is required for myofibroblast formation and fibrosis (Figure 4G–J). Col3a1 and Col5a1 were also examined in serial sections, and no differences in Col3a1 were detected, but Col5a1 was significantly downregulated in FlTcf21iCre hearts. (Figure S5A–C). Collagen fiber maturity was also examined by imaging collagen birefringence, which showed the Fl-Tcf21iCre ECM has a great proportion of immature green collagen fibers relative to MBNL1Fl/Fl (Figure 4K–L). Collagen fiber width and alignment were also decreased in Fl-Tcf21iCre hearts (Figure 4M–N), which is indicative of an immature and unstable scar (JW et al., 1997; Quinn et al., 2016; Richardson et al., 2015). These data coincide with downregulated ECM maturation genes like Postn, Col1a1, Col1a2, Comp, Loxl3, Lox, and Runx1 in FlTcf21iCre cardiac fibroblasts (Figure S5D). Surprisingly, there were no differences in cardiac rupture between genotypes. Fl-Tcf21iCre cardiac fibroblasts were examined in vitro for whether fibroblast differentiation defects underlie the poor production and maturation of the fibrotic scar. On average 73%±3.46 of MBNL1Fl/Fl cardiac fibroblasts developed αSMA+ stress fibers when treated with TGFβ versus Fl-Tcf21iCre which were refractory to the differentiation cue (Figure S5EF). Given MBNL1 stabilizes SRF (Davis et al., 2015), it was reasoned that expressing a stabilized SRF cDNA should rescue TGFβ-mediated myofibroblast differentiation in Fl-Tcf21iCre cardiac fibroblasts. Hence, MBNL1Fl/Fl and Fl-Tcf21iCre cardiac fibroblasts were adenovirally transduced with SRF (AdSRF), which restored the ability of Fl-Tcf21iCre fibroblasts to transition into myofibroblasts with TGFβ (Figure S5E–F). Similar results were achieved with adenoviral reexpression of MBNL1 (AdMBNL1, Figure S5E–F), indicating these cells are still competent to undergo programmed state transitions provided MBNL1 and its downstream regulatory targets are functional. Another hallmark of myofibroblasts is contractile function, which is needed to close wounds and measured using collagen gel contraction assays (Davis and Molkentin, 2014). Here MBNL1Fl/Fl or Fl-Tcf21iCre cardiac fibroblasts were seeded in collagen gels, and gel area measured to estimate cell contractility. Forty-eight hours after seeding MBNL1Fl/Fl gels contracted to 80% of the original size versus 96% in Fl-Tcf21iCre gels (Figure S5G–H). TGFβ treatment elicited extensive contraction of MBNL1Fl/Fl gels, but not in those containing Fl-Tcf21iCre fibroblasts (Figure S5G–H). Again, adenoviral re-expression of MBNL1 (AdMBNL1) or expression of a constitutively active splice variant of calcineurin (AdΔCnA) that is alternatively spliced by MBNL1 (Davis et al., 2012, 2015) partially restored contraction in Fl-Tcf21iCre cardiac fibroblasts providing functional evidence of MBNL1’s essential role in myofibroblast state transitions (Figure S5G–H).
Figure 4: MBNL1 is required for cardiac fibroblast state transitions and fibrotic scarring.

(A) Breeding scheme for cardiac fibroblast-specific MBNL1 knockout mice (MBNL1Fl/Fl-Tcf21iCre): (top) Tg-Tcf21iCre mice crossed with (bottom) conditional Mbnl1 knockout mice (MBNL1Fl/Fl). (B) Western blot of MBNL1 expression from Tam-treated MBNL1Fl/Fl-Tcf21iCre and MBNL1Fl/Fl cardiac fibroblasts ± recombinant TGFβ. GAPDH was the loading control. (C) Timeline of Tam dosing, MI, and experimental endpoints. Quantification of left ventricular (D) diastolic diameter, **p<0.01, (E) fractional shortening, p=0.7499, and (F) global longitudinal strain (GLS) *p<0.05, **p<0.01, ***p<0.001, at 14 days post MI. Dots are biological replicates, MBNL1Fl/Fl-Tcf21iCre (n=8), MBNL1Fl/Fl (n=8), bars are mean±SEM, unpaired t-tests for D-E and 2-way ANOVA for F. (G) Images and (H) quantification of Sirius Red/Fast Green-stained myocardial sections. Dots are biological replicates, bars are mean±SEM, unpaired t-tests,***p<0.001. (I) Immunofluorescent imaging and (J) quantification of myofibroblasts in the border zone of myocardial sections 14 days post MI. Myofibroblasts are αSMA (red) positive and negative for the endothelial marker isolectinB4 (green). Nuclei are blue. Arrows show αSMA+IB4− cells. Scalebar = 50μm. Dots are biological replicates, MBNL1Fl/Fl-Tcf21iCre (n=8), MBNL1Fl/Fl (n=8), bars are mean±SEM, unpaired t-tests, ****p<0.0001. (K) Images and (L) quantification of collagen birefringence in myocardial sections from MBNL1Fl/Fl-Tcf21iCre (n=4) and MBNL1Fl/Fl (n=4) mice. Scalebar = 20 μm. Bars are mean±SEM, unpaired t-tests, **p<0.01. Quantification of (M) collagen fiber width and (N) alignment from second harmonic generation of decellularized hearts 30 days post MI. Dots are biological replicates, MBNL1Fl/Fl-Tcf21iCre (n=4), MBNL1Fl/Fl (n=4), bars are mean±SEM, unpaired t-tests, *p<0.05. (O) Immunofluorescent imaging and (P) quantification of proliferating fibroblasts (PDGFRα+,EdU+) in myocardial sections from MBNL1Fl/Fl-Tcf21iCre (Sham n=3, MI n=6) and MBNL1Fl/Fl (Sham n=3, MI n=9) mice 2 days post MI. PDGFRα+ (green), EdU+ (pink), Nuclei (blue). Arrows show PDGFRα+,EdU+ cells. Scalebar = 50μm. Dots are biological replicates, bars are mean±SEM, unpaired t-tests,*p<0.05. (Q) Quantification of in vitro cardiac fibroblast proliferation in low serum. Dots are biological replicates (n=7 per genotype), bars are mean±SEM, unpaired ttest, *p<0.05. (R) Gene expression (FPKM, fragments per kilobase of transcript) of Cdkn1a in MBNL1Fl/Fl-Tcf21iCre (n=3) and MBNL1Fl/Fl(n=4) cardiac fibroblasts 4 days post MI. Dots are biological replicates, bars are mean±SEM, unpaired t-test, ***p<0.001. (S) Expression of Cdkn1a transcripts immunoprecipitated by MBNL1 in cardiac fibroblasts. Dots are biological replicates, bars are mean±SEM, unpaired t-test, ****p<0.0001 (T) Expression of EMT and cardiac fibroblast specification genes in MBNL1Fl/Fl Tcf21iCre (n=4) and MBNL1Fl/Fl (n=6) cardiac fibroblasts 4 days post MI. Bars are mean±SEM, p<0.05. (U) Immunofluorescent imaging of epicardial markers SLUG (Left, pink), TBX18 (Middle, pink), and WT1 (Right, pink) colocalized with PGFRα+ (green) in myocardial sections 7 days post MI. Scalebar = 24.2μm. See also Figure S5.
Infarcted MBNL1-Null Fibroblasts Redeploy Developmental Signals And Self-Renew
The lack of myofibroblasts in Fl-Tcf21iCre myocardial sections following MI could be due to both proliferation and differentiation defects, as MBNL1 overexpression was found to block MI-induced cardiac fibroblast proliferation (Figure 3T–V). MBNL1Fl/Fl and Fl-Tcf21iCre mice were subjected to MI, and EdU used to label proliferating cells for 2 days following injury. In Fl-Tcf21iCre hearts 45% of the total PDGFRα+ fibroblast population was EdU+ versus 31% in MBNL1Fl/Fl controls (Figure 4O–P). This result was consistent with heightened in vitro proliferation capacity, increased expression of positive cell cycle regulators Cdk6 and Ccnd1, and decreased expression of potent cell cycle inhibitors Cdkn1a and Cdkn2aip in Fl-Tcf21iCre cardiac fibroblasts 4 days after MI (Figure 4Q–R & Figure S5I–K). Because there was antithetical expression of Cdkn1a in MBNL1 Tg-Tcf21iCre mice (Figure S4G), RNA immunoprecipitation was used to confirm that MBNL1 binds Cdkn1a in adult cardiac fibroblasts (Figure 4S) matching previous results obtained in MEFs with MBNL1 overexpression (Davis et al., 2015).
Since heightened proliferation is often associated with dedifferentiation (Daseke et al., 2020; Fu et al., 2018; Mouton et al., 2019), RNAseq analysis of cardiac fibroblast transcriptomes was used to examine whether MBNL1 deletion facilitates dedifferentiation in response to injury. Relative to MBNL1Fl/Fl, Fl-Tcf21iCre fibroblasts had downregulated cardiac fibroblast specification transcripts including: Sox9, Tcf21, Ets2, Tbx20, Tgfβ3, Adamts1 and 17 (Figure 4T–U). Yet other positive drivers of EMT like Zeb1 and Slug as well as epicardial development genes like Aldh1a2, Aldh1a1, and Tbx18 were also upregulated in Fl-Tcf21iCre cardiac fibroblasts (Gise and Pu, 2012; von Gise et al., 2011; Huang et al., 2012; Xavier-Neto et al., 2000). Indeed, a greater number of PDGFRα+ cardiac fibroblasts colocalized with Slug and Tbx18 but not WT1 in Fl-Tcf21iCre myocardial sections (Figure 4T–U). The combination of re-expressing early fibroblast developmental genes and enhanced proliferation suggests MBNL1 null cardiac fibroblasts are more plastic than wildtype and they may promote repair, as similar changes in fibroblast gene expression occur during cardiac regeneration (Cao and Poss, 2018).
MBNL1 Restricts Cardiac Fibroblast Plasticity And Population Diversity
The altered expression of EMT regulatory genes left open whether these signals were due to MBNL1’s role in fibroblast fate or reactivation of the epicardium. To examine this question single cell RNAseq (scRNAseq) was performed on cardiac fibroblasts isolated from sham and infarcted hearts of NTG, Fl-Tcf21iCre, and Tg mice (Figure 5A). Transcriptional profiles of 20,814 total cells were captured after quality control filtering. Thirteen different fibroblast substates were identified by hierarchical clustering based on differential gene expression with each of the clusters expressing the canonical fibroblast markers Col1a1 and Col3a1 albeit with varying levels of expression (Figure 5B, Figure S6A–B). Each cluster was labeled using preestablished nomenclature (Farbehi et al., 2019; Skelly et al., 2018) and 2 large clusters, quiescent and myofibroblast, were identified. Within the quiescent cluster there were 9 substates (F-SH1–2, FSL1–2, F-TRANS, F-EPI, F-EPI/MES, F-WNTx, F-THSD7) with the myofibroblast cluster having 4 (MYO-1–2, F-ACT, MYO-EPI, Figure 5B–C). These larger clusters were defined by the enhanced expression of quiescent markers Pdgfra and Tcf21 (Figure S6C–D) versus myofibroblast genes like Col1a1, Postn, and Acta2 (Figure S6A,E–F). Epicardial clusters were also identified (F-Epi, F-EPI/MES, MYO-EPI, Figure 5B–C) that expressed transcriptional markers associated with quiescent epicardium (F-Epi), mesothelial and epicardial states (F-Epi-MES), and activated epicardial states (MYO-EPI). Based on the bulk RNAseq analysis in Figure 4T, we expected a unique fibroblast substate with an epicardial progenitor identity or an expansion of epicardial cells in the MBNL1 null population, but instead epicardial and epicardial/mesothelial cell clusters were completely absent in the Fl-Tcf21iCre cardiac fibroblast population (Figure 5DE & Figure S6G–H). These epicardial populations were expanded in NTGs, which we believe represents the normal epicardial reactivation and expansion that occurs between days 1–5 following MI (Quijada et al., 2020). To better understand the changes in epicardial subclusters and altered EMT gene expression in MBNL1 null cardiac fibroblasts, differential gene expression was analyzed for fibroblast clusters that expanded solely in Fl-Tcf21iCre mice versus NTGs in response MI (Figure S6H). Genes that defined these clusters were subjected to GO analysis, which produced a gene list enriched for the biological processes of mesenchymal stem cell differentiation (Figure S6I). Quiescent fibroblast clusters that were highly expressing both Sca1 (Ly6a) and Pdgfrα (F-SH2 & F-SH1) were significantly expanded in Fl-Tcf21iCre mice (Figure S6JK). The tandem features of heighted proliferation capacity (Figure 4O–P) and expression of both Sca1 and Pdgfrα(Figure S6J–K) are hallmarks of cardiac mesenchymal stem cells (Chong et al., 2011; Noseda et al., 2015; White and Chong, 2020). GO analysis also showed these clusters were enriched for factors that differentiate into other mesenchymal lineages like melanocytes, connective tissue, and coronary vasculature (Figure S6I) suggesting the Fl-Tcf21iCre quiescent fibroblast population becomes enriched for mesenchymal stem cell properties upon injury. Notably, these cells do not have the identity of conventional bone marrow derived mesenchymal stem cells but rather have markers and behaviors akin to those from the heart which are prorepair (Chong et al., 2011; Noseda et al., 2015; White and Chong, 2020).
Figure 5: scRNAseq reveals MBNL1 functions as a post-transcriptional switch between fibroblast and myofibroblast states.

(A) Timeline of MI injury, Tam dosing, and experimental endpoints. (B) UMAP dimensionality reduction plot of all 20,814 sequenced cardiac fibroblasts independent of genotypes/experimental condition and clustered by differential gene expression. Each colored dot represents a unique cell state. (C) Dot plot of the top 10 significantly expressed genes defining each cluster. UMAP dimensionality reduction plots divided by experimental condition (D) Sham and (E) MI and genotype: NTG/Sham (n=2), NTG/MI (n=2), MBNL1Fl/Fl-Tcf21iCre/Sham (n=2), MBNL1Fl/FlTcf21iCre/MI (n=2), and MBNL1Tg-Tcf21iCre/Sham (n=2), MBNL1Tg-Tcf21iCre/MI (n=2). See also Figure S6.
Pseudotime analysis was performed using a priori knowledge of fibroblast states to anchor pseudotime in F-SH2 and F-EPI based on expression of more immature/quiescent factors. Pseudotemporal ordering revealed quiescent cells transit through F-ACT, MYO-EPI, and MYO-2 states on their lineage trajectory to the most mature myofibroblast state MYO-1 (Figure 5C, Figure S6L–M). Relative to NTGs, over 40% MBNL1 Tg cardiac fibroblasts are found in the larger activated myofibroblast cluster (MYO-1, MYO-2 and F-ACT) with the bulk of cells residing in the most mature MYO-1 state in the sham condition (Figure 5D–E, Figure S6G), which is described by increased expression of fibrotic ECM and maturation genes like Mgp, Sparc, Mfap5, Cst3, Bgn, Postn and Cilp (Figure 5C, Figure S6N–O). Many of these transcripts such as, Mgp (bound and upregulated), Cst3 (bound, undefined regulation), Bgn (bound and spliced) and Postn (bound, undefined regulation) are directly bound and regulated by MBNL1 (Figure 5C, Figure S1A, 6NO). Folowing MI, the MBNL1 transgene transitioned 60% of cardiac fibroblasts to the mature MYO-1 state with a very small fraction residing in myofibroblast intermediates (Figure 5D–E, Figure S6G–H). This contrasts with NTG cardiac fibroblasts, which primarily shift to an intermediate activated state (F-ACT) following MI (Figure 5D–E, Figure S6G–H). Moreover, in the MI condition NTGs still retain a quiescent population, which is nearly depleted in MBNL1 TgTcf21iCre mice (Figure 5D–E, Figure S6G–H). This suggests MBNL1 in tandem with injury pushes quiescent fibroblasts into the most mature myofibroblast state. The effects of MBNL1 loss of function (Fl-Tcf21iCre) following MI are even more striking as the entire cardiac fibroblast population remain stuck in quiescence (Figure 5D–E, Figure S6G–H). In addition, MI triggered an quiescent substate expansion in Fl-Tcf21iCre hearts (Figure 5D–E, Figure S6G–H), which may be due to the enhanced proliferation and/or differentiation defects (Figure 4). Comparisons of Tg and null cardiac fibroblasts by both scRNAseq and bulk RNAseq data sets (Figure S4G, 5D, 6I & N–O) show that gain and loss of MBNL1 function elicited diametrically opposed fate decisions.
MBNL1 Maintains The Myofibroblast State
MBNL1’s role in inducing cardiac fibroblast state transitions is becoming clear, but whether it’s essential for maintaining myofibroblast activity is unknown. To address this, a PostniCre driver excised MBNL1 from activated myofibroblasts in MBNL1Fl/Fl-PostniCre mice (Figure 6A) with a 10 day treatment of Tam beginning 2 days after injury (Figure 6B). Unlike Fl-Tcf21iCre mice, MBNL1Fl/Fl-PostniCre mice had a slight but insignificant reduction in αSMA+ myofibroblasts number (Figure 6C–D & 4I–J), yet still had a significant decrease in the overall fibrotic response (Fig 6EF). Curiously, MBNL1Fl/Fl-PostniCre mice had no change in ECM maturity when compared to MBNL1Fl/Fl littermates (Figure 6G–H, Figure 4K–L), although differences in scar maturity typically occur later in repair. MBNL1Fl/Fl-PostniCre had preserved systolic function and were protected from adverse myocardial remodeling (Figure 6I–K). These data demonstrated that myofibroblast-restricted excision of MBNL1 functionally protects against MI-induced fibrotic and maladaptive cardiac remodeling.
Figure 6: Myofibroblast specific expression of MBNL1 is required for fibrotic scarring.

(A) Breeding scheme for cardiac myofibroblast-specific MBNL1 knockout mice (MBNL1Fl/FlPostniCre): (top) PostniCre knockin mice, (bottom) conditional Mbnl1 knockout mice (MBNL1Fl/Fl). (B) Timeline of Tam dosing, MI, and experimental endopoints. (C) Immunofluorescent imaging and (D) quantification of myofibroblasts in myocardial sections from mice 10 days following MI. Myofibroblasts are αSMA (red) positive and negative for the endothelial marker isolectinB4 (green). Nuclei are blue. Arrows show αSMA+IB4− cells. Scalebar = 25μm. Dots are biological replicates, MBNL1Fl/FlPostniCre (n=10), MBNL1Fl/Fl (n=8), bars are mean±SEM, unpaired t-tests, p=0.3734. (E) Images and (F) quantification of fibrosis from Sirius Red/Fast Green-stained myocardial sections. Dots are biological replicates, bars are mean±SEM, unpaired ttests,***p<0.001. (G) Images and (H) quantification of collagen birefringence in MBNL1Fl/FlTcf21iCre (n=4), MBNL1Fl/Fl (n=4) myocardial sections. Scalebar = 20 μm. Bars are mean±SEM, unpaired t-tests, p=0.7574. Quantification of left ventricular (I) fractional shortening, (J) anterior wall thickness, and (K) diastolic diameter 10 days post MI. Dots are biological replicates, MBNL1Fl/Fl-PostniCre (n=10) and MBNL1Fl/Fl (n=8) mice, bars are mean±SEM, unpaired t-tests, **p<0.01.
Stabilization Of Sox9 Rescues Myofibroblast Differentiation In MBNL1 Null Cardiac Fibroblasts.
To identify MBNL1-regulated transcripts driving changes in cardiac fibroblast state following MI, 3 data sets were mined for: factors bound by MBNL1, inducers of myofibroblast differentiation, and transcripts downregulated in Fl-Tcf21iCre cardiac fibroblasts after MI (Figure S1, Davis et al., 2015). The only gene meeting all 3 criteria was Sox9- a transcription factor essential for EMT and myofibroblast formation (Figure 7A, Lacraz et al., 2017; Scharf et al., 2019). Sox9 expression increased 8.5-fold and remained elevated in wildtype Postn+ myofibroblasts relative to quiescent fibroblasts following injury (Figure 7B). By contrast the percentage of Sox9+,PDGFRα+ fibroblasts was reduced 2.5 fold in infarcted Fl-Tcf21iCre hearts (Figure 7C–D). Transfection of Sox9 into MBNL1Fl/Fl and Fl-Tcf21iCre cardiac fibroblasts was sufficient to induce αSMA+ myofibroblasts independent of genotype in vitro, demonstrating Sox9 alone promotes a myofibroblast state and that it can rescue differentiation defects in MBNL1 null fibroblasts (Figure 7E–F). Previous studies have demonstrated that MBNL1 binds and regulates Sox9 (Davis et al., 2015; Girardot et al., 2018), and these findings were confirmed in cardiac fibroblasts by RNA immunoprecipitation assay (Figure 7G). As Sox9 is upregulated in conjunction with MBNL1 expression (Figure 7B), it was hypothesized that MBNL1 stabilizes Sox9 transcripts. To test this hypothesis mRNA decay assays were performed in MBNL1Fl/Fl and Fl-Tcf21iCre cardiac fibroblasts. Here Sox9 and Mbnl1 expression was measured as a function of exposure to the transcription inhibitor actinomycin D (Figure 7H–I). At time 0, Fl-Tcf21iCre fibroblasts had 53% less Sox9 expression relative to MBNL1Fl/Fl controls as well as faster transcript decay (Figure 7H). Adenoviral transduction of MBNL1 (AdMBNL1) rescued Sox9 expression which slowed actinomycin D-mediated decay rate in both genotypes (Figure 7H). These data suggest that following MI MBNL1 stabilizes Sox9 transcripts in cardiac fibroblasts to promote myofibroblast state transitions.
Figure 7: MBNL1 stabilization of Sox9 promotes myofibroblast formation.

(A) Venn diagram showing the overlap between MBNL1 regulated transcripts (pink oval), positive inducers of myofibroblast differentiation (purple oval) (Davis et al., 2015), and genes down- regulated in MBNL1Fl/Fl-Tcf21iCre cardiac fibroblasts (yellow oval). (B) Fold change in Sox9 gene expression in cardiac myofibroblasts and quiescent fibroblasts relative to day 4 quiescent fibroblasts by the ΔΔCt method. 18s was used for normalization. Dots are biological replicates, n=3 mice per group, bars are mean±SEM, ANOVA statistical test with Tukey post hoc comparisons, numbers represent significant pairwise comparisons at p<0.05: 1- 4d Fibroblast, 2- 4d Myofibroblast, 3- 14d Fibroblast, 4- 14d Myofibroblast, 5- 28d Fibroblast, 6- 28d Myofibroblast. (C) Immunofluorescent imaging and (D) quantification of Sox9+,PDFRα+ fibroblasts in myocardial sections from MBNL1Fl/Fl-Tcf21iCre (n=3), MBNL1Fl/Fl (n=3) mice 14 days following MI. Data are the percentage of PDFRα+ (green) fibroblasts costained with Sox9 (magenta). Nuclei are blue. White arrows show PDGFRα+,Sox9+ cells. Scalebar = 50μm. Dots are biological replicates, bars are mean±SEM, unpaired t-tests,****p<0.0001. (E) Immunofluorescent images and (F) quantification of αSMA+ (red) in MBNL1Fl/Fl-Tcf21iCre and MBNL1Fl/Fl cardiac fibroblasts transfected with Sox9 I plasmid. Dots are biological replicates, n=5 per group, bars are mean±SEM, ANOVA statistical test with Tukey post hoc comparisons, ****p<0.0001. (G) Expression of Sox9 transcripts immunoprecipitated by MBNL1 in fibroblasts overexpressing MBNL1. Dots represent biological replicates and bars represent mean±SEM, unpaired t-test ****p<0.0001. (H) Sox9 and (I) Mbnl1 gene expression in MBNL1Fl/Fl-Tcf21iCre and MBNL1Fl/Fl cardiac fibroblasts with or without AdMBNL1 infection and actinomycin D treatment. Dots are biological replicates, n=3 per condition, bars are mean±SEM, ANOVA with Tukey post hoc comparisons, numbers represent significant pairwise comparisons at p<0.05: 1- 0hr Fl, 2-0hr Fl AdMBNL1, 3-0hr Fl-Cre, 4- 0hr FlCre AdMBNL1, 5- 4hr AdMBNL1, 6- 4hr Fl-Cre, 7- 8hr Fl Ad BNL1, 8- 8hr Fl-Cre.
DISCUSSION
Results from this study confirmed MBNL1’s requirement in the heart’s fibrotic response through its reprogramming of the cardiac fibroblast transcriptome during wound healing while complementing our previous work with global MBNL1 knockouts that showed MBNL1 matures the myofibroblast transcriptome but failed to directly prove fibrotic outcomes were due to its cardiac fibroblast-specific role (Davis et al., 2015). Here cardiac fibroblast targeted gain and loss of MBNL1 function provided the experimental proof that MBNL1 post-transcriptionally regulates injury-induced fibroblast state dynamics, which in turn modulates maladaptive myocardial remodeling and the nature of fibrotic scarring. These positive outcomes were clearly linked to blocking myofibroblast state transitions and possibly due to the lack of matrifibrocytes, which derive from the Postn-lineage during scar maturation (Fu et al., 2018). Given (1) there were greater reductions in fibrosis from deleting MBNL1 in Postn+ myofibroblasts (Figure 6E–F), (2) MBNL1 expression increased at the time matrifibrocytes form (Figure 1J), and (3) scars failed to mature, our hypothesis regarding defective matrifibrocyte function may indeed be true. However, these data cannot discriminate whether MBNL1 directly regulates matrifibrocyte state transitions or whether cardiac fibroblasts must first become myofibroblasts before transitioning into matrifibrocytes. Notably, unique matrifibrocyte clusters were not identified by scRNAseq despite the increased expression of matrifibrocyte transcripts within several fibroblast substates (Figure 5B–E), but this could be due to the timing of data collection which was earlier than described for matrifibrocyte formation (Fu et al., 2018).
Deleting MBNL1 expression in tandem with an injury signal not only prevented the development of all activated myofibroblast states but also expanded all possible quiescent substates including those enriched for mesenchymal cell properties (Figure 4O–U, 5A–E, & Figure S6G–K) characterized by heightened proliferation and expression of both Sca1 and Pdgfrα (Chong et al., 2011; Noseda et al., 2015; White and Chong, 2020). Other quiescent substates (FSL1 and F-SL2) had enhanced expression of the cytokine Il6 (Fig 5C) and transcription factor Zbtb16, which promotes the maintenance and renewal of stem cells (Liu et al., 2016). The expression of Il6 by F-SL1 fibroblasts suggests this cluster has proinflammatory function, while Zbtb16 expression in F-SL2 fibroblasts may renew and preserve the quiescent fibroblast population. Fl-Tcf21iCre mice also had a larger F-WNTx cluster (Figure S5H), which was previously defined as antifibrotic and reparative (Farbehi et al., 2019). Moreover, an F-THSD7 substate was identified and expanded in Fl-Tcf21iCre mice in response to MI (Figure 5C, Figure S5G–H). This cluster was defined by upregulated epicardial transcripts and thus believed to partially underlie the redeployment of developmental and EMT signals detected in MBNL1 null fibroblasts by bulk RNAseq (Figure 4T–U). We postulate that expansion of these quiescent clusters in Fl-Tcf21iCre mice likely underlie their improved outcomes following MI due to the prorepair, angiogenic, and antifibrotic qualities of these various fibroblast clusters (Figure 4).
Despite the significant changes to the transcriptome at baseline, Fl-Tcf21iCre mice lacked a corresponding induction of cardiac fibrosis with only 2 weeks of transgene activation. One explanation for this finding is that ECM degradation and clearance mechanisms may keep up with production at this early timepoint without a stressor. However, studies with other inducers of the myofibroblast fate like MKK6 and YAP caused a fibrotic phenotype shortly after transgene induction (Bugg et al., 2020; Molkentin et al., 2017; Xiao et al., 2019) suggesting there are additional levels of regulation between transcriptional phenotype and physiologic function that are required for producing fibrotic ECM (Figure 2). It is also possible that forced expression of MBNL1 simply primes the fibroblast transcriptome by lowering the activation energy needed to destabilize quiescence, and then subsequent perturbations (ie. injury or stiffness) creates physiologic myofibroblast states (Figure 2L, 3 & 5E).
Surprisingly, forced MBNL1 expression in cardiac fibroblasts impacted MI-induced left ventricular function and remodeling before significant changes to the ECM were observed (Figure 3E–G). While this change in whole heart function was not due to enhanced myocyte death, Tg fibroblasts induced greater myocyte dilation (Figure 3N–O), which likely underlies the poor systolic function in these animals. Each fibroblast cluster was surveyed for the expression of secreted factors or cardiokines unique to the expanded myofibroblast populations in MBNL1 Tg-Tcf21iCre mice as a driver of this remodeling, but no factor stood out as a candidate (Figure S7A). Interestingly, Fstl1, which was previously shown to prevent myocyte apoptosis and maladaptive remodeling (Oshima et al., 2008; Shimano et al., 2011), was upregulated in the MYO-1 substate, the predominant cluster in MBNL1 Tg mice (Figure S6G–H), and RNA immunoprecipitation assays demonstrated MBNL1 binds Fstl1 (Figure S7B). While Fstl1 may have contributed to preventing excessive apoptosis in MBNL1 Tg-Tcf21iCre mice, diastolic remodeling at the myocyte level was accentuated by still unknown mechanisms.
MBNL1 regulates many transcripts promoting cardiac fibroblast to myofibroblast state transitions (Davis et al., 2015), and here we found that MBNL1-dependent stabilization of Sox9 mRNA was a contributing mechanism (Figure 7). Indeed, this transcription factor is essential for the fibrotic and inflammatory response to ischemic injury (Lacraz et al., 2017; Ruiz-Villalba et al., 2020; Scharf et al., 2019), likely through its role in regulating the expression of key EMT and ECM genes needed for cardiac repair (Lacraz et al., 2017; Akiyama et al., 2004; Lincoln et al., 2007). Collectively, these findings strongly implicate MBNL1’s regulation of Sox9 as an essential determinant of fibrotic state transitions and nature of ECM remodeling.
The ability to control myofibroblast reversibility holds great promise for addressing the clinical burden of fibrosis, given that preventing the induction and maintenance of myofibroblast activity by pharmacologic or genetic means can significantly prevent fibrotic remodeling in the heart and other tissues (Bugg et al., 2020; Davis et al., 2012, 2015; Dobaczewski et al., 2010; Huang et al., 2019; Koitabashi et al., 2011; Lighthouse et al., 2019; Molkentin et al., 2017; Small et al., 2010). Targeting post-transcriptional mechanisms underlying fibroblast plasticity is an appealing approach as approximately one-third of the changes in gene expression are subject to posttranscriptional regulation affecting overall protein abundance (Chothani et al., 2019). MBNL1 has desirable therapeutic qualities, as it regulates multiple facets of fibroblast function required for cardiac wound healing and repair.
Limitations Of The Study
The aim of this study was to understand the fibroblast-specific role of MBNL1 in regulating the hearts fibrotic response. We identified that MBNL1 is necessary for inducing and maintaining fibroblast to myofibroblast states transitions. More extensive studies using lineage traced fibroblasts from MBNL1Fl/Fl-PostniCre mice would provide greater insight as to the range of fibroblasts plasticity and its dependance on MBNL1 transcriptome maturation. Additional studies are also needed to understand the fibroblast-specific role of MBNL1 in regulating cell state transitions in chronic stress models where the fibroblast cell state might be more plastic. With respect to the Sox9 mechanism, in vivo evidence that Sox9 can rescue the heart’s fibrotic response in MBNL1Fl/Fl Tcf21iCre mice is still warranted. Together this information would allow the field to better understand the therapeutic potential of RNA binding proteins in managing cardiac fibrosis.
STAR METHODS
Resource Availability
Lead contact
Further information and requests for resources and reagents should be sent to the lead contact, Jennifer Davis (jendavis@uw.edu).
Materials availability
Reagents used in this study that are not commercially available or obtainable through repositories will be shared upon reasonable request and completion of a material transfer agreement (MTA).
DATA AND CODE AVAILABILITY
Single cell RNAseq data have been deposited at Gene Expression Omnibus (GEO) repository and are publicly available now with the accession number GSE193308.
Any additional information including original western blots, RNAseq, microscopy images, and echocardiography reported in the paper is available through the lead contact upon request.
Experimental Models
Mice were bred and housed at the University of Washington. Rooms have controlled temperature and light/dark cycles with standard chow being provided ad libitum. MBNL1Fl mice were bred to homozygosity with either Tcf21iCre or PostniCre lines. Both male and female mice of each genotype were used for breeding in all lines. Tamoxifen induction of Cre recombinase expression was started between 6–8 weeks of age and achieved with 5 days of intraperitoneal (IP) injections of pharmaceutical grade tamoxifen dissolved in peanut oil (25mg/kg) followed by 9 additional days on tamoxifen citrate chow (400mg/kg body weight, Harlan Laboratories). Mice remained on Tam chow until the experimental end point unless stated otherwise. Sham or MI surgeries were performed after 2 weeks of Tam treatment, and hearts were harvested for cell or tissue analysis at the indicated time points following surgery. Experimentalists remained blinded to the genotypes until analysis was complete. Both male and female mice were used in all experiments and mice were randomly assigned to groups.
Method Details
Animal models
All animal experimentation was approved by the University of Washington’s Institutional Animal Care and Use Committee. Lineage reporter mice were generated by crossing a mouse containing a tamoxifen (Tam)-inducible Cre recombinase cassette knocked into the periostin locus (PostniCre) with mice containing a membrane targeted dual fluorescent reporter (mT/mG) knocked into the Rosa26 locus (Figure 1G). All cells in PostniCre-mT/mG mice express membrane-targeted TdTomato (mT) unless Cre is expressed which excises the TdTomato (mT) and moves a membrane-targeted green fluorescent protein (mG) sequence in frame for expression (Kanisicak et al., 2016; Muzumdar et al., 2007). Cardiac fibroblast specific MBNL1 overexpression mice (MBNL1 Tg-Tcf21iCre) were generated by crossing mice containing the human MBNL1 cDNA with mice containing a Tam-inducible Tcf21-Cre driver (Figure 2A, (Acharya et al., 2011, 2012; Davis et al., 2015)). Conditional MBNL1 knockout mice (MBNL1Fl/Fl) were generated using targeted C57BL/6 embryonic stem cells (ES) from the International Knockout Mouse Consortium (IKMC). Founders were bred onto a C57BL/6 background and then to mice expressing Flippase to excise the LacZ-neomycin cassettes still present within the floxed MBNL1 allele, as IKMC uses a knockout first approach for their targeted alleles. Once the LacZ-neomycin cassettes were flippedout, MBNL1Fl/Fl mice were crossed with Tcf21iCre or PostniCre to generate cardiac fibroblast and myofibroblast specific MBNL1 knockout mice (Figure 4A & 6A). Tamoxifen induction of Cre recombinase expression was started between 6–8 weeks of age and achieved with 5 days of intraperitoneal (IP) injections of pharmaceutical grade tamoxifen dissolved in 95% peanut oil and 5% ethanol (25mg/kg) followed by 9 additional days on tamoxifen citrate chow (400mg/kg body weight, Harlan Laboratories). Mice remained on Tam chow until the experimental endpoint unless stated otherwise.
Surgical Model of Myocardial Infarction
The surgical model was previously described (Bugg et al., 2020; Molkentin et al., 2017), but briefly 8-week-old mice were anesthetized using injectable ketamine and xylazine. Mice were mechanically ventilated through oral intubation and a lateral thoracotomy was performed to expose the left ventricle. The pericardium was removed, and the left anterior descending artery was permanently ligated more apically to reduce risk of rupture, using 8–0 Surgipro tapered suture. Two days prior to surgery mice were taken off Tam chow for 2 days to prevent any adverse effects of Tam during the surgical procedure and then put back on Tam chow until the studies endpoint. At harvest hearts were excised, rinsed in 1X phosphate buffered saline (PBS), and relaxed in saturated potassium chloride solution before being fixed in formaldehyde and prepped for paraffin or cryo- sectioning. Experimentalists remained blinded to the genotypes until analysis was complete. Both male and female mice were used in all experiments and mice were randomly assigned to groups. Echocardiography was performed on a Vevo2100 or Vevo3100 under isoflurane anesthetic.
In vivo proliferation following MI
Mice underwent MI procedure as stated above. Two boluses of EdU dissolve in PBS (100mg/kg) were injected IP at 24 hours and 9 hours before harvesting. Mice were then euthanized, and hearts fixed in 4% paraformaldehyde overnight. Tissues were then processed through a sucrose gradient (5–30%), embedded in optimal cutting temperature compound (OCT), and prepared for 5μm cryosectioning.
Human primary cardiac fibroblast isolation
Human cardiac fibroblasts were isolated from patients undergoing left ventricular assist device surgery as previously described (Carlson et al., 2017; Farris et al., 2017). Briefly heart samples were rinsed in cold PBS and minced in a 10mL of warm digestion buffer [HBSS, 30mM Taurine, 10mM HEPES, Liberase TH 5mg/mL DNase1 2000U]. The samples are then incubated for 5 minutes, triturated, allowed to gravity settle so the supernatant could be removed, and set off to the side for digestion of remaining tissue. New digestion buffer was added to the remaining tissue, and the process repeated until the tissue was fully digested. Fibroblasts were separated using a Miltenyi MACs magnetic separator positive selection for CD14. Samples were incubated in 1mL of sorting buffer [1XPBS, 0.5%BSA, 2μM EDTA] and 125μL of CD14 microbeads for 1 hour before sorting. Samples were then spun down and stored in TRIzol until RNA isolation. Healthy human fibroblasts were obtained from Promocell.
Mouse primary cardiac fibroblast isolation
Mice were heparinized and cardiac fibroblasts freshly isolated by Langendorff perfusion with type II collagenase (2mg/ml) and Liberase TH (0.4mg/ml) solubilized in Krebs-Henseleit buffer [113mM NaCl, 4.7mM KCl,0.6mM KH2PO4, 0.6mM Na2HPO4, 1.2mM MgSO4·7H2O, 12uM NaHCO3, 10uM KHCO3, 10.8uM Hepes] as previously described (Bugg et al., 2020; Molkentin et al., 2017). For culture experiments cardiac fibroblasts were plated in in Dulbecco’s Minimal Essential Media (DMEM) with high glucose and supplemented with 1% penicillin and streptomycin (P/S), and 20% fetal bovine serum (FBS) and kept at 37°C with 5% CO2. Cardiac fibroblasts were expanded to passages 3–5 for experimentation. For some experiments cell-permeant Cre recombinase (TATCre,1:100, EMD Millipore) was added to the cultures for 2 days to permanently excise MBNL1. For differentiation assays cells were cultured in differentiation media (DMEM + 1% FBS + 1% P/S) with or without recombinant TGFβ (R&D systems, 10 ng/mL) and analyzed 72 hours later by immunofluorescent staining described below. For proliferation assays cardiac fibroblasts were treated with 10μM EdU every 12 hours over 1 day in 2% FBS media. At the studies end point cardiac fibroblasts were fixed in 4% PFA and Click-iT chemistry (Invitrogen) used to detect EdU positivity per the manufacturer’s instructions.
In vitro cell treatments
Recombinant TGFβ (10 ng/ml, R&D System) was used to induce myofibroblast transformation. For experiments that used adenoviral gene transfer, cardiac fibroblasts were treated with adenovirus overnight followed by a media change and cells examined 3 days after induction. The following adenoviruses have been previously described: ΔCnA, SRF, GFP, and MBNL1 (Davis et al., 2012, 2015; Liu et al., 2001; Wilkins et al., 2004). An adenovirus expressing GFP was used as a control. Sox9 overexpression was obtained by transfecting cardiac fibroblasts with full length Sox9 cDNA using X-treme Gene transfection reagent (Sigma) diluted in Opti-MEM media at a 4:1 ratio of transfection reagent to plasmid. βgal plasmid was used for control transfections.
Collagen gel contraction assay
Cardiac fibroblasts were isolated, expanded and treated with adenovirus or TGFβ 24 hours prior to seeding into collagen gels as previously described (Davis et al., 2012; Ngo et al., 2006). Here 50,000 cardiac fibroblasts were seeded into each gel and then released from the plate into differentiation media (DMEM + 1% FBS + 1% P/S) once they had solidified. Gels were photographed and measured every 12 hours over 4 days. ImageJ software (NIH) was used to calculate the surface area, which are reported as values normalized to the initial size of the gel. Data shown is at 48 hours post seeding.
Transcript stability assay
Tam-treated MBNL1Fl/Fl and MBNL1Fl/Fl-Tcf21iCre cardiac fibroblasts were infected with either AdGFP (controls) or AdMBNL1 for 36 hours at which time transcription was inhibited with 2mg/ml Actinomycin-D (Sigma). RNA was isolated using a Qiagen RNeasy Mini kit from each group after 0, 4, and 8 hours of treatment, reverse transcribed, and analyzed by real-time PCR as previously described (Davis et al., 2015).
Flow cytometry for fibroblast purification
For PostniCre-mT/mG gene expression and RNA sequencing experiments cardiac fibroblasts were isolated and the subjected to flow cytometry as previously described (Molkentin et al., 2017). Briefly cells were strained through a 70 μm cell strainer and then stained with CD11b (1:50 Miltenyi Biotec 130–113-800) and MEFSK4 (1:50 Miltenyi Biotec 130–120-802) in HBSS with Ca2+, Mg2+ and 2%FBS. This allows for the removal of contaminating CD11b cells. Cells were then sorted on an Aria II live cell sorter. For PostniCre-mT/mG experiments the same antibody scheme was used but the MEFSK4+ GFP− and MEFSK4+ GFP+ populations were segregated to compare the populations. RNA isolation was then preformed using an RNAqueous Micro Kit which is specifically designed for low RNA yields. Gene specific amplification was used during cDNA synthesis to increase signal of target genes.
Single cell RNA sequencing and analysis
For single cell RNA sequencing, isolated cardiac fibroblasts were subjected to magnetic bead sorting using a Miltenyi QuadroMACS magnetic cell separation kit. Briefly, cells were strained through a 70 μm cell strainer and resuspended in 180uL of sorting buffer (1XPBS, 0.5%BSA, 2μM EDTA) and 20μL of Cd11b microbeads. Samples were mixed well and incubated for 15 minutes at 4°C. Samples were washed through the magnetic columns and the flow through (containing the Cd11b- fraction) was collected. The cells were spun and resuspend in 160uL of sorting buffer with 40μL of MEFSK4 (Anti-feeder) microbeads. Cells were again incubated for 15 minutes at 4°C and sorted using magnetic columns. The flow through was discarded, and the magnetic columns containing the MEFSK4+ fraction were removed and rinsed with sorting buffer. Viability was assessed at this point for all preps. Viability was greater than 90% for all samples. Cells were lysed as previously described (Alexanian et al., 2021). Briefly cells were spun and rinsed in 1x HBSS with no FBS. Pellets were resuspended in 200uL of Lysis buffer (Tris-HCl 10mM pH 7.4, NaCl 10mM, MgCl2 3mM, Tween-20 0.1%, NP40 0.1%, Digitonin 0.01%, in Nuclease-free water), pipetted 10 times and kept on ice for 5 minutes. Nuclei were wash with 1 mL of wash buffer [TrisHCl 10mM pH 7.4, NaCl 10mM, MgCl2 3mM, Tween-20 0.1%, in Nuclease-free water], inverting 3 times to mix. Nuclei were spun at 5000g for 3 minutes at 4°C. Nuclei were further washed in 1.2mL of 1X PBS with 1%BSA and filtered through a 30μm filter to remove any debris. Nuclei were counted using Trypan blue and a hemocytometer. Nuclei were resuspended at a concentration of 1000nuclei/μL in 1XPBS with 1%BSA with 8300 nuclei being loaded for subsequent 10X Genomics Chromium single cell RNAseq preparation.
Single cell droplet libraries were generated in the 10X Genomics Chromium controller according to the manufacturer’s instructions in the Chromium Single Cell 3′ Reagent Kit v.3.1 with Dual Indexing. Additional components used for library preparation include the Chromium Single Cell 3′ Library and Gel Bead Kit v.3.1 (PN- 2000164) and the Chromium Single Cell 3′ Chip kit v.3.1 (PN-120236). Libraries were prepared according to the manufacturer’s instructions using the Chromium Single Cell 3′ Library and Gel Bead Kit v.3.1 (PN- 2000164) and Chromium i7 Multiplex Kit (PN- 1000213). Final libraries were sequenced on the NextSeq 2000. All 14 samples were pooled and sequenced in one single lane. Sequencing parameters were selected according to the Chromium Single Cell v.3.1 specifications. Libraries were sequenced to a mean read depth of at least 20,000 total aligned reads per cell.
The Cell Ranger Single-Cell Software Suit (Zheng et al., 2017) was used to perform sample demultiplexing, barcode processing and single-cell 3′ gene counting. For each sample, reads were aligned to the Mouse (mm10) 2020-A premRNA reference genome using CellRanger count v6.1.1. CellRanger Aggr (v6.1.1) was used to aggregate count matrices across samples with normalize=none. Only confidently mapped reads with valid barcodes and unique molecular identifiers were used to generate the gene-barcode matrix. Further analyses for quality filtering was performed using the Seurat R package (Butler et al., 2018). We calculated the distribution of detected genes per cell and removed cells in the top 1% quantile or those which had fewer than 200 detected genes. Cells were removed with more than 15% of the transcripts coming from mitochondrial genes. After quality filtering, reads were normalized to account for technical variation in the dataset including sequencing depth. To do this, we implemented the SCTransform function (Hafemeister and Satija, 2019) with the “glmGamPoi” method (Ahlmann-Eltze and Huber, 2021); mitochondrial mapping percentage was also regressed out using the vars.to.regress argument. Principal component analysis was performed on the scaled data, and then cells were clustered on the first 18 principal components using the FindNeighbors function and the FindClusters function with resolution 0.5. To visualize the data, we used non-linear dimensional reduction via Uniform Manifold Approximation and Projection (UMAP) to project cells in 2D space on the basis of the first 18 principal components (McInnes et al., 2018). Nine fibroblast clusters were identified based on expression of Col1a1, Pdgfrα, and Postn, and seven clusters expressing markers of non-fibroblast populations, which likely represent contaminating non-fibroblast nuclei after fibroblast isolation. These non-fibroblast clusters were removed, and the clustering processes were repeated resulting in the identification of 13 fibroblast subpopulations. In total, we analyzed 20814 fibroblast nuclei (5302:NTG-SHAM, 5611:NTG-MI, 1831: MBNL1Fl/Fl-Tcf21iCre SHAM, 3163: MBNL1Fl/Fl-Tcf21iCre -MI, 2495: MBNL1 Tg-Tcf21iCre-SHAM, 2412: MBNL1 Tg-Tcf21iCre -MI) with a median of 2875.5 UMI per cell and 1322 unique genes per cell. Cluster markers were identified using the FindMarkers function with a Wilcoxon rank sum test; cell type identities were assigned to clusters by examination of top cluster markers, differential expression analysis between individual clusters, and consultation of previous single cell RNA sequencing datasets of isolated fibroblasts. Differential expression analysis between populations was completed using the FindMarkers function with the Wilcoxon rank sum test based on genes which were expressed in at least 10% of cells for at least one of the populations being compared and with an absolute log2 fold change greater than 0.25. Over-representation of GO terms in gene lists was calculated using the gost function in the Gprofiler (Kolberg et al., 2020) R package. We also performed pseudotime analysis using Monocle3 (Qiu et al., 2017; Trapnell et al., 2014) with the SeuratWrappers package as described in the tutorials (Tim Stuart and Avi Srivastava). Our Seurat object was converted into a CellDataSet object using the as.cell_data_set() function. Pseudotime estimates were calculated with the order_cells function with root nodes selected in in the F-SH2 and F-EPI populations. Pseudotime values were then extracted and added to our Seurat object. Single cell RNAseq data have been deposited at Gene Expression Omnibus (GEO) repository with the accession number GSE193308.
Cardiomyocyte isolation
Mouse ventricular myocytes were freshly isolated by Langendorff perfusion with Liberase TM (0.225 mg/mL, Roche) in Krebs-Henseleit buffer (135mM NaCl, 4.7mM KCl, 0.6mM KH2PO4, 0.6mM Na2HPO4, 1.2mM MgSO4, 20mM Hepes,10μM BDM, and 30mM Taurine) as previously described (Hegyi et al., 2020). Ventricular myocytes were dispersed mechanically and filtered through a 200μm nylon mesh then allowed to sediment for ~10 minutes. The sedimentation was repeated three times using increasing [Ca2+] from 0.125 to 0.25 then 0.5 mmol/L. Myocytes were plated on laminin coated coverslips in Tyrodes solution (137mM NaCl, 5.4mM KCl, 0.5mM MgCl2, 1.2mM CaCl2*2H2O, 10mM Hepes, and 5mM Glucose, 7.4 pH) for 1 hour prior to functional measurements or relaxed in 25μM blebbistatin and fixed with 4%PFA at room temperature for 15 minutes.
Myocyte morphology tracing
Myocytes were stained with a dilution of 1:100 Wheat Germ Agglutinin, Alexa Fluor™ 488 Conjugate (W11261) for 1 hour at room temperature. 40 cells per mouse were manually traced using Fiji.
Measurements of myocyte contractility
Sarcomere measurements were obtained from isolated myocytes using the IonOptix™ SarcLen Sarcomere Length Acquisition Module with a MyoCam-S3 digital camera (Ionoptix Co., Milton, MA) attached to an Olympus uWD 40 inverted microscope. For these measurements myocytes were bathed in 1.2mM Ca2+ Tyrode’s buffer (137mM NaCl, 5.4mM KCl, 0.5mM MgCl2, 1.2mM CaCl2*2H2O, 10mM HEPES, 5mM Glucose, 7.4 pH) and kept at 37°C. To jumpstart pacing, myocytes were stimulated with frequencies varying from 0.5, 1.0, and 1.5 Hz at 10V for a minimum of 10 contractions at each frequency. Sarcomere lengths were then measured in real time at a frequency of 0.5Hz and averaged across 10–15 contraction cycles. Blinded analysis was performed using the IonWizard software. Statistical analyses were performed on individual myocyte measurements (n ~ 30 myocytes/mouse; n=3). Significance was determined using Student’s t-test.
Gene expression analysis
Real time polymerase chain reaction (RT-PCR) methods are previously described from our laboratory (Bugg et al., 2020; Davis et al., 2012, 2015; Molkentin et al., 2017). Briefly, total RNA was extracted using RNAqueous Micro Kit for all flow sorted samples or using QIA shredder homogenization and the Qiagen RNeasy kit for in vitro culture. Total RNA was reverse transcribed into cDNA using random hexamer primers and SuperScript III first-strand synthesis kit (Invitrogen) according to the manufacturer’s instructions. RT-PCR was performed on a CFX96 Real-Time System with a Biorad C1000 Touch Thermal Cycler using Sso Advanced SYBR Green (Biorad). Thermocycler conditions were as follows: Polymerase Activation and DNA Denaturation at 95°C for 30s, Denaturation at 95°C for 5s, Annealing/Extension and Plate Read at 56°C for 30s. 39 cycles of denaturation and annealing were performed. Fold changed in gene expression was determined using the 2ΔΔCT method. Any differences in cDNA were correct by calculating the difference (ΔCT) between the target gene’s threshold cycle (CT) and the CT for 18s, which serves as the housekeeping gene. Primer list can be found in Supplemental table 1.
Bulk RNA Sequencing (RNAseq)
FACs sorted cell pellets were snap frozen and stored at −80°C until all samples were collected. Total RNA was extracted using RNAqueous Micro Kit and RNA libraries were generated using a Tecan Trio library prep kit, using 2ng of total RNA following manufacturers protocol. 4 PCR cycles were run for full length cDNA amplification. Libraries were pooled and sequenced through an external provider. Cleaned RNAseq reads were uploaded to the public Galaxy server at usegalaxy.org for bioinformatic analysis (Afgan et al., 2018). Reads were aligned using HISAT2 to the mm10 reference genome, summarized using featurecounts, and differential expression between timepoints and genotypes were tested using DESeq2 (Kim et al., 2019; Liao et al., 2014; Love et al., 2014). Genes with an adjusted p < 0.05 were considered significantly differentially expressed. PCA was performed on the log2 normalized counts matrix from DESeq2 using the scikit-learn package (Pedregosa et al., 2011). Heatmaps and gene expression scatterplots were generated from the log2 normalized counts output from DESeq2 using the seaborn package in Python (Waskom et al., 2020). Functional enrichment analysis was conducted using the GProfiler web app, inputting all significant differentially expressed genes as an ordered query (Raudvere et al., 2019). To assess time course expression of clustered, a pairwise correlation matrix between time course-significant genes was calculated, hierarchically clustered using the scipy package in Python, and plotted with seaborn (Virtanen et al., 2020; Waskom et al., 2020). Functional enrichment analysis on genes from each cluster was performed using GProfiler, and log2 normalized gene expression levels per cluster were calculated and plotted over time using seaborn (Raudvere et al., 2019).
Western blot
Tam-induced MBNL1Fl/Fl and MBNL1Fl/Fl-Tcf21iCre fibroblasts treated with 10ng/ml TGFβ and cell lysates were collected 48 hours later in RIPA buffer [5 M NaCl, 10% Triton-X 100, 25%SDS, 1 M Tris-Cl PH 7.4]. Lysates were diluted in Laemmli buffer with DTT, 20μg of protein was loaded into 10% SDS-PAGE acrylamide gels and transferred to PVDF membrane for immunodetection. MBNL1 was detected with anti-MBNL1 (1:100, rabbit polyclonal antibody, Abcam) overnight at 4°C with goat anti-rabbit HRP conjugate secondary at 1:10,000 from EMD Millipore for 1 hour. Anti-GAPDH (1:10,000, mouse monoclonal, Fitzgerald Industries) overnight at 4°C with goat antimouse HRP conjugate at 1:10,000 from EMD Millipore for 1 hour was used as a loading control.
Histology and immunohistochemistry
Hearts were cut in half on the transverse plane prior to processing and sectioning. 5μm paraffin sections were obtained for Sirius Red/Fast Green staining (0.1% Direct Red 80, 0.1% Fast Green in Picric Acid). This method stains muscle tissue in green and fibrotic scar in red. Images of whole hearts were taken at 2x magnification and quantified in ImageJ using color thresholding. Serial sections were then used for αSMA (1:500 Sigma) and IsolectinB4 (IB4) (10ug/mL Vector Biolabs) staining to quantify myofibroblast number in paraffin. Sox9 (1:500, Millipore) and PDGFRα (1:100 R&D systems) staining was done on independent OCT samples. Collagen 3a1 (1:250 Santa Cruz) and Collagen 5a1 (1:250 Santa Cruz) were stained on serial OCT sections. Slug (1:100, Santacruz), Tbx18 (1:500, Santacruz), and Wt-1 (1:1000, Santacruz) were co-stained with PDGFRα (1:100 R&D systems) in OCT sections. These methods are previously described from our laboratory. Here sections were deparaffinized (or in the case of OCT sections they were just rinsed in 1XPBS) and the blocked in PBS with 1% BSA and 0.1% cold fish skin gelatin. Primary antibodies were incubated overnight in blocking solution at 4°C (Bugg et al., 2020; Molkentin et al., 2017). AlexaFluor secondary antibodies (1:1000 Invitrogen) were used for 1.5 hours at room temperature to detect the antigen. Hoechst (1:2000 Thermo Fisher) was used to visualize Nuclei. Additional groups were incubated in primary or secondary antibody alone to control for nonspecific signaling for imaging analysis. To visualize EdU staining in vivo Click-iT chemistry was used following the manufactures instructions with the substitution of normal horse serum (NHS) for PDGFRα (1:100 R&D systems) co-staining. To visualize cellular death, serial sections were stained using the Roche In Situ Cell Death Detection Kit (TMR red, Roche 12156792910) according to manufacturer’s recommendations. To permeabilize the samples prior to TUNEL labeling, slides were incubated with 1X Biogenenx Antigen-Retrieval Solution for 15 min at 80˚C and 0.1% Triton, 0.1% Sodium Citrate Tribasic dihydrate for 8 min at room temperature. Following TUNEL labeling, slides were blocked in PBS containing 2% BSA, 2% Normal Goat Serum (NGS), 0.1% NP40 and co-stained with Hoechst and α-Actinin (1:200 Sigma-Aldrich) or PDGFRα (1:100 R&D Systems) to assess myocyte or fibroblast-specific cell death. Wash steps were performed with PBS containing 0.5% Triton. All samples were mounted using Mowiol 4–88.
Immunocytochemistry
Immunofluorescence staining procedures followed previously described methods (Bugg et al., 2020; Molkentin et al., 2017). Briefly, cardiac fibroblasts were fixed in 4% paraformaldehyde, permeabilization in 1X PBS containing 0.1% Triton-X100, and blocked in PBS containing 0.1% Triton-X100 and 10% Normal Goat Serum (NGS). Primary antibody for αSMA (1:500 Sigma) was incubated at room temperature for 2 hours. AlexaFluor secondary antibodies (1:1000 Invitrogen) were used for 1.5 hours at room temperature to detect the antigen. Hoechst was added with secondary antibody used to visualize nuclei. Additional groups were incubated in primary or secondary antibody alone to control for non-specific signaling for imaging analysis. Samples were mounted using Mowiol 4–88.
Image analysis
To quantify αSMA+ or EdU+ fibroblasts in vitro, cells were manually counted across 10 representative fields of view (FOVs) and normalized to the total number of nuclei to get a percent of total population. To score the number of αSMA+ myofibroblasts in baseline MBNL1 Tg-Tcf21iCre mice and NTG-Tcf21iCre control hearts, the entire cross section of a heart was imaged and the total number of αSMA+IB4− cells were manually scored. Since there are so few cells in these hearts they are shown as raw values and not normalized to fibroblast number or heart area. For infarcted tissue 9–16 FOV of the infarct and border zone were imaged and the number of αSMA+IB4− cells were scored and then normalized to the average number of cells per FOV. This same technique was used for Sox9+PDGFRα+ analysis. For in vivo proliferation quantification we first scored for the total number of PDGFRα+ fibroblasts in the infarct and border zone using the Cell Counter Plugin in Fiji (NIH). Then the Click-iT staining was overlaid with the PDGFRα signal, and we scored for the number of PDGFRα+EdU+ allowing us to calculate the percent of the total fibroblast population that was proliferating. To quantify cell death, three FOV images were taken in the infarct regions and number of TUNEL+/α-Actinin+ and TUNEL+/PDGFRα+ nuclei were counted. This values were compared to overall number of TUNEL+ nuclei to achieve percent myocyte and fibroblast death in the infarct zones. Collagen 3a1 and 5a1 intensity was measured across the infarct using cell profiler and intensity was normalized to overall Hoechst intensity.
Analysis of collagen birefringence
Images of the left ventricular infarct zone were taken at 40x magnification with 3 FOV imaged per mouse. Filters were used to reduce the amount of bright light and the polarizer was rotated to 90 degrees. This produced images with a very black background and bright collagen birefringence. Analysis of collagen birefringence was completed using HSB color thresholding in Fiji (Hue categories: Red/White 2–235 without pass, Red/Orange 3–21, Yellow/Green 24–120). The percent area of each color category was then normalized to the total fiber area from Hue 120–235 without pass.
RNA immunoprecipitation in cardiac fibroblasts
Cardiac fibroblasts were isolate as stated above. Cells were passaged twice and treated with AdMBNL1 (MOI=500) for 48hours. Fibroblasts were scraped in cold 1X PBS and pelleted by centrifugation for 3 minutes at 1000rpm. Cells were then lysed in RIP buffer [150mM KCl, 25mM Tris-HCl pH 7.4, 5mM EDTA, 0.5% NP-40, 0.5mM DTT, 100U/mL RNAse OUT Recombinant Ribonuclear Inhibitor (ThermoFisher 10777019), and 1X complete EDTA-free Protease Inhibitor Cocktail (Sigma 11836170001)]. Lysates were mechanically sheared by Dounce homogenization using 18 strokes. Nuclear membrane and debris were pelleted by centrifugation at 13000 rpm for 10 minutes at 4°C. For each IP, 10% of the input lysate was placed directly into Trizol; lysates were then incubated overnight with 5μg of either Rabbit-anti-FLAG (Sigma F7425) or Rabbit IgG Isotype control (Cell Signaling 3900S) antibody at 4oC with gentle rotation. Following overnight incubation, 40μl of Dynabeads Protein A (ThermoFisher 10001D) were washed 6x in RIP buffer and then added to RIP lysates for 1 hour at 4oC with gentle rotation. Beads and bound material were collected using a DynaMag magnet, and the beads were washed 6x in RIP buffer and 1x in 1x PBS containing 0.5mM DTT, 100U/mL RNAse OUT, and 1x complete EDTA-free Protease Inhibitor Cocktail. Following washing, Trizol was added to isolate bound RNA. Following RNA isolation and cDNA conversion, Cdkn1a, Sox9 and Fstl1 transcripts were quantified by qPCR and analyzed using the percent input method.
Decellularization and collagen alignment analysis
Hearts were excised and retrograde perfused briefly with 1X phosphate buffered saline (PBS), then perfusion decellularized for 12 hours with a 1% aqueous solution of SDS, followed by a 1hour wash of 1% Triton-X 100 to remove residual SDS. Hearts were then washed extensively in deionized H2O and mounted in a 1% wt/vol agarose hydrogel for imaging. Second harmonic images were obtained on an Olympus FV1000MP multiphoton microscope with 860nm excitation (MaiTai DeepSee HP, 59% power) and 420–460nm emission. Z-stacks of 20 images with 1.8μm spacing were obtained at 25x magnification and 2.0 zoom in the border and infarct regions, then converted to maximum intensity projections in ImageJ 2.3.0(Rueden et al., 2017; Schindelin et al., 2012). Fiber metrics were quantified using CurveAlign 4.0 using the CT-Fire Fibers mode and default parameters(Liu et al., 2017).
Quantification and Statistical Analysis
Time course plots (Figure 1C–E) were generated with 95% confidence intervals using the pointplot function in seaborn (Waskom et al., 2020). Prism versions 7 asnd 8 were used for plotting all other data and statistical analysis. Data are represented as mean ± SEM. 2-way ANOVA with Tukey post hoc analysis was used for multiple comparisons. Two-tailed t-tests were used for pairwise comparisons with a p < 0.05 considered significant.
Supplementary Material
Key resources table
| REAGENT or RESOURCE | SOURCE | IDENTIFIER |
|---|---|---|
| Antibodies | ||
| Anti-Sox9 | Millipore | Cat# AB5535, RRID:AB_2239761 |
| Anti-αSMA | Sigma-Aldrich | Cat# A2547, RRID:AB_476701 |
| Anti-αactinin | Sigma-Aldrich | Sigma-Aldrich Cat# A7811, RRID:AB_476766 |
| Anti-GAPDH | Fitzgerald Industries International | Cat# 10R-2932, RRID:AB_11199818 |
| Anti-Muscleblind-like 1 [MBNL1] | Abcam | Abcam Cat# ab45899, RRID:AB_1310475 |
| Anti-PDGFRα | R and D Systems | Cat# AF1062, RRID:AB_2236897 |
| Anti-WT1 | Santa Cruz Biotechnology | Cat# sc-192, RRID:AB_632611 |
| Anti-TBX18 | Santa Cruz Biotechnology | Cat# sc-130428, RRID:AB_2303068 |
| Anti-SLUG | Santa Cruz Biotechnology | Cat# sc-15391, RRID:AB_2191899 |
| Isolectin B4 | Vector Laboratories | Cat# FL-1201, RRID:AB_2314663 |
| Wheat Germ Agglutinin | Thermo Fisher Scientific | Cat# :W11261 |
| Anti-COL5A1 | Santa Cruz Biotechnology | Cat# sc-166155, RRID:AB_2082963 |
| Anti-COL3A1 | Santa Cruz Biotechnology | Cat# sc-271249, RRID:AB_10613985 |
| Cd11b-VioBlue, human and mouse | Miltenyi Biotec | Cat# 130–113-238, RRID:AB_2726047 |
| Anti-Feeder Cells-APC, mouse | Miltenyi Biotec | Cat# 130–120-802, RRID:AB_2784336 |
| Feeder Removal MicroBeads, mouse | Miltenyi Biotec | Cat#: 130–095-531 |
| CD11b MicroBeads, human and mouse | Miltenyi Biotec | Cat#: 130–049-601 |
| CD14 MicroBeads, human | Miltenyi Biotec | Cat#: 130–050-201 |
| AlexaFluor Chicken Anti-Goat 488 | Thermo Fisher Scientific | Cat# A-21467, RRID:AB_2535870 |
| AlexaFluor Donkey Anti-Mouse 647 | Thermo Fisher Scientific | Cat# A-31571, RRID:AB_162542 |
| AlexaFluor Donkey Anti-Rabbit 647 | Thermo Fisher Scientific | Cat# A-31573, RRID:AB_2536183 |
| AlexaFluor Goat Anti-Mouse 568 | Thermo Fisher Scientific | Cat# A-11004, RRID:AB_2534072 |
| Rabbit-anti-FLAG | Sigma | Cat#: F7425 |
| Rabbit IgG Isotype control | Cell Signaling Technologies | Cat#: 3900S |
| Hoechst | Invitrogen | Cat#: H3570 |
| Goat anti-Mouse IgG Antibody, (H+L) HRP conjugate | Millipore Sigma | Cat #: AP308P |
| Goat anti-Rabbit IgG Antibody, (H+L) HRP conjugate | Millipore Sigma | Cat #:AP307P |
| Bacterial and virus strains | ||
| AdMBNL1 | (Davis et al., 2015) | |
| AdSRF | (Davis et al., 2012) | |
| AdΔCna | (Wilkins et al., 2004) | |
| AdGFP | (Liu et al., 2001) | |
| Sox9 cDNA | Origene | Cat #: MC217147 |
| pSV-β-galactosidase | Promega | Cat #: E1081 |
| Biological samples | ||
| Chemicals, peptides, and recombinant proteins | ||
| 1M MgCl2 | ThermoFisher | Cat #: AM9530G |
| 1M Tris-HCl pH 7.4 | ThermoFisher | Cat #: 15567027 |
| 2-Methylbutane (Certified ACS), Fisher Chemical | Fisher Scientific | Cat #: O3551–4 |
| 2,3-Butanedione monoxime (BDM) | Sigma | Cat #: B0753 |
| 200 Micron Nylon Mesh Filter Woven Mesh Sheet Off-White Polyester Food Grade (50”x30”) | Amazon | https://www.amazon.com/Micron-Nylon-Filter-Off-White-Polyester/dp/B07HYHHX5V/ref=sr_1_2?dchild=1&keywords=200+micron+mesh&qid=1611532184&sr=8–2 |
| 30% Acrylamid/Bis | Bio-Rad | Cat #: 1610156 |
| 5M NaCl | ThermoFisher | Cat #: AM9760G |
| Actinomycin D | Millipore Sigma | Cat #: A1410–2MG |
| Agarose | Fisher Scientific | Cat #: BP160–500 |
| Biogenex Antigen Retrieval Citra Concentrated 10X | Biogenex | Cat #: HK086–9K |
| Blebbistatin | TRC Canada | Cat #: B592500 |
| BSA | Fisher Scientific | Cat #: BP9705–100 |
| Calcium Chloride Dihydrate | Fisher Scientific | Cat #: 10035–04-08 |
| Characterized FBS | Fisher Scientific | Cat #: SH3007103 |
| Cold Water Fish Skin Gelatin | Electron Miscropy Sciences | Cat #: 25560 |
| Collagen from rat tail | Sigma Aldrich | Cat #: C7661 |
| Collagenase Type 2 | Worthington | Cat #: LS004176 |
| Complete EDTA-free Protease Inhibitor Cocktail | Sigma | Cat #: 11836170001 |
| D-(+)-Glucose | Sigma | Cat #: G7528–250G |
| D-Sucrose (Molecular Biology), Fisher BioReagents | Fisher Scientific | Cat #: 57–50-1 |
| Digitonin | Promega | Cat #: G9441 |
| Direct Red 80 | Sigma Aldrich | Cat #: 365548 |
| Dithiothreitol (DTT) | ThermoFisher | Cat #: 15508–013 |
| DMEM High Glucose | Fisher Scientific | Cat #: 10–017-CV |
| DMSO | Fisher Scientific | Cat #: BP231–100 |
| DNase I | Sigma Aldrich | Cat #: 260913–10MU |
| Dynabeads Protein A | ThermoFisher | Cat #: 10001D |
| EDTA | Fisher Scientific | Cat #: BP248250 |
| EdU (5-ethynyl-2-deoxyurodine) | Life Technologies | Cat #: A10044 |
| Ethanol | Fisher Scientific | Cat #: 04–355-223 |
| Fast Green | Sigma Aldrich | Cat #: F7258 |
| Formaldehyde 37% | Fisher Scientific (Ricca Chemical) | Cat #: RSOF0010–4a |
| HBSS 1x with Calcium and Magnesium | Thermo Fisher | Cat #: 14025–092 |
| HBSS 1x without Calcium and Magnesium | Fisher Scientific | Cat #: 21–022-CV |
| Heparin | Fresenius Kabi | |
| Hepes | Fisher Scientific | Cat #: 7365–45-9 |
| Horse Serum | Thermo Fisher | Cat #: 16050130 |
| Isoflurane | Piramal | |
| iTaq Universal Green SYBR | BioRad | Cat #: 1725124 |
| KCl | Fisher Scientific | Cat #: P330 |
| Ketamine | Zoetis | |
| Laminin (Natural Mouse) | Gibco | Cat #: 23017–015 |
| Liberase TH | Sigma Aldrich | Cat #: 5401151001 |
| LS Columns | Miltenyi | Cat #: 130–042-401 |
| Magnesium Sulfate Heptahydrate | Fisher Scientific | Cat #: 10034–99-8 |
| Mowiol 4–88 | Sigma Aldrich | Cat #: 81381–250G |
| Normal goat serum | Jackson Immunoresearch | Cat #: 005–000-121 |
| NP-40 | ThermoFisher | Cat #: 28324 |
| Opti-MEM I Reduced Serum Medium | Thermofisher | Cat #: 31985–062 |
| Paraformaldehyde Solution, 4% in PBS, Thermo Scientific | Fisher Scientific | Cat #: AAJ19943K2 |
| PBS power (10x) | Lifetechnologies | Cat #: 21300058 |
| Peanut Oil | Planters | |
| Penicillin-Streptomycin | Fisher Scientific | Cat #: 15140122 |
| Permount | Fisher Scientific | Cat #: Sp15–500 |
| Picric Acid Solution | Sigma Aldrich | Cat #: P6744 |
| Potassium Bicarbonate | Sigma Aldrich | Cat #: 237205 |
| Potassium Chloride | Fisher Scientific | Cat #: 7447–40-7 |
| Potassium Phosphate, Monobasic | Sigma Aldrich | Cat #: 7778–77-0 |
| Pre-Separation Filters (30 μm) | Miltenyi Biotec | Cat #: 130–041-407 |
| PVDF Membrane | Bio-Rad | Cat #: 1620177 |
| RNAse OUT Recombinant Ribonuclear Inhibitor | ThermoFisher | Cat #: 10777019 |
| RNase-Free DNase Set (50) | QIAGEN | Cat #: 79254 |
| SDS | Sigma Aldrich | Cat #: L4509 |
| Sodium Bicarbonate | Fisher Scientific | Cat #: 144–55-8 |
| Sodium Chloride | Fisher Scientific | Cat #: 7647–14-5 |
| Sodium Citrate Tribasic Dihydrate | Sigma Aldrich | Cat #: S4641–500G |
| Sodium Phosphate, Monobasic, monohydrate, crystal | Fisher Scientific | Cat #: 3818–01 |
| SR-Buprenorphine | ZooPharm | |
| Sterile Water (Nuclease Free) | ThermoFisher | Cat #: 10977015 |
| SUPERase•In™ RNase Inhibitor (20 U/μL) | Thermo Fisher | Cat #: AM2694 |
| Superfrost plus slide | Fisher Scientific | Cat #: 12–550-15 |
| Surgipro II 8–0MV-135–5 Taper Suture 18” | Covidien/Medtronic | Cat #: VP900x |
| Tamoxifen | Sigma Aldrich | Cat #: T5648 |
| Tamoxifen Diet (400 TC, 2016, Red) | Harlan Laboratories | Cat #: TD.130860 |
| TAT-Cre | EMD Millipore | Cat #: EG-1001 |
| Taurine | Sigma | Cat #: T8691 |
| TGF-beta 1 Protein R&D Systems Porcine | Fisher Scientific | Cat #: 101B1010 |
| Tissue Tek OCT embedding medium- clear | Fisher Scientific | Cat #: 23–730-571 |
| Triton x-100 | Fisher Scientific | Cat #: BP151–100 |
| TRIzol RNA Isolation Reagents | Thermo Scientific | Cat #: 15596018 |
| Trypsin-EDTA 0.25% | Fisher Scientific | Cat #: MT25053CI |
| Tween-20 | Sigma | Cat #: 11332465001 |
| VWR Cell Strainers 70um | VWR | Cat #: 10199–657 |
| X-tremeGENE™ HP DNA Transfection Reagent | Sigma | Cat #: 6366236001 |
| Xylazine | AnaSed | |
| Xylene | Fisher Scientific | Cat #: X3P-1GAL |
| Critical commercial assays | ||
| Click-iT™ TUNEL Alexa Fluor™ 647 Imaging Assay, for microscopy & HCS | Fisher | Cat#: C10247 |
| In situ cell death detection kit, TMR red (Roche) | Sigma | Cat #: 12156792910 |
| SuperScript III First-Strand Synthesis System | Life Technologies | Cat #: 18080–051 |
| ITaq Universal SYBR Green | BioRad | Cat #: 1725124 |
| Super signal west pico plus chemilumenescent substrate | Thermo Fisher | Cat #: 34580 |
| QIAshredder (250 units) | Qiagen | Cat #: 79656 |
| RNase-Free DNase Set (50) | QIAGEN | Cat #: 79254 |
| RNAqueous Micro Kit | Thermo Fisher | Cat #: AM1931 |
| RNeasy Mini Kit (250) | Qiagen | Cat #: 74106 |
| QuadroMACS™ Separator | Miltenyi Biotec | Cat #: 130–090-976 |
| Trio RNA-Seq | Tecan Genomics, Inc. | Cat #: 0507–32 |
| Chromium Single Cell 3′ Library and Gel Bead Kit v.3.1 | 10x Genomics | Cat #: PN-2000164 |
| Chromium Single Cell 3′ Chip kit v.3.1 | 10x Genomics | Cat #: PN-120236 |
| Chromium i7 Multiplex Kit | 10x Genomics | Cat #: PN-1000213 |
| Deposited data | ||
| scRNAseq | GEO repository | GSE193308 |
| Experimental models: Cell lines | ||
| Human Cardiac Fibroblasts-Healthy | Promocell | Cat #: C-12375 |
| Human Cardiac Fibroblast-Heart Failure | April Stempien-Otero | |
| MBNL1Fl/Fl Cardiac Fibroblasts | Primary isolation | |
| MBNL1Fl/Fl Tcf21iCre Cardiac Fibroblasts | Primary isolation | |
| NTG Cardiac Fibroblasts | Primary isolation | |
| MBNL1 Tg Tcf21iCre Cardiac Fibroblasts | Primary isolation | |
| Experimental models: Organisms/strains | ||
| B6;B6N-Mbnl1tm1a(EUCOMM)Wtsi | This Paper | |
| B6.-Tg(CAG-CAT,-Mbnl1) | (Davis et al., 2015) | |
| B6.129-Tcf21tm(cre/Esr1*)Mdt | (Davis et al., 2015) | |
| B6.129S-Postntm2.1(cre/Esr1*)Jmol | (Kanisicak et al., 2016) | |
| B6.129(Cg)-Gt(ROSA)26Sortm4(ACTB-tdTomato,-EGFP) | (Kanisicak et al., 2016; Muzumdar et al., 2007) | |
| Oligonucleotides | ||
| See Table S1 for all primers | ||
| Recombinant DNA | ||
| Software and algorithms | ||
| FACSDIVA Software | BD Biosciences | |
| ImageJ | (Schindelin et al., 2012) | https://imagej.net/software/fiji/ |
| Cell Counter Plugin in Fiji | https://imagej.net/software/fiji/ | |
| Vevo 2100 Software | Visual Sonics | https://www.visualsonics.com/product/software/vevo-lab |
| Vevo 3100 Software | Visual Sonics | https://www.visualsonics.com/product/software/vevo-lab |
| GraphPad Prism (v7–8.0) | Graphpad Software | https://www.graphpad.com:443/RRID:SCR_002798 |
| Cell Ranger | 10x Genomics | https://support.10xgenomics.com/single-cell-gene-expression/software/downloads/latest |
| Seurat | (Butler et al., 2018) | https://satijalab.org/seurat/; RRID:SCR_007322 |
| LASX | Leica | https://www.leica-microsystems.com/products/microscope-software/p/leica-las-x-ls/ |
| IonOptix™ SarcLen Sarcomere Length Acquisition Module | https://www.ionoptix.com/products/software/sarclen-sarcomere-length-acquisition-module/ | |
| IonWizard (64-bit) v7.5.1.162 | IonOptix | https://www.ionoptix.com/products/software/ionwizard-core-and-analysis/ |
| Galaxy Web Platform | (Afgan et al., 2018) | usegalaxy.org |
| DESeq2 | (Love et al., 2014) | https://bioconductor.org/packages/release/bioc/html/DESeq2.html |
| HISAT2 | (Sirén et al., 2014) | https://daehwankimlab.github.io/hisat2/ |
| g:Profiler | (Raudvere et al., 2019) | https://biit.cs.ut.ee/gprofiler/ |
| Anaconda Python Distribution | https://www.anaconda.com/products/individual | |
| scipy package | (Virtanen et al., 2020) | https://scipy.org/ |
| scikit-learn package | (Pedregosa et al., 2011) | https://scikit-learn.org/ |
| seaborn package | (Waskom, 2020) | https://seaborn.pydata.org/ |
| CurveAlign V4.0 beta | https://eliceirilab.org/software/curvealign/ | |
| R | https://www.r-project.org | |
| R Studio | https://www.rstudio.com | |
| ggplot2 package | https://ggplot2.tidyverse.org | |
| viridis package | https://cran.r-project.org/web/packages/viridis/index.html | |
| Cell Profiler | https://cellprofiler.org/ | |
| Other | ||
Highlights.
MBNL1 regulation of cardiac fibroblast fate modulates scar formation and maturation.
MBNL1 regulates myocardial infarction-induced cardiac fibroblast proliferation.
MBNL1 is necessary and sufficient to induce and maintain mature myofibroblast states.
MBNL1 stabilizes transcripts that underlie profibrotic fibroblast states.
ACKNOWLEDGEMENTS
This work was supported by grants from the National Institutes of Health for JD (HL141187 & HL142624) and CD (R35GM138036) and Biological Mechanisms of Healthy Aging T32 for DB (T32AG066574). Graduate Research Fellowship from the National Science Foundation for RCB (2018261576) and IMR (DGE-1762114).
Footnotes
DECLARATION OF INTERESTS
None
Publisher's Disclaimer: This is a PDF file of an unedited manuscript that has been accepted for publication. As a service to our customers we are providing this early version of the manuscript. The manuscript will undergo copyediting, typesetting, and review of the resulting proof before it is published in its final form. Please note that during the production process errors may be discovered which could affect the content, and all legal disclaimers that apply to the journal pertain.
REFERENCES
- Acharya A, Baek ST, Banfi S, Eskiocak B, and Tallquist MD (2011). Eficient inducible Cre-Mediated recombination in Tcf 21 cell lineages in the heart and kidney. Genesis 49, 870–877. [DOI] [PMC free article] [PubMed] [Google Scholar]
- Acharya A, Baek ST, Huang G, Eskiocak B, Goetsch S, Sung CY, Banfi S, Sauer MF, Olsen GS, Duffield JS, et al. (2012). *USE*The bHLH transcription factor Tcf21 is required for lineage-specific EMT of cardiac fibroblast progenitors. Development 139, 2139–2149. [DOI] [PMC free article] [PubMed] [Google Scholar]
- Afgan E, Baker D, Batut B, Van Den Beek M, Bouvier D, Ech M, Chilton J, Clements D, Coraor N, Grüning BA, et al. (2018). The Galaxy platform for accessible, reproducible and collaborative biomedical analyses: 2018 update. Nucleic Acids Research 46, W537–W544. [DOI] [PMC free article] [PubMed] [Google Scholar]
- Ahlmann-Eltze C, and Huber W. (2021). glmGamPoi: fitting Gamma-Poisson generalized linear models on single cell count data. Bioinformatics 36, 5701–5702. [DOI] [PMC free article] [PubMed] [Google Scholar]
- Chaboissier MC, Behringer RR, Rowitch DH, Schedl A, Epstein JA, and De Crombrugghe B. (2004). Essential role of Sox9 in the pathway that controls formation of cardiac valves and septa. Proceedings of the National Academy of Sciences of the United States of America 101, 6502–6507. [DOI] [PMC free article] [PubMed] [Google Scholar]
- Akiyama H, Alexanian M, Przytycki PF, Micheletti R, Padmanabhan A, Ye L, Travers JG, Gonzalez-Teran B, Silva AC, Duan Q, Ranade SS, et al. (2021). A transcriptional switch governs fibroblast activation in heart disease. Nature 2021 595:7867 595, 438–443. [DOI] [PMC free article] [PubMed] [Google Scholar]
- Batra R, Charizanis K, Manchanda M, Mohan A, Li M, Finn DJ, Goodwin M, Zhang C, Sobczak K, Thornton CA, et al. (2014). Loss of MBNL Leads to Disruption of Developmentally Regulated Alternative Polyadenylation in RNA-Mediated Disease. Molecular Cell 56, 311–322. [DOI] [PMC free article] [PubMed] [Google Scholar]
- Bretherton R, Bugg D, Olszewski E, and Davis J. (2020). Regulators of cardiac fibroblast cell state. Matrix Biology 91–92, 117–135. [DOI] [PMC free article] [PubMed] [Google Scholar]
- Bugg D, Bretherton R, Kim P, Olszewski E, Nagle A, Schumacher AE, Chu N, Gunaje J, Deforest CA, Stevens K, et al. (2020). Infarct collagen topography regulates fibroblast fate via p38-yes-associated protein transcriptional enhanced associate domain signals. Circulation Research 127, 1306–1322. [DOI] [PMC free article] [PubMed] [Google Scholar]
- Butler A, Hoffman P, Smibert P, Papalexi E, and Satija R. (2018). Integrating single-cell transcriptomic data across different conditions, technologies, and species. Nature Biotechnology 2018 36:5 36, 411–420. [DOI] [PMC free article] [PubMed] [Google Scholar]
- Cao J, and Poss KD (2018). The epicardium as a hub for heart regeneration. Nature Reviews Cardiology 2018 15:10 15, 631–647. [DOI] [PMC free article] [PubMed] [Google Scholar]
- Carlson S, Helterline D, Asbe L, Dupras S, Minami E, Farris S, and Stempien-Otero A. (2017). Cardiac macrophages adopt profibrotic/M2 phenotype in infarcted hearts: Role of urokinase plasminogen activator. Journal of Molecular and Cellular Cardiology 108, 42–49. [DOI] [PubMed] [Google Scholar]
- Cheng AW, Shi J, Wong P, Luo KL, Trepman P, Wang ET, Choi H, Burge CB, and Lodish HF (2014). Muscleblind-like 1 (Mbnl1) regulates pre-mRNA alternative splicing during terminal erythropoiesis. Blood 124, 598–610. [DOI] [PMC free article] [PubMed] [Google Scholar]
- Chong JJH, Chandrakanthan V, Xaymardan M, Asli NS, Li J, Ahmed I, Heffernan C, Menon MK, Scarlett CJ, Rashidianfar A, et al. (2011). Adult Cardiac-Resident MSC-like Stem Cells with a Proepicardial Origin. Cell Stem Cell 9, 527–540. [DOI] [PMC free article] [PubMed] [Google Scholar]
- Chothani S, Schäfer S, Adami E, Viswanathan S, Widjaja AA, Langley SR, Tan J, Wang M, Quaife NM, Jian Pua C, et al. (2019). Widespread Translational Control of Fibrosis in the Human Heart by RNA-Binding Proteins. Circulation 140, 937–951. [DOI] [PMC free article] [PubMed] [Google Scholar]
- Daseke MJ, Tenkorang MAA, Chalise U, Konfrst SR, and Lindsey ML (2020). Cardiac fibroblast activation during myocardial infarction wound healing: Fibroblast polarization after MI. Matrix Biology 91–92, 109–116. [DOI] [PMC free article] [PubMed] [Google Scholar]
- Davis J, and Molkentin JD (2014). Myofibroblasts: Trust your heart and let fate decide. Journal of Molecular and Cellular Cardiology 70, 9–18. [DOI] [PMC free article] [PubMed] [Google Scholar]
- Davis J, Burr AR, Davis GF, Birnbaumer L, and Molkentin JD (2012). A TRPC6Dependent Pathway for Myofibroblast Transdifferentiation and Wound Healing In Vivo. Developmental Cell 23, 705–715. [DOI] [PMC free article] [PubMed] [Google Scholar]
- Davis J, Salomonis N, Ghearing N, Lin S-CJCJ, Kwong JQ, Mohan A, Swanson MS, and Molkentin JD (2015). MBNL1-mediated regulation of differentiation RNAs promotes myofibroblast transformation and the fibrotic response. Nature Communications 6, 10084. [DOI] [PMC free article] [PubMed] [Google Scholar]
- Dobaczewski M, Bujak M, Li N, Gonzalez-Quesada C, Mendoza LH, Wang XF, and Frangogiannis NG (2010). Smad3 signaling critically regulates fibroblast phenotype and function in healing myocardial infarction. Circulation Research 107, 418–428. [DOI] [PMC free article] [PubMed] [Google Scholar]
- Dobaczewski M, de Haan JJ, and Frangogiannis NG (2012). The extracellular matrix modulates fibroblast phenotype and function in the infarcted myocardium. Journal of Cardiovascular Translational Research 5, 837–847. [DOI] [PMC free article] [PubMed] [Google Scholar]
- Farbehi N, Patrick R, Dorison A, Xaymardan M, Janbandhu V, Wystub-Lis K, Ho JWK, Nordon RE, and Harvey RP (2019). Single-cell expression profiling reveals dynamic flux of cardiac stromal, vascular and immune cells in health and injury. ELife 8. [DOI] [PMC free article] [PubMed] [Google Scholar]
- Farris SD, Don C, Helterline D, Costa C, Plummer T, Steffes S, Mahr C, Mokadam NA, and Stempien-Otero A. (2017). Cell-Specific Pathways Supporting Persistent Fibrosis in Heart Failure. Journal of the American College of Cardiology 70, 344–354. [DOI] [PubMed] [Google Scholar]
- Fu X, Khalil H, Kanisicak O, Boyer JG, Vagnozzi RJ, Maliken BD, Sargent MA, Prasad V, Valiente-Alandi I, Blaxall BC, et al. (2018). Specialized fibroblast differentiated states underlie scar formation in the infarcted mouse heart. The Journal of Clinical Investigation 128, 2127–2143. [DOI] [PMC free article] [PubMed] [Google Scholar]
- Savarese Gianluigi and Lund Lars H (2017). Global Public Health Burden of Heart Failure. Cardiac Failure Review 3, 7–11. [DOI] [PMC free article] [PubMed] [Google Scholar]
- Girardot M, Bayet E, Maurin J, Fort P, Roux P, and Raynaud P. (2018). SOX9 has distinct regulatory roles in alternative splicing and transcription. Nucleic Acids Research 46, 9106–9118. [DOI] [PMC free article] [PubMed] [Google Scholar]
- Gise A. von, and Pu WT (2012). Endocardial and Epicardial Epithelial to Mesenchymal Transitions in Heart Development and Disease. Circulation Research 110, 1628–1645. [DOI] [PMC free article] [PubMed] [Google Scholar]
- von Gise A, Zhou B, Honor LB, Ma Q, Petryk A, and Pu WT (2011). WT1 regulates epicardial epithelial to mesenchymal transition through β-catenin and retinoic acid signaling pathways. Developmental Biology 356, 421–431. [DOI] [PMC free article] [PubMed] [Google Scholar]
- Hafemeister C, and Satija R. (2019). Normalization and variance stabilization of single-cell RNA-seq data using regularized negative binomial regression. Genome Biology 2019 20:1 20, 1–15. [DOI] [PMC free article] [PubMed] [Google Scholar]
- Hegyi B, Borst JM, Bailey LRJ, Shen EY, Lucena AJ, Navedo MF, Bossuyt J, and Bers DM (2020). Hyperglycemia regulates cardiac K+ channels via O-GlcNAc-CaMKII and NOX2-ROS-PKC pathways. Basic Research in Cardiology 2020 115:6 115, 1–19. [DOI] [PMC free article] [PubMed] [Google Scholar]
- Huang GN, Thatcher JE, McAnally J, Kong Y, Qi X, Tan W, DiMaio JM, Amatruda JF, Gerard RD, Hill JA, et al. (2012). C/EBP Transcription Factors Mediate Epicardial Activation During Heart Development and Injury. Science 338, 1599–1603. [DOI] [PMC free article] [PubMed] [Google Scholar]
- Huang S, Chen B, Su Y, Alex L, Humeres C, Shinde VA, Conway SJ, and Frangogiannis NG (2019). Distinct roles of myofibroblast-specific Smad2 and Smad3 signaling in repair and remodeling of the infarcted heart. Journal of Molecular and Cellular Cardiology 132, 84–97. [DOI] [PMC free article] [PubMed] [Google Scholar]
- JW H, JA N, and JW C. (1997). Functional implications of myocardial scar structure. The American Journal of Physiology 272. [DOI] [PubMed] [Google Scholar]
- Kanisicak O, Khalil H, Ivey MJ, Karch J, Maliken BD, Correll RN, Brody MJ, J Lin S-C, Aronow BJ, Tallquist MD, et al. (2016). Genetic lineage tracing defines myofibroblast origin and function in the injured heart. Nature Communications 7, 12260. [DOI] [PMC free article] [PubMed] [Google Scholar]
- Kim D, Paggi JM, Park C, Bennett C, and Salzberg SL (2019). Graph-based genome alignment and genotyping with HISAT2 and HISAT-genotype. Nature Biotechnology 37, 907–915. [DOI] [PMC free article] [PubMed] [Google Scholar]
- Koitabashi N, Danner T, Zaiman AL, Pinto YM, Rowell J, Mankowski J, Zhang D, Nakamura T, Takimoto E, and Kass DA (2011). Pivotal role of cardiomyocyte TGF-β signaling in the murine pathological response to sustained pressure overload. Journal of Clinical Investigation 121, 2301–2312. [DOI] [PMC free article] [PubMed] [Google Scholar]
- Kolberg L, Raudvere U, Kuzmin I, Vilo J, and Peterson H. (2020). gprofiler2 -- an R package for gene list functional enrichment analysis and namespace conversion toolset g:Profiler. F1000Research 2020 9:709 9, 709. [DOI] [PMC free article] [PubMed] [Google Scholar]
- Lacraz GPAA, Junker JP, Gladka MM, Molenaar B, Scholman KT, Vigil-Garcia M, Versteeg D, de Ruiter H, Vermunt MW, Creyghton MP, et al. (2017). Tomo-Seq Identifies SOX9 as a Key Regulator of Cardiac Fibrosis during Ischemic Injury. Circulation 136, 1396–1409. [DOI] [PubMed] [Google Scholar]
- Liao Y, Smyth GK, and Shi W. (2014). FeatureCounts: An efficient general purpose program for assigning sequence reads to genomic features. Bioinformatics 30, 923–930. [DOI] [PubMed] [Google Scholar]
- Lighthouse JK, Burke RM, Velasquez LS, Dirkx RA, Aiezza A, Moravec CS, Alexis JD, Rosenberg A, and Small EM (2019). Exercise promotes a cardioprotective gene program in resident cardiac fibroblasts. JCI Insight 4. [DOI] [PMC free article] [PubMed] [Google Scholar]
- Lincoln J, Kist R, Scherer G, and Yutzey KE (2007). Sox9 is required for precursor cell expansion and extracellular matrix organization during mouse heart valve development. Developmental Biology 305, 120–132. [DOI] [PMC free article] [PubMed] [Google Scholar]
- Liu TM, Lee EH, Lim B, and Shyh-Chang N. (2016). Concise Review: Balancing Stem Cell Self-Renewal and Differentiation with PLZF. STEM CELLS 34, 277–287. [DOI] [PubMed] [Google Scholar]
- Liu Y, Cseresnyés Z, Randall WR, and Schneider MF (2001). Activity-dependent nuclear translocation and intranuclear distribution of NFATc in adult skeletal muscle fibers. Journal of Cell Biology 155, 27–39. [DOI] [PMC free article] [PubMed] [Google Scholar]
- Liu Y, Keikhosravi A, Mehta GS, Drifka CR, and Eliceiri KW (2017). Methods for Quantifying Fibrillar Collagen Alignment. Methods in Molecular Biology 1627, 429–451. [DOI] [PMC free article] [PubMed] [Google Scholar]
- Love MI, Huber W, and Anders S. (2014). Moderated estimation of fold change and dispersion for RNA-seq data with DESeq2. Genome Biology 15, 550. [DOI] [PMC free article] [PubMed] [Google Scholar]
- Martin R, Gutierrez B, Cordova C, San Roman A, Alvarez Y, Hernandez M, Cachofeiro V, and Nieto ML (2020). Secreted Phospholipase A2-IIA Modulates Transdifferentiation of Cardiac Fibroblast through EGFR Transactivation: An Inflammation–Fibrosis Link. Cells 9, 396. [DOI] [PMC free article] [PubMed] [Google Scholar]
- McInnes L, Healy J, and Melville J. (2018). UMAP: Uniform Manifold Approximation and Projection for Dimension Reduction. [Google Scholar]
- Melzer M, Beier D, Young PP, and Saraswati S. (2020). Isolation and Characterization of Adult Cardiac Fibroblasts and Myofibroblasts. Journal of Visualized Experiments : JoVE 2020. [DOI] [PMC free article] [PubMed] [Google Scholar]
- Molkentin JDJD, Bugg D, Ghearing N, Dorn LELELE, Kim P, Sargent MAMA, Gunaje J, Otsu K, and Davis J. (2017). Fibroblast-Specific Genetic Manipulation of p38 MAPK in vivo Reveals its Central Regulatory Role in Fibrosis. Circulation 136, 549–561. [DOI] [PMC free article] [PubMed] [Google Scholar]
- Mouton AJ, Ma Y, Rivera Gonzalez OJ, Daseke MJ, Flynn ER, Freeman TC, Garrett MR, DeLeon-Pennell KY, and Lindsey ML (2019). Fibroblast polarization over the myocardial infarction time continuum shifts roles from inflammation to angiogenesis. Basic Research in Cardiology 114, 6. [DOI] [PMC free article] [PubMed] [Google Scholar]
- Muzumdar MD, Tasic B, Miyamichi K, Li L, and Luo L. (2007). A Global DoubleFluorescent Cre Reporter Mouse. Genesis 45, 76–82. [DOI] [PubMed] [Google Scholar]
- Ngo P, Ramalingam P, Phillips JA, and Furuta GT (2006). Collagen Gel Contraction Assay. In Cell-Cell Interactions in Health and Disease, (New Jersey: Humana Press; ), pp. 103–110. [DOI] [PubMed] [Google Scholar]
- Noseda M, Harada M, McSweeney S, Leja T, Belian E, Stuckey DJ, Abreu Paiva MS, Habib J, Macaulay I, de Smith AJ, et al. (2015). PDGFRα demarcates the cardiogenic clonogenic Sca1+ stem/progenitor cell in adult murine myocardium. Nature Communications 2015 6:1 6, 1–16. [DOI] [PMC free article] [PubMed] [Google Scholar]
- Ono M, Masaki A, Maeda A, Kilts TM, Hara ES, Komori T, Pham H, Kuboki T, and Young MF (2018). CCN4/WISP1 controls cutaneous wound healing by modulating proliferation, migration and ECM expression in dermal fibroblasts via α5β1 and TNFα. Matrix Biology 68–69, 533–546. [DOI] [PMC free article] [PubMed] [Google Scholar]
- Oshima Y, Ouchi N, Sato K, Izumiya Y, Pimentel DR, and Walsh K. (2008). FollistatinLike 1 Is an Akt-Regulated Cardioprotective Factor That Is Secreted by the Heart. Circulation 117, 3099–3108. [DOI] [PMC free article] [PubMed] [Google Scholar]
- Pascual M, Vicente M, Monferrer L, and Artero R. (2006). The Muscleblind family of proteins: An emerging class of regulators of developmentally programmed alternative splicing. Differentiation 74, 65–80. [DOI] [PubMed] [Google Scholar]
- Pedregosa F, Michel V, Grisel O, Blondel M, Prettenhofer P, Weiss R, Vanderplas J, Cournapeau D, Pedregosa F, Varoquaux G, et al. (2011). Scikit-learn: Machine Learning in Python. [Google Scholar]
- Qiu X, Mao Q, Tang Y, Wang L, Chawla R, Pliner HA, and Trapnell C. (2017). Reversed graph embedding resolves complex single-cell trajectories. Nature Methods 2017 14:10 14, 979–982. [DOI] [PMC free article] [PubMed] [Google Scholar]
- Quijada P, Trembley MA, and Small EM (2020). The Role of the Epicardium During Heart Development and Repair. Circulation Research 126, 377–394. [DOI] [PMC free article] [PubMed] [Google Scholar]
- Quinn KP, Sullivan KE, Liu Z, Ballard Z, Siokatas C, Georgakoudi I, and Black LD (2016). Optical metrics of the extracellular matrix predict compositional and mechanical changes after myocardial infarction. Scientific Reports 2016 6:1 6, 1–12. [DOI] [PMC free article] [PubMed] [Google Scholar]
- Raudvere U, Kolberg L, Kuzmin I, Arak T, Adler P, Peterson H, and Vilo J. (2019). G:Profiler: A web server for functional enrichment analysis and conversions of gene lists (2019 update). Nucleic Acids Research 47, W191–W198. [DOI] [PMC free article] [PubMed] [Google Scholar]
- Reichardt IM, Robeson KZ, Regnier M, and Davis J. (2021). Controlling cardiac fibrosis through fibroblast state space modulation. Cellular Signalling 79, 109888. [DOI] [PMC free article] [PubMed] [Google Scholar]
- Richardson W, Clarke S, Quinn T, and Holmes J. (2015). Physiological Implications of Myocardial Scar Structure. Comprehensive Physiology 5, 1877. [DOI] [PMC free article] [PubMed] [Google Scholar]
- Rueden CT, Schindelin J, Hiner MC, DeZonia BE, Walter AE, Arena ET, and Eliceiri KW (2017). ImageJ2: ImageJ for the next generation of scientific image data. BMC Bioinformatics 2017 18:1 18, 1–26. [DOI] [PMC free article] [PubMed] [Google Scholar]
- Ruiz-Villalba A, Romero JP, Hernández SC, Vilas-Zornoza A, Fortelny N, CastroLabrador L, San Martin-Uriz P, Lorenzo-Vivas E, García-Olloqui P, Palacio M, et al. (2020). Single-Cell RNA Sequencing Analysis Reveals a Crucial Role for CTHRC1 (Collagen Triple Helix Repeat Containing 1) Cardiac Fibroblasts After Myocardial Infarction. Circulation 142, 1831–1847. [DOI] [PMC free article] [PubMed] [Google Scholar]
- Scharf GM, Kilian K, Cordero J, Wang Y, Grund A, Hofmann M, Froese N, Wang X, Kispert A, Kist R, et al. (2019). Inactivation of Sox9 in fibroblasts reduces cardiac fibrosis and inflammation. JCI Insight 4. [DOI] [PMC free article] [PubMed] [Google Scholar]
- Schindelin J, Arganda-Carreras I, Frise E, Kaynig V, Longair M, Pietzsch T, Preibisch S, Rueden C, Saalfeld S, Schmid B, et al. (2012). Fiji: an open-source platform for biological-image analysis. Nature Methods 2012 9:7 9, 676–682. [DOI] [PMC free article] [PubMed] [Google Scholar]
- Shimano M, Ouchi N, Nakamura K, van Wijk B, Ohashi K, Asaumi Y, Higuchi A, Pimentel DR, Sam F, Murohara T, et al. (2011). Cardiac myocyte follistatin-like 1 functions to attenuate hypertrophy following pressure overload. PNAS 108, E899–E906. [DOI] [PMC free article] [PubMed] [Google Scholar]
- Skelly DA, Squiers GT, McLellan MA, Bolisetty MT, Robson P, Rosenthal NA, and Pinto AR (2018). Single-Cell Transcriptional Profiling Reveals Cellular Diversity and Intercommunication in the Mouse Heart. Cell Reports 22, 600–610. [DOI] [PubMed] [Google Scholar]
- Small EM, Thatcher JE, Sutherland LB, Kinoshita H, Gerard RD, Richardson JA, Dimaio JM, Sadek H, Kuwahara K, and Olson EN (2010). Myocardin-related transcription factor-a controls myofibroblast activation and fibrosis in response to myocardial infarction. Circulation Research 107, 294–304. [DOI] [PMC free article] [PubMed] [Google Scholar]
- Stempien-Otero A, Kim DH, and Davis J. (2016). Molecular networks underlying myofibroblast fate and fibrosis. Journal of Molecular and Cellular Cardiology 97, 153–161. [DOI] [PMC free article] [PubMed] [Google Scholar]
- Sun C, Zhang H, and Liu X. (2020). Emerging role of CCN family proteins in fibrosis. Journal of Cellular Physiology jcp.30171. [DOI] [PubMed] [Google Scholar]
- Stuart Tim, and Srivastava Avi. Building trajectories with Monocle 3 • Signac. [Google Scholar]
- Trapnell C, Cacchiarelli D, Grimsby J, Pokharel P, Li S, Morse M, Lennon NJ, Livak KJ, Mikkelsen TS, and Rinn JL (2014). The dynamics and regulators of cell fate decisions are revealed by pseudotemporal ordering of single cells. Nature Biotechnology 2014 32:4 32, 381–386. [DOI] [PMC free article] [PubMed] [Google Scholar]
- Virtanen P, Gommers R, Oliphant TE, Haberland M, Reddy T, Cournapeau D, Burovski E, Peterson P, Weckesser W, Bright J, et al. (2020). SciPy 1.0: fundamental algorithms for scientific computing in Python. Nature Methods 17, 261–272. [DOI] [PMC free article] [PubMed] [Google Scholar]
- Wang ET, Cody NAL, Jog S, Biancolella M, Wang TT, Treacy DJ, Luo S, Schroth GP, Housman DE, Reddy S, et al. (2012). Transcriptome-wide Regulation of Pre-mRNA Splicing and mRNA Localization by Muscleblind Proteins. Cell 150, 710–724. [DOI] [PMC free article] [PubMed] [Google Scholar]
- Waskom M, Botvinnik O, Ostblom J, Gelbart M, Lukauskas S, Hobson P, Gemperline DC, Augspurger T, Halchenko Y, Cole JB, et al. (2020). mwaskom/seaborn: v0.10.1 (April 2020). [Google Scholar]
- White SJ, and Chong JJH (2020). Mesenchymal Stem Cells in Cardiac Repair: Effects on Myocytes, Vasculature, and Fibroblasts. Clinical Therapeutics 42, 1880–1891. [DOI] [PubMed] [Google Scholar]
- Wilkins BJ, Dai YS, Bueno OF, Parsons SA, Xu J, Plank DM, Jones F, Kimball TR, and Molkentin JD (2004). Calcineurin/NFAT Coupling Participates in Pathological, but not Physiological, Cardiac Hypertrophy. Circulation Research 94, 110–118. [DOI] [PubMed] [Google Scholar]
- Willems IE, Havenith MG, Mey J.G. de, and Daemen MJ (1994). The alpha-smooth muscle actin-positive cells in healing human myocardial scars. The American Journal of Pathology 145, 868. [PMC free article] [PubMed] [Google Scholar]
- Xavier-Neto J, Shapiro MD, Houghton L, and Rosenthal N. (2000). Sequential programs of retinoic acid synthesis in the myocardial and epicardial layers of the developing avian heart. Developmental Biology 219, 129–141. [DOI] [PubMed] [Google Scholar]
- Xiao Y, Hill MC, Li L, Deshmukh V, Martin TJ, Wang J, and Martin JF (2019). Hippo pathway deletion in adult resting cardiac fibroblasts initiates a cell state transition with spontaneous and self-sustaining fibrosis. Genes & Development 33, 1491–1505. [DOI] [PMC free article] [PubMed] [Google Scholar]
- Zheng GXY, Terry JM, Belgrader P, Ryvkin P, Bent ZW, Wilson R, Ziraldo SB, Wheeler TD, McDermott GP, Zhu J, et al. (2017). Massively parallel digital transcriptional profiling of single cells. Nature Communications 2017 8:1 8, 1–12. [DOI] [PMC free article] [PubMed] [Google Scholar]
Associated Data
This section collects any data citations, data availability statements, or supplementary materials included in this article.
Supplementary Materials
Data Availability Statement
Single cell RNAseq data have been deposited at Gene Expression Omnibus (GEO) repository and are publicly available now with the accession number GSE193308.
Any additional information including original western blots, RNAseq, microscopy images, and echocardiography reported in the paper is available through the lead contact upon request.
Experimental Models
Mice were bred and housed at the University of Washington. Rooms have controlled temperature and light/dark cycles with standard chow being provided ad libitum. MBNL1Fl mice were bred to homozygosity with either Tcf21iCre or PostniCre lines. Both male and female mice of each genotype were used for breeding in all lines. Tamoxifen induction of Cre recombinase expression was started between 6–8 weeks of age and achieved with 5 days of intraperitoneal (IP) injections of pharmaceutical grade tamoxifen dissolved in peanut oil (25mg/kg) followed by 9 additional days on tamoxifen citrate chow (400mg/kg body weight, Harlan Laboratories). Mice remained on Tam chow until the experimental end point unless stated otherwise. Sham or MI surgeries were performed after 2 weeks of Tam treatment, and hearts were harvested for cell or tissue analysis at the indicated time points following surgery. Experimentalists remained blinded to the genotypes until analysis was complete. Both male and female mice were used in all experiments and mice were randomly assigned to groups.
Method Details
Animal models
All animal experimentation was approved by the University of Washington’s Institutional Animal Care and Use Committee. Lineage reporter mice were generated by crossing a mouse containing a tamoxifen (Tam)-inducible Cre recombinase cassette knocked into the periostin locus (PostniCre) with mice containing a membrane targeted dual fluorescent reporter (mT/mG) knocked into the Rosa26 locus (Figure 1G). All cells in PostniCre-mT/mG mice express membrane-targeted TdTomato (mT) unless Cre is expressed which excises the TdTomato (mT) and moves a membrane-targeted green fluorescent protein (mG) sequence in frame for expression (Kanisicak et al., 2016; Muzumdar et al., 2007). Cardiac fibroblast specific MBNL1 overexpression mice (MBNL1 Tg-Tcf21iCre) were generated by crossing mice containing the human MBNL1 cDNA with mice containing a Tam-inducible Tcf21-Cre driver (Figure 2A, (Acharya et al., 2011, 2012; Davis et al., 2015)). Conditional MBNL1 knockout mice (MBNL1Fl/Fl) were generated using targeted C57BL/6 embryonic stem cells (ES) from the International Knockout Mouse Consortium (IKMC). Founders were bred onto a C57BL/6 background and then to mice expressing Flippase to excise the LacZ-neomycin cassettes still present within the floxed MBNL1 allele, as IKMC uses a knockout first approach for their targeted alleles. Once the LacZ-neomycin cassettes were flippedout, MBNL1Fl/Fl mice were crossed with Tcf21iCre or PostniCre to generate cardiac fibroblast and myofibroblast specific MBNL1 knockout mice (Figure 4A & 6A). Tamoxifen induction of Cre recombinase expression was started between 6–8 weeks of age and achieved with 5 days of intraperitoneal (IP) injections of pharmaceutical grade tamoxifen dissolved in 95% peanut oil and 5% ethanol (25mg/kg) followed by 9 additional days on tamoxifen citrate chow (400mg/kg body weight, Harlan Laboratories). Mice remained on Tam chow until the experimental endpoint unless stated otherwise.
Surgical Model of Myocardial Infarction
The surgical model was previously described (Bugg et al., 2020; Molkentin et al., 2017), but briefly 8-week-old mice were anesthetized using injectable ketamine and xylazine. Mice were mechanically ventilated through oral intubation and a lateral thoracotomy was performed to expose the left ventricle. The pericardium was removed, and the left anterior descending artery was permanently ligated more apically to reduce risk of rupture, using 8–0 Surgipro tapered suture. Two days prior to surgery mice were taken off Tam chow for 2 days to prevent any adverse effects of Tam during the surgical procedure and then put back on Tam chow until the studies endpoint. At harvest hearts were excised, rinsed in 1X phosphate buffered saline (PBS), and relaxed in saturated potassium chloride solution before being fixed in formaldehyde and prepped for paraffin or cryo- sectioning. Experimentalists remained blinded to the genotypes until analysis was complete. Both male and female mice were used in all experiments and mice were randomly assigned to groups. Echocardiography was performed on a Vevo2100 or Vevo3100 under isoflurane anesthetic.
In vivo proliferation following MI
Mice underwent MI procedure as stated above. Two boluses of EdU dissolve in PBS (100mg/kg) were injected IP at 24 hours and 9 hours before harvesting. Mice were then euthanized, and hearts fixed in 4% paraformaldehyde overnight. Tissues were then processed through a sucrose gradient (5–30%), embedded in optimal cutting temperature compound (OCT), and prepared for 5μm cryosectioning.
Human primary cardiac fibroblast isolation
Human cardiac fibroblasts were isolated from patients undergoing left ventricular assist device surgery as previously described (Carlson et al., 2017; Farris et al., 2017). Briefly heart samples were rinsed in cold PBS and minced in a 10mL of warm digestion buffer [HBSS, 30mM Taurine, 10mM HEPES, Liberase TH 5mg/mL DNase1 2000U]. The samples are then incubated for 5 minutes, triturated, allowed to gravity settle so the supernatant could be removed, and set off to the side for digestion of remaining tissue. New digestion buffer was added to the remaining tissue, and the process repeated until the tissue was fully digested. Fibroblasts were separated using a Miltenyi MACs magnetic separator positive selection for CD14. Samples were incubated in 1mL of sorting buffer [1XPBS, 0.5%BSA, 2μM EDTA] and 125μL of CD14 microbeads for 1 hour before sorting. Samples were then spun down and stored in TRIzol until RNA isolation. Healthy human fibroblasts were obtained from Promocell.
Mouse primary cardiac fibroblast isolation
Mice were heparinized and cardiac fibroblasts freshly isolated by Langendorff perfusion with type II collagenase (2mg/ml) and Liberase TH (0.4mg/ml) solubilized in Krebs-Henseleit buffer [113mM NaCl, 4.7mM KCl,0.6mM KH2PO4, 0.6mM Na2HPO4, 1.2mM MgSO4·7H2O, 12uM NaHCO3, 10uM KHCO3, 10.8uM Hepes] as previously described (Bugg et al., 2020; Molkentin et al., 2017). For culture experiments cardiac fibroblasts were plated in in Dulbecco’s Minimal Essential Media (DMEM) with high glucose and supplemented with 1% penicillin and streptomycin (P/S), and 20% fetal bovine serum (FBS) and kept at 37°C with 5% CO2. Cardiac fibroblasts were expanded to passages 3–5 for experimentation. For some experiments cell-permeant Cre recombinase (TATCre,1:100, EMD Millipore) was added to the cultures for 2 days to permanently excise MBNL1. For differentiation assays cells were cultured in differentiation media (DMEM + 1% FBS + 1% P/S) with or without recombinant TGFβ (R&D systems, 10 ng/mL) and analyzed 72 hours later by immunofluorescent staining described below. For proliferation assays cardiac fibroblasts were treated with 10μM EdU every 12 hours over 1 day in 2% FBS media. At the studies end point cardiac fibroblasts were fixed in 4% PFA and Click-iT chemistry (Invitrogen) used to detect EdU positivity per the manufacturer’s instructions.
In vitro cell treatments
Recombinant TGFβ (10 ng/ml, R&D System) was used to induce myofibroblast transformation. For experiments that used adenoviral gene transfer, cardiac fibroblasts were treated with adenovirus overnight followed by a media change and cells examined 3 days after induction. The following adenoviruses have been previously described: ΔCnA, SRF, GFP, and MBNL1 (Davis et al., 2012, 2015; Liu et al., 2001; Wilkins et al., 2004). An adenovirus expressing GFP was used as a control. Sox9 overexpression was obtained by transfecting cardiac fibroblasts with full length Sox9 cDNA using X-treme Gene transfection reagent (Sigma) diluted in Opti-MEM media at a 4:1 ratio of transfection reagent to plasmid. βgal plasmid was used for control transfections.
Collagen gel contraction assay
Cardiac fibroblasts were isolated, expanded and treated with adenovirus or TGFβ 24 hours prior to seeding into collagen gels as previously described (Davis et al., 2012; Ngo et al., 2006). Here 50,000 cardiac fibroblasts were seeded into each gel and then released from the plate into differentiation media (DMEM + 1% FBS + 1% P/S) once they had solidified. Gels were photographed and measured every 12 hours over 4 days. ImageJ software (NIH) was used to calculate the surface area, which are reported as values normalized to the initial size of the gel. Data shown is at 48 hours post seeding.
Transcript stability assay
Tam-treated MBNL1Fl/Fl and MBNL1Fl/Fl-Tcf21iCre cardiac fibroblasts were infected with either AdGFP (controls) or AdMBNL1 for 36 hours at which time transcription was inhibited with 2mg/ml Actinomycin-D (Sigma). RNA was isolated using a Qiagen RNeasy Mini kit from each group after 0, 4, and 8 hours of treatment, reverse transcribed, and analyzed by real-time PCR as previously described (Davis et al., 2015).
Flow cytometry for fibroblast purification
For PostniCre-mT/mG gene expression and RNA sequencing experiments cardiac fibroblasts were isolated and the subjected to flow cytometry as previously described (Molkentin et al., 2017). Briefly cells were strained through a 70 μm cell strainer and then stained with CD11b (1:50 Miltenyi Biotec 130–113-800) and MEFSK4 (1:50 Miltenyi Biotec 130–120-802) in HBSS with Ca2+, Mg2+ and 2%FBS. This allows for the removal of contaminating CD11b cells. Cells were then sorted on an Aria II live cell sorter. For PostniCre-mT/mG experiments the same antibody scheme was used but the MEFSK4+ GFP− and MEFSK4+ GFP+ populations were segregated to compare the populations. RNA isolation was then preformed using an RNAqueous Micro Kit which is specifically designed for low RNA yields. Gene specific amplification was used during cDNA synthesis to increase signal of target genes.
Single cell RNA sequencing and analysis
For single cell RNA sequencing, isolated cardiac fibroblasts were subjected to magnetic bead sorting using a Miltenyi QuadroMACS magnetic cell separation kit. Briefly, cells were strained through a 70 μm cell strainer and resuspended in 180uL of sorting buffer (1XPBS, 0.5%BSA, 2μM EDTA) and 20μL of Cd11b microbeads. Samples were mixed well and incubated for 15 minutes at 4°C. Samples were washed through the magnetic columns and the flow through (containing the Cd11b- fraction) was collected. The cells were spun and resuspend in 160uL of sorting buffer with 40μL of MEFSK4 (Anti-feeder) microbeads. Cells were again incubated for 15 minutes at 4°C and sorted using magnetic columns. The flow through was discarded, and the magnetic columns containing the MEFSK4+ fraction were removed and rinsed with sorting buffer. Viability was assessed at this point for all preps. Viability was greater than 90% for all samples. Cells were lysed as previously described (Alexanian et al., 2021). Briefly cells were spun and rinsed in 1x HBSS with no FBS. Pellets were resuspended in 200uL of Lysis buffer (Tris-HCl 10mM pH 7.4, NaCl 10mM, MgCl2 3mM, Tween-20 0.1%, NP40 0.1%, Digitonin 0.01%, in Nuclease-free water), pipetted 10 times and kept on ice for 5 minutes. Nuclei were wash with 1 mL of wash buffer [TrisHCl 10mM pH 7.4, NaCl 10mM, MgCl2 3mM, Tween-20 0.1%, in Nuclease-free water], inverting 3 times to mix. Nuclei were spun at 5000g for 3 minutes at 4°C. Nuclei were further washed in 1.2mL of 1X PBS with 1%BSA and filtered through a 30μm filter to remove any debris. Nuclei were counted using Trypan blue and a hemocytometer. Nuclei were resuspended at a concentration of 1000nuclei/μL in 1XPBS with 1%BSA with 8300 nuclei being loaded for subsequent 10X Genomics Chromium single cell RNAseq preparation.
Single cell droplet libraries were generated in the 10X Genomics Chromium controller according to the manufacturer’s instructions in the Chromium Single Cell 3′ Reagent Kit v.3.1 with Dual Indexing. Additional components used for library preparation include the Chromium Single Cell 3′ Library and Gel Bead Kit v.3.1 (PN- 2000164) and the Chromium Single Cell 3′ Chip kit v.3.1 (PN-120236). Libraries were prepared according to the manufacturer’s instructions using the Chromium Single Cell 3′ Library and Gel Bead Kit v.3.1 (PN- 2000164) and Chromium i7 Multiplex Kit (PN- 1000213). Final libraries were sequenced on the NextSeq 2000. All 14 samples were pooled and sequenced in one single lane. Sequencing parameters were selected according to the Chromium Single Cell v.3.1 specifications. Libraries were sequenced to a mean read depth of at least 20,000 total aligned reads per cell.
The Cell Ranger Single-Cell Software Suit (Zheng et al., 2017) was used to perform sample demultiplexing, barcode processing and single-cell 3′ gene counting. For each sample, reads were aligned to the Mouse (mm10) 2020-A premRNA reference genome using CellRanger count v6.1.1. CellRanger Aggr (v6.1.1) was used to aggregate count matrices across samples with normalize=none. Only confidently mapped reads with valid barcodes and unique molecular identifiers were used to generate the gene-barcode matrix. Further analyses for quality filtering was performed using the Seurat R package (Butler et al., 2018). We calculated the distribution of detected genes per cell and removed cells in the top 1% quantile or those which had fewer than 200 detected genes. Cells were removed with more than 15% of the transcripts coming from mitochondrial genes. After quality filtering, reads were normalized to account for technical variation in the dataset including sequencing depth. To do this, we implemented the SCTransform function (Hafemeister and Satija, 2019) with the “glmGamPoi” method (Ahlmann-Eltze and Huber, 2021); mitochondrial mapping percentage was also regressed out using the vars.to.regress argument. Principal component analysis was performed on the scaled data, and then cells were clustered on the first 18 principal components using the FindNeighbors function and the FindClusters function with resolution 0.5. To visualize the data, we used non-linear dimensional reduction via Uniform Manifold Approximation and Projection (UMAP) to project cells in 2D space on the basis of the first 18 principal components (McInnes et al., 2018). Nine fibroblast clusters were identified based on expression of Col1a1, Pdgfrα, and Postn, and seven clusters expressing markers of non-fibroblast populations, which likely represent contaminating non-fibroblast nuclei after fibroblast isolation. These non-fibroblast clusters were removed, and the clustering processes were repeated resulting in the identification of 13 fibroblast subpopulations. In total, we analyzed 20814 fibroblast nuclei (5302:NTG-SHAM, 5611:NTG-MI, 1831: MBNL1Fl/Fl-Tcf21iCre SHAM, 3163: MBNL1Fl/Fl-Tcf21iCre -MI, 2495: MBNL1 Tg-Tcf21iCre-SHAM, 2412: MBNL1 Tg-Tcf21iCre -MI) with a median of 2875.5 UMI per cell and 1322 unique genes per cell. Cluster markers were identified using the FindMarkers function with a Wilcoxon rank sum test; cell type identities were assigned to clusters by examination of top cluster markers, differential expression analysis between individual clusters, and consultation of previous single cell RNA sequencing datasets of isolated fibroblasts. Differential expression analysis between populations was completed using the FindMarkers function with the Wilcoxon rank sum test based on genes which were expressed in at least 10% of cells for at least one of the populations being compared and with an absolute log2 fold change greater than 0.25. Over-representation of GO terms in gene lists was calculated using the gost function in the Gprofiler (Kolberg et al., 2020) R package. We also performed pseudotime analysis using Monocle3 (Qiu et al., 2017; Trapnell et al., 2014) with the SeuratWrappers package as described in the tutorials (Tim Stuart and Avi Srivastava). Our Seurat object was converted into a CellDataSet object using the as.cell_data_set() function. Pseudotime estimates were calculated with the order_cells function with root nodes selected in in the F-SH2 and F-EPI populations. Pseudotime values were then extracted and added to our Seurat object. Single cell RNAseq data have been deposited at Gene Expression Omnibus (GEO) repository with the accession number GSE193308.
Cardiomyocyte isolation
Mouse ventricular myocytes were freshly isolated by Langendorff perfusion with Liberase TM (0.225 mg/mL, Roche) in Krebs-Henseleit buffer (135mM NaCl, 4.7mM KCl, 0.6mM KH2PO4, 0.6mM Na2HPO4, 1.2mM MgSO4, 20mM Hepes,10μM BDM, and 30mM Taurine) as previously described (Hegyi et al., 2020). Ventricular myocytes were dispersed mechanically and filtered through a 200μm nylon mesh then allowed to sediment for ~10 minutes. The sedimentation was repeated three times using increasing [Ca2+] from 0.125 to 0.25 then 0.5 mmol/L. Myocytes were plated on laminin coated coverslips in Tyrodes solution (137mM NaCl, 5.4mM KCl, 0.5mM MgCl2, 1.2mM CaCl2*2H2O, 10mM Hepes, and 5mM Glucose, 7.4 pH) for 1 hour prior to functional measurements or relaxed in 25μM blebbistatin and fixed with 4%PFA at room temperature for 15 minutes.
Myocyte morphology tracing
Myocytes were stained with a dilution of 1:100 Wheat Germ Agglutinin, Alexa Fluor™ 488 Conjugate (W11261) for 1 hour at room temperature. 40 cells per mouse were manually traced using Fiji.
Measurements of myocyte contractility
Sarcomere measurements were obtained from isolated myocytes using the IonOptix™ SarcLen Sarcomere Length Acquisition Module with a MyoCam-S3 digital camera (Ionoptix Co., Milton, MA) attached to an Olympus uWD 40 inverted microscope. For these measurements myocytes were bathed in 1.2mM Ca2+ Tyrode’s buffer (137mM NaCl, 5.4mM KCl, 0.5mM MgCl2, 1.2mM CaCl2*2H2O, 10mM HEPES, 5mM Glucose, 7.4 pH) and kept at 37°C. To jumpstart pacing, myocytes were stimulated with frequencies varying from 0.5, 1.0, and 1.5 Hz at 10V for a minimum of 10 contractions at each frequency. Sarcomere lengths were then measured in real time at a frequency of 0.5Hz and averaged across 10–15 contraction cycles. Blinded analysis was performed using the IonWizard software. Statistical analyses were performed on individual myocyte measurements (n ~ 30 myocytes/mouse; n=3). Significance was determined using Student’s t-test.
Gene expression analysis
Real time polymerase chain reaction (RT-PCR) methods are previously described from our laboratory (Bugg et al., 2020; Davis et al., 2012, 2015; Molkentin et al., 2017). Briefly, total RNA was extracted using RNAqueous Micro Kit for all flow sorted samples or using QIA shredder homogenization and the Qiagen RNeasy kit for in vitro culture. Total RNA was reverse transcribed into cDNA using random hexamer primers and SuperScript III first-strand synthesis kit (Invitrogen) according to the manufacturer’s instructions. RT-PCR was performed on a CFX96 Real-Time System with a Biorad C1000 Touch Thermal Cycler using Sso Advanced SYBR Green (Biorad). Thermocycler conditions were as follows: Polymerase Activation and DNA Denaturation at 95°C for 30s, Denaturation at 95°C for 5s, Annealing/Extension and Plate Read at 56°C for 30s. 39 cycles of denaturation and annealing were performed. Fold changed in gene expression was determined using the 2ΔΔCT method. Any differences in cDNA were correct by calculating the difference (ΔCT) between the target gene’s threshold cycle (CT) and the CT for 18s, which serves as the housekeeping gene. Primer list can be found in Supplemental table 1.
Bulk RNA Sequencing (RNAseq)
FACs sorted cell pellets were snap frozen and stored at −80°C until all samples were collected. Total RNA was extracted using RNAqueous Micro Kit and RNA libraries were generated using a Tecan Trio library prep kit, using 2ng of total RNA following manufacturers protocol. 4 PCR cycles were run for full length cDNA amplification. Libraries were pooled and sequenced through an external provider. Cleaned RNAseq reads were uploaded to the public Galaxy server at usegalaxy.org for bioinformatic analysis (Afgan et al., 2018). Reads were aligned using HISAT2 to the mm10 reference genome, summarized using featurecounts, and differential expression between timepoints and genotypes were tested using DESeq2 (Kim et al., 2019; Liao et al., 2014; Love et al., 2014). Genes with an adjusted p < 0.05 were considered significantly differentially expressed. PCA was performed on the log2 normalized counts matrix from DESeq2 using the scikit-learn package (Pedregosa et al., 2011). Heatmaps and gene expression scatterplots were generated from the log2 normalized counts output from DESeq2 using the seaborn package in Python (Waskom et al., 2020). Functional enrichment analysis was conducted using the GProfiler web app, inputting all significant differentially expressed genes as an ordered query (Raudvere et al., 2019). To assess time course expression of clustered, a pairwise correlation matrix between time course-significant genes was calculated, hierarchically clustered using the scipy package in Python, and plotted with seaborn (Virtanen et al., 2020; Waskom et al., 2020). Functional enrichment analysis on genes from each cluster was performed using GProfiler, and log2 normalized gene expression levels per cluster were calculated and plotted over time using seaborn (Raudvere et al., 2019).
Western blot
Tam-induced MBNL1Fl/Fl and MBNL1Fl/Fl-Tcf21iCre fibroblasts treated with 10ng/ml TGFβ and cell lysates were collected 48 hours later in RIPA buffer [5 M NaCl, 10% Triton-X 100, 25%SDS, 1 M Tris-Cl PH 7.4]. Lysates were diluted in Laemmli buffer with DTT, 20μg of protein was loaded into 10% SDS-PAGE acrylamide gels and transferred to PVDF membrane for immunodetection. MBNL1 was detected with anti-MBNL1 (1:100, rabbit polyclonal antibody, Abcam) overnight at 4°C with goat anti-rabbit HRP conjugate secondary at 1:10,000 from EMD Millipore for 1 hour. Anti-GAPDH (1:10,000, mouse monoclonal, Fitzgerald Industries) overnight at 4°C with goat antimouse HRP conjugate at 1:10,000 from EMD Millipore for 1 hour was used as a loading control.
Histology and immunohistochemistry
Hearts were cut in half on the transverse plane prior to processing and sectioning. 5μm paraffin sections were obtained for Sirius Red/Fast Green staining (0.1% Direct Red 80, 0.1% Fast Green in Picric Acid). This method stains muscle tissue in green and fibrotic scar in red. Images of whole hearts were taken at 2x magnification and quantified in ImageJ using color thresholding. Serial sections were then used for αSMA (1:500 Sigma) and IsolectinB4 (IB4) (10ug/mL Vector Biolabs) staining to quantify myofibroblast number in paraffin. Sox9 (1:500, Millipore) and PDGFRα (1:100 R&D systems) staining was done on independent OCT samples. Collagen 3a1 (1:250 Santa Cruz) and Collagen 5a1 (1:250 Santa Cruz) were stained on serial OCT sections. Slug (1:100, Santacruz), Tbx18 (1:500, Santacruz), and Wt-1 (1:1000, Santacruz) were co-stained with PDGFRα (1:100 R&D systems) in OCT sections. These methods are previously described from our laboratory. Here sections were deparaffinized (or in the case of OCT sections they were just rinsed in 1XPBS) and the blocked in PBS with 1% BSA and 0.1% cold fish skin gelatin. Primary antibodies were incubated overnight in blocking solution at 4°C (Bugg et al., 2020; Molkentin et al., 2017). AlexaFluor secondary antibodies (1:1000 Invitrogen) were used for 1.5 hours at room temperature to detect the antigen. Hoechst (1:2000 Thermo Fisher) was used to visualize Nuclei. Additional groups were incubated in primary or secondary antibody alone to control for nonspecific signaling for imaging analysis. To visualize EdU staining in vivo Click-iT chemistry was used following the manufactures instructions with the substitution of normal horse serum (NHS) for PDGFRα (1:100 R&D systems) co-staining. To visualize cellular death, serial sections were stained using the Roche In Situ Cell Death Detection Kit (TMR red, Roche 12156792910) according to manufacturer’s recommendations. To permeabilize the samples prior to TUNEL labeling, slides were incubated with 1X Biogenenx Antigen-Retrieval Solution for 15 min at 80˚C and 0.1% Triton, 0.1% Sodium Citrate Tribasic dihydrate for 8 min at room temperature. Following TUNEL labeling, slides were blocked in PBS containing 2% BSA, 2% Normal Goat Serum (NGS), 0.1% NP40 and co-stained with Hoechst and α-Actinin (1:200 Sigma-Aldrich) or PDGFRα (1:100 R&D Systems) to assess myocyte or fibroblast-specific cell death. Wash steps were performed with PBS containing 0.5% Triton. All samples were mounted using Mowiol 4–88.
Immunocytochemistry
Immunofluorescence staining procedures followed previously described methods (Bugg et al., 2020; Molkentin et al., 2017). Briefly, cardiac fibroblasts were fixed in 4% paraformaldehyde, permeabilization in 1X PBS containing 0.1% Triton-X100, and blocked in PBS containing 0.1% Triton-X100 and 10% Normal Goat Serum (NGS). Primary antibody for αSMA (1:500 Sigma) was incubated at room temperature for 2 hours. AlexaFluor secondary antibodies (1:1000 Invitrogen) were used for 1.5 hours at room temperature to detect the antigen. Hoechst was added with secondary antibody used to visualize nuclei. Additional groups were incubated in primary or secondary antibody alone to control for non-specific signaling for imaging analysis. Samples were mounted using Mowiol 4–88.
Image analysis
To quantify αSMA+ or EdU+ fibroblasts in vitro, cells were manually counted across 10 representative fields of view (FOVs) and normalized to the total number of nuclei to get a percent of total population. To score the number of αSMA+ myofibroblasts in baseline MBNL1 Tg-Tcf21iCre mice and NTG-Tcf21iCre control hearts, the entire cross section of a heart was imaged and the total number of αSMA+IB4− cells were manually scored. Since there are so few cells in these hearts they are shown as raw values and not normalized to fibroblast number or heart area. For infarcted tissue 9–16 FOV of the infarct and border zone were imaged and the number of αSMA+IB4− cells were scored and then normalized to the average number of cells per FOV. This same technique was used for Sox9+PDGFRα+ analysis. For in vivo proliferation quantification we first scored for the total number of PDGFRα+ fibroblasts in the infarct and border zone using the Cell Counter Plugin in Fiji (NIH). Then the Click-iT staining was overlaid with the PDGFRα signal, and we scored for the number of PDGFRα+EdU+ allowing us to calculate the percent of the total fibroblast population that was proliferating. To quantify cell death, three FOV images were taken in the infarct regions and number of TUNEL+/α-Actinin+ and TUNEL+/PDGFRα+ nuclei were counted. This values were compared to overall number of TUNEL+ nuclei to achieve percent myocyte and fibroblast death in the infarct zones. Collagen 3a1 and 5a1 intensity was measured across the infarct using cell profiler and intensity was normalized to overall Hoechst intensity.
Analysis of collagen birefringence
Images of the left ventricular infarct zone were taken at 40x magnification with 3 FOV imaged per mouse. Filters were used to reduce the amount of bright light and the polarizer was rotated to 90 degrees. This produced images with a very black background and bright collagen birefringence. Analysis of collagen birefringence was completed using HSB color thresholding in Fiji (Hue categories: Red/White 2–235 without pass, Red/Orange 3–21, Yellow/Green 24–120). The percent area of each color category was then normalized to the total fiber area from Hue 120–235 without pass.
RNA immunoprecipitation in cardiac fibroblasts
Cardiac fibroblasts were isolate as stated above. Cells were passaged twice and treated with AdMBNL1 (MOI=500) for 48hours. Fibroblasts were scraped in cold 1X PBS and pelleted by centrifugation for 3 minutes at 1000rpm. Cells were then lysed in RIP buffer [150mM KCl, 25mM Tris-HCl pH 7.4, 5mM EDTA, 0.5% NP-40, 0.5mM DTT, 100U/mL RNAse OUT Recombinant Ribonuclear Inhibitor (ThermoFisher 10777019), and 1X complete EDTA-free Protease Inhibitor Cocktail (Sigma 11836170001)]. Lysates were mechanically sheared by Dounce homogenization using 18 strokes. Nuclear membrane and debris were pelleted by centrifugation at 13000 rpm for 10 minutes at 4°C. For each IP, 10% of the input lysate was placed directly into Trizol; lysates were then incubated overnight with 5μg of either Rabbit-anti-FLAG (Sigma F7425) or Rabbit IgG Isotype control (Cell Signaling 3900S) antibody at 4oC with gentle rotation. Following overnight incubation, 40μl of Dynabeads Protein A (ThermoFisher 10001D) were washed 6x in RIP buffer and then added to RIP lysates for 1 hour at 4oC with gentle rotation. Beads and bound material were collected using a DynaMag magnet, and the beads were washed 6x in RIP buffer and 1x in 1x PBS containing 0.5mM DTT, 100U/mL RNAse OUT, and 1x complete EDTA-free Protease Inhibitor Cocktail. Following washing, Trizol was added to isolate bound RNA. Following RNA isolation and cDNA conversion, Cdkn1a, Sox9 and Fstl1 transcripts were quantified by qPCR and analyzed using the percent input method.
Decellularization and collagen alignment analysis
Hearts were excised and retrograde perfused briefly with 1X phosphate buffered saline (PBS), then perfusion decellularized for 12 hours with a 1% aqueous solution of SDS, followed by a 1hour wash of 1% Triton-X 100 to remove residual SDS. Hearts were then washed extensively in deionized H2O and mounted in a 1% wt/vol agarose hydrogel for imaging. Second harmonic images were obtained on an Olympus FV1000MP multiphoton microscope with 860nm excitation (MaiTai DeepSee HP, 59% power) and 420–460nm emission. Z-stacks of 20 images with 1.8μm spacing were obtained at 25x magnification and 2.0 zoom in the border and infarct regions, then converted to maximum intensity projections in ImageJ 2.3.0(Rueden et al., 2017; Schindelin et al., 2012). Fiber metrics were quantified using CurveAlign 4.0 using the CT-Fire Fibers mode and default parameters(Liu et al., 2017).
Quantification and Statistical Analysis
Time course plots (Figure 1C–E) were generated with 95% confidence intervals using the pointplot function in seaborn (Waskom et al., 2020). Prism versions 7 asnd 8 were used for plotting all other data and statistical analysis. Data are represented as mean ± SEM. 2-way ANOVA with Tukey post hoc analysis was used for multiple comparisons. Two-tailed t-tests were used for pairwise comparisons with a p < 0.05 considered significant.