

Abstract
P‐glycoprotein (P‐gp, MDR1) is expressed at the blood–brain barrier (BBB) and restricts penetration of its substrates into the central nervous system (CNS). In vitro MDR1 assays are frequently used to predict the in vivo relevance of MDR1‐mediated efflux at the BBB. It has been well established that drug candidates with high MDR1 efflux ratios (ERs) display poor CNS penetration. Following a comparison of MDR1 transporter function between the MDR1‐MDCKI cell line from National Institutes of Health (NIH) and our internal MDR1‐MDCKII cell line, the former was found to provide better predictions of in vivo brain penetration than our in‐house MDR1‐MDCKII cell line. In particular, the NIH MDR1 assay has an improved sensitivity to differentiate the compounds with ERs of <3 in our internal cell line and is able to reduce the risk of false negatives. A better correlation between NIH MDR1 ERs and brain penetration in rat and non‐human primate (NHP) was demonstrated. Additionally, a comparison of brain penetration time course of MDR1 substrates and an MDR1 non‐substrate in NHP demonstrated that MDR1 interaction can delay the time to equilibrium of drug concentration in the brain with plasma. It is recommended to select highly permeable compounds without MDR1 interaction for rapid brain penetration to produce the maximal pharmacological effect in the CNS with a quicker onset.
Keywords: CNS penetration, MDR1 assay, MDR1 efflux transporter
Abbreviations
- A
apical
- B
basolateral
- BBB
blood–brain barrier
- BCRP
breast cancer resistance protein
- CNS
central nervous system
- ER
efflux ratio
- Kp,uu
partition coefficient
- LC‐MS/MS
liquid chromatography‐tandem mass spectrometry
- MDCK
Madin–Darby canine kidney
- MDR1
multidrug resistance protein1
- MEM
minimal essential medium
- PBS
phosphate‐buffered saline
- P‐gp
P‐glycoprotein
1. INTRODUCTION
The blood–brain barrier (BBB) is a physiological barrier formed by brain capillary endothelial cells with tight junctions, 1 , 2 which restricts penetration of compounds into the brain. Brain penetration is essential for compounds with the site of action in the central nervous system (CNS), whereas for compounds that target peripheral sites, BBB penetration may need to be minimized to reduce potential CNS‐related side effects. Therefore, it is critical to design and select compounds with appropriate brain penetration properties for drug targets that reside within or outside the CNS during the drug discovery phase. The kinetics of brain drug penetration consists of two aspects: the extent of drug distribution to the brain (vs. blood) at equilibrium and the time required to achieve brain distribution equilibrium. The extent of brain distribution at equilibrium is often quantified by the brain‐to‐plasma partitioning coefficient or concentration ratio based on either total or unbound drug concentrations at steady state (Kp and Kp,uu). 3 , 4 , 5 Because only the unbound drug is expected to bind to the target 6 , 7 and produce therapeutic effects, the brain‐to‐plasma Kp,uu is considered more pharmacologically relevant and widely used to describe the extent of brain penetration. It is well known that brain‐to‐plasma Kp,uu depends on the contribution of uptake and efflux transporters to drug transport at the BBB. 8 If no drug transporters contribute significantly to brain penetration, free drug concentration of non‐acids in the brain should theoretically be equal to the free drug concentration in plasma at steady state, and the brain‐to‐plasma Kp,uu should be 1.
P‐glycoprotein (P‐gp, MDR1, ABCB1) is an important efflux drug transporter that is highly expressed at the BBB and functions to actively efflux compounds out of the brain, thereby limiting the extent of CNS drug penetration. The fact that very few marketed CNS drugs are substrates of human MDR1 transporter highlights its important role in CNS drug penetration. 9 , 10 However, prediction of human brain penetration for substrates of MDR1 using preclinical models is challenging because of the throughput, cost, and potential species differences in transporter affinity and expression. 11 , 12 Thus, it is desirable to develop a robust and high throughput human MDR1 transporter assay to rapidly deselect MDR1 substrates during CNS drug discovery and development. Literature data have suggested a good in vitro to in vivo correlation (IVIVC) with the MDR1 assay and demonstrated that in vitro MDR1 substrate assays can help quantitatively predict the extent of CNS penetration of drug candidates and guide chemistry SAR to minimize the liability of MDR1 interaction. 10 , 13 , 14 , 15 Therefore, development of an in vitro MDR1 transporter assay with a high fidelity to characterize compound interactions with MDR1 is crucial to understand the impact of MDR1 efflux transporters on CNS penetration and help quantitatively predict CNS penetration in vivo.
Our current MDR1‐MDCKII cells were developed internally previously, and the MDR1 assay had been validated with the well‐established MDR1 substrates, for example, quinidine and verapamil. The current MDR1‐MDCKII cells had been used to support multiple projects, but we recently discovered that the current MDR1 assay was not able to differentiate compounds with MDR1 efflux ratios (ERs) of <3. As a result, compounds with MDR1 ERs of <3 could have a high or a low CNS penetration in rat brain‐to‐plasma Kp,uu studies. Therefore, the correlation between in vitro MDR1 assay and in vivo rat brain penetration was suboptimal. In order to develop a higher resolution in vitro MDR1 assay to support drug discovery efforts, an MDR1‐MDCKI cell line from National Institutes of Health (NIH) laboratories was validated and compared with our current MDR1‐MDCKII cell line. A set of internal compounds from Vertex projects with available brain penetration data in rats and non‐human primates (NHPs), was identified to provide relevant in vivo context for the interpretation of the in vitro MDR1 assay. The data from the in vitro MDR1 assay were compared with brain exposure in rats and NHPs to assess the correlation between the in vitro MDR1 assay and in vivo brain penetration.
Although the extent of brain penetration or achievement of high brain Kp,uu is the most important attribute for compounds targeting the CNS, the time to reach distribution equilibrium in the brain could be another vital property when time to onset of pharmacological action is important. Many diseases, such as acute pain, 16 hypnosis, 17 status epilepticus, 18 and stroke, 19 require compounds to have a fast CNS penetration to enable rapid onset of action. Previous studies have suggested that high passive permeability is required for a fast brain penetration. 8 , 20 , 21 In addition to passive permeability at the BBB, it is valuable to evaluate the effect of P‐gp efflux on the time to reach brain equilibrium, which could help develop strategies to select rapidly brain‐penetrant compounds in CNS drug discovery.
The main goal of our studies was to evaluate the performance of in vitro human MDR1 assays so that appropriate strategies can be deployed for profiling new chemical entities with MDR1 interactions in relation to their distribution in the CNS. Additional insights were obtained regarding the impact of MDR1 efflux on the time for brain concentration to reach equilibrium with plasma concentration. The learnings can help develop strategies for discovery of optimal CNS‐penetrant drugs.
2. MATERIALS AND METHODS
2.1. Materials
The human MDR1‐transfected MDCKII cell line (MDR1‐MDCKII) was generated at Vertex Pharmaceuticals, and the human MDR1‐transfected MDCKI cell line (MDR1‐MDCKI) was obtained from NIH Laboratory. MDR1‐MDCKII and MDCKII cells were cultured in media consisting of Dulbecco's Modified Eagle's Media (low glucose), 25 mM HEPES, 10% fetal bovine serum, 1% non‐essential amino acids, and 100 units/ml penicillin/streptomycin at 37°C, 5% CO2 and 85% relative humidity. MDR1‐MDCKI cells were cultured in media consisting of Dulbecco's Modified Eagle's Media (high glucose), 10% fetal bovine serum, 5 mM L‐glutamine, 80 ng/ml colchicine, and 50 units/mL penicillin/streptomycin at 37°C, 5% CO2 and 85% relative humidity.
2.2. Transporter transwell assays
A high‐throughput, 96‐well transwell assay method similar to that described previously 10 was used. On day 1, MDR1‐MDCKI, MDR1‐MDCKII and MDCKII cells were seeded at a density of 60 000 cells/cm2 onto Corning (Corning, NY) 96‐well cell culture plates (1 µm pore size, 0.143 cm2 growth areas). The cell monolayers were cultured at 37°C, 5% CO2 and 85% relative humidity. The assays were performed on day 4.
Monolayer integrity, positive controls, and recovery were routinely measured to make sure that data were reportable. Lucifer Yellow A‐B transport was less than 2% in every experiment to ensure monolayer integrity. The high permeability control was metoprolol and the positive control for MDR1 was quinidine. All data for controls were within the acceptable range before the data were reported. Recovery was above 70% in every experiment.
2.3. Transwell assay procedures
All transwell assays were performed in HBSS buffer. To increase recovery of compounds with high nonspecific binding, 0.1% BSA was added to the receiver chamber. Transwell assays were performed at 1 µM concentration of compounds (≥100 µM stock solutions diluted into buffer). Transporter studies started by adding compound solutions into donor chambers and measuring appearance of compounds in receiver chambers after 90 min. Before incubation, donor samples at 0 min were collected. After 90 min of incubation, samples were collected for both donor and receiver chambers. Post‐experimental incubation of lucifer yellow (100 µM, A‐B transport) was carried out to confirm the integrity of the cell monolayer during incubation of test compounds.
2.4. Transwell data analysis
The methods similar to that reported previously 10 were used to determine compound apparent permeability (P app) values for transwell studies. P app values of the test compounds were determined using the following equation:
where dQ/dt is the rate of appearance of the test compounds in the receiver compartment, A is the surface area of the membrane (0.143 cm2), C0 is the initial concentration (at 0 min) of test compounds in donor chamber.
The ER was calculated by the following equation:
2.5. Rat brain‐to‐plasma Kp,uu experiment
All animal studies were conducted in accordance with the animal care and use procedures approved by Vertex IACUC. Male Sprague Dawley rats (Charles River Laboratories, Hollister) were allowed access to food and water ad libitum and were administered compounds via oral gavage at 3 to 30 mg/kg depending on compound clearance and oral bioavailability to achieve sufficient systemic exposure. At 1–4 h (T max) post dose, blood (~ 0.3 ml) was collected into tubes containing K2EDTA, centrifuged, and plasma was collected and stored at approximately −80°C prior to bioanalysis. The rats were anesthetized, and the organs were systemically perfused; brain tissues were removed, weighed, and stored at approximately −80°C prior to analysis.
2.6. NHP brain‐to‐plasma and CSF‐to‐plasma Kp,uu experiment
All NHP brain and CSF Kpuu studies were performed using animals already assigned for termination. Compounds were administered either individually or as a cassette of three compounds to three or four cynomolgus monkeys via oral gavage at a dose volume of 5 ml/kg. At 2–4 h (~T max) post‐dose, blood was collected via a femoral vein into tubes containing K2EDTA and then centrifuged to obtain plasma. CSF was collected from the lumbar spinal region following euthanasia. The brain was excised, rinsed with saline and blotted dry as appropriate, weighed, and frozen at approximately −80°C until analysis.
2.7. NHP brain‐to‐plasma and CSF‐to‐plasma Kp,uu time course experiment
NHP brain‐to‐plasma Kp,uu studies were performed using NHPs already assigned for termination. Three compounds (antipyrine, Vertex proprietary compounds A and B) were co‐formulated in 10% captisol in sterile water and were administered intravenously as a 15 min infusion via a saphenous or cephalic vein to a total of six cynomolgus monkeys. Blood, CSF, and brain were collected from 2 animals/time point at approximately 17, 30, and 60 min after the start of the infusion. Blood was taken from the vena cava into tubes containing K2EDTA and was centrifuged to obtain plasma. The CSF and brain were collected using the similar procedure as described earlier.
2.8. Plasma protein binding and brain tissue binding
The methods similar to that reported previously were used to measure plasma protein binding and tissue binding. 22 A Rapid Equilibrium Device (RED) (Thermo Fisher Scientific) was used for free fraction determination in plasma and tissue homogenates. On the day of the experiment, brains were homogenized with an Omni TH Handheld tissue homogenizer in PBS at a 1:3 ratio (weight:volume). 200 µl aliquots of brain homogenates and plasma samples were loaded into RED device (donor or red side), and 350 µl of PBS was loaded in the receiver or white side. The RED device was agitated gently on a shaking platform at 150 rpm in a CO2 incubator (5% CO2) for 18 h at 37°C with saturating humidity. After 18 h of incubation, 20 µl samples from the plasma and buffer side of each RED well were added into an equal amount of the opposite blank matrix. The samples were mixed with 300 µl of internal standard solution in acetonitrile to precipitate proteins. The samples were then vortexed and centrifuged, and the supernatants were injected for LC‐MS/MS analysis.
If dilution was involved, the following formula was used for calculating fraction unbound F u from F u’:
where D = dilution factor (e.g., 4 for brain homogenate in this study); Fu’ = Fraction unbound in diluted matrix
2.9. Sample analysis by LC‐MS/MS
LC‐MS/MS was used for the analysis of transporter study samples and determination of plasma, CSF and brain concentrations. Agilent 1200 Infinity HTS series HPLC binary pumps coupled with CTC. Analytics PAL (LEAP) autosamplers interfaced with Applied Biosystems Sciex API 4500 or 5500 QTrap mass spectrometers were used for LC‐MS/MS analysis of transporter study samples. The LC separation was carried out on a Bona‐Agela (Wilmington, DE) Unisol C18 reversed‐phase HPLC column (2.1 × 30 mm, 5 μm). The mobile phase A was 10 mM ammonium acetate aqueous solution (pH 4.0), and the mobile phase B was 50:50 (v/v) acetonitrile‐methanol. The eluting gradient was 0 to 99% B from 0.0 to 0.5 min at flow rate of 1.0 ml/min, 99% B from 0.5 to 0.9 min at flow rate of 1.0 ml/min, 99% B from 0.91 to 1.0 min at flow rate of 1.8 ml/min, 0% B from 1.01 to 1.08 min at flow rate of 1.8 ml/min, and 0% B from 1.09 to 1.1 min at flow rate of 1.0 ml/min. Multiple reaction monitoring MS/MS was used to measure test compounds and internal standard simultaneously.
The brain was homogenized with PBS (1:3 weight:volume) before analysis. Plasma, CSF, and brain homogenates were protein‐precipitated with organic solvents, and the supernatant was analyzed by LC‐MS/MS against standard curves as described below.
Compound solid was dissolved in DMSO to obtain a 1 mg/ml stock, and the spiking solutions were prepared with serial dilutions. Rat or monkey plasma calibration standards and quality control (QC) samples were prepared by adding 10 µl of the compound spiking solutions into 390 µl of plasma to the achieve desired dynamic ranges. 20 μl of plasma or CSF or brain homogenates were aliquoted; matrix differences were compensated with blank plasma, blank CSF or blank brain homogenates accordingly, then protein‐precipitated with 480 μl of internal standard solution containing 10.0 ng/ml of VRT‐125070 in 0.1% formic acid:acetonitrile:methanol (20:40:40). The samples were thoroughly mixed before centrifugation at 12 000 rpm for 10 min to obtain supernatant for LC/MS/MS analysis. 10 μl of the supernatant was injected using the CTC PAL autosampler. The LC system consisted of Shimadzu LC with mobile phases of 0.1% formic acid in water (A) and 0.1% formic acid in acetonitrile (B), and a Phenomenex Synergy C8 (3u, 30 mm × 2 mm) column. The flow rate was 0.5 ml/min, with a generic gradient (the initial gradient starting at 10% B, and increasing in linear fashion to 90% B from 0.5 to 2 min). Multiple reaction monitoring was performed using Applied Biosystems (Foster City, CA) Sciex API 4000 or 5000 mass spectrometers for compound and internal standard measurements.
All authors consciously assure that the following are fulfilled: (1) This material is the authors’ own original work, which has not been previously published elsewhere. (2) The paper is not currently being considered for publication elsewhere. (3) The paper reflects the authors’ own research and analysis in a truthful and complete manner. (4) The paper properly credits the meaningful contributions of co‐authors. (5) The results are appropriately placed in the context of prior and existing research. (6) All sources used are properly disclosed (correct citation). (7) All authors have been personally and actively involved in substantial work leading to the paper and will take public responsibility for its content.
3. RESULTS
3.1. Functional comparison between our current MDR1‐MDCKII cell line and the MDR1‐MDCKI cell line from NIH laboratories
Recently, we discovered that our internal MDR1‐MDCKII assay did not have the resolution to differentiate compounds with MDR1 ERs of <3. As such, we have been striving to identify an improved MDR1 cell line which can better differentiate compounds with ERs of <3. A set of ~70 proprietary compounds from discovery projects with ERs of <3 in our current MDR1 assay was selected to compare the functional MDR1 activity between our existing MDR1‐MDCKII cell line and an alternative MDR1‐MDCKI cell line from the NIH laboratories. Figure 1 shows the comparison of ERs in two cell lines for this set of compounds. The data in Figure 1 clearly indicated that over the ER range of 1 to 3 in our current MDR1 assay, the NIH MDR1 cell line demonstrated a substantially greater dynamic range, with ERs ranging from 1 to ~30. Interestingly, for compounds with ERs of >3 in our existing MDR1 assay, the ERs generated from the two cell lines were aligned with each other, but ERs from NIH MDR1 were mostly higher than ERs from our current MDR1 assay (Figure 2). These data suggest that NIH MDR1 assay has higher MDR1 efflux activity, is more sensitive, and provides higher resolution for differentiating compounds with MDR1 ERs of <3 in our current assay.
FIGURE 1.
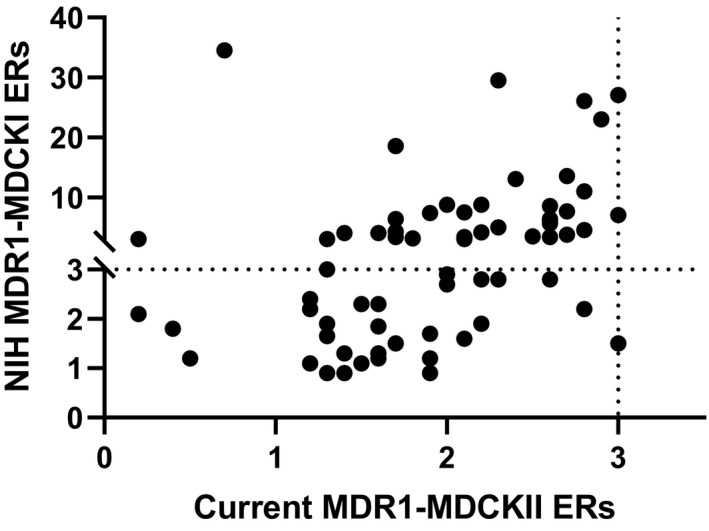
Comparison of efflux ratios (ERs) between NIH MDR1‐MDCKI and our current MDR1‐MDCKII for a set of compounds from discovery projects with ERs < 3. ER of 3 is used as the cutoff to classify MDR1 substrates in both NIH MDR1‐MDCKI cells and our current MDR1‐MDCKII cells. ER equals to B_A Papp (n = 3) divided by A_B Papp (n = 3) in different cell lines
FIGURE 2.
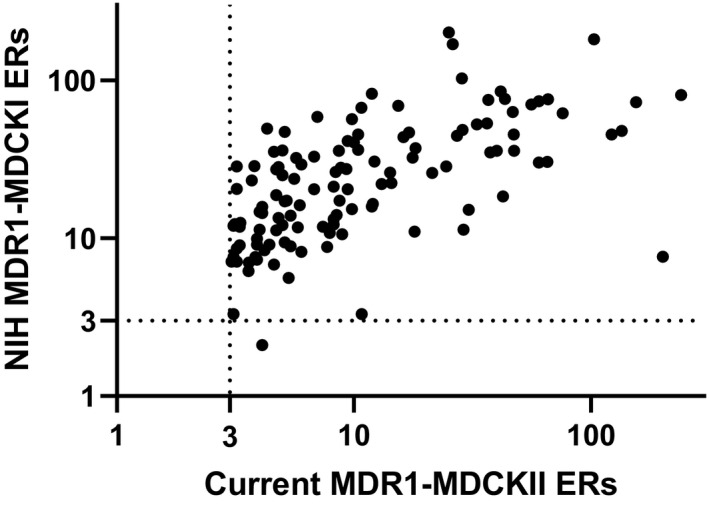
Comparison of efflux ratios between NIH MDR1‐MDCKI and our current MDR1‐MDCKII for a set of compounds from discovery projects with efflux ratios >3. Efflux ratio of 3 is used as the cutoff to classify MDR1 substrates in both NIH MDR1‐MDCKI cells and our current MDR1‐MDCKII cells. Efflux ratio equals to B_A Papp (n = 3) divided by A_B Papp (n = 3) in different cell lines
3.2. Correlation between MDR1 assay and brain‐to‐plasma Kp,uu in rats
A set of proprietary compounds with brain‐to‐plasma Kp,uu data in rats was selected to compare the correlation with the ERs generated from our internal MDR1‐MDCKII cells or the MDR1‐MDCKI cells from NIH (Figure 3). Based on internal validation using the reported positive and negative controls of MDR1 substrates in literature, an ER of 3 was determined as the cutoff to classify MDR1 substrates in both internal MDR1 and the NIH MDR1 assays. Similarly, a brain‐to‐plasma Kp,uu of greater than 0.5 was identified as a cutoff to classify compounds as freely CNS penetrant versus those with impaired CNS penetration due to efflux transport. Figure 3 shows the correlation between MDR1 ERs from our internal cell line and those from the NIH cell line with brain Kp,uu in rats. For our internal MDR1 cell line, all compounds are in quadrants 2, 3, and 4, whereas, for NIH MDR1 cell line, all compounds are in quadrants 2 and 4 except the one compound which is in quadrant 3. The data indicate that when ERs from two cells lines were higher than the cutoff of 3, the brain Kp,uu values in rats were lower than 0.5. Thus, when compounds were identified as MDR1 substrates in vitro, they exhibited impaired CNS penetration in rats, as expected. Interestingly, 14 out of 21 compounds with ERs <3 from our existing MDR1 assay exhibited brain Kp,uu values lower than 0.5 suggesting that some compounds classified as MDR1 non‐substrates in our current in vitro MDR1 assay could have impaired brain penetration. Consequently, our current MDR1 assay could generate false negatives as efflux substrates. In contrast to our internal MDR1 cell line, NIH MDR1 ERs correlated with brain Kp,uu in rats much better. This was due to the fact that a fraction of the compounds with ERs of <3 in our current MDR1 assay shifted to ERs of >3 in the NIH MDR1 assay. Therefore, the potential false negatives generated from our internal MDR1 assay were confirmed to be positive in the NIH MDR1 assay, and this aligned with the impaired brain penetration in rats. These data indicate that the NIH MDR1 assay provides a greater differentiation and resolution to identify MDR1 substrates compared with our current MDR1 assay.
FIGURE 3.
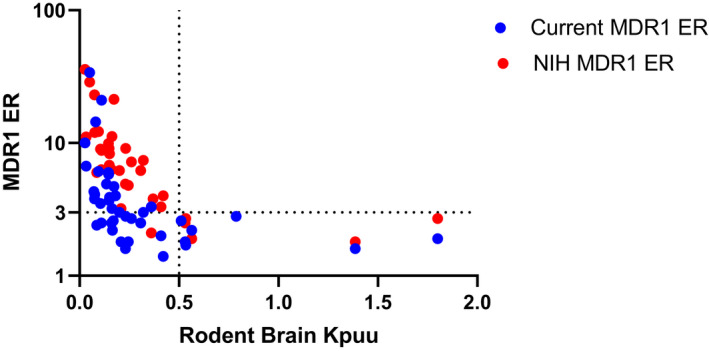
Correlation between rat brain‐to‐plasma Kp,uu and efflux ratios from our current MDR1‐MDCKII and NIH MDR1‐MDCKI for a set of compounds from discovery projects. Brain‐to‐plasma Kp,uu of 0.5 is used as a cutoff for brain penetration, and efflux ratio of 3 is used as the cutoff to classify MDR1 substrates in both NIH MDR1‐MDCKI cells and the current MDR1‐MDCKII cells. Efflux ratio equals to B_A Papp (n = 3) divided by A_B Papp (n = 3) in different cell lines. Quadran 1 is upper right, quadrant 2 is upper left, quadrant 3 is lower left, and quadrant 4 is lower right
3.3. Correlation between MDR1 efflux ratios with CSF‐to‐plasma Kp,uu and brain‐to‐plasma Kp,uu in non‐human primates
Because of ethical and practical constraints, it is not feasible to acquire NHP brain Kp,uu data for a large set of compounds. Because CSF is considered a surrogate of unbound brain concentration, a set of 27 proprietary compounds with available CSF Kp,uu data in NHP was selected to compare MDR1 transporter function between our internal MDR1 cell line and the NIH MDR1 cell line (Figure 4). For compounds with ERs of <3 or ERs of 3–5 in our internal MDR1 assay, CSF Kp,uu values in NHPs ranged from 0.2 to slightly higher than 1, with no apparent correlation between the two. In contrast, the NIH MDR1 assay was able to better resolve compounds, and the range of NIH MDR1 ERs for the same set of compounds was expanded from 1 to nearly 40, and displayed an inverse correlation with CSF Kp,uu in NHP. None of the compounds with ERs of <3 in the NIH MDR1 assay exhibited any appreciable impairment of CNS penetration based on CSF Kp,uu in NHP, whereas compounds with impaired CNS penetration (NHP CSF Kp,uu <0.5) had NIH MDR1 ERs of >3.
FIGURE 4.
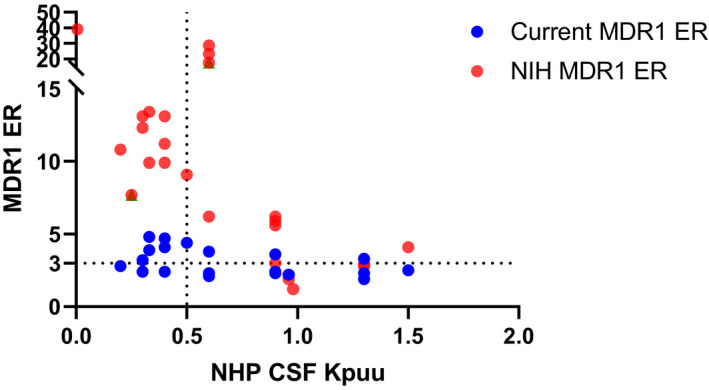
Correlation between non‐human primate CSF‐to‐plasma Kp,uu and efflux ratios from our current MDR1‐MDCKII and NIH MDR1‐MDCKI for a set of compounds from discovery projects. CSF‐to‐plasma Kp,uu of 0.5 is used as a cutoff for brain penetration, and efflux ratio of 3 is used as the cutoff to classify MDR1 substrates in both NIH MDR1‐MDCKI cells and the current MDR1‐MDCKII cells. Efflux ratio equals to B_A Papp (n = 3) divided by A_B Papp (n = 3) in different cell lines
Certainly, it is more valuable to establish a correlation between MDR1 ERs with brain‐to‐plasma Kp,uu in NHPs. Although more limited in scope, we obtained NHP brain Kp,uu values for a subset of 10 compounds (9 proprietary compounds and antipyrine) (Table 1), which showed a good correlation with NIH MDR1 ERs (Figure 5). Compounds with NIH MDR1 ERs of <3 exhibited an NHP brain Kp,uu of near unity, whereas those with NIH MDR1 ERs of >3 showed an inverse correlation of brain Kp,uu with increasing ER.
TABLE 1.
Non‐human primate (NHP) and rat brain‐to‐plasma Kpuu, NHP CSF‐to‐plasma Kpuu, human NIH MDR1 and breast cancer resistance protein (BCRP) efflux ratio, passive permeability and NHP plasma protein and brain binding of nine proprietary compounds and antipyrine
| Compound# |
NHP Kp,uu brain |
NHP Kp,uu CSF |
MDR1 efflux ratio (ER a ) | BCRP ER a | MDCK A‐B Papp (×10−6 cm/s) | Fu,plasma | Fu,brain |
Rat Kp,uu brain |
|---|---|---|---|---|---|---|---|---|
| 1 | 0.16 (0.15, 0.17) | 0.33 (0.28, 0.39) | 9.9 | 14.9 | 11.4 ± 1.8 | 0.030 | 0.006 | 0.12 ± 0.03 |
| 2 | 0.41 (0.36, 0.46) | 0.42 (0.38, 0.46) | 13.1 | 2.8 | 12.5 ± 3.4 | 0.13 | 0.019 | 0.26 ± 0.01 |
| 3 | 0.29 ± 0.05 | 0.43 ± 0.07 | 12.1 | 3.9 | 8.2 ± 3.2 | 0.055 | 0.014 | 0.16 ± 0.02 |
| 4 | 0.27 ± 0.03 | 0.67 ± 0.10 | 13.4 | 1.6 | 9.9 ± 0.3 | 0.007 | 0.005 | 0.09 ± 0.03 |
| 5 | 0.026 ± 0.010 | <0.020 b | 172.0 | 21.0 | 0.7 ± 0.4 | 0.022 | 0.029 | 0.005 ± 0.002 |
| 6 | 0.13 ± 0.00 | >1 d | 14.1 | 1.3 | 5.8 ± 1.8 | 0.003 | 0.003 | 0.04 ± 0.01 |
| 7 | <0.004 | 0.026 ± 0.016 | 116.0 | 39.8 | 0.4 ± 0.3 | 0.009 | 0.009 | 0.01± 0.00 |
| 8 | 1.24 ± 0.24 | 0.86 ± 0.19 | 2.8 | 3.0 | 5.0 ± 1.3 | 0.006 | 0.003 | 0.21 ± 0.03 |
| 9 | 1.28 ± 0.21 | 0.69 ± 0.07 | 1.9 | 2.3 | 6.2 ± 0.5 | 0.014 | 0.005 | 0.57 ± 0.09 |
| Antipyrine | 0.96 (0.91, 1.01) | 1.00 (0.92, 1.08) | 1.0 | 0.9 | 32.8 ± 9.0 | 0.95 | 1.0 c | 1.0 e |
Data are presented as mean ± SD from three replicates except where data from only two replicates were available, in which cases means along with individual data (in parentheses) are listed.
ER equals to B_A Papp (n = 3) divided by A_B Papp (n = 3) in different cell lines.
Value was averaged from 0.0255, <0.0183, <0.0148, but two of the values were below LLOQ (lower limit of quantitation).
Antipyrine fu,brain is assumed to be 1.00, since in brain tissue homogenate (1:3 tissue:PBS), antipyrine fu was ~1.
Compound 6 CSF values (n = 3) were all >1 with some variabilities.
Antipyrine rat brain Kpuu was calculated based on the data in Nagaya et al. (2016). 29
FIGURE 5.
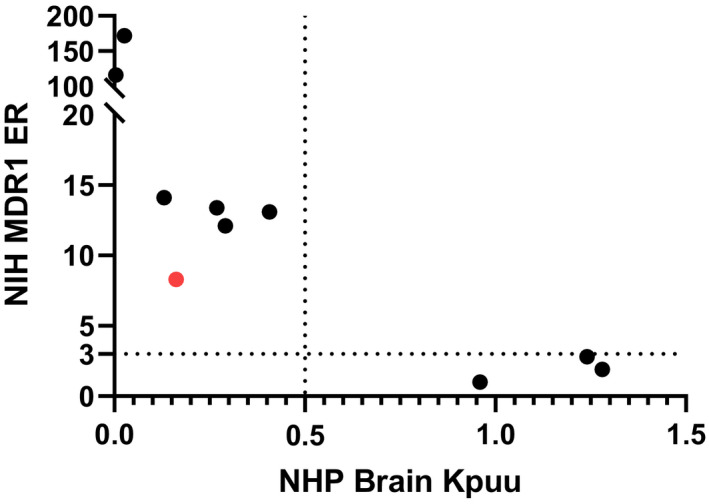
Correlation between non‐human primate (NHP) brain‐to‐plasma Kp,uu and efflux ratios from NIH MDR1‐MDCKI of 9 proprietary compounds and antipyrine. Brain‐to‐plasma Kp,uu of 0.5 is used as a cutoff for brain penetration. The NHP brain‐to‐plasma Kp,uu and efflux ratios values can be found in Table 1
Additionally, it is of interest to understand the potential species difference in CNS penetration between rat and NHP. Hence, the brain penetration of this set of compounds, including seven MDR1 substrates and three non‐MDR1 substrates, in NHPs was compared with rats (Figure 6). As expected, both rat and NHP brain Kp,uu of the three non‐MDR1 substrates were close to 1, except that rat brain Kpuu of compound 8, a non‐MDR1 substrate, was dramatically lower than 1, and the reason remains to be answered. The data demonstrated that NHP brain Kp,uu values increased notably relative to rat brain Kp,uu for all MDR1 substrates, except for compounds 1, 5 and 7. Subsequently, it was confirmed that compound 1 is a BCRP and MDR1 dual substrate, and compounds 5 and 7 have NIH MDR1 ERs of >100 with a very low brain Kp,uu (<0.05).
FIGURE 6.
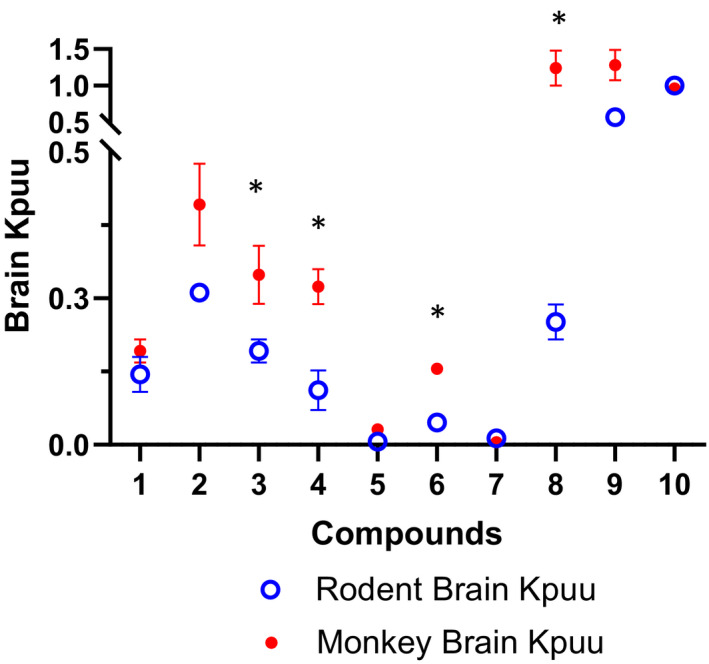
Comparison of brain‐to‐plasma Kp,uu between rat and NHP of the same 10 compounds including 7 MDR1 substrates and 3 non‐MDR1 substrates. Data points represent mean ± SD. *p < .01, brain‐to‐plasma Kp,uu in rat versus NHP
3.4. Comparison of csf and unbound brain concentrations for MDR1 substrates in non‐human primates
To investigate the utility of CSF concentration as a surrogate for unbound brain concentration in NHP, CSF and unbound brain concentrations of the same 10 compounds were measured (Table 1). Figure 7 shows the brain‐to‐plasma Kp,uu and CSF‐to‐plasma Kp,uu values of the 7 MDR1 substrates, which were appreciably lower than unity with exception of compound 6 CSF Kpuu ~1. In contrast, brain Kp,uu and CSF Kp,uu values of the three non‐MDR1 substrates were close to 1. Although the CSF Kp,uu showed a trend of overestimating brain Kp,uu of MDR1 substrates, the CSF Kp,uu were generally in a good agreement with brain Kp,uu (within 3‐fold) except for two MDR1 substrates, compounds 6 and 7, which had very high protein binding with fu,p < 0.01 and very low brain Kp,uu. These data further support the use of CSF drug concentration as a surrogate for unbound brain drug concentration.
FIGURE 7.
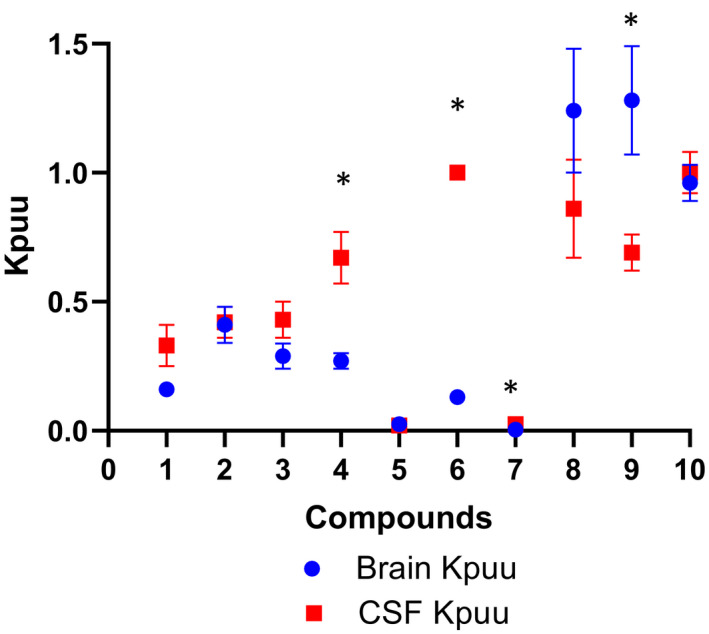
Comparison of brain‐to‐plasma Kp,uu with CSF‐to‐plasma Kp,uu of the same 10 compounds including 7 MDR1 substrates and 3 non‐MDR1 substrates in non‐human primates. Data points represent mean ±SD. *p < .01, brain‐to‐plasma Kp,uu versus CSF‐to‐plasma Kp,uu
3.5. Comparison of CSF‐to‐plasma Kp,uu and brain‐to‐plasma Kp,uu time courses in non‐human primates
Another question of interest is whether MDR1 could influence the rate of drug penetration into the CNS. Three compounds, including antipyrine, and proprietary compounds 1 and 2 were selected to explore how MDR1 might impact the kinetics of drug distribution into the CNS in NHP. The MDR1/BCRP interactions, in vitro passive permeability, and plasma protein and brain binding of the three compounds are summarized in Table 1. Antipyrine has a high passive permeability, low plasma protein and brain tissue binding, and no MDR1/BCRP efflux transporter interactions. In contrast, compound 1 and 2 have high in vitro passive permeability, moderate‐to‐high plasma protein binding and high brain binding, and are MDR1 substrates with NIH MDR1 ERs of ~10 (Table 1). It is worth noting that compound 1 is an MDR1 and BCRP dual substrate, but compound 2 is an MDR1 only substrate. The brain and CSF Kp,uu were measured at 0.25, 0.5, and 1 h after IV infusion at 0.5–3 mg/kg for 15 min in NHP, and Figure 8 displays the time course of brain and CSF Kp,uu of the three compounds. For antipyrine, the unbound brain concentration reached equilibrium with unbound plasma concentration (brain Kp,uu of ~1) within 15 min. However, lumbar CSF concentration of antipyrine took longer to equilibrate with plasma concentration with CSF Kp,uu reaching unity at ~1 h. In contrast, both brain and CSF Kp,uu of compounds 1 and 2 continued to increase until the final 1 h sampling time in this study. Brain and CSF Kp,uu of compound 1 were 0.16 and 0.33 at 1 h, respectively, and both brain and CSF Kp,uu of compound 2 were ~0.4 at 1 h. Because the brain Kp,uu of compound 1 at 1 h in this study was similar to its brain Kp,uu at 24 h following the last dose in 7‐day NHP study (0.16 ± 0.03), it is reasonable to conclude that brain concentrations of compound 1 and 2 have approached equilibrium with plasma concentration at 1 h in this study as well. These data demonstrate that unlike antipyrine, brain concentrations of both compound 1 and compound 2 exhibit a delay to equilibrate with plasma. However, it took ~1 h for lumbar CSF to reach equilibrium with plasma for all three compounds, which is consistent with flow‐limited mixing of CSF in different regions. The data further support the notion that CSF drug concentration could be a surrogate for unbound brain drug concentration with a comparable or a severalfold higher value.
FIGURE 8.
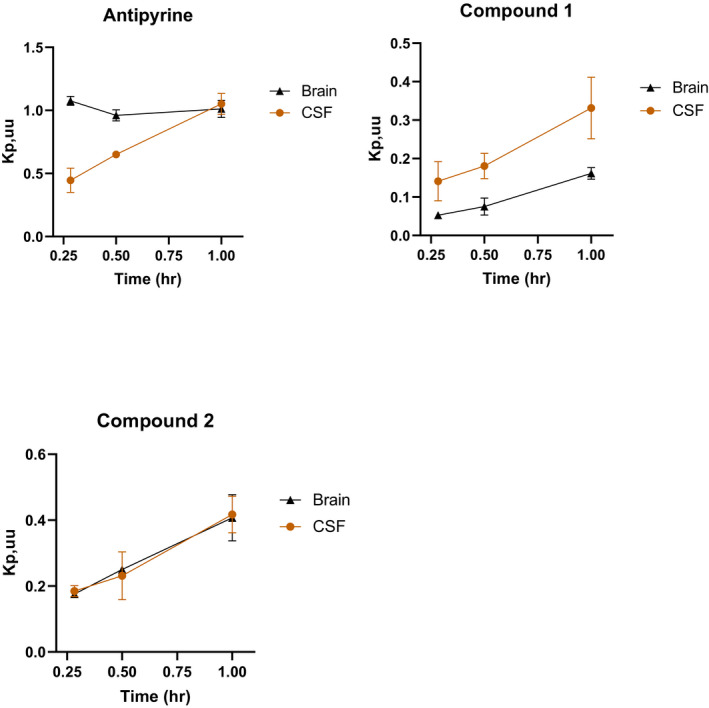
Brain‐to‐plasma Kp,uu and CSF‐to‐plasma Kp,uu time course for antipyrine, compounds 1 and 2 in non‐human primates. Data points represent mean ± SD from three animals
4. DISCUSSION
Because MDR1 is the major efflux transporter expressed at the BBB impacting brain penetration, it is an essential optimization parameter for the design of compounds requiring CNS penetration for efficacy, or for those that need to be restricted from accessing the CNS from a safety perspective. This has been reinforced by the fact that most CNS‐penetrant drugs are not MDR1 substrates, which corroborates the importance of early assessment of MDR1 substrates in drug discovery. 9 , 10 Therefore, development of a robust and reliable MDR1 transporter assay which best correlates with in vivo brain penetration to guide SAR during lead optimization is critical. At Vertex, an MDR1 assay using an MDR1‐MDCKII cell line developed internally has been used to assess CNS penetration of compounds. Previous evaluation focusing on IVIVC of MDR1 ERs and rat brain penetration suggested a strong correlation between an in vitro MDR1 ER of >3 and impaired CNS penetration in rats. However, compounds with an in vitro MDR1 ER of <3 displayed a range of brain penetration properties in rats and led to potential false negatives. Thus, the current in vitro MDR1 assay did not appear to have enough resolution to differentiate compounds with ERs of <3, and project teams had to rely on rat brain‐to‐plasma Kp,uu values to differentiate compounds with ERs of <3. In addition to the increased need for animal studies, in vivo rat brain Kp,uu studies are relatively slow, resource intensive and have low throughput, which can lead to significantly prolonged project cycle times to select compounds with good CNS penetration. More importantly, projects targeting desirable CNS penetration prioritize compounds with MDR1 ER of <3, which are predicted to be non‐MDR1 substrates. Moreover, potential species difference in MDR1 transport could further confound the prediction of CNS penetration in human. Hence, we have been striving to develop an MDR1 assay with a high fidelity to reliably differentiate compounds with MDR1 ERs of <3 in our current MDR1 assay.
It has been reported that the MDR1‐MDCKI cell line from the NIH laboratory is a better alternative MDR1 cell line which does not generate false negatives and has a stronger correlation with rodent brain penetration. 23 , 24 In our extensive validation, NIH MDR1‐MDCKI cells were able to better differentiate compounds that had ERs of <3 in our existing MDR1‐MDCKII assay (Figure 1), demonstrating a much higher resolution for these compounds. It has been reported that NIH MDR1‐MDCKI cells have ~10‐fold higher expression of P‐gp (29.8 pmol/mg), 23 compared with our existing MDR1‐MDCKII cells (2.92 pmol/mg, internal data). Additionally, the ERs in NIH MDR1 assay are more than 10‐fold higher than those in our current MDR1 assay for the well characterized MDR1 substrates, for example, quinidine and verapamil. Higher MDR1 expression and function likely contribute to a greater assay sensitivity and a larger transport dynamic range. More importantly, the NIH MDR1 assay correlated with rat brain Kp,uu much better than our current MDR1 assay, especially in the low ER range (Figure 3). As discussed earlier, an MDR1 ER of 3 was identified as a cutoff for identifying MDR1 substrates in vitro, whereas a brain Kp,uu of 0.5 was used to classify compounds as having brain penetration impairment (Kp,uu <0.5) versus being freely brain penetrant. Both our current MDR1 and NIH MDR1 assays demonstrated good alignment with rat brain penetration impairment when ERs were >3, but our current MDR1 assay had poor correlation with rat brain distribution when ERs were <3. Although it is possible that the in vitro and in vivo disconnect for compounds with MDR1 ERs of <3 in our current assay could potentially be due to efflux transporters other than MDR1, studies of a subset of these compounds in Mdr1a/1b knock out rats indicated that the brain penetration impairment in rats was due to Mdr1 (internal data). Additionally, it has been reported that since the amino acid homology between human MDR1 and rat Mdr1a is high, the species difference in terms of substrate specificity is likely to be minimal. 10 Therefore, our internal MDR1 assay could generate potential false negatives compared with rat brain penetration. On the contrary, the NIH MDR1 assay demonstrated a good correlation with rat brain Kp,uu for compounds with ERs of <3 with the majority of compounds with NIH ERs of <3 displayed a good brain penetration in rats (Figure 3). However, one compound marked in red did show brain penetration impairment even with NIH MDR1 ER of <3 (Figure 3). As previously mentioned, this apparent discrepancy could be due to other efflux transporters beyond MDR1 and/or species difference between human MDR1 and rat Mdr1. Thus, further studies are warranted to investigate this disagreement.
Because NHP MDR1 has the highest amino acid sequence homology with human MDR1 and the MDR1 expression levels at the BBB in NHP are more comparable with human than rat, 11 , 12 it is of high interest to develop a correlation between in vitro human MDR1 ERs and brain penetration in NHP. This correlation, if proven, could help provide more confidence in the use of MDR1 ERs to predict CNS penetration in human. It has been reported that CSF could be a good surrogate of unbound brain concentration of MDR1 substrates in NHP. 25 , 26 Because CSF Kp,uu is a more readily accessible parameter it is beneficial to develop the correlation between MDR1 ERs and NHP CSF Kp,uu. A set of compounds with available NHP CSF Kp,uu data was identified, and the correlation between MDR1 ERs and NHP CSF Kp,uu was assessed (Figure 4). There was no apparent correlation between our existing MDR1 ERs and NHP CSF Kp,uu data such that for MDR1 ERs of <3, NHP CSF Kp,uu ranged from ~0.2 to ~1. However, a better correlation between NIH MDR1 ERs and NHP CSF Kp,uu was observed. When NIH MDR1 ERs were <3, NHP CSF Kp,uu values were ~1, whereas NHP CSF Kp,uu for slightly more than half of compounds (11 out of 19 compounds) were lower than 0.5 when NIH MDR1 ERs were >3. It has been recognized that while CSF concentration is generally a reasonable surrogate for unbound brain concentration, CSF levels could exceed unbound brain concentration for MDR1 substrates. 25 , 26 Consequently, for MDR1 substrates, when CSF Kp,uu is ~1, brain Kp,uu could be lower than 1. In contrast, for non‐MDR1 substrates, when CSF Kp,uu is ~1, brain Kp,uu is likely to be ~1 as well. As such, it is not surprising that in the current study, CSF Kp,uu was around 1 for a few compounds with NIH MDR1 ERs of >3. On the other hand, when NHP CSF Kp,uu was <0.5, all NIH MDR1 ERs were >3, suggesting a good IVIVC. These data demonstrate that there is a reasonable correlation between NIH MDR1 ERs and NHP CSF Kp,uu, and NIH MDR1 assay can improve the prediction of CNS penetration in NHP compared with our current assay.
Ultimately, it is desirable to develop a robust correlation between human MDR1 ERs and NHP brain Kp,uu. However, due to the obvious ethical and practical limitations with generating NHP data, only 10 compounds (Table 1), including 9 proprietary compounds and antipyrine, with NHP brain Kp,uu data were available. Nonetheless, a clear correlation between NIH MDR1 ER and NHP brain Kp,uu was observed for these 10 compounds (Figure 5). When NIH MDR1 ERs were <3, NHP brain Kp,uu was ~1, whereas when NIH MDR1 ERs were >3, NHP brain Kp,uu was inversely correlated with the magnitude of the ER. However, compound 1 (marked in red in Figure 5) appeared to be an outlier but it was later confirmed that compound 1 was also a substrate of breast cancer resistance protein (BCRP), another major efflux transporter expressed at the BBB. It has been reported that the brain penetration of MDR1 and BCRP dual substrates is worse than that of MDR1‐specific substrates. 27 Our data further substantiate the NIH MDR1 assay as more predictive of brain penetration in NHP. Since NHP MDR1 and human MDR1 are highly similar in terms of transport function and expression level at the BBB, 11 it is expected that the NIH MDR1 assay will give a good prediction of CNS penetration in human as well.
With the data indicating the superiority of the NIH MDR1 cell line and demonstrating a good correlation of the NIH MDR1 assay with rat and NHP brain penetration, we wanted to explore the relationship of brain penetration between rat and NHP, a higher‐order species, for MDR1 substrates, Based on the higher P‐gp expression in rats reported in the literature, 11 , 12 one would expect to see an improvement in brain exposure going from rat to NHP. A rat to NHP pair‐wise analysis of brain Kp,uu of the same 10 compounds (Table 1), including 7 MDR1 and 3 non‐MDR1 substrates, clearly indicate that this is true in majority of the cases (Figure 6). Compounds that were MDR1 substrates showed moderate improvement in brain exposure in NHP relative to rat. Interestingly, comparable brain Kp,uu values in rats and NHP were observed for compounds 1, 5, and 7. It was discovered later that compound 1 is a dual MDR1 and BCRP substrate. It has been reported that NHP BBB has lower expression of MDR1 and higher expression of BCRP compared with rat, 11 , 12 which may have contributed to the brain Kp,uu of compound 1 being comparable in rat and NHP. Additionally, compound 5 and compound 7 are strong MDR1 substrates with ERs of >100, resulting in very low brain Kp,uu of <0.05. Because of such a low Kp,uu, it is likely difficult to detect an improvement in brain Kp,uu from rats to NHP. Overall, this comparison supports the view that brain penetration in NHP will likely be greater than rat for weak and moderate MDR1 substrates.
Additionally, we investigated the utility of CSF concentration as a surrogate of unbound brain concentration in NHP. CSF and unbound brain concentrations of the same 10 compounds were measured in NHP (Table 1). For the non‐MDR1 substrates, CSF and unbound brain concentrations were similar and close to unity as expected, whereas brain Kp,uu values were considerably lower than 1 for MDR1 substrates (Figure 7). Moreover, the brain Kp,uu decreased as the MDR1 ERs increased, which is aligned with MDR1‐mediated efflux at BBB being the major determinant of brain Kp,uu in NHP. Also consistent with the previous reports, 25 , 26 CSF Kp,uu showed a tendency to overestimate (within threefold) brain Kp,uu for all, with the exception of two MDR1 substrates. Because CSF concentration is impacted by unbound brain concentration diffused though the ependymal layer between the brain and CSF, as well as unbound plasma concentration passing through the choroid plexus, it is reasonable to expect that CSF concentration could be severalfold higher than unbound brain concentration for MDR1 substrates. Of interest, the two compounds (compound 6 and 7 in Table 1) with CSF concentration dramatically higher (> threefold) than unbound brain concentration displayed high plasma protein binding (Fu,p < 0.01) and brain binding (Fu,brain <0.01). One possible reason for this is that the high brain binding is likely to result in a slower diffusion rate from brain to CSF; thus, the CSF concentrations could be impacted more by the unbound plasma concentrations, leading to a much greater over estimation of unbound brain concentrations. However, the exact mechanism remains to be elucidated. Based on our data, CSF concentrations can be approximated to unbound brain concentrations within threefold in NHPs.
For some CNS disorders, it is often desirable to identify compounds that can rapidly penetrate into the brain to deliver a fast onset of action and produce maximal pharmacological effect shortly after administration. Thus, the time taken for brain concentration to reach equilibrium with plasma concentration ideally needs to be as short as possible. Previous studies reported that, for most drugs, the rate of penetration into the brain is limited by perfusion of the drug across BBB. The pioneering work by Brodie et al concluded that the equilibration of drug in the CSF with that in plasma is often permeability rate limited, 28 and later more studies have supported that passive permeability can impact the time required for compounds to reach equilibrium between brain and plasma. Antipyrine has a high passive permeability without MDR1 transport interaction. As expected, antipyrine brain Kp,uu reached ~1 within 15 min after dosing (Figure 8). However, it took ~1 h for lumbar CSF to equilibrate with plasma, which is consistent with this being a CSF bulk‐flow‐limited process. Because it is not feasible to measure unbound brain concentration in human, CSF concentration is often used as a surrogate for the unbound brain concentration. It should be emphasized that the apparent delay seen for lumbar CSF to equilibrate with plasma due to bulk flow process may not reflect a delay in brain unbound concentration equilibration for compounds with a high passive permeability and no efflux transport. Similar to antipyrine, the passive permeability of both Vertex proprietary compounds 1 and 2 were high (Table 1), but in contrast to antipyrine, the brain Kp,uu for both compounds was lower than 1 (Figure 8), which is consistent with these being MDR1 substrates. The extent of brain Kp,uu at equilibrium is dependent on the interactions of drug with efflux transporters, independent of the magnitude of its passive permeability. Although NIH MDR1 ERs for compounds 1 and 2 were similar, given that compound 1 was an MDR1 and BCRP dual substrate, whereas compound 2 was an MDR1 substrate only, it is not surprising that compound 1 brain Kp,uu was slightly lower than that of compound 2. Because NHP brain Kp,uu for compound 1 at steady state after multiple dosing was comparable with brain Kp,uu at 1 h, it was inferred that NHP brain concentrations for both compound 1 and 2 approached or approximated equilibrium with plasma concentration at ~1 h. These data suggest that MDR1 interaction could delay the time for brain concentration to achieve equilibrium with plasma concentration. As such, transport properties could have a profound influence on the equilibrium concentration and the time to attain equilibration of drugs in the brain, and thereby on their pharmacological effects. Another potential factor that can impact the time for brain concentration to reach the equilibrium with plasma concentration is the plasma protein or brain tissue binding. It has been reported that high brain tissue binding could prolong the time for compounds to reach equilibrium in the brain. 21 Since both compounds 1 and 2 have moderate‐to‐high plasma protein and high brain tissue binding, it is difficult to conclude whether plasma protein or brain tissue binding played a significant role in the time taken for these compounds to achieve equilibrium between the brain and plasma. Further studies using MDR1 substrates with low protein binding will be helpful to further confirm the role of MDR1 interaction in the delayed distribution into the brain.
In conclusion, the present studies demonstrate the value of increased resolution and fidelity of an in vitro MDR1 assay and judicious use of in vivo studies in preclinical species for a more accurate optimization and reliable prediction of CNS drug penetration during drug discovery. In addition, our data suggest that MDR1 interaction can influence the time for drug concentrations in the brain to reach equilibrium with plasma. Consequently, compounds with high passive permeability and without MDR1 interaction are desired when rapid brain penetration and onset of pharmacological activity are required.
DISCLOSURE
All authors declare no competing interest.
AUTHOR CONTRIBUTIONS
Participated in research design: Jiang, Kumar, Eddershaw, Hay, Chen, and Feng. Conducted experiments: Nuechterlein, Reyes, Tran, Cabebe, Chiang, Reynolds, Carrier, and Sun. Contributed new reagents or analytic tools: Nuechterlein, Reyes, Tran, Cabebe, Chiang, and Reynolds. Performed data analysis: Jiang, Sun, and Feng. Wrote or contributed to the writing of the manuscript: Jiang, Kumar, Eddershaw, Hay, and Feng.
ACKNOWLEDGEMENTS
The work was supported by Vertex Pharmaceuticals.
Jiang L, Kumar S, Nuechterlein M, et al. Application of a high‐resolution in vitro human MDR1‐MDCK assay and in vivo studies in preclinical species to improve prediction of CNS drug penetration. Pharmacol Res Perspect. 2022;10:e00932. doi: 10.1002/prp2.932
DATA AVAILABILITY STATEMENT
All data are available in Vertex‐archived notebooks.
REFERENCES
- 1. Abbott NJ, Patabendige AA, Dolman DE, Yusof SR, Begley DJ. Structure and function of the blood‐brain barrier. Neurobiol Dis. 2010;37:13‐25. [DOI] [PubMed] [Google Scholar]
- 2. Rubin LL, Staddon JM. The cell biology of the blood‐brain barrier. Annu Rev Neurosci. 1999;22:11‐28. [DOI] [PubMed] [Google Scholar]
- 3. Freeman BB 3rd, Yang L, Rankovic Z. Practical approaches to evaluating and optimizing brain exposure in early drug discovery. Eur J Med Chem. 2019;182:111643. [DOI] [PubMed] [Google Scholar]
- 4. Hammarlund‐Udenaes M, Bredberg U, Fridén M. Methodologies to assess brain drug delivery in lead optimization. Curr Top Med Chem. 2009;9:148‐162. [DOI] [PubMed] [Google Scholar]
- 5. Reichel A. Addressing central nervous system (CNS) penetration in drug discovery: basics and implications of the evolving new concept. Chem Biodivers. 2009;6:2030‐2049. [DOI] [PubMed] [Google Scholar]
- 6. Bouw MR, Gårdmark M, Hammarlund‐Udenaes M. Pharmacokinetic‐pharmacodynamic modelling of morphine transport across the blood‐brain barrier as a cause of the antinociceptive effect delay in rats—a microdialysis study. Pharm Res. 2000;17:1220‐1227. [DOI] [PubMed] [Google Scholar]
- 7. Stain‐Texier F, Boschi G, Sandouk P, Scherrmann JM. Elevated concentrations of morphine 6‐beta‐D‐glucuronide in brain extracellular fluid despite low blood‐brain barrier permeability. Br J Pharmacol. 1999;128:917‐924. [DOI] [PMC free article] [PubMed] [Google Scholar]
- 8. Hammarlund‐Udenaes M, Paalzow LK, de Lange EC. Drug equilibration across the blood‐brain barrier–pharmacokinetic considerations based on the microdialysis method. Pharm Res. 1997;14:128‐134. [DOI] [PubMed] [Google Scholar]
- 9. Doran A, Obach RS, Smith BJ, et al. The impact of P‐glycoprotein on the disposition of drugs targeted for indications of the central nervous system: evaluation using the MDR1A/1B knockout mouse model. Drug Metab Dispos. 2005;33:165‐174. [DOI] [PubMed] [Google Scholar]
- 10. Feng B, Mills JB, Davidson RE, et al. In vitro P‐glycoprotein assays to predict the in vivo interactions of P‐glycoprotein with drugs in the central nervous system. Drug Metab Dispos. 2008;36:268‐275. [DOI] [PubMed] [Google Scholar]
- 11. Ito K, Uchida Y, Ohtsuki S, et al. Quantitative membrane protein expression at the blood‐brain barrier of adult and younger cynomolgus monkeys. J Pharm Sci. 2011;100:3939‐3950. [DOI] [PubMed] [Google Scholar]
- 12. Uchida Y, Ohtsuki S, Katsukura Y, et al. Quantitative targeted absolute proteomics of human blood‐brain barrier transporters and receptors. J Neurochem. 2011;117:333‐345. [DOI] [PubMed] [Google Scholar]
- 13. Chen C, Liu X, Smith BJ. Utility of Mdr1‐gene deficient mice in assessing the impact of P‐glycoprotein on pharmacokinetics and pharmacodynamics in drug discovery and development. Curr Drug Metab. 2003;4:272‐291. [DOI] [PubMed] [Google Scholar]
- 14. Lin JH, Yamazaki M. Clinical relevance of P‐glycoprotein in drug therapy. Drug Metab Rev. 2003;35:417‐454. [DOI] [PubMed] [Google Scholar]
- 15. Polli JW, Wring SA, Humphreys JE, et al. Rational use of in vitro P‐glycoprotein assays in drug discovery. J Pharmacol Exp Ther. 2001;299:620‐628. [PubMed] [Google Scholar]
- 16. Jung YS, Kim DK, Kim MK, Kim HJ, Cha IH, Lee EW. Onset of analgesia and analgesic efficacy of tramadol/acetaminophen and codeine/acetaminophen/ibuprofen in acute postoperative pain: a single‐center, single‐dose, randomized, active‐controlled, parallel‐group study in a dental surgery pain model. Clin Ther. 2004;26:1037‐1045. [DOI] [PubMed] [Google Scholar]
- 17. Hardman JG, Limbird LE, Gilman AG. Goodman & Gilman’s The Pharmacological Basis of Therapeutics, 10th ed. McGraw‐Hill; 2001. [Google Scholar]
- 18. Li L, Gorukanti S, Choi YM, Kim KH. Rapid‐onset intranasal delivery of anticonvulsants: pharmacokinetic and pharmacodynamic evaluation in rabbits. Int J Pharm. 2000;199:65‐76. [DOI] [PubMed] [Google Scholar]
- 19. Adams HP Jr, Leira EC. Treatment of acute ischemic stroke. Drugs Today. 1998;34:655‐660. [DOI] [PubMed] [Google Scholar]
- 20. Di L, Kerns EH, Fan K, McConnell OJ, Carter GT. High throughput artificial membrane permeability assay for blood‐brain barrier. Eur J Med Chem. 2003;38:223‐232. [DOI] [PubMed] [Google Scholar]
- 21. Liu X, Smith BJ, Chen C, et al. Use of a physiologically based pharmacokinetic model to study the time to reach brain equilibrium: an experimental analysis of the role of blood‐brain barrier permeability, plasma protein binding, and brain tissue binding. J Pharmacol Exp Ther. 2005;313:1254‐1262. [DOI] [PubMed] [Google Scholar]
- 22. Feng B, Pemberton R, Dworakowski W, et al. Evaluation of the utility of PXB chimeric mice for predicting human liver partitioning of hepatic organic anion‐transporting polypeptide transporter substrates. Drug Metab Dispos. 2021;49:254‐264. [DOI] [PubMed] [Google Scholar]
- 23. Feng B, West M, Patel NC, et al. Validation of human MDR1‐MDCK and BCRP‐MDCK cell lines to improve the prediction of brain penetration. J Pharm Sci. 2019;108:2476‐2483. [DOI] [PubMed] [Google Scholar]
- 24. Kikuchi R, de Morais SM, Kalvass JC. In vitro P‐glycoprotein efflux ratio can predict the in vivo brain penetration regardless of biopharmaceutics drug disposition classification system class. Drug Metab Dispos. 2013;41:2012‐2017. [DOI] [PubMed] [Google Scholar]
- 25. Nagaya Y, Katayama K, Kusuhara H, Nozaki Y. Impact of P‐glycoprotein‐mediated active efflux on drug distribution into lumbar cerebrospinal fluid in nonhuman primates. Drug Metab Dispos. 2020;48:1183‐1190. [DOI] [PubMed] [Google Scholar]
- 26. Nagaya Y, Nozaki Y, Kobayashi K, et al. Utility of cerebrospinal fluid drug concentration as a surrogate for unbound brain concentration in nonhuman primates. Drug Metab Pharmacokinet. 2014;29:419‐426. [DOI] [PubMed] [Google Scholar]
- 27. Zhou L, Schmidt K, Nelson FR, Zelesky V, Troutman MD, Feng B. The effect of breast cancer resistance protein and P‐glycoprotein on the brain penetration of flavopiridol, imatinib mesylate (Gleevec), prazosin, and 2‐methoxy‐3‐(4‐(2‐(5‐methyl‐2‐phenyloxazol‐4‐yl)ethoxy)phenyl)propanoic acid (PF‐407288) in mice. Drug Metab Dispos. 2009;37:946‐955. [DOI] [PubMed] [Google Scholar]
- 28. Brodie BB, Kurz H, Schanker LS. The importance of dissociaton constant and lipid‐solubility in influencing the passage of drugs into the cerebrospinal fluid. J Pharmacol Exp Ther. 1960;130:20‐25. [PubMed] [Google Scholar]
- 29. Nagaya Y, Nozaki Y, Takenaka O, et al. Investigation of utility of cerebrospinal fluid drug concentration as a surrogate for interstitial fluid concentration using microdialysis coupled with cisternal cerebrospinal fluid sampling in wild‐type and Mdr1a(‐/‐) rats. Drug Metab Pharmacokinet. 2016;31:57‐66. [DOI] [PubMed] [Google Scholar]
Associated Data
This section collects any data citations, data availability statements, or supplementary materials included in this article.
Data Availability Statement
All data are available in Vertex‐archived notebooks.