

Abstract
Understanding immune response to infections and vaccines lags understanding humoral responses. While neutralizing antibody responses wane over time, T cells are instrumental in long-term immunity. We apply machine learning and time-lapse imaging microscopy in nanowell grids (TIMING) to study thousands of videos of T cells with specificity for SARS-CoV-2 eliminating targets bearing spike protein as a surrogate for viral infection. The data on effector functions, including cytokine secretion and cytotoxicity, provide the first direct evidence that cytotoxic T lymphocytes from a convalescent patient targeting an epitope conserved across all known variants of concern are serial killers capable of eliminating multiple infected target cells. These data have implications for vaccine development and for the recovery and monitoring of infected individuals.
Keywords: : COVID-19, cytokines, cytotoxicity, lymphocytes, SARS-CoV-2, single-cell, T cells, time-lapse imaging
METHOD SUMMARY
We loaded target cells expressing spike protein, SARS-CoV-2-specific HLA A2-restricted cytotoxic T cells, and beads functionalized with antibodies against IFN-γ onto nanowell arrays. We acquired images of the nanoarray for 8 h at 5-min intervals using an epifluorescent microscope and processed the images using machine learning algorithms for the tracking and segmentation of cells.
Tweetable abstract
Artificial intelligence-powered time-lapse imaging microscopy in nanowell grids assays show SARS-CoV-2 T cells are serial killers.
Graphical abstract
Commercial vaccines seek sterilizing immunity by generating neutralizing antibodies that can protect against viruses such as SARS-CoV-2 [1]. The immunity, however, wanes over time and erodes protection, exposing individuals to risk of disease and communities to outbreaks of infection [2]. The cellular component of adaptive immunity mediated by cytotoxic T lymphocytes (CTLs) plays a fundamental role in the recognition and removal of virally infected respiratory cells [3]. Understanding the functional potency of CTLs against SARS-CoV-2 is important in predicting ongoing cellular immunity [4]. Improving our understanding of T-cell responses to COVID-19 will help develop next-generation vaccines with an ability to offer protection against emerging variants [5]. Furthermore, analysis of T-cell immunity will help characterize patients with asymptomatic through severe disease.
In response to infection and vaccination, the humoral immune response is typically well characterized, primarily because of the ease of studying antibody molecules in vitro [1]. Studying T cell-mediated cellular immune responses is much more challenging, since the response is mediated by the cells and not the soluble T-cell receptors (TCRs) [6]. T cells are capable of a complex array of functions, including migration to infected tissue, activation, killing of infected cells, secretion of cytokines/chemokines and proliferation [6]. Mapping all of these functions onto the same cell requires the ability to study the spatiotemporal changes in cellular behavior across thousands of cells.
Assay principle
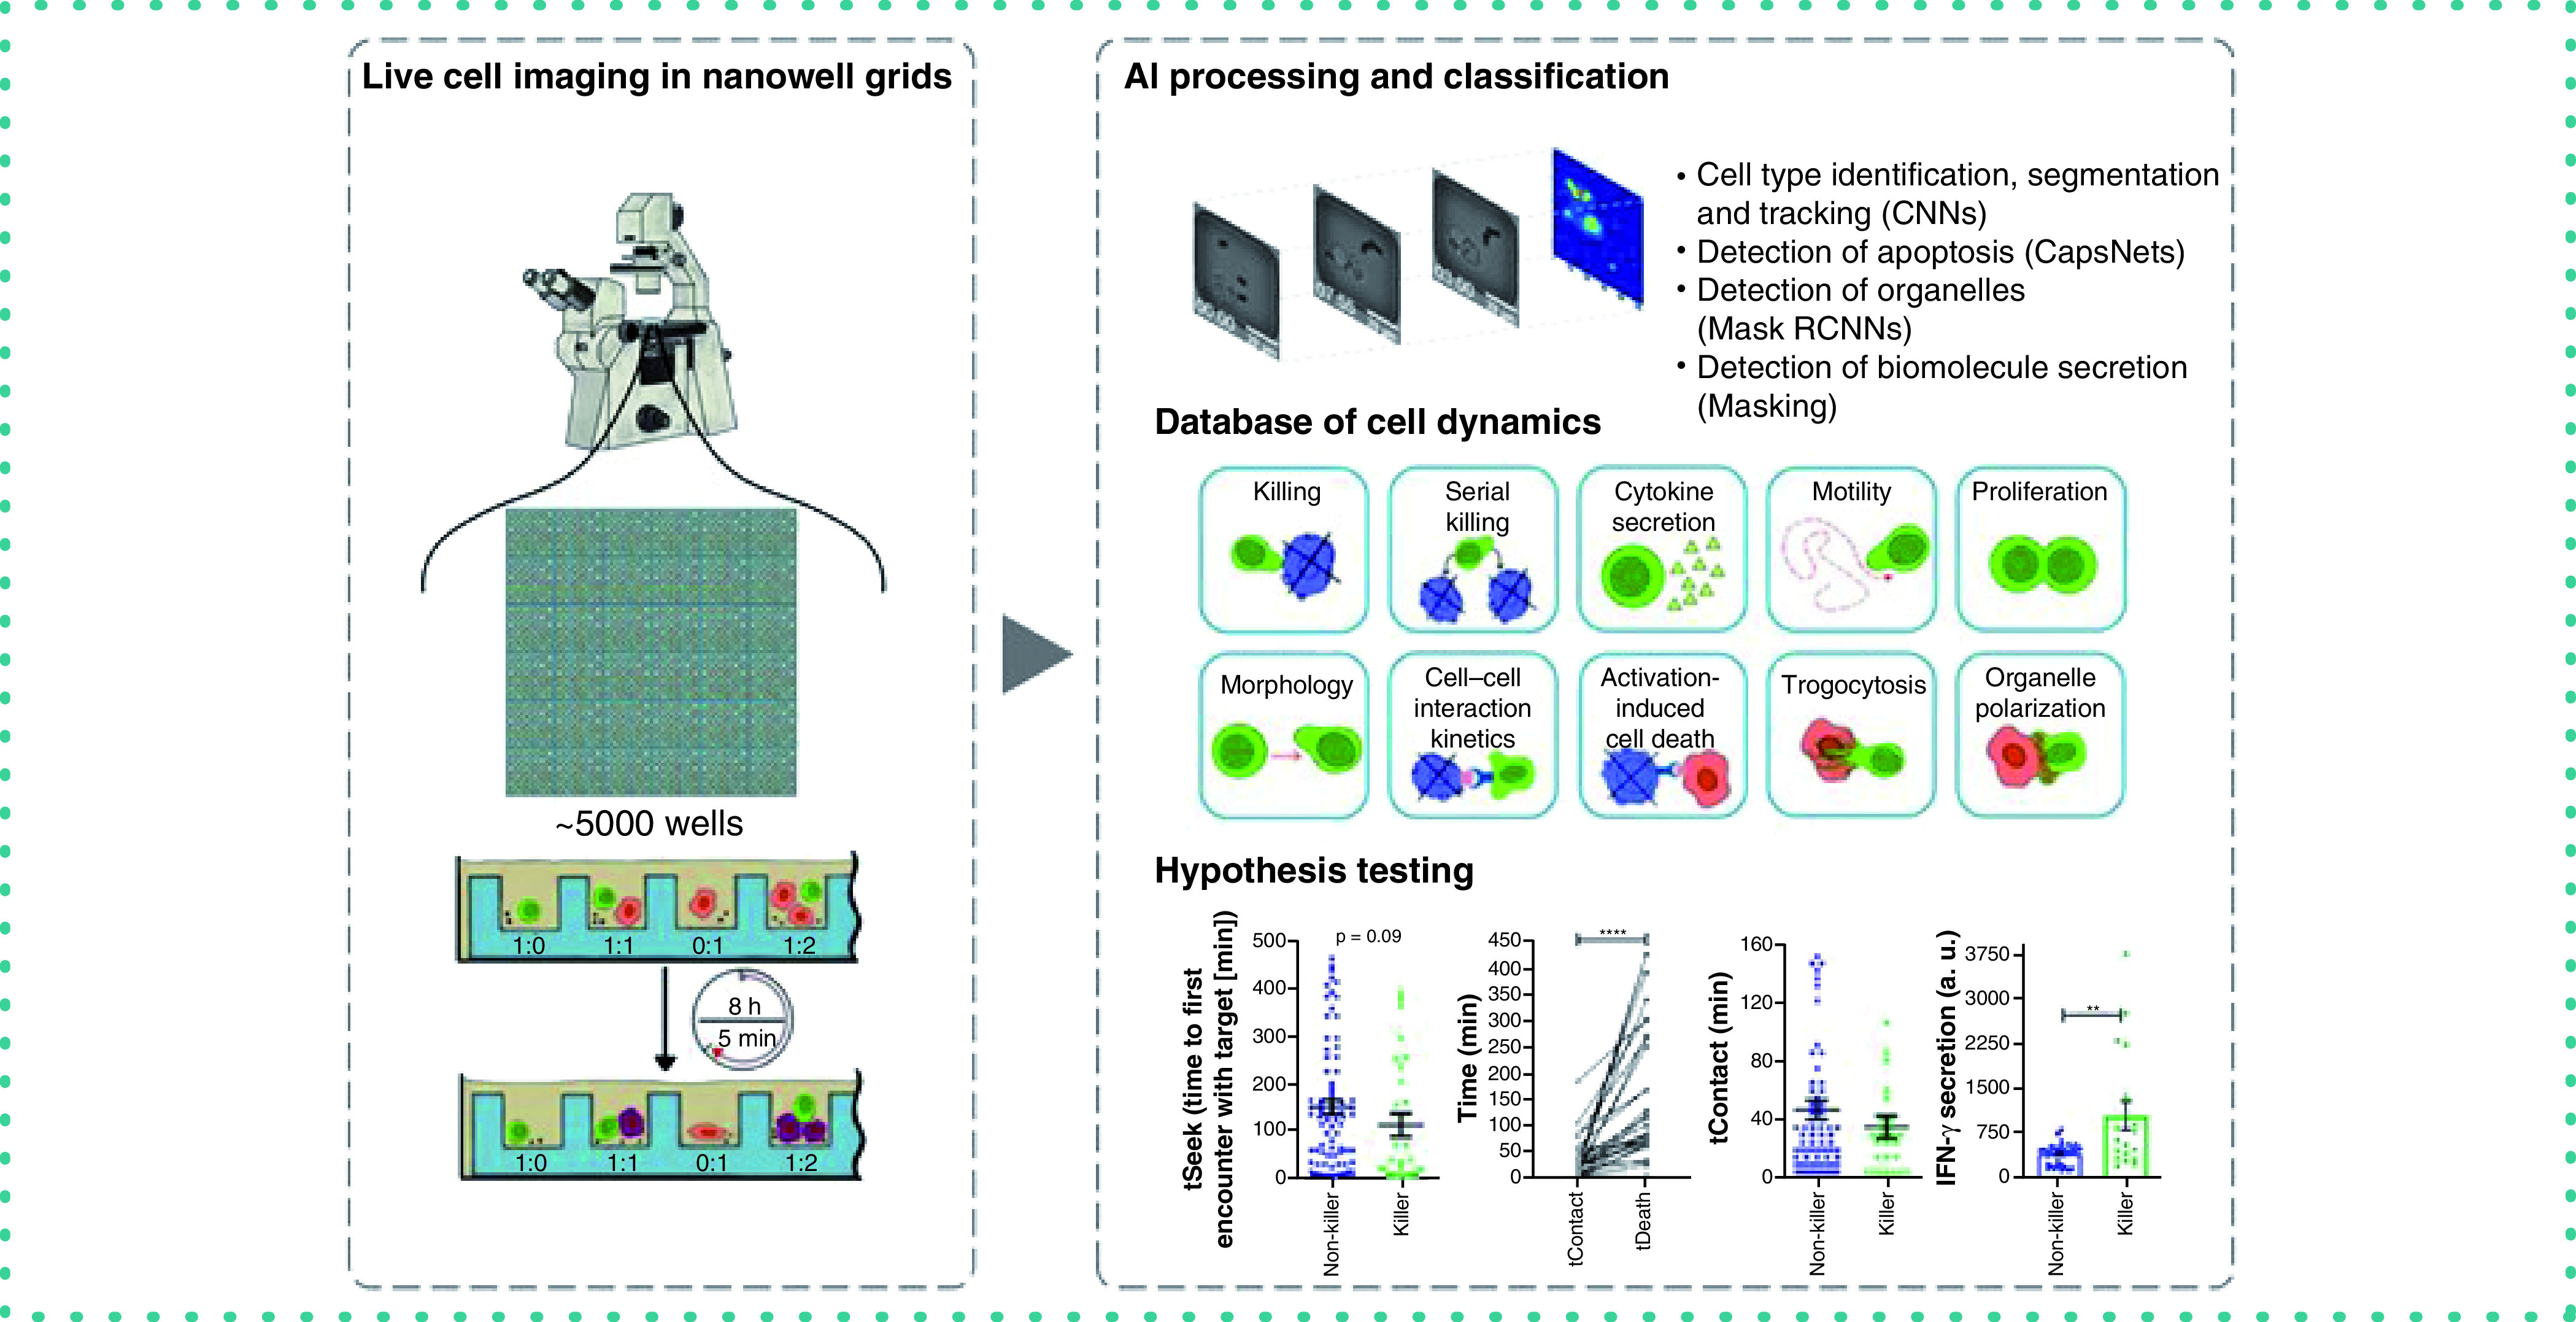
This manuscript describes the use of time-lapse imaging microscopy in nanowell grids (TIMING), an integrated microscopy and artificial intelligence (AI) platform that can image and profile the dynamics of thousands of cells and cell–cell interactions simultaneously [7]. The properties measured by the TIMING platform can distinguish the behavior of T cells before, during and after synapse formation, including motility, morphology, cytokine secretion, time to form synapse, duration of synapse and time from synapse formation until death occurs in the target cell. Further, the TIMING platform can use these parameters to identify unique groups of cells and distinguish various cell behavior upon cell activation. AI algorithms enable high-throughput measurements of properties from single cells and cell–cell interactions that cannot be assessed with image acquisition over a bulk population of T cells and target cells (Figure 1A). TIMING was used to characterize the anti-viral activity of T cells obtained from a convalescent donor. Immortalized cells pulsed with peptides from spike (S) protein were used as targets to mimic infection by SARS-CoV-2. TIMING was adjusted to image sets of single T cells at short intervals of 5 min to quantify the behavior and movement of cells along with their cell–cell interactions in the presence of stimulator cells.
Figure 1. Overview of the TIMING platform.
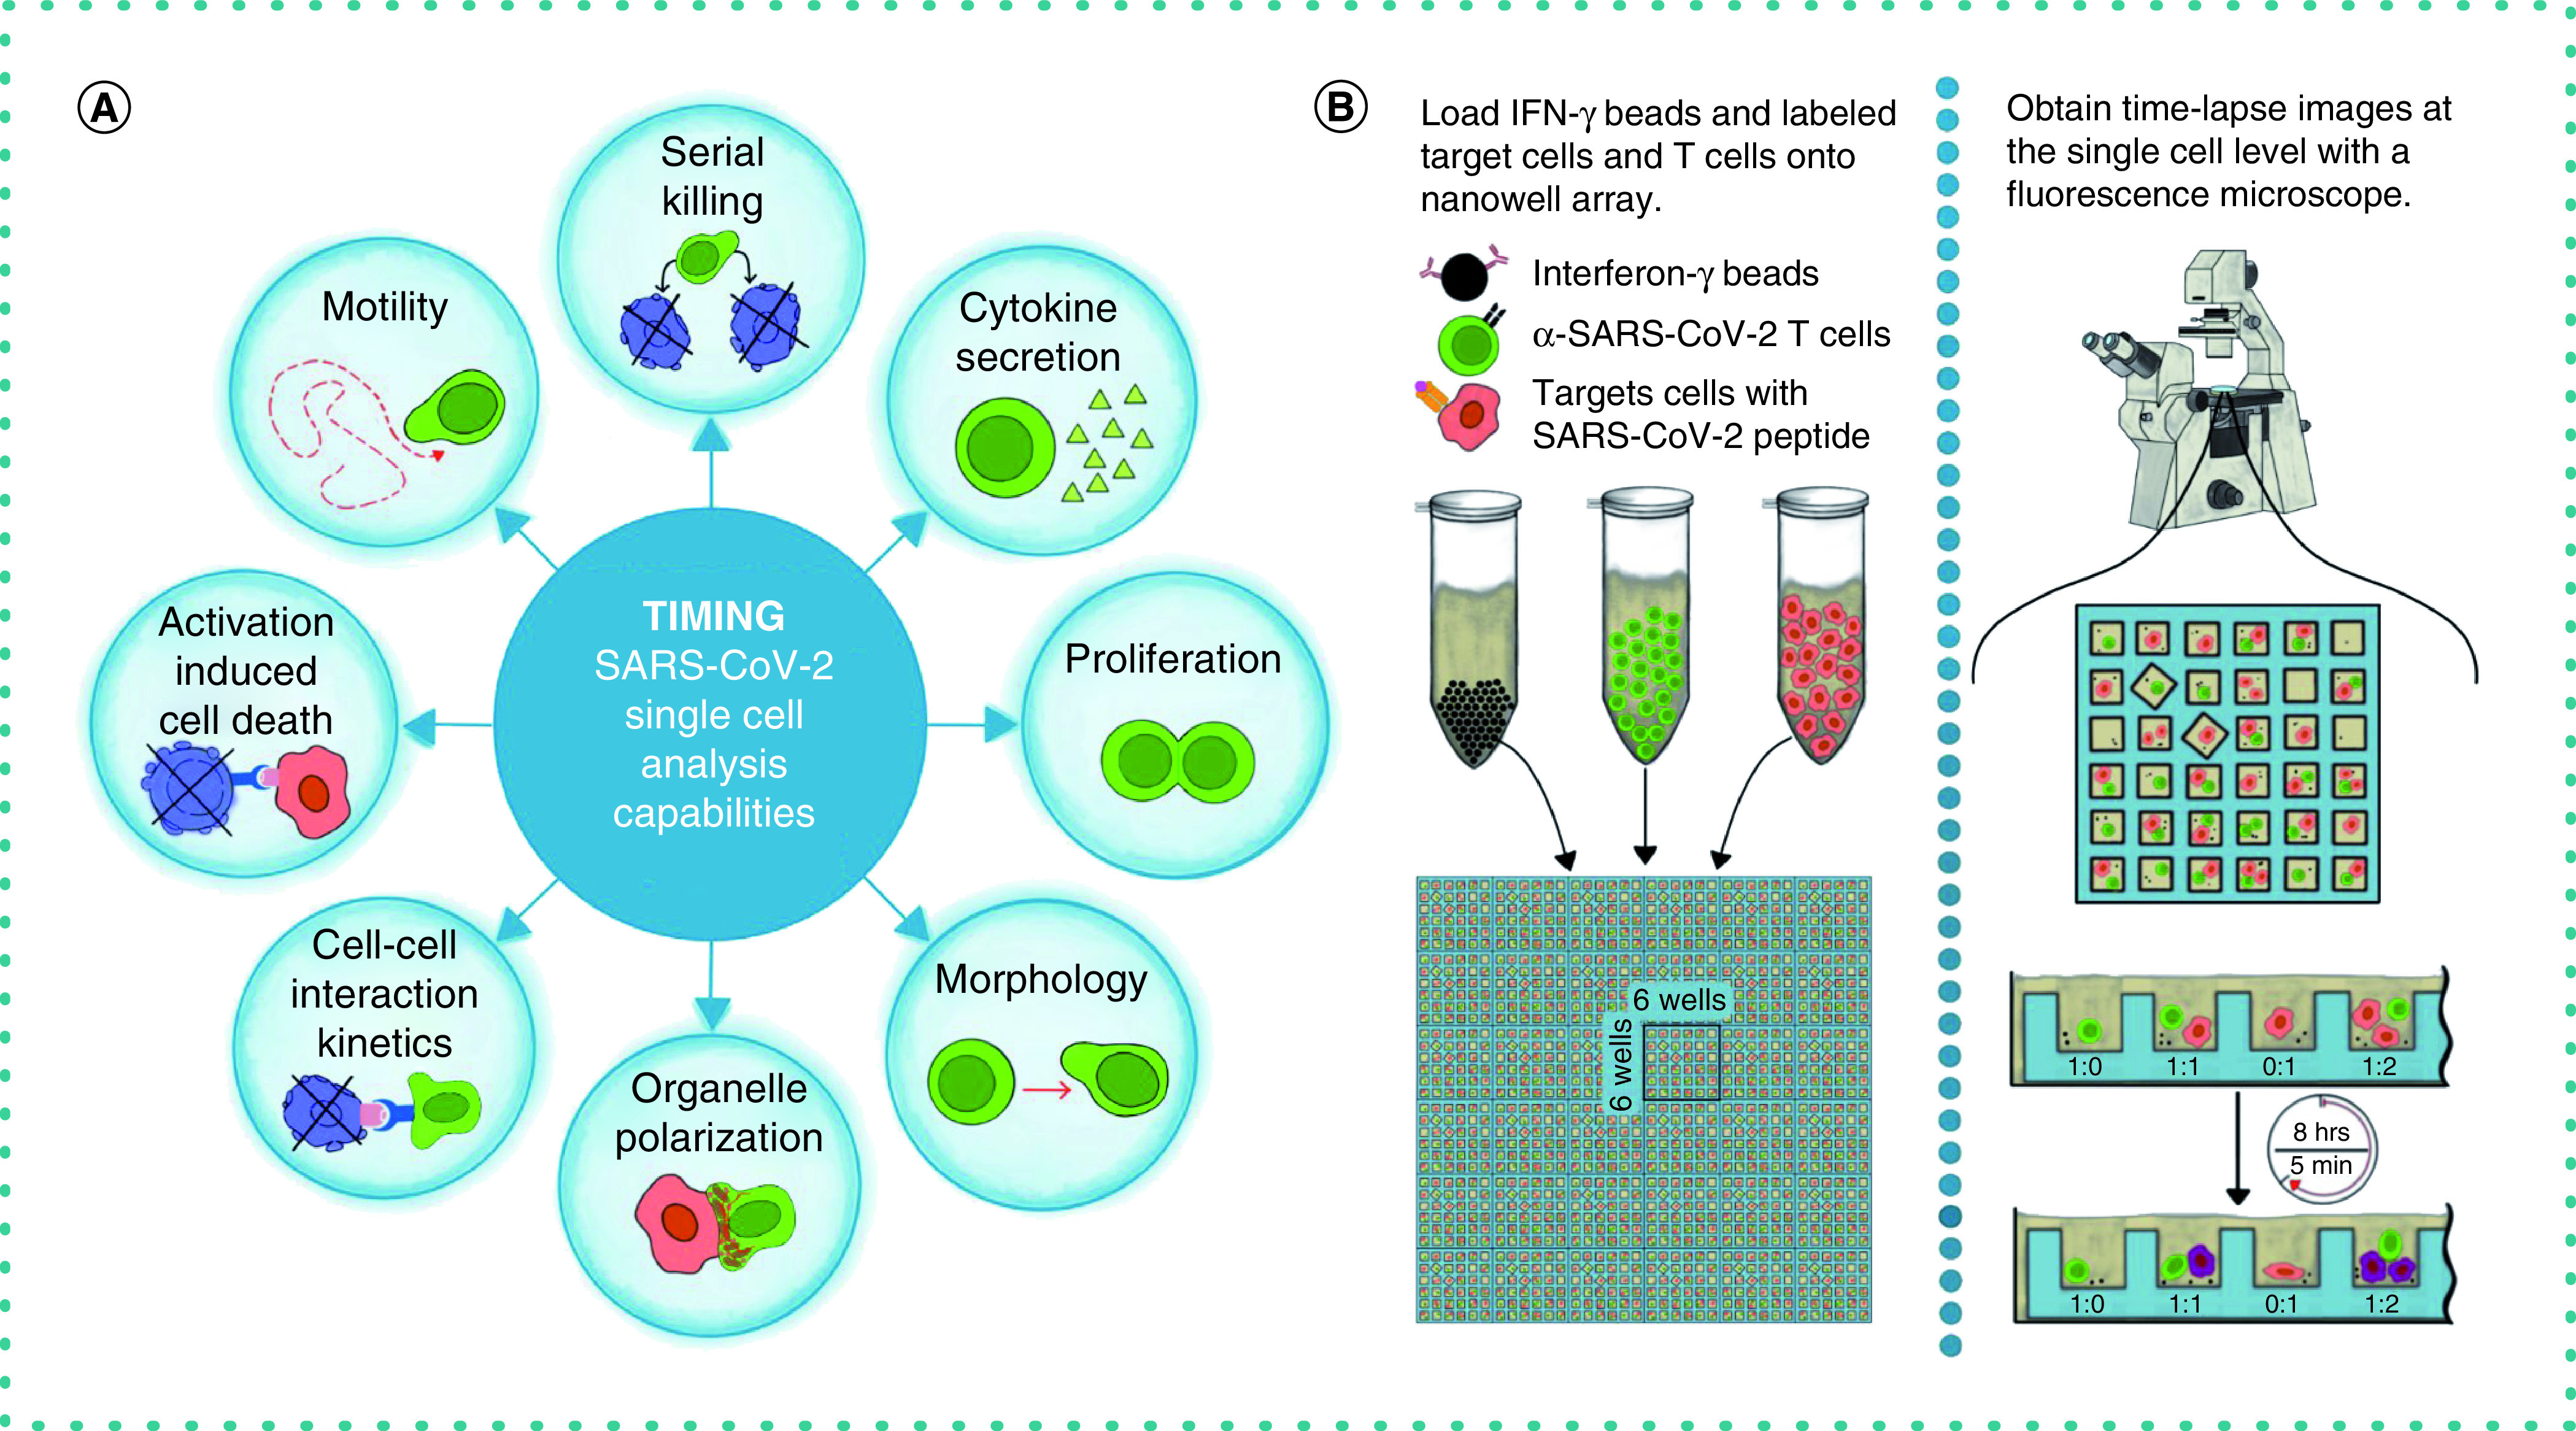
(A) Parameters measured by the time-lapse imaging microscopy in nanowell grids (TIMING) platform and (B) the workflow of a time-lapse imaging microscopy in nanowell grids assay. This platform is available on a fee-for-service basis through CellChorus (https://cellchorus.com/).
The TIMING platform was able to visualize, monitor and analyze the dynamic properties of SARS-CoV-2-specific T cells in stimulator cells pulsed with peptides derived from SARS-CoV-2 S protein. This revealed the heterogeneity of T cells in their ability to mediate a suite of effector functions and, in particular, cytotoxicity and cytokine production. These data inform the immune response of a patient with COVID-19, highlighting the complexity of T-cell responses.
Materials & methods
SARS-CoV-2-specific HLA-A*2-restricted cytotoxic T cells (Cellero, Cat #1142) were cultured in RPMI 1640 supplemented with 10% fetal bovine serum (FBS), 1% sodium pyruvate, 1% L-glutamine, 1% Pen/Strep, 1% HEPES and 50 IU/ml IL-2. A375 cells (ATCC, Cat #CRL-1619) were cultured in Dulbecco's modified Eagle medium (DMEM) supplemented with 10% FBS, 1% sodium pyruvate, 1% L-glutamine, 1% Pen/Strep and 1% HEPES. A375 cells were confirmed for the absence of mycoplasma contamination using real-time PCR. We used TIMING to evaluate T cell-mediated cytotoxicity at a single-cell scale, as previously described (Figure 1B) [8].
We prepared PLL-g-PEG (SuSoS, Dübendorf, Switzerland) solution by dissolving 1 mg of it in 10 mM HEPES buffer. They used PKH26 and PKH67 dye (Sigma-Aldrich, MO, USA, Cat #PKH26GL and #PKH67GL) for A375 and T-cell staining, accordingly. To prepare the capture beads for IFN-γ detection, we coated the goat anti-mouse IgG Dynabeads™ (Thermo Fisher Scientific, MA, USA, Cat #11033) with 40 μg/ml anti-human IFN-γ mAb 1-D1K (MABTECH, Stockholm, Sweden, Cat #3420-3-250) for 30 min, followed by two washes. AF647-Annexin V (Thermo Fisher Scientific, Cat #A23204) was used as a death marker and anti-CD28 antibody (Thermo Fisher Scientific, Cat #16-0289-81, Clone CD28.2) was used to stimulate the secretion of IFN-γ. We acquired all images using a Carl Zeiss Axio Observer (Jena, Germany) fitted with a Hamamatsu Orca-Flash sCMOS camera and a 20 × 0.8 NA objective. Images were collected and processed using an in-house algorithm for the tracking and segmentation of cells [7]. The steps to undertake TIMING are described below.
-
1.
Oxidize the nanowell array (144 blocks, each with 36 individual nanowells) with air plasma and incubate with PLL-g-PEG solution for 20 min at 37°C.
-
2.
Load the stained A375 target cells at density of 1 million/ml on the nanowell array and pre-incubate them with 5 μg/ml KLPDDFTGCV peptide (JPT, Berlin, Germany) for 60 min.
-
3.
Load the stained T cells at density of 1 million/ml and coated Dynabeads™ at 10 μg/ml on the nanowell array.
-
4.
Cover the nanoarray with media containing AF647-Annexin V and 5 μg/ml anti-CD28 antibody.
-
5.
Acquire images of the nanoarray for 8 h at 5-min intervals using an epifluorescent microscope.
-
6.
Incubate the array with 10 μg/ml biotinylated anti-human IFN-γ 7-B6-1 (MABTECH AB, Stockholm, Sweden, Cat #3420-6-250) and then 12 μg/ml AF647-Streptavidin (Jackson ImmunoResearch, PA, USA, Cat #016-600-084) for 30 min.
-
7.
Acquire images of the array for IFN-γ detection using an epifluorescent microscope (Figure 1B).
Results
Individual CTLs exhibit heterogeneity in killing efficacy
We deposited individual cells from a clonal human CD8+ CTL population specific for the SARS-CoV-2 spike epitope 424KLPDDFTGCV433 (hereafter, DD9), restricted by HLA-A*02, into the wells of a nanowell array. We performed an alignment of the S protein across the major circulating SARS-CoV-2 variants that showed the DD9 epitope is conserved across all major variants, including the Omicron variant (Supplementary Figure 1). As targets, we used the HLA-A*02 cell line, A375 cells, pulsed with the DD9 peptide. This process of sequential loading of cells yielded 308 nanowells containing a single effector cell and one or two target cells. Within the same nanowell array, 687 nanowells had only a single target cell, and 659 nanowells had only a single effector cell. These served as control experiments for monitoring spontaneous target and effector apoptosis (Supplementary Figure 2A). We subsequently loaded the nanowell array with beads functionalized with antibodies against IFN-γ. The beads were used to track IFN-γ secretion at the single-cell level and map IFN-γ secretion onto the multiple dynamic parameters measured using microscopy.
Tracking the interaction between effector and target cells revealed marked heterogeneity between individual CTLs. We observed that within all nanowells bearing 1E:1T (Ntotal = 270), 36% of the CTLs formed a stable synapse (conjugation of ≥10 min) (Figure 1A). Even among CTLs that contributed to such a synapse, only 27% of these cells induced apoptosis within the target cells (Figure 2A & Supplementary Figure 2B). These results demonstrate that there is intra-clonal functional heterogeneity within CTLs and that a minority of effector cells contribute to the majority of the killing observed. These results cannot be obtained when evaluating effector function across populations (Supplementary Figure 3).
Figure 2. Heterogeneous population of cytotoxic T cells.
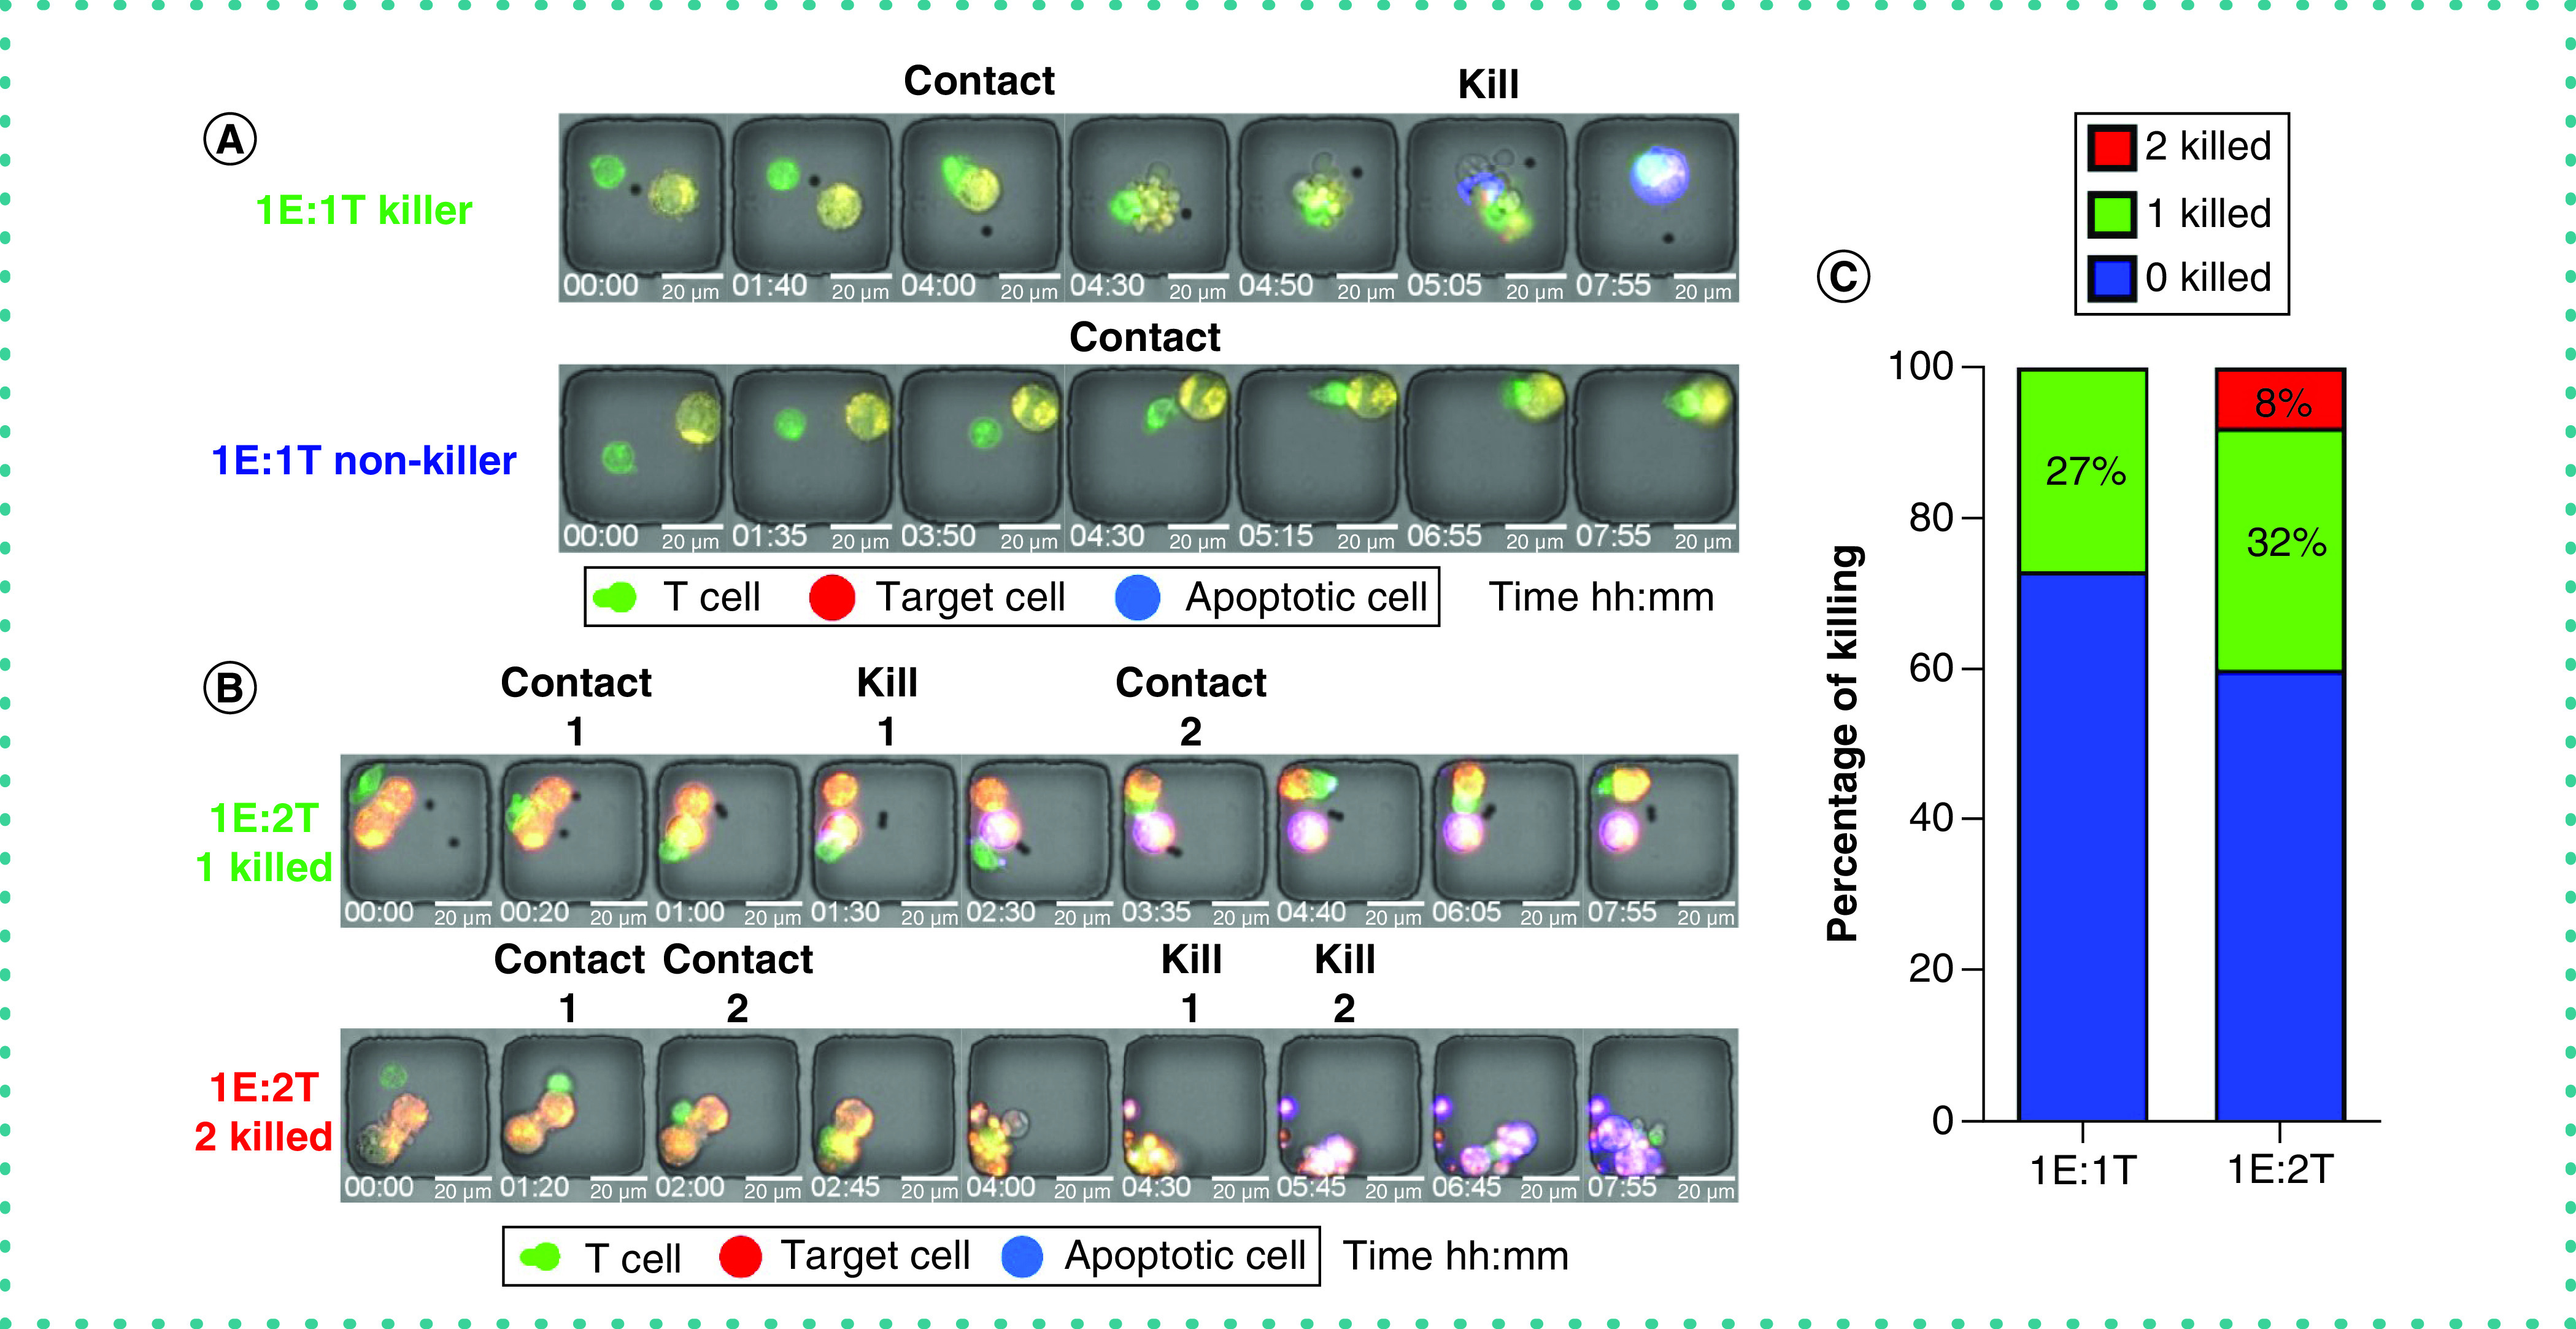
(A) The micrographs of a killer and a non-killer T cell after contacting target cells (1E:1T). (B) The micrographs of a killer and a serial killer T cell (1E:2T). (C) Percentage of killer T cells in two E:T ratios (1E:1T, 1E:2T). The “2 killed” subpopulation indicates serial killer T cells.
The superior killing ability observed for a subpopulation of CTLs can be attributed to a subpopulation of serial killer T cells. TIMING allows the direct identification and quantification of serial killing by individual T cells. This was achieved by analyzing nanowells bearing 1E:2T (Figure 2B & Supplementary Video 1). In these nanowells, 32% of T cells lysed one target, whereas 8% of CTLs participated in serial killing (eliminated both targets) (Figure 2C). Collectively, these data demonstrate that most of the killing capacity of the virus-specific T cells is from a small fraction of killer and serial killer effector cells.
Kinetics of T cell-mediated killing
The formation and duration of a synapse between T cells and target cells are critical parameters that describe the efficiency with which killing occurs. The kinetics of T cell and target cell interactions were segmented into three defined stages: tSeek, the amount of time it takes T cells to locate target cells and establish a stable synapse (contact lasting at least 10 min); tContact, the duration of stable synapse; and tDeath, the time from establishing a stable synapse until induction of apoptosis in a target cell (Figure 3A). tSeek was shorter in killer T cells in comparison with non-killer T cells that formed a synapse but did not induce apoptosis in any target cells (Figure 3B & E & Supplementary Video 2). After establishment of the synapse, killer T cells delivered the lytic hit and detached prior to the induction of apoptosis in target cells (Figure 3C). In contrast to killer T cells, non-killer T cells failed to efficiently terminate the synapse and remained conjugated to the target cells significantly longer (Figure 3D). Collectively, these results suggest that killer T cells are time efficient at the establishment of synapse, termination of synapse and subsequent detachment. It has been demonstrated that this cycle of efficient conjugation and detachment is associated with sustained killing in lymphocytes [9].
Figure 3. Kinetics of cytotoxic T lymphocyte killing.
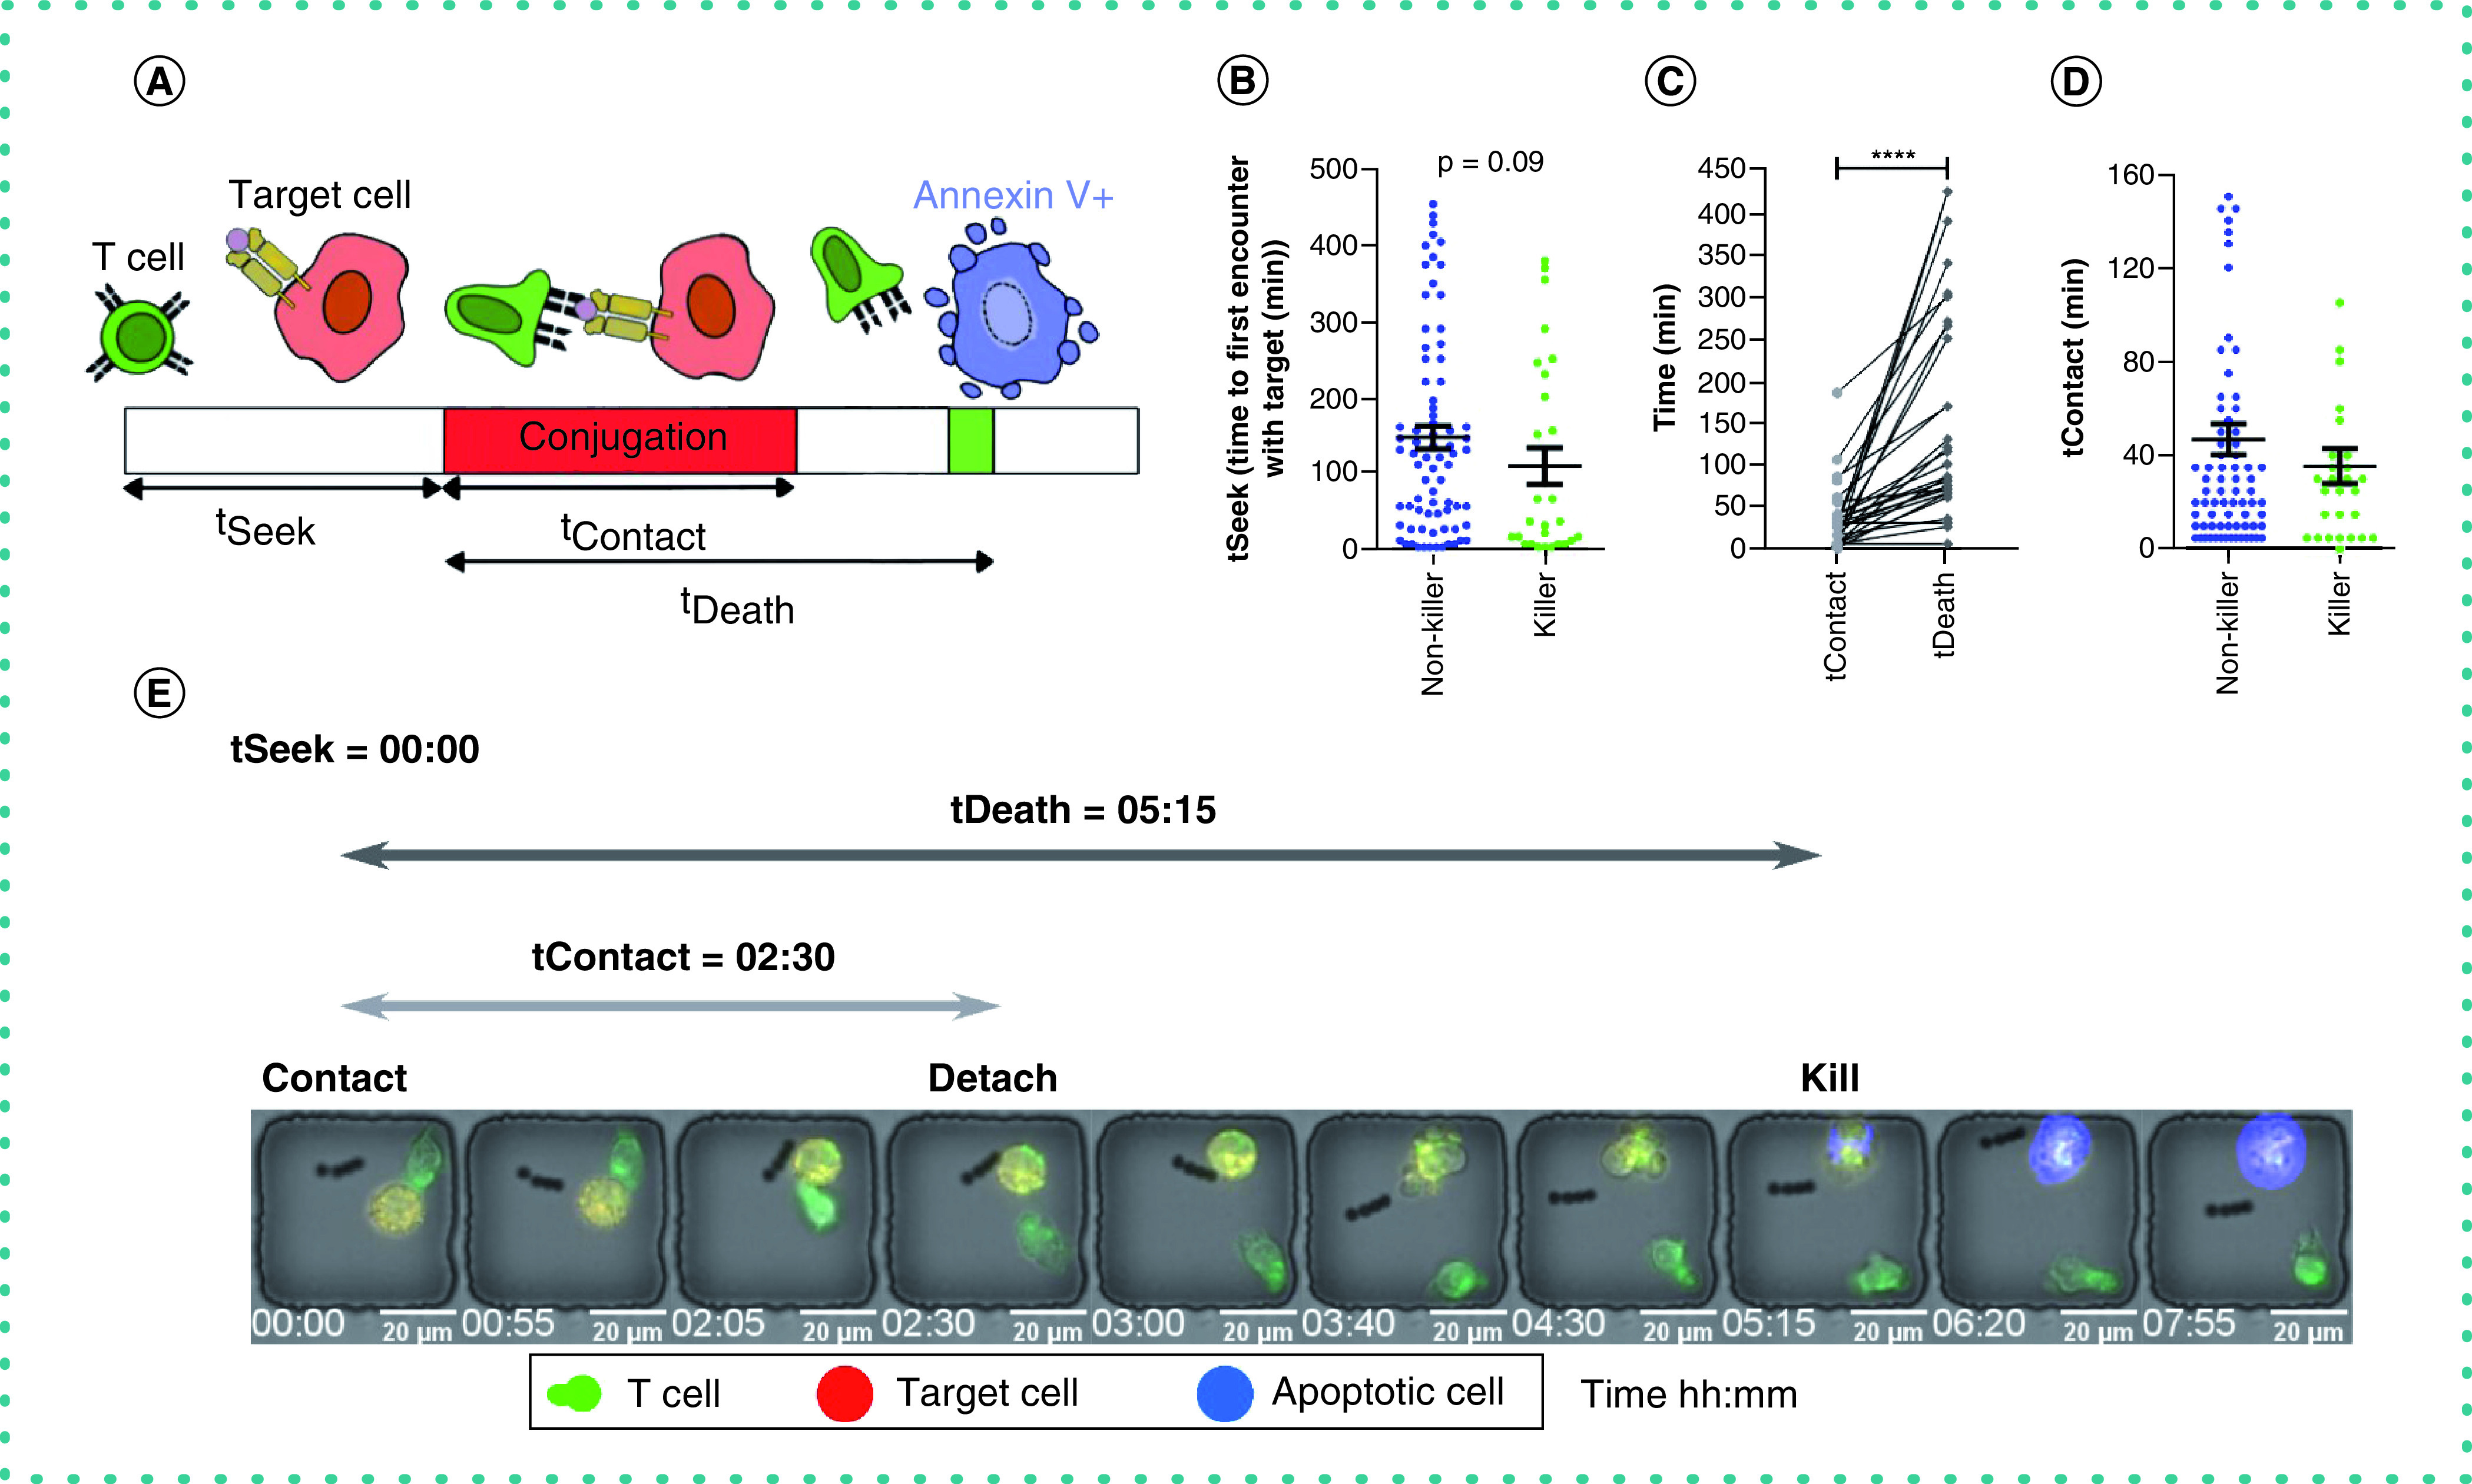
(A) Schematic of the dynamic parameters measured by the time-lapse imaging microscopy in nanowell grids platform. (B) Time to first contact with target (tSeek) between killer and synaptic cells with mean ± standard error of the mean and Mann–Whitney t-test. (C) Comparison of contact duration (tContact) and time to induce target death (tDeath) for single cells with Mann–Whitney t-test and ****p < 0.00001. (D) Duration of stable synapse (tContact) between killer and synaptic cells with mean ± standard error of the mean. (E) A micrograph of a killer T cell detaching from a target cell before the induction of apoptosis.
Quantifying the motility of single cells
A key property of T cells is their ability to migrate in search of target cells. We tracked the motility of individual T cells in nanowells populated with 1E:0T (Ntotal = 659) and observed that there was a gradient in effector cell motility ranging from 0.1 to 3.0 μm/min. We also evaluated the dynamic shape of T cells and observed that migrating cells had a lower aspect ratio of polarization in comparison with non-migrating T cells, which were predominantly circular (Figure 4A). We observed significant differences in the frequency of synapse forming T cells based on their motility (Figure 4B & Supplementary Video 3). These observations highlight the fact that migration and seeking of the target cells are a prerequisite for T-cell effector functionality such as cytotoxicity.
Figure 4. The motility and polarization of T cells.
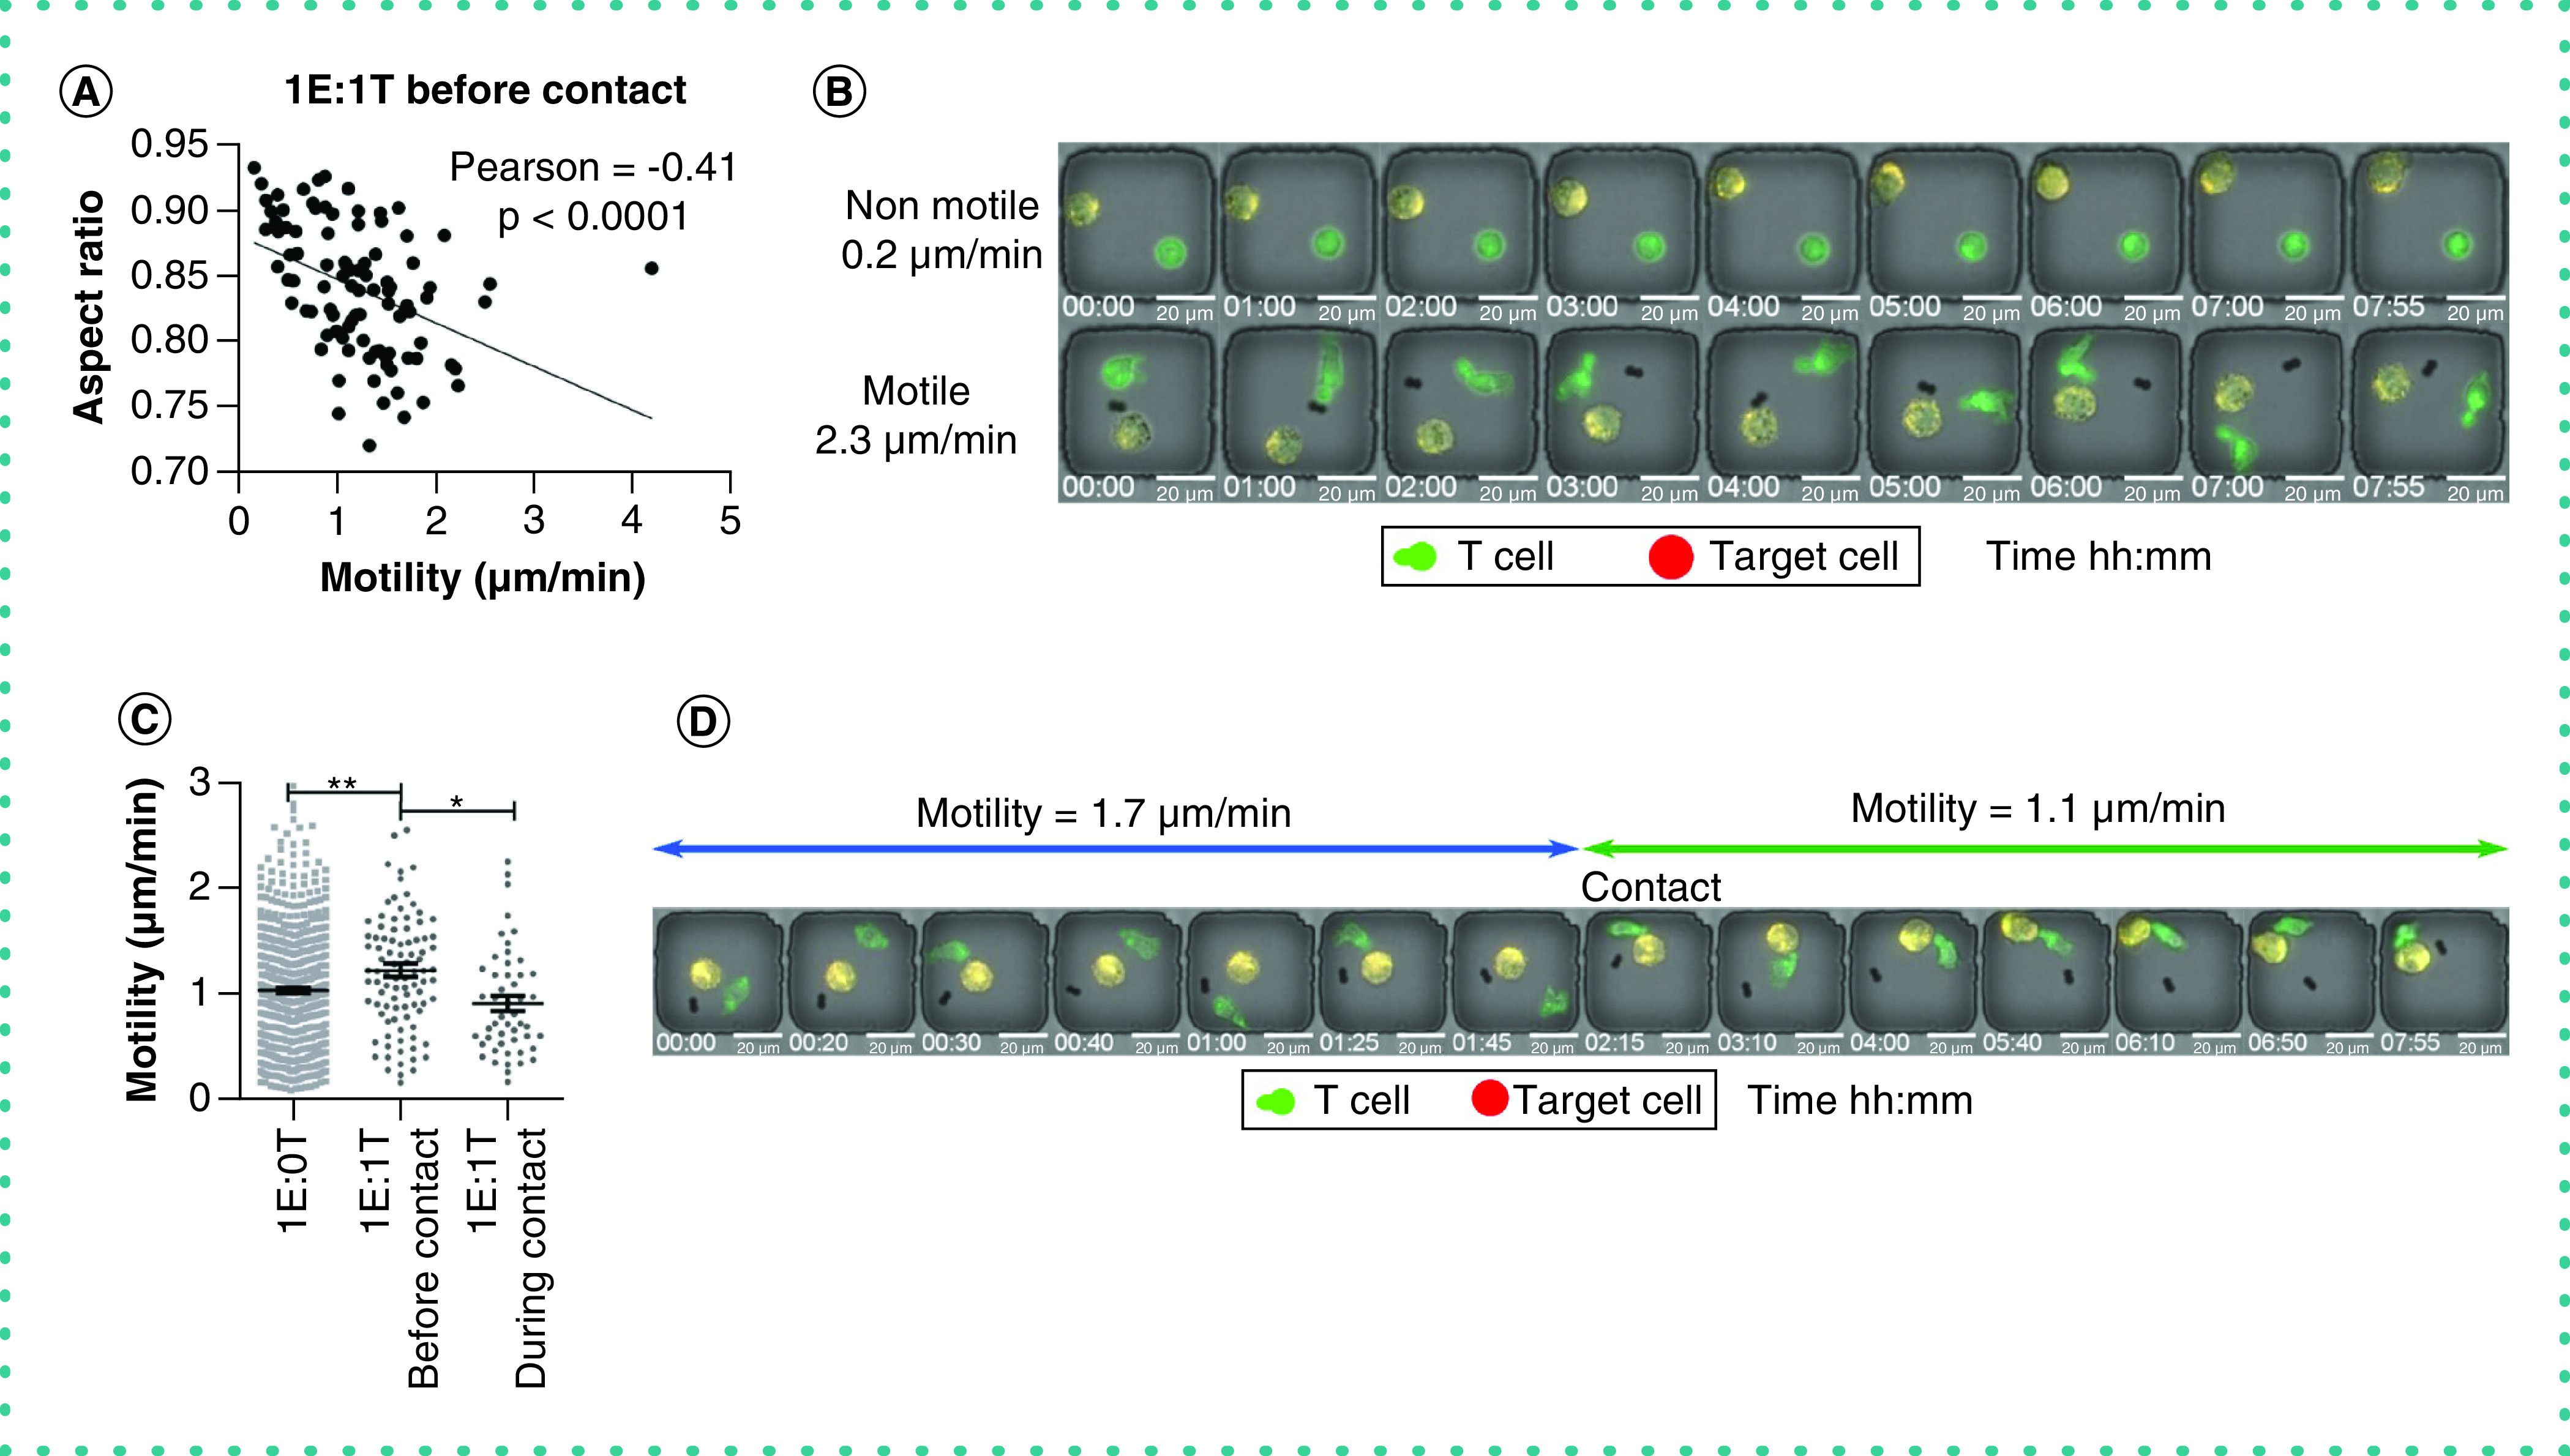
(A) The negative correlation of aspect ratio and motility of T cells before contacting a target cell (1E:1T). (B) The micrographs of a non-motile and a motile T cell before contacting a target cell (1E:1T). (C) The motility of T cells in the absence (1E:0T) and presence (1E:1T) of a target cell. In cases of 1E:1T, the motility before and during contact is presented. Each data point represents a single cell with mean ± standard error of the mean. Mann–Whitney t-test with *p < 0.01, **p < 0.001. (D) The micrograph of a T cell before and during contacting a target cell.
We tracked the motility of individual T cells in nanowells in two states: with and without conjugation to a target cell. The motility of T cells without conjugation to a target cell (1E:1T) increased compared with T cells located in wells without a target cell (1E:0T). This suggests that T-cell motility is activated by co-incubation with target cells. Upon conjugation to a target cell, however, there was a noticeable drop in the motility of individual T cells, consistent with the known immunobiology of T cells in arresting motility to optimize effector function (Figure 4C & 4D) [10].
Mapping the secretion of killing activity & cytokine production at the resolution of individual T cells
In addition to killing, CTLs are capable of secreting anti-viral cytokines such as IFN-γ. We have previously shown that killing and cytokine secretion can be decoupled within virus-specific T cells [11]. To investigate the relationship between killing and cytokine secretion at single-cell resolution, we tracked individual T cells that formed a synapse (1E:1T) and mapped the polyfunctionality of killing activity and cytokine production. Polyfunctional cells constituted only 11% of the population, whereas the dominant population of T cells were non-functional (KillingnegIFN-γneg) (Figure 5A & Supplementary Video 4). Next, we compared the rate of secretion of IFN-γ between killer and non-killer T cells (based on the intensity of immunofluorescence on the bead [12]) and observed that killer CTLs secreted significantly higher amounts of IFN-γ compared with non-killer T cells (Figure 5B). Collectively, these results illustrate that an elite subpopulation of T cells is capable of both killing and IFN-γ secretion.
Figure 5. Quantification of IFN-γ secretion from T cells.
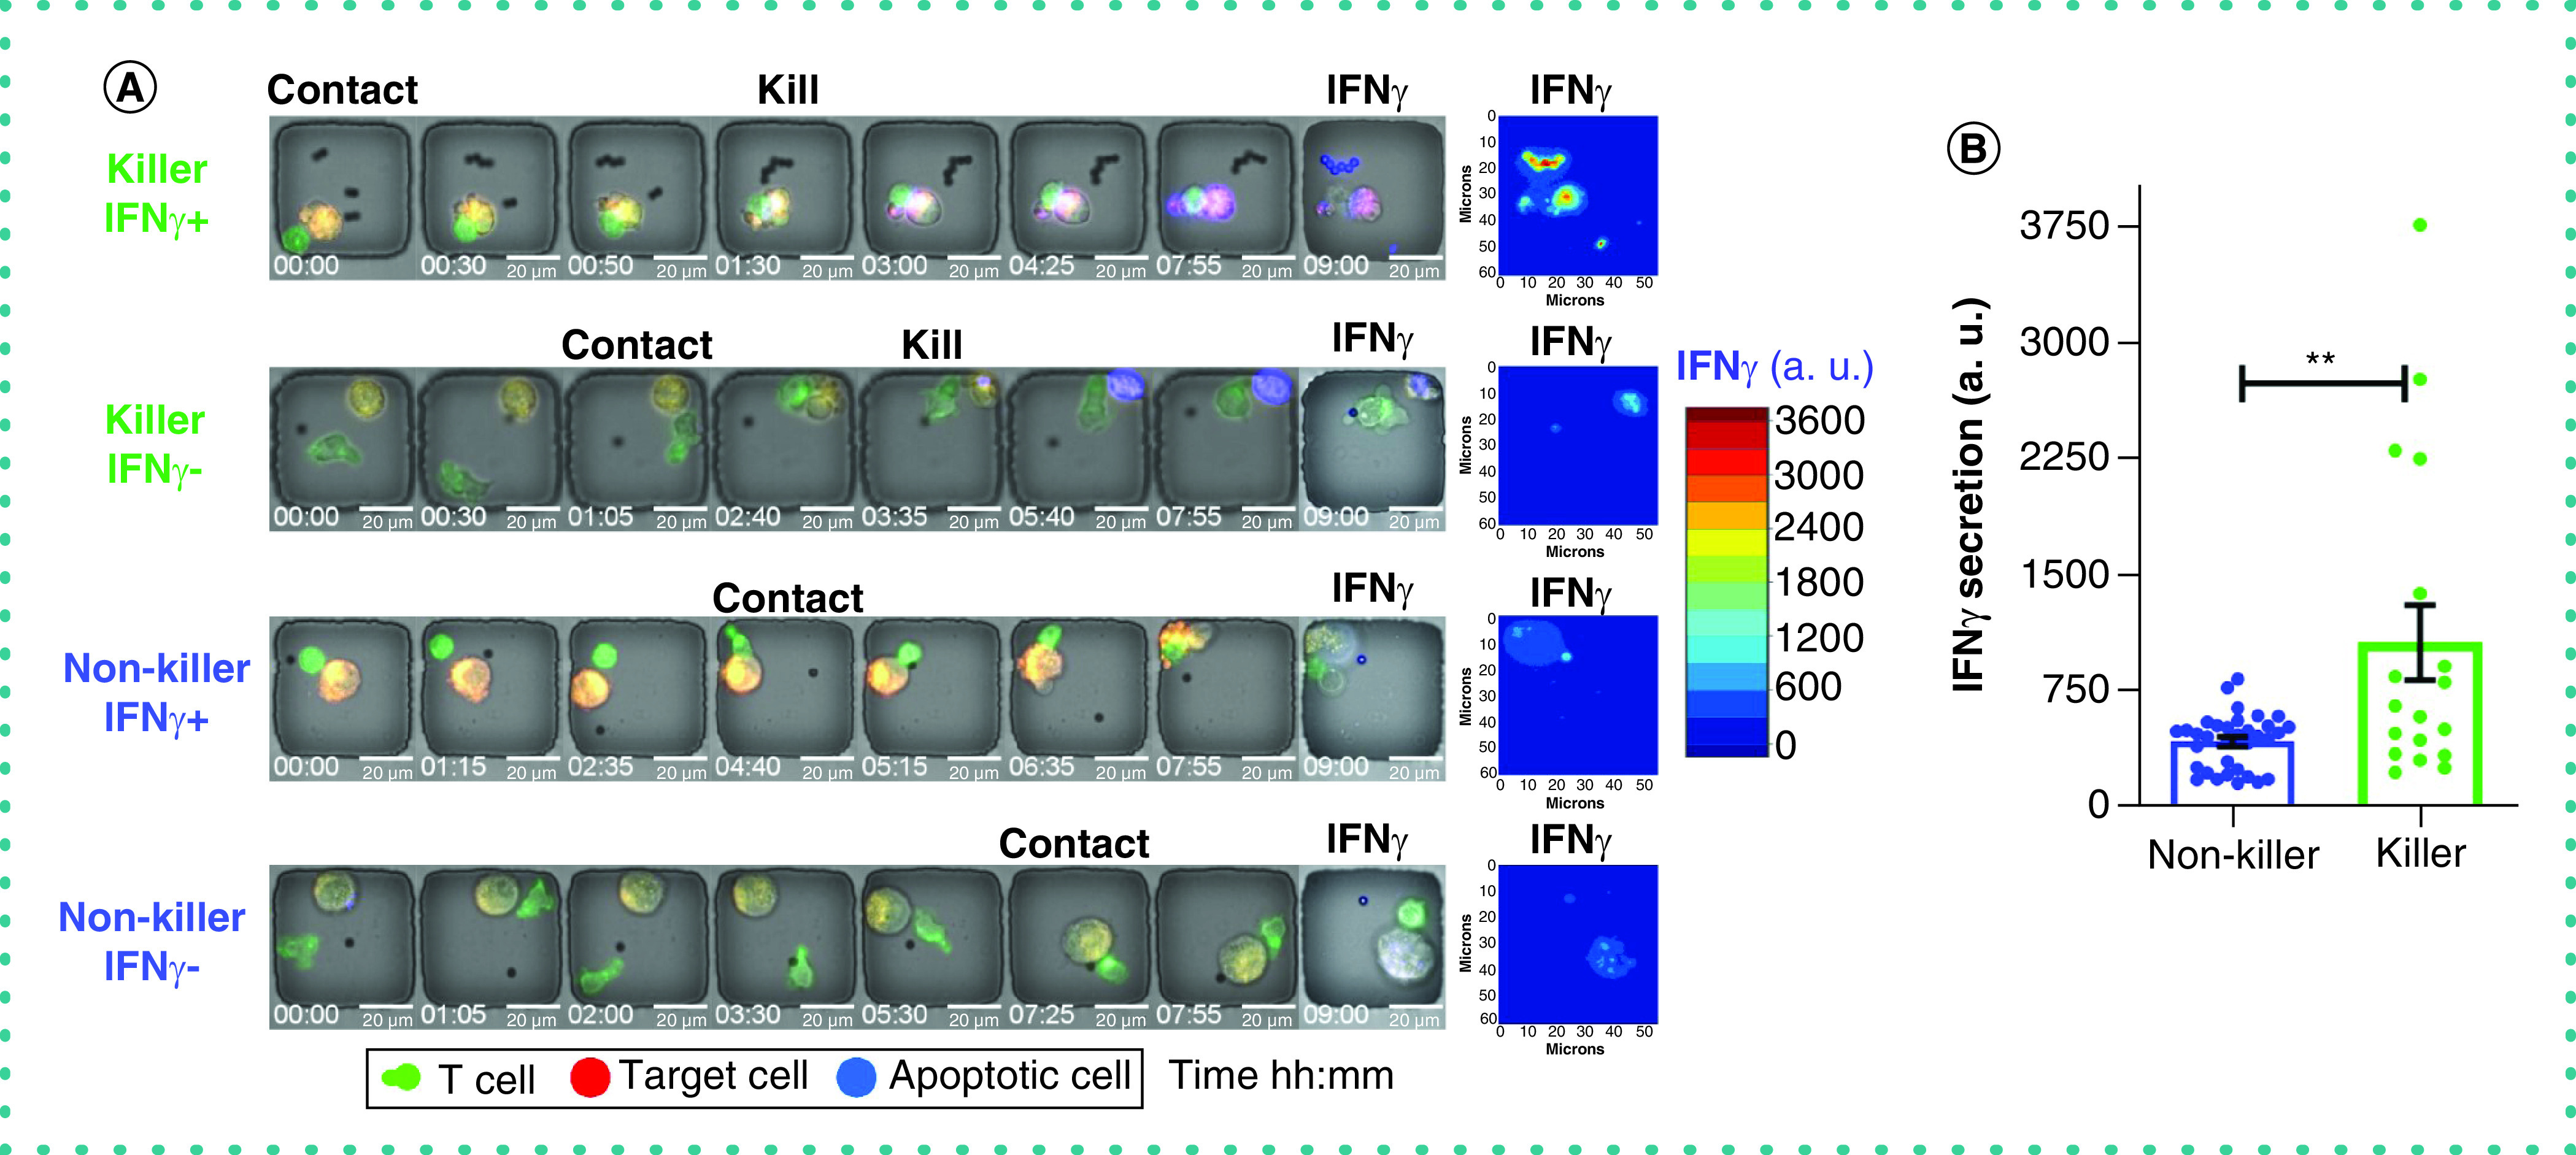
(A) The micrographs of two killer T cells and two non-killer T cells with high and low secretion of IFN-γ (all 1E:1T). The intensity of detection antibody on the bead (specific for IFN-γ) at end point images represents the secretion of IFN-γ. The contour map shows the intensity of IFN-γ on the beads. (B) The quantified secretion of IFN-γ from each cell (killer and non-killer). Each data point represents a single cell with mean ± standard error of the mean, Mann–Whitney t-test with **p < 0.001.
Serial killer CTLs have reduced activation-induced cell death occurrences
Activation-induced cell death (AICD) is a negative regulator of T cells and can titrate the potency and efficacy of effector cells [13]. Since TIMING serially tracks apoptosis occurring in both effector cells and target cells, we quantified the frequency of AICD in T cells as a function of their killing capacity (Figure 6A & Supplementary Video 5). Within all nanowells with evidence of T-cell synapse formation (1E:1T), we observed an elevated frequency of killer CTLs undergoing AICD compared with non-killer CTLs. This observation was reversed when comparing serial killer CTLs (1E:2T) to non-killer CTLs (1E:2T) (Figure 6B). These observations revealed that serial killer CTLs are more resistant to AICD than non-killer CTLs.
Figure 6. Quantifying activation-induced cell death (AICD) in T cells.
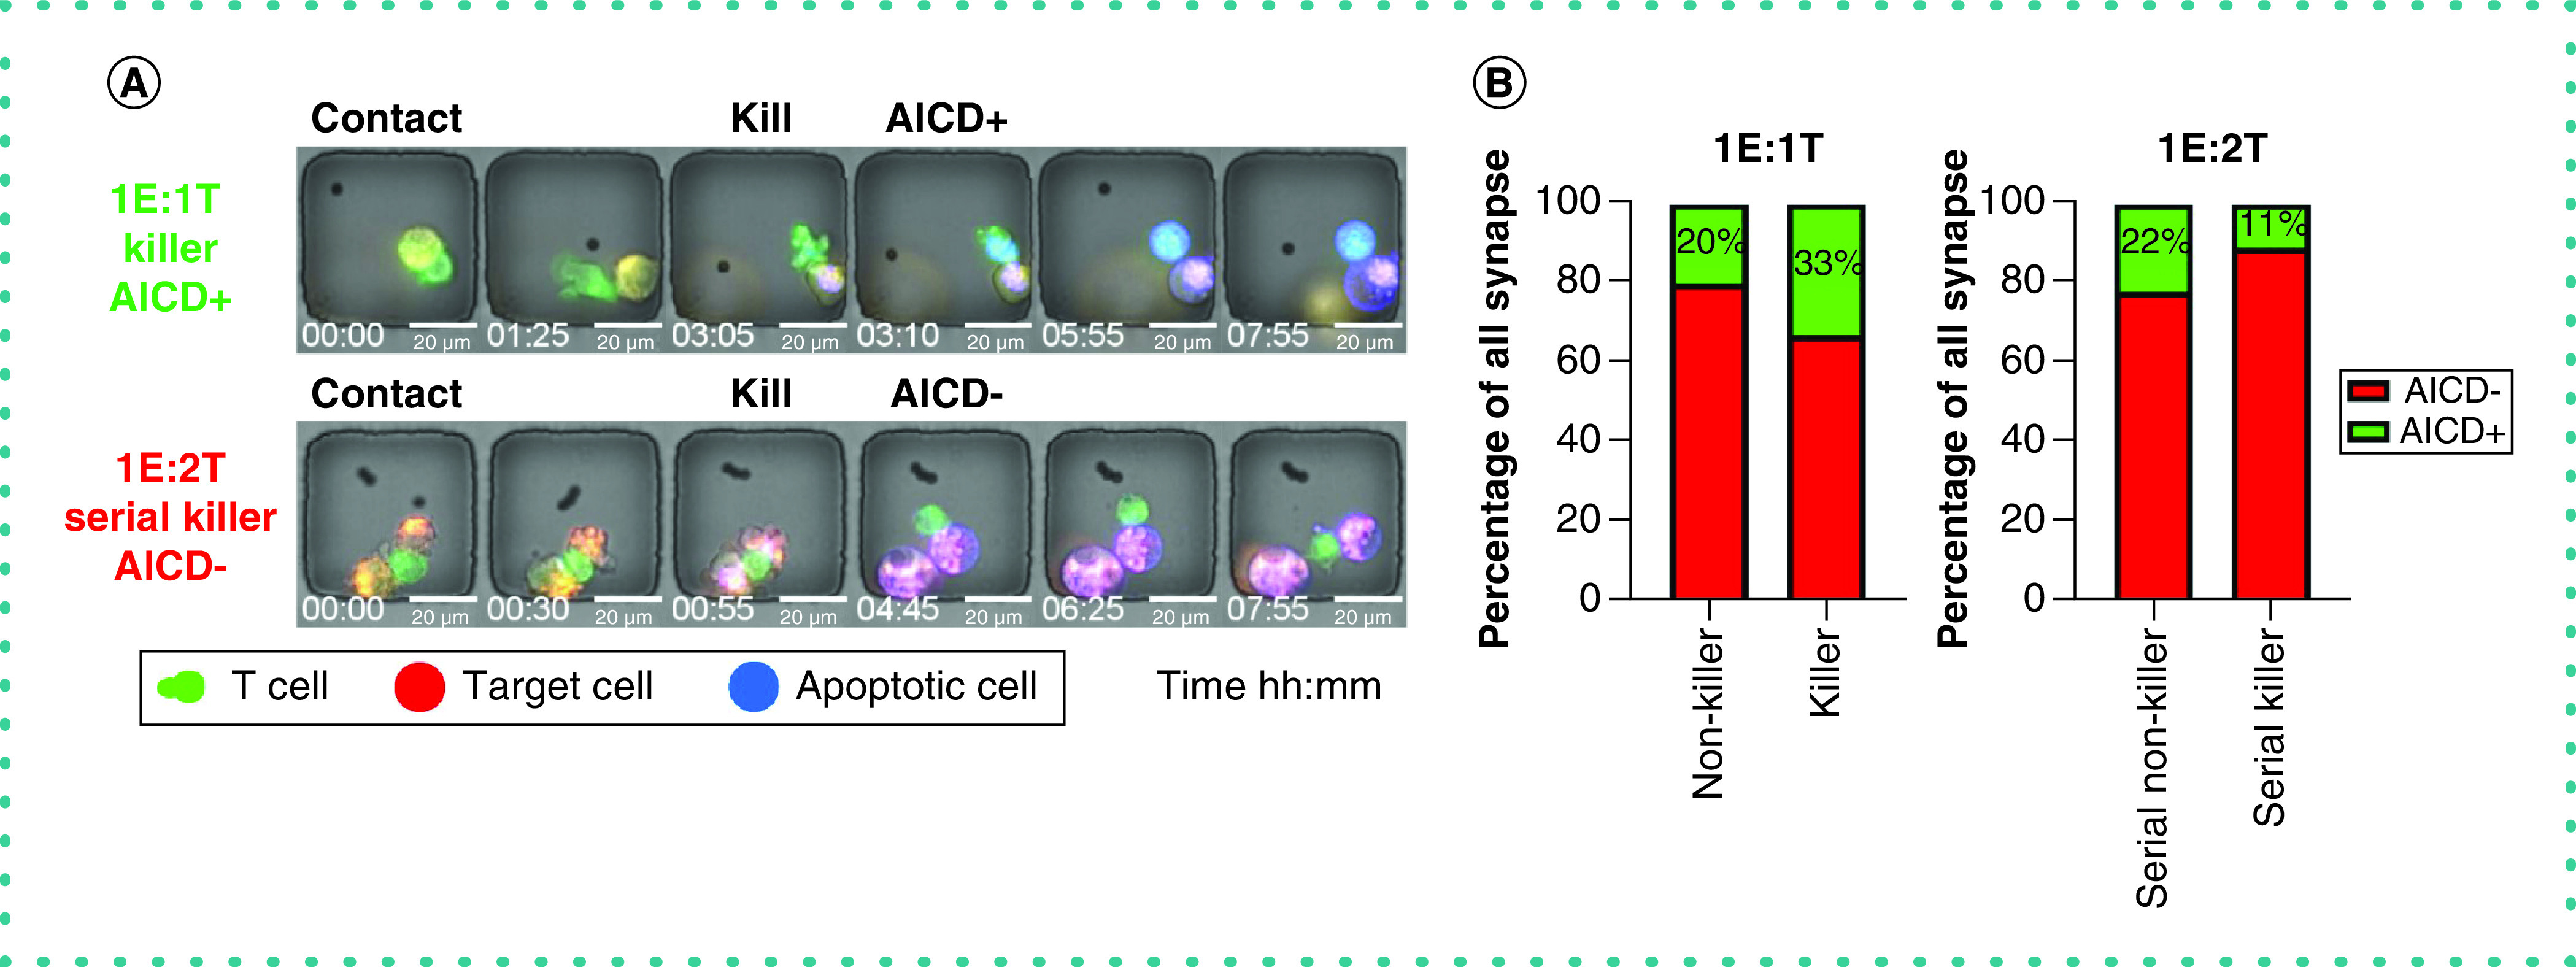
(A) Micrographs of a killer T cell (1E:1T) succumbing to AICD and a serial killer T cell (1E:2T) surviving AICD. (B) Percentage of killer and serial killer T cells that either survived or were eliminated through AICD.
Conclusion
Current commercial vaccines for SARS-CoV-2 significantly reduce mortality and morbidity, but the rise of new mutations may challenge these successes [14]. Understanding a complete immune response by evaluating cellular immunity as well as humoral response is critical to appreciate the potential for vaccines to control new viral variants and to help understand those who have recovered from viral-induced disease. Variants of SARS-CoV-2 began to emerge toward the end of 2021 and raised the possibility that these viruses may evolve to elude immune defenses after infection or vaccination [14]. Studies have since investigated whether immunity is protective by examining responses in people who had contracted and recovered from SARS-CoV-2 prior to the widespread emergence of variants. These data reveal that CD8+ T cells remain active against the virus [4,15].
The TIMING platform provides a new approach to understanding the complexity of the cellular immune response. This microscopy technique offers multiple advantages to dissecting T-cell responses to SARS-CoV-2. First, it synchronously monitors thousands of individual T cells as they move in their environment. Second, it analyzes T cells that recognize target cells bearing virally derived peptides. Third, it reveals T cells that are capable of polyfunctionality based on killing, serial killing and secretion of IFN-γ. These three groups of data are integrated to reveal the dynamic interplay between T cells and target cells. This study has focused on a single epitope derived from the S protein, and it remains to be seen whether T cells targeting other SARS-CoV-2 proteins such as the nucleocapsid protein can function as serial killers. The TIMING platform reported here is uniquely positioned to be able to answer these questions related to T-cell polyfunctionality. To the best of our knowledge, this is the first report directly demonstrating that a subpopulation of CTLs specific for a conserved SARS-CoV-2 epitope comprises serial killers. The ability of CTLs to efficiently kill target cells presenting conserved epitopes illustrates the power of T cell-mediated immunity and emphasizes the need to study cellular immune responses in the context of infection and vaccines. From a clinical perspective, the direct role of CD8+ T cells in eliminating virally infected target cells is significant in at least two ways. First, CD8+ T cells primed from previous coronavirus infections are predicted to be cross-reactive and it has been hypothesized that these cross-reactive T cells can explain the relatively mild symptoms experienced by most people infected with SARS-CoV-2 [16]. Whether these pre-existing CD8+ T cells can kill target cells expressing SARS-CoV-2 antigens needs to be directly tested. Second, T cell-centric vaccines are being developed as next-generation vaccines for SARS-CoV-2, and T cell-mediated killing is one of the primary mechanisms that needs to be elicited for vaccine-induced protection [17].
More broadly, TIMING is an integrated platform that leverages advances in microfabrication, microscopy and AI to enable the profiling of thousands of time-lapse microscopy experiments in parallel. As we have shown previously, the ability to integrate the dynamic profile with downstream clonal expansion or linked transcriptional profiling makes TIMING the only platform capable of generating dynamic multiomic datasets [18,19].
Future perspective
The management of SARS-CoV-2 and other future viruses requires a comprehensive understanding of adaptive immune response. The scientific and policymaking communities have traditionally relied heavily on evaluating antibodies to understand immunity and vaccine response. As antibody-related immunity due to prior infection and vaccination declines over time, it is crucial to study T cells to improve policymaking and the development of novel vaccines and therapeutics. Just as single-cell sequencing has revolutionized our understanding of genomics and transcriptomics, dynamic single-cell analysis will revolutionize our understanding of immune cells in the context of vaccines and immunotherapies.
Summary points.
T-cell response can retain the ability to recognize and kill cells infected by SARS-CoV-2.
Cytotoxic T lymphocytes exhibit heterogeneity in killing efficacy against infected cells.
The limitation of current techniques in profiling the dynamics of cell–cell interaction escalates the importance of a single-cell assay.
Time-lapse imaging microscopy in nanowell grids evaluates the dynamics of cells by measuring cytotoxicity, secretion of cytokines and exhaustion.
Time-lapse imaging microscopy in nanowell grids identifies subsets of cells with unique functional characteristics.
Supplementary Material
Supplementary data
To view the supplementary data that accompany this paper please visit the journal website at: www.future-science.com/doi/suppl/10.2144/btn-2022-0016
Author contributions
M Fathi performed experiments; M Fathi, L Charley, N Varadarajan and DD Meyer interpreted and analyzed data; L Charley, LJN Cooper, N Varadarajan and DD Meyer provided advice on experiments and commented on the manuscript; M Fathi, N Varadarajan and DD Meyer designed and directed the study; and M Fathi, L Charley, N Varadarajan and DD Meyer wrote the manuscript.
Acknowledgments
The authors would like to thank M Martinez Paniagua and M Montalvo for their help on the Cytation bulk cytotoxicity assay. They would also like to thank A Rezvan for the fabrication of the nanowell arrays.
Ethical conduct of research
All work outlined in this report was performed according to protocols approved by the Institutional Review Board at the University of Houston.
Open access
This work is licensed under the Attribution-NonCommercial-NoDerivatives 4.0 Unported License. To view a copy of this license, visit http://creativecommons.org/licenses/by-nc-nd/4.0/
Footnotes
Financial & competing interests disclosure
N Varadarajan was supported by the NIH (R01GM143243), CPRIT (RP180466), MRA Established Investigator Award (509800), NSF (1705464), CDMRP (CA160591) and Owens Foundation. DD Meyer, N Varadarajan, M Fathi, L Charley and LJN Cooper have equity ownership in CellChorus. LJN Cooper receives royalties from Bristol Myers Squibb (via City of Hope National Medical Center) and Immatics (via MD Anderson Cancer Center); holds receipts of intellectual property rights from Sangamo BioSciences, MD Anderson Cancer Center, and Ziopharm Oncology; and has equity ownership interest in Targazyme, Ziopharm Oncology, Immatics, Secure Transfusion Services, AuraVax Therapeutics and IterateBio. N Varadarajan has equity ownership in AuraVax Therapeutics and owns intellectual property rights from UH. The authors have no other relevant affiliations or financial involvement with any organization or entity with a financial interest in or financial conflict with the subject matter or materials discussed in the manuscript apart from those disclosed.
No writing assistance was utilized in the production of this manuscript.
References
- 1.Steensels D, Pierlet N, Penders J, Mesotten D, Heylen L. Comparison of SARS-CoV2 antibody response following vaccination with BNT162b2 and mRNA-1273. JAMA 326(15), 1533–1535 (2021). [DOI] [PMC free article] [PubMed] [Google Scholar]
- 2.Zhong D, Xiao S, Debes AK, Egbert ER, Caturegli P. Durability of antibody levels after vaccination with mRNA SARS-CoV-2 vaccine in individuals with or without prior infection. JAMA 326(24), 2524–2526 (2021). [DOI] [PMC free article] [PubMed] [Google Scholar]
- 3.Lee S, Miller SA, Wright DW, Rock MT, Crowe JE Jr. Tissue-specific regulation of CD8+ T-lymphocyte immunodominance in respiratory syncytial virus infection. J. Virol. 81(5), 2349–2358 (2007). [DOI] [PMC free article] [PubMed] [Google Scholar]
- 4.Redd AD, Nardin A, Kared H et al. CD8+ T cell responses in COVID-19 convalescent individuals target conserved epitopes from multiple prominent SARS-CoV-2 circulating variants. Open Forum Infec. Dis. 8(7), ofab143, US: Oxford University Press (2021). [DOI] [PMC free article] [PubMed] [Google Scholar]
- 5.Tan AT, Lim JM, Le Bert N et al. Rapid measurement of SARS-CoV-2 spike T cells in whole blood from vaccinated and naturally infected individuals. J. Clin. Investig. 131(17),e152379 (2021). [DOI] [PMC free article] [PubMed] [Google Scholar]
- 6.An X, Varadarajan N. Single-cell technologies for profiling T cells to enable monitoring of immunotherapies. Curr. Opin. Chem. Engr. 19, 142–152 (2018). [DOI] [PMC free article] [PubMed] [Google Scholar]
- 7.Liadi I, Singh H, Romain G et al. Individual motile CD4+ T cells can participate in efficient multikilling through conjugation to multiple tumor cells. Cancer Immunol. Res. 3(5), 473–482 (2015). [DOI] [PMC free article] [PubMed] [Google Scholar]
- 8.Merouane A, Rey-Villamizar N, Lu Y et al. Automated profiling of individual cell–cell interactions from high-throughput time-lapse imaging microscopy in nanowell grids (TIMING). Bioinformatics 31(19), 3189–3197 (2015). [DOI] [PMC free article] [PubMed] [Google Scholar]
- 9.Netter P, Anft M, Watzl C. Termination of the activating NK cell immunological synapse is an active and regulated process. J. Immunol. 199(7), 2528–2535 (2017). [DOI] [PubMed] [Google Scholar]
- 10.Deguine J, Breart B, Lemaître F, Di Santo JP, Bousso P. Intravital imaging reveals distinct dynamics for natural killer and CD8(+) T cells during tumor regression. Immunity 33(4), 632–644 (2010). [DOI] [PubMed] [Google Scholar]
- 11.Varadarajan N, Julg B, Yamanaka YJ et al. A high-throughput single-cell analysis of human CD8+ T cell functions reveals discordance for cytokine secretion and cytolysis. J. Clin. Investig. 121(11), 4322–4331 (2011). [DOI] [PMC free article] [PubMed] [Google Scholar]
- 12.An X, Sendra VG, Liadi I et al. Single-cell profiling of dynamic cytokine secretion and the phenotype of immune cells. PLoS One 12(8), e0181904 (2017). [DOI] [PMC free article] [PubMed] [Google Scholar]
- 13.Zhong X, Matsushita M, Plotkin J, Riviere I, Sadelain M. Chimeric antigen receptors combining 4-1BB and CD28 signaling domains augment PI3kinase/AKT/Bcl-XL activation and CD8+ T cell-mediated tumor eradication. Mol. Ther. 18(2), 413–420 (2010). [DOI] [PMC free article] [PubMed] [Google Scholar]
- 14.Scott L, Hsiao N, Moyo S et al. Track Omicron's spread with molecular data. Science 374(6574), 1454–1455 (2021). [DOI] [PubMed] [Google Scholar]
- 15.Alter G, Yu J, Liu J et al. Immunogenicity of Ad26.COV2.S vaccine against SARS-CoV-2 variants in humans. Nature 596(7871), 268–272 (2021). [DOI] [PMC free article] [PubMed] [Google Scholar]
- 16.Kundu R, Narean JS, Wang L et al. Cross-reactive memory T cells associate with protection against SARS-CoV-2 infection in COVID-19 contacts. Nat. Commun. 13(80), (2022). [DOI] [PMC free article] [PubMed] [Google Scholar]
- 17.Heitmann JS, Bilich T, Tandler C et al. A COVID-19 peptide vaccine for the induction of SARS-CoV-2 T cell immunity. Nature 601(7894), 617–622 (2022). [DOI] [PMC free article] [PubMed] [Google Scholar]
- 18.Fathi M, Joseph R, Adolacion JRT et al. Single-cell cloning of breast cancer cells secreting specific subsets of extracellular vesicles. Cancers 13(17), 4397 (2021). [DOI] [PMC free article] [PubMed] [Google Scholar]
- 19.Bandey IN, Adolacion JRT, Romain G et al. Designed improvement to T-cell immunotherapy by multidimensional single cell profiling. J. Immunother. Cancer 9(3),e001877 (2021). [DOI] [PMC free article] [PubMed] [Google Scholar]
Associated Data
This section collects any data citations, data availability statements, or supplementary materials included in this article.