Abstract
We report both the design of a high-throughput MICRO-FASP (a miniaturized filter aided sample preparation) system and its use for the comprehensive proteomics analysis of single blastomeres isolated from 50-cell stage Xenopus laevis embryos (~200 ng yolk free protein/blastomere). A single run of the MICRO-FASP system was used to process 146 of these blastomeres in parallel. Three samples failed to generate signals presumably due to membrane clogging. Two cells were lost due to operator error. Of the surviving samples, 32 were analyzed using a Q Exactive HF mass spectrometer in survey experiments (data not included). The 109 remaining blastomers were analyzed using a capillary LC-ESI-MS/MS system coupled to an Orbitrap Fusion Lumos mass spectrometer, which identified a total of 4,189 protein groups and 40,998 unique peptides. On average, 3,468 ± 229 protein groups and 14,525 ± 2,437 unique peptides were identified from each blastomere, which is the highest throughput and deepest proteome coverage to date of single blastomeres at this stage of development. We also compared two dissociation buffers, Newport and calcium-magnesium-free (CMFM) buffers; the two buffers generated similar numbers of protein identifications (3,615 total protein IDs from use of the Newport dissociation buffer and 3,671 total protein IDs from use of the CMFM buffer).
Vertebrate eggs undergo a series of synchronized cell divisions after fertilization. The differentiation and spatial organization of embryonic cells are vital topics in understanding development.1 Single cell transcriptomics is the workhorse tool used to study individual blastomeres during early development, and is also the workhorse tool used in the human developmental cell atlas.1–5 This tool takes advantage of the powerful genomic analysis tools developed over the past three decades, including reverse transcription, the polymerase chain reaction, and high-throughput DNA sequence analysis.
Proteins are the main functional machinery of cells, and the study of the proteomes of single blastomeres has the potential to provide detailed insights into early development.6 However, while single cell transcriptomics is a well-established technology, single cell proteomics is in its infancy. Lombard-Banek et al. developed a high sensitivity proteomics platform that consisted of capillary electrophoresis (CE), electrospray ionization, and a tribrid ultrahigh-resolution mass spectrometer,7 which enabled the identification of 500–800 nonredundant protein groups from single blastomeres isolated from 16-cell Xenopus laevis (African clawed frog) embryos. That study employed in-solution digestion for sample preparation, which can be limited by sample loss and low throughput. More recently, the same group developed an approach that integrates optically guided in-situ subcellular capillary microsampling, one-pot extraction and digestion of the collected proteins, and capillary electrophoresis/mass spectrometry analysis, which eliminates the need for cell dissection.8 That study also used in-solution digestion for sample preparation but skipped reduction, alkylation, and protein purification steps.
In another study, Sun et al. reported bottom-up proteomics analysis of single blastomeres isolated by microdissection from 2-, 4-, 8-, 16-, 32-, and 50-cell Xenopus laevis embryos.9 A filter aided sample preparation (FASP) method was used for sample preparation.10, 11 Over 1,400 protein groups were identified in single-run reversed-phase liquid chromatography-electrospray ionization-tandem mass spectrometry from single blastomeres isolated from a 16-cell embryo. However, the number of protein group identifications decreased from 1,466 to 644 when the mass of yolk-free proteins in single blastomeres decreased from ~0.8 μg (16-cell embryo) to ~0.2 μg (50-cell embryo). The results suggested that the FASP method suffers from significant sample loss when processing mass-limited sample.12
Saha-Shah et al. developed a technique that combined a micropipette-based sample collection strategy with offline sample preparation and nanoLC-MS/MS to analyze proteins from single cells spanning the 1–128-cell stages of Xenopus laevis development.12 A traditional in-solution digestion method was used for sample preparation, but the total volume was decreased and efforts were taken to minimize nonspecific binding of proteins to the tube. Moreover, data-independent acquisition (DIA) enabled analysis of >1600 proteins from ~130 μm Xenopus laevis embryonic cells containing <6 nL of cytoplasm.
There have been two main limitations with methods for proteomics analysis of single cells from Xenopus laevis embryo. First, conventional sample preparation methods suffer from serious sample loss that results in a relatively small number of protein identifications from single cells. Second, most approaches have used manual sample preparation, which is tedious and limits sample throughput.
Recently, this group developed a miniaturized filter aided sample preparation (MICROFASP) method for high throughput, high sensitivity proteomics analysis of mass-limited starting material.13 We now report an expanded system for the parallel preparation of many dozens of cells, and we demonstrate the use of this technology for the parallel processing of over 100 blastomeres dissociated from Xenopus laevis embryos at the 50-cell stage.
Experimental Section
Reagents and Chemicals.
Bovine pancreas TPCK-treated trypsin, urea, ammonium bicarbonate (NH4HCO3), dithiothreitol (DTT), iodoacetamide (IAA), cOmplete™ Protease Inhibitor Cocktail and PhosSTOP™ tablets (provided in EASYpacks) and Durapore hydrophilic polyvinylidene fluoride (PVDF) membrane with 0.1 μm pore size (HILICPVDF 0.1 μm) were purchased from MilliporeSigma (Burlington, MA). Formic acid (FA) and acetonitrile (ACN) were purchased from Fisher Scientific (Pittsburgh, PA). Methanol was purchased from Honeywell Burdick & Jackson (Wicklow, Ireland). Mammalian Cell-PE LBTM buffer for cell lysis was purchased from G-Biosciences (St. Louis, MO). Water was deionized by a Nano Pure system from Thermo Scientific (Marietta, OH).
Xenopus laevis embryo culture and single blastomere collection.
All animal procedures were performed according to the protocols approved by the University of Notre Dame Institutional Animal Care and Use Facility. Female Xenopus laevis were induced by injection with 700 units of human chorionic 12 hours prior to spawning. Testes were removed from anesthetized males at the time of spawning. Eggs and minced testes were combined in 1/3 X MMR (Mark’s Modified Ringers) for a 20-minute fertilization and dejellied in 2% cysteine for 4 minutes. Embryos were kept in 1/3 X MMR at 23 °C throughout development. Collection of individual blastomeres occurred at stage 6.5 (50-cell stage). Embryos were transferred to a Petri dish (5 cm diameter) containing 10 mL 1X MMR. To remove the vitelline membrane surrounding the egg, the solution was brought to a concentration of 0.5 mg/mL in pronase (Calbiochem) by addition of 0.5 mL of a 10 mg/mL pronase stock in 1X MMR. Digestion of the vitelline membrane proceeded at 23°C for approximately 12 min. The reaction was completed when the eggs appeared flattened rather than spherical. Embryos were washed 2–3 times gently in 1X MMR immediately following pronase treatment to remove vitelline membrane fragments from the surface of the embryo. Devitellinized embryos were then transferred into a new Petri dish, which was filled with 5 mL of dissociation buffer.
Two dissociation buffers were used in this work: calcium magnesium free media (CMFM, 88 mM NaCl, 1 mM KCl, 2.4 mM NaHCO3, 7.5 mM Tris/HCl, pH 7.6)14 and a Newport buffer (0.1 M sodium isethionate, 20 mM sodium pyrophosphate, 20 mM glucose, pH 9.0).15 To accelerate dissociation, embryos were agitated for 3–5 min or until dissociation was complete (typically <10 min). Embryos were dissociated into monodisperse cells following these procedures. Once dissociation was complete, individual cells were transferred to a PCR tube using a 10 μL pipette tip under a microscope. Cells were flash frozen in liquid nitrogen and stored at −80 °C until cell lysis and protein extraction.
High throughput single blastomere sample preparation with a 2× 96-well plate based MICROFASP method.
The MICROFASP reactors were fabricated as described earlier.13 For each reactor, a ~0.5-mm section was cut from the bottom of a 20-μL pipette tip and then inserted into the top of the tip to serve as a support. A disc was cut from a Durapore hydrophilic polyvinylidene fluoride (PVDF) membrane with 0.1 μm pore size (HILICPVDF 0.1 μm) by a blunt 18-gauge needle and inserted on the support. Another section was cut from the bottom of the tip, and inserted on top of the ultrafiltration membrane, ensuring tight contact.
We developed a microplate-based MICROFASP system, Figure 1. Two 2-mL 96 deep well polypropylene plates were used as supports, allowing the processing of up to 192 samples in parallel. 2 μL of lysis buffer (Mammalian Cell-PE LBTM buffer) with cOmplete™ Protease Inhibitor Cocktail and PhosSTOP™ tablets was added to each Xenopus single blastomere in a small PCR tube, followed by cell lysis via sonication with a Branson Sonifier 250 (VWR Scientific, Batavia, IL) for 5 min on ice. Cell lysates were reduced with 1 μL of 50 mM of DTT at 37 °C for 1 hour, followed by alkylation with 2 μL of 50 mM of IAA at room temperature in darkness for 30 minutes. each cell lysate was transferred into the MICROFASP reactors using 10 μL pipettes. Samples were transferred onto the filter by centrifugation at 500× g. Then 5 μL of 20 mM NH4HCO3 was loaded onto the microreactor to wash contaminants from the sample. 5 μL of a trypsin solution (trypsin to protein ratio at 1:100) was loaded onto the microreactor at 100x for 30 seconds. The top of the microreactor was sealed with a bottom piece of a PCR tube or Parafilm, put in a 1.5 mL centrifuge tube, and incubated in a 37 °C water bath overnight. Digests were eluted into autosampler vials of the LC-MS/MS system for single-shot proteomic analysis.
Figure 1.
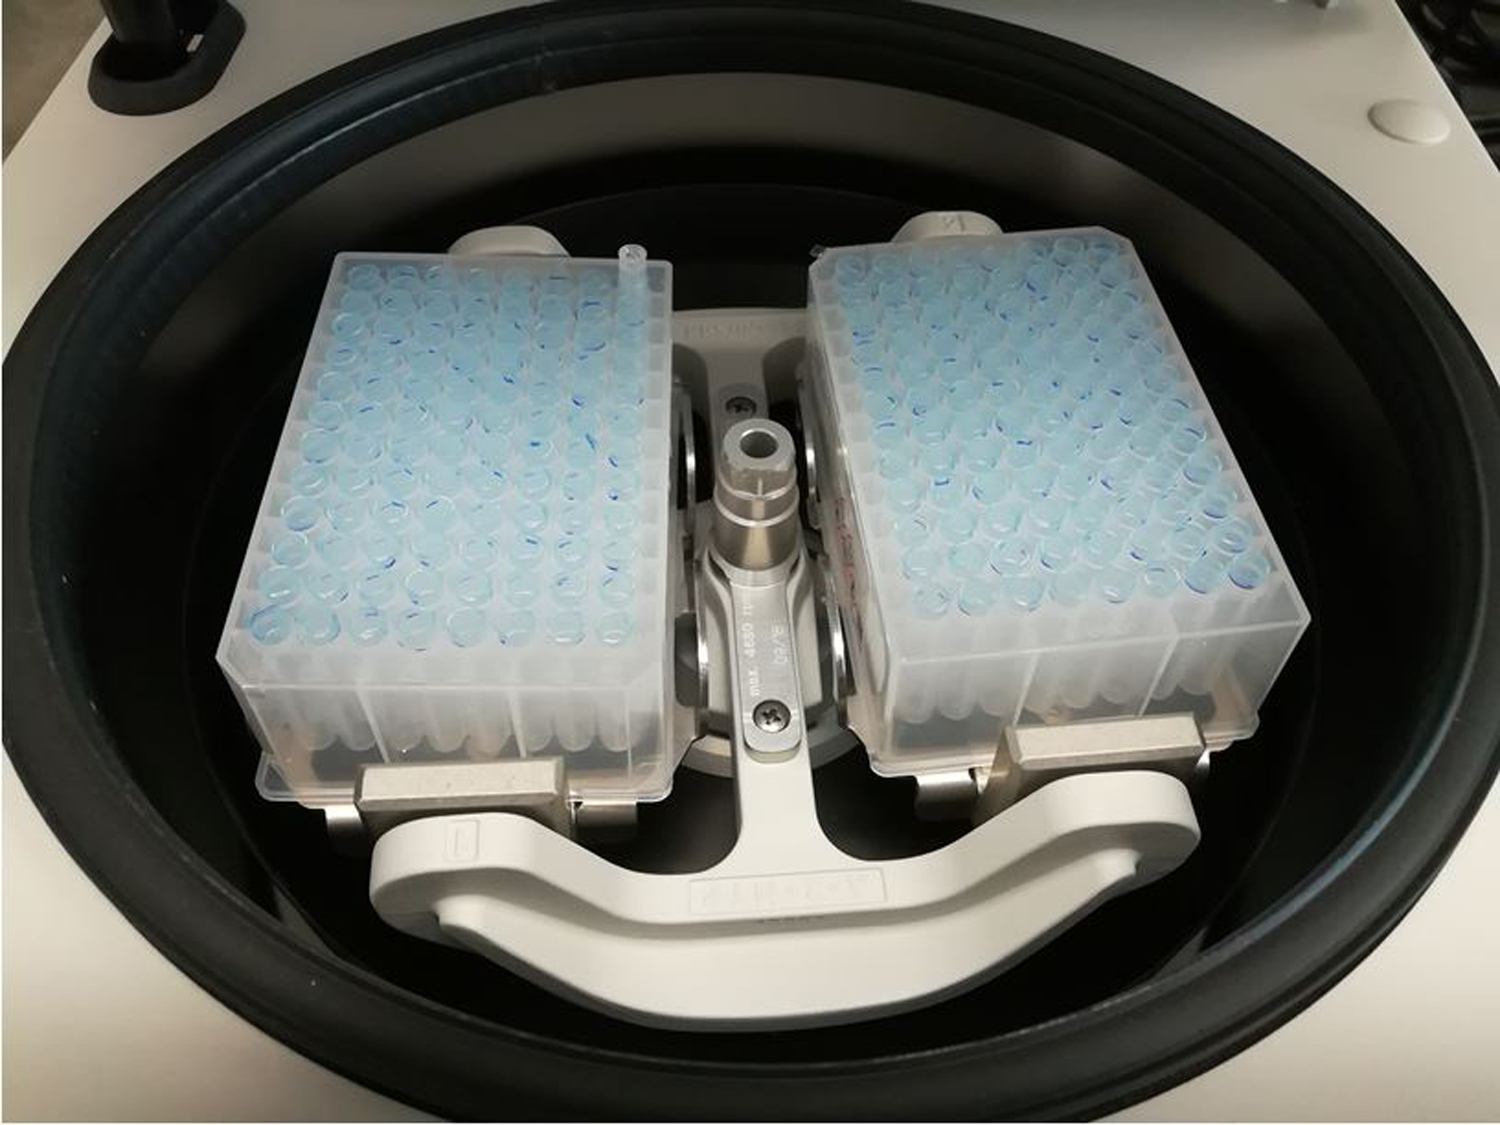
2×96-well plate based MICROFASP system.
Microscale Liquid Chromatography Column Fabrication.
A laser puller (Sutter Instruments Co., Novato, CA) was used to generate electrospray emitter tips (~10 × 25 μm inner-outer diameter) on 75 ID × 360 μm OD bare-fused silica capillary columns (Polymicro Phoenix, AZ). The tips were briefly etched with 100% hydrofluoric acid and plugged with 5 μm, 130 Å pore size Bridged Ethylene Hybrid (BEH) C18 particles (Waters, Milford, MA) using an in-house made pressure injection cell with maximum gas pressure rating of ~1500 psi. Then, the column was packed with 1.7 μm diameter, 130 Å pore size BEH C18 particles (Waters, Milford, MA) using the ultra-high pressure (uHP) column packing station, reaching a maximum pressure of ~20,000 to ~30,000 psi.16
UHPLC-ESI-MS/MS analysis.
The packed column was installed on a Dionex Ultimate 3000 nano UHPLC system (Thermo Fisher, Sunnyvale, CA) using a stainless steel uHP union (IDEX, Oak Harbor, WA) and coupled to an Orbitrap Fusion Lumos mass spectrometer (Thermo Scientific, San Jose, CA) for peptide separation and identification. The column was heated to 55 °C with an in-house made heater. Mobile phase A (0.2%FA in water) and mobile phase B (0.2% FA in 70%ACN) were used for gradient separation. Peptides were automatically loaded onto the C18 column and flushed with mobile phase A for 12 min at a flow rate of 0.315 μL/min, then followed by a 100-min gradient: 0–10 min, 0–10% B; 10–84 min, 10–57% B; 84–85 min, 57–100% B; 85–89 min, 100% B; 89–90 min, 100–0%B; 90–100 min, 0%B. The eluted peptides from the C18 column were pumped through a capillary tip for electrospray.
Mass Spectrometer Operating Parameters.
Eluted peptides were analyzed on a quadrupole-linear ion trap-Orbitrap hybrid Fusion Lumos® mass spectrometer (Thermo Scientific, San Jose, CA). Orbitrap survey scans were performed at a resolving power of 240,000 at 200 m/z with an AGC target of 1×10⁶ ions and maximum injection time set to 50 ms. The instrument was operated in the Top Speed mode with 2 s cycles using an advanced precursor determination algorithm for monoisotopic precursor selection.17 Precursors were isolated using a quadrupole isolation window of 0.7 Th. Tandem MS scans were performed in the ion trap on precursors with 2–5 charge states using HCD fragmentation with normalized collision energy of 25 and dynamic exclusion of 20 s with mass tolerance of 15 ppm around the precursor and its isotopic peaks. The ion trap MS/MS ion count target was set to 1×10⁴ and the maximum injection time of 11 ms for turbo scans. Peptide fragments were mass analyzed over the fixed m/z range from 200 to 1,200.
Database searching and data analysis.
Database searching of the raw files was performed in MaxQuant (version 1.61.0.).18 MS/MS spectra were searched by the Andromeda search engine against the Uniprot human protein database and Xenopus laevis proteins database using the default parameters. The Xenopus laevis database was downloaded from UniProt in March 2019 (Proteome ID: UP000186698) for single blastomere proteomics analysis. Carbamidomethylation of cysteines (+57.0215 Da) was set as a fixed modification, and variable modifications of methionine oxidation (+15.9949 Da) and acetyl (N-terminus) (+42.011 Da) deamination were allowed. Matching between runs was enabled with match and alignment time windows of 0.7 and 20 minutes, respectively. The false discovery rate (FDR) was determined by using a target-decoy search strategy. On the peptide level, the corresponding FDR on peptide level was less than 1%. On the protein level, protein grouping was enabled.
Data were imported into Matlab to generate a dynamic range plot. In addition, Matlab’s IEF function was used to calculate the apparent pI and charge at the pH of the two dissociation buffers. A script was written to calculate the GRAVY score for proteins as the sum of the hydropathy values of all amino acids divided by the number of amino acids in the protein; Kyte and Doolittle’s values for hydropathy were used in this calculation.19
RESULTS AND DISCUSSION
We manually dissociated single blastomeres from Xenopus laevis embryos at the 50-cell stage; cell divisions become asynchronous at the 32-cell stage, and the 50-cell stage is used to describe the next stage of development. We staggered fertilizations and held embryos at a relatively cool temperature (~18 °C) to aid in the isolation of the large numbers of blastomeres used in this study. A total of 146 blastomeres were isolated from ten embryos. The dissociated cells were then processed in parallel using the MICRO-FASP system. Three samples failed during loading due to clogging of the membrane by the cell debris. Two samples were lost due to operator error. Of the remaining 141 samples, 109 samples were analyzed using an Orbitrap Fusion Lumos Tribrid. The remainder were used for preliminary experiments using an Q Exactive HF (data not presented). 58 blastomers were generated using the Newport extraction solvent, pH = 9.0, and 51 blastomers were generated using the CMFM extraction solvent, pH = 7.6). 4,233 proteins were detected in at least one blastomer; 1,311 genes were detected in every blastomere.
In addition, two pooled samples were analyzed as controls. Results are presented in supporting information.
Proteins identified in all the samples.
The apparent dynamic range of protein expression across the set of blastomeres was over seven orders of magnitude, Figure 2. Median protein expression was 3.5 × 10⁷ copies per cell, which suggests that the identification number could further improved by combining the MICROFASP method with fractionation techniques.
Figure 2.
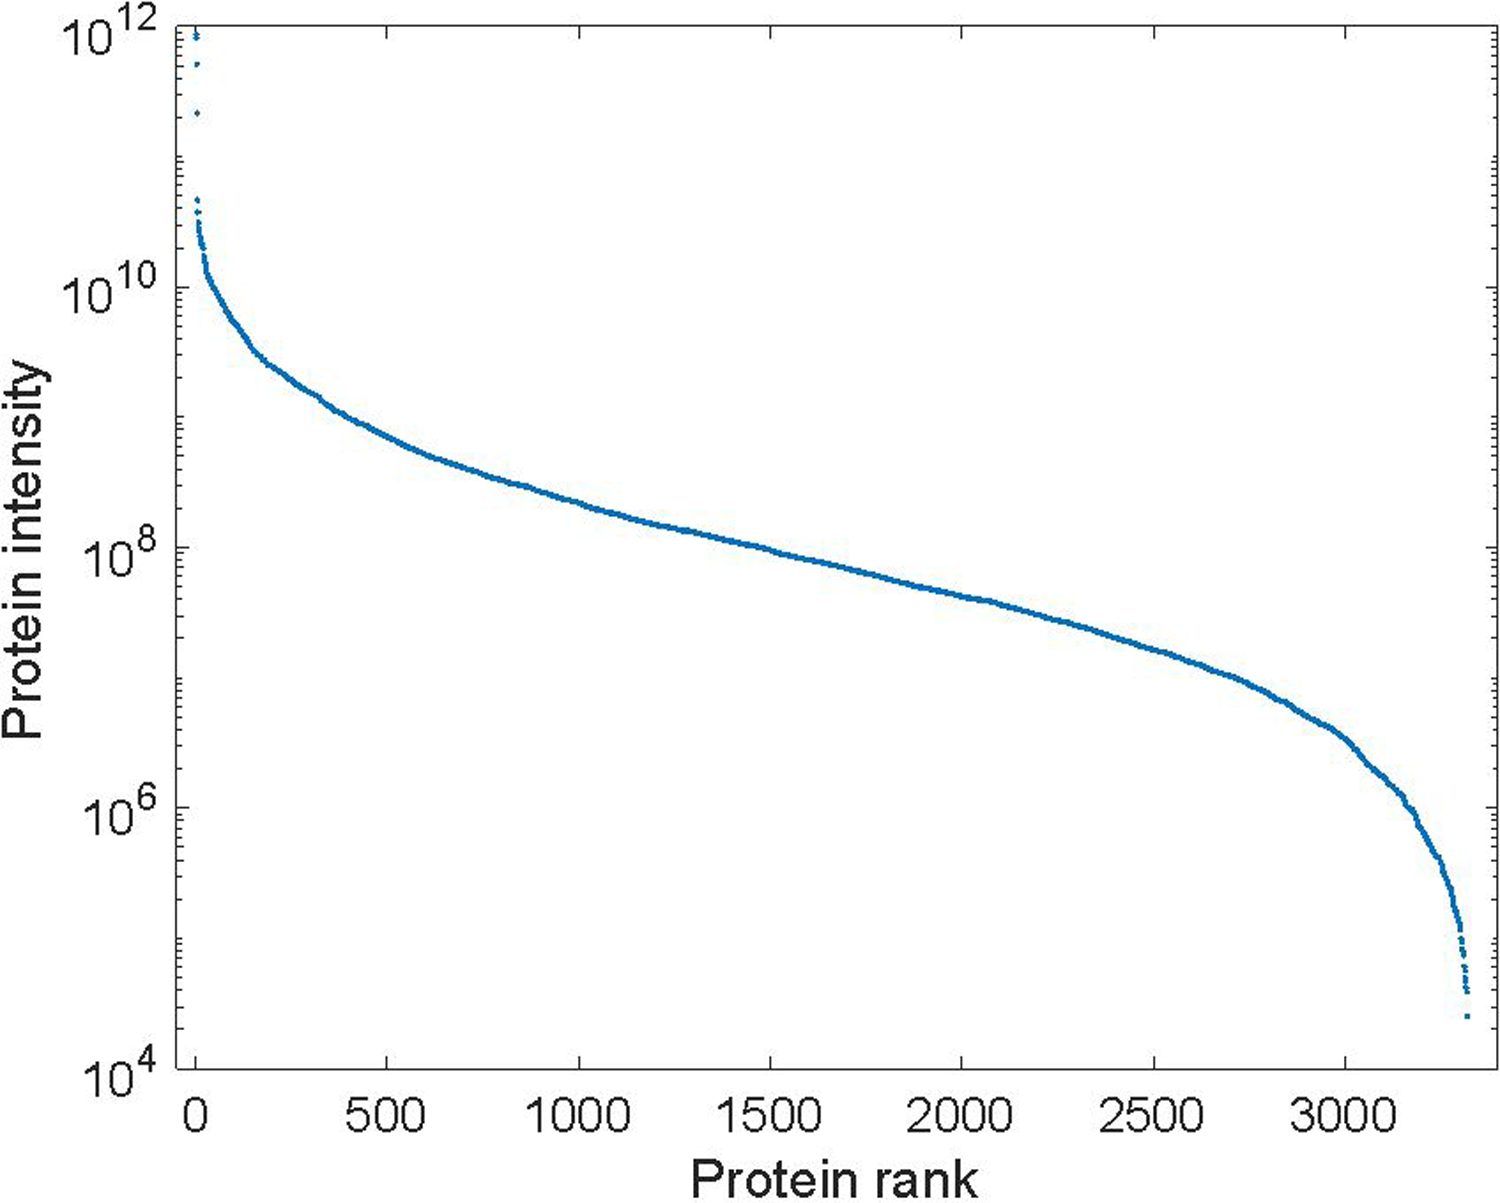
The apparent dynamic range of protein expression in a set of 110 blastomeres. Matlab’s trimmean command discarded the highest and lowest 5% intensities for each protein and calculated the mean of the remaining values; the results were sorted and plotted with a logarithmic y axis.
The most abundant protein identified from this blastomere was phosvitin. Other proteins that generated high signals included 2-phospho-D-glycerate hydrolyase, malate dehydrogenase, DNA-(apurinic or apyrimidinic site) lyase, glutathione transferase, ATP synthase subunits, triosephosphate isomerase, pyruvate kinase, elongation factor 1-alpha, L-lactate dehydrogenase, glyceraldehyde-3-phosphate dehydrogenase, 60S ribosomal proteins, tubulin beta chain, 40S ribosomal proteins, 60S acidic ribosomal protein P0, glucose-6-phosphate isomerase, and GTP-binding nuclear protein Ran.
Protein expression differences between blastomeres dissociated in different dissociation buffers.
We compared dissociation buffers: calcium magnesium free media (CMFM)14 and Newport buffer;15 53 blastomers were processed with CMFM and 59 blastomers were processed with Newport buffer. A total of 3,615 proteins were identified in embryos treated with the Newport dissociation buffer and a total of 3,671 proteins were identified in embryos treated with the CMFM buffer.
We observe significant segregation in blastomeres by principal component analysis (PCA) of protein abundance as shown in Figure 3. In this PCA analysis, genes that had zero intensity for any cell were discarded, and the PCA was performed on the log10 transformed data.
Figure 3.
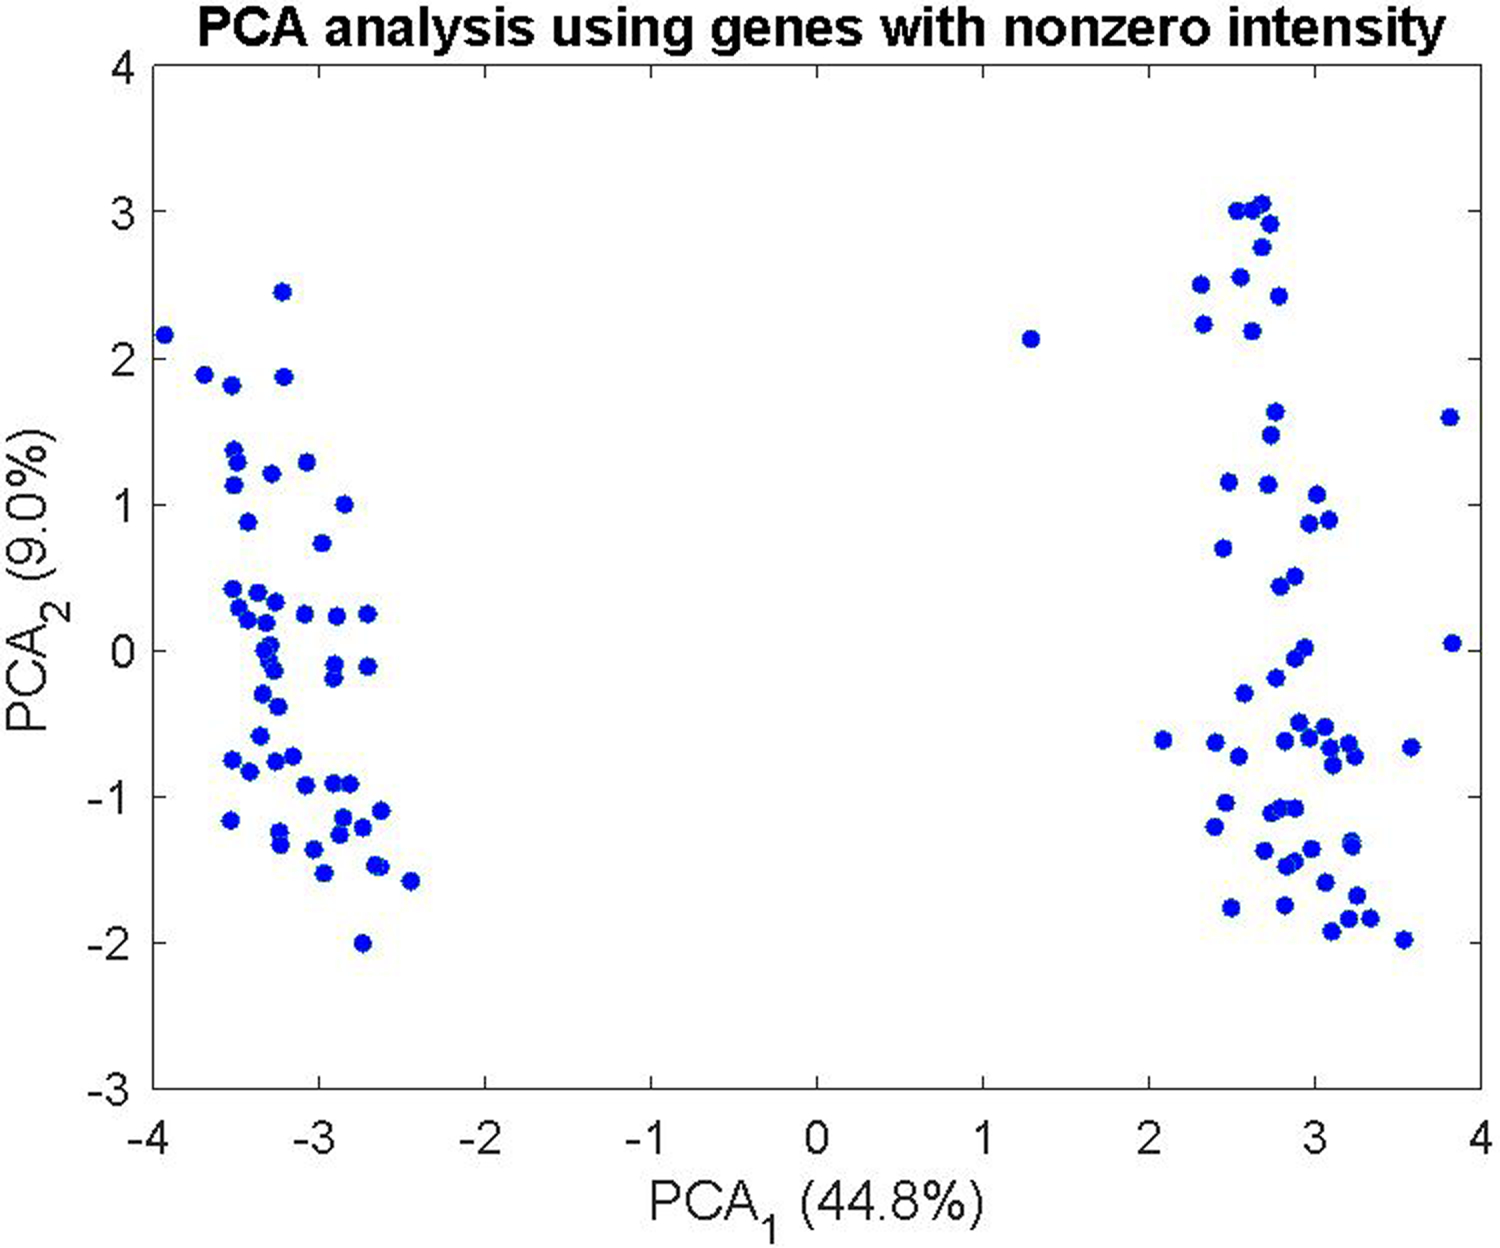
Principal component analysis (PCA) of the single blastomere samples collected in the different dissociation buffers, generated using Matlab’s PCA function. Values in parentheses are the percentage of variance explained by each principal component.
We used Matlab’s clustergram function to identify some components responsible for differentiating the products of the two extraction solvents. We first discarded the genes in the lowest 40% intensity of Figure 2, and then normalized the resulting data first by cell and then by protein. Proteins whose variance was in the lowest 75% were discarded; 637 proteins survived this procedure. In a crude imputation, 0.0025 was added to all values to ensure no zeros were present in the data. The clustergram function was applied to the log10 normalized intensity values using the Ward linkage option, Figure 4.
Figure 4.
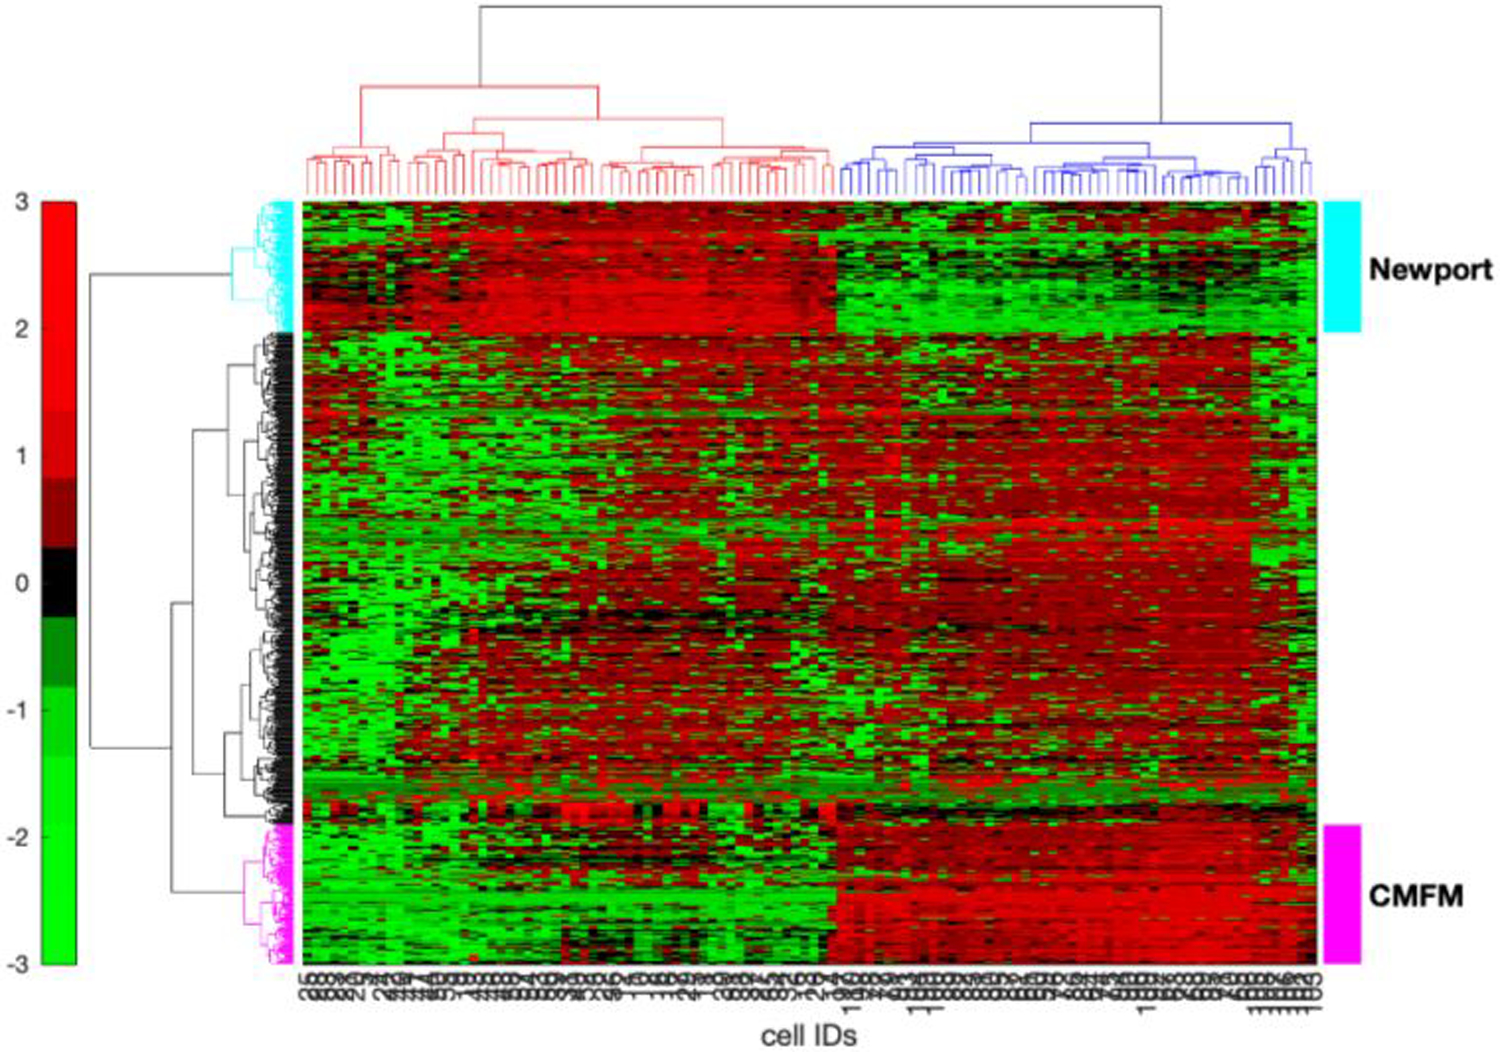
Clustergram of proteins with the highest 25% variance after normalization. Data are organized with proteins as rows and cells as columns. The algorithm clearly resolved those cells which were extracted using the Newport buffer (red column dendrogram, cells 1–58) and the CMFM buffer (blue column dendrogram, cells 59–110). One set of proteins that showed higher expression in the Newport buffer is annotated as Newport (cyan row dendrogram, 110 proteins) whereas the other set of proteins that showed higher expression in the CMFM buffer (magenta row dendrogram, 116 proteins).
The proteins fell into three groups. One group, with the cyan row dendrogram and marker, showed high expression for the cells treated with the Newport buffer. A second group, with the magenta row dendrogram and marker, showed high expression with the CMFM buffer. The other proteins had little obvious differences in expression in the two buffers.
We analyzed the difference in pI, charge, protein nominal molecular weight, and GRAVY value, Figure 5, for the Newport and CMFM dominant proteins. There are no dramatic differences in these properties for the two sets of proteins. As remarkable examples, two proteins, Glyco_hydro_65m domain-containing protein (pgghg.L, A0A310TM71, pI ~4.9, GRAVY ~ −0.14) and ferritin (XELAEV_18036116mg, A0A1L8FNH6, pI ~4.6, GRAVY ~−0.61), were detected in every cell that was treated with the Newport dissociation buffer and were undetected in every cell treated with CMFM buffer. In contrast, one protein, Ubiquitin carboxyl-terminal hydrolase (XELAEV_18009011mg, A0A1L8HL50, pI ~5.4, GRAVY −0.26), was undetected in every cell treated with the Newport buffer but was detected in every cell treated with the CMFM buffer. It is possible that these sets of proteins are solubilized as a complex that is differentially extracted by the dissociation buffer.20 However, confirmation of this hypothesis is beyond the scope of this paper.
Figure 5.
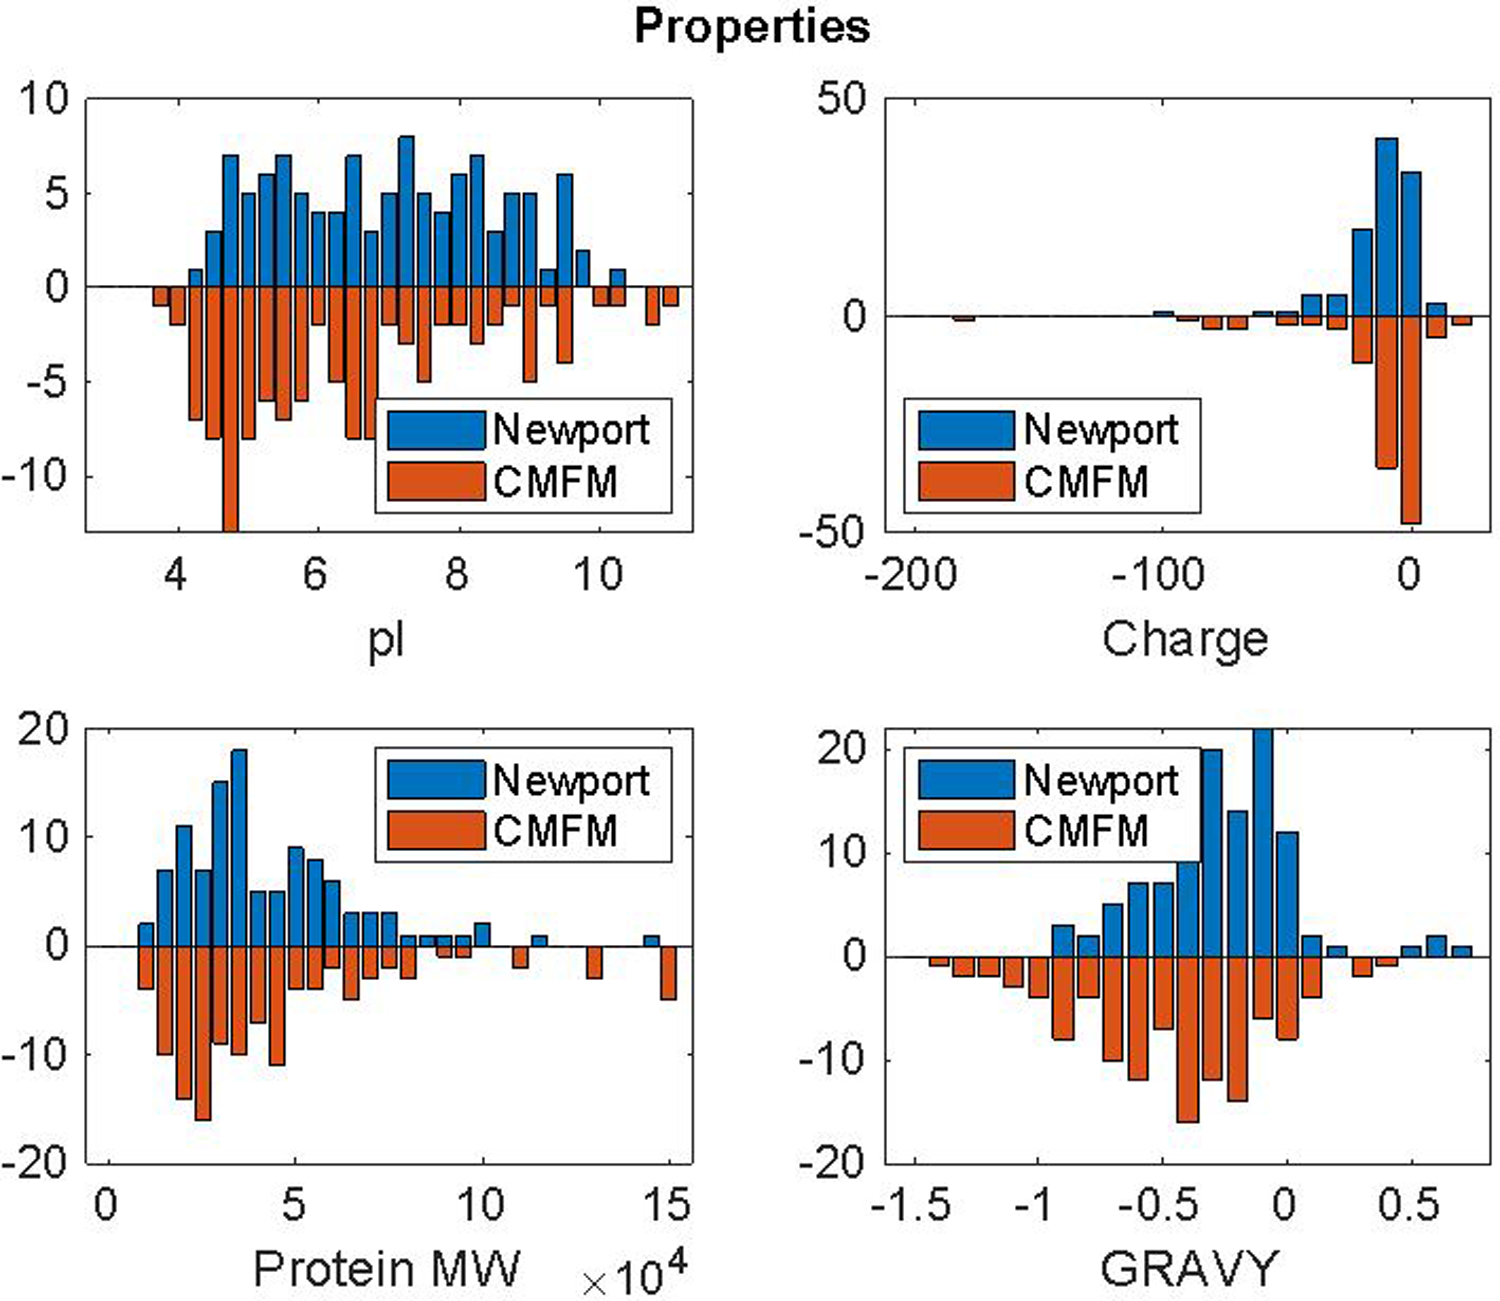
Properties of proteins in the Newport and CMFM clusters in Figure 4. Charge was calculated at the pH of the two buffers (Newport = pH 9.0; CMFM = pH 7.6).
Proteins extracted using CMFM.
A clustergram of the highest variance proteins across the 51 single blastomere samples prepared using CMFM buffer is shown in Figure 6. These cells were isolated from four embryos harvested at the 50-cell stage.
Figure 6.
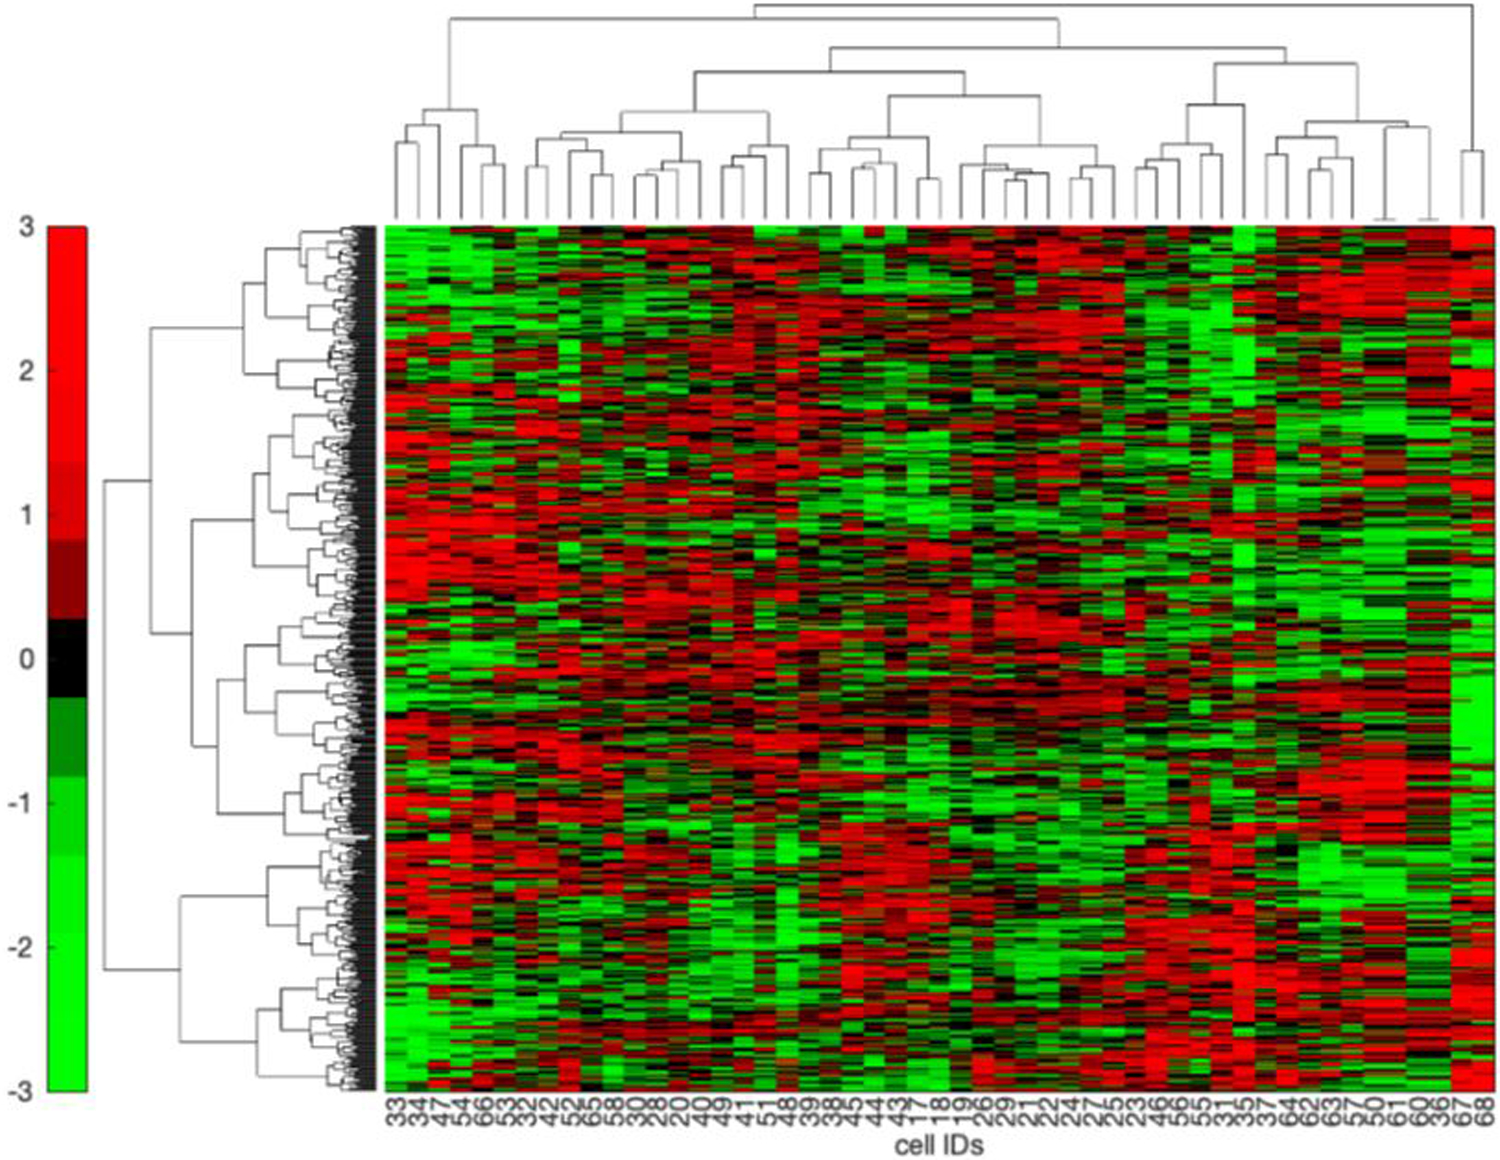
Clustergram of proteins isolated from 51 blastomeres using the CMFM buffer. Those proteins with the highest 15% variance after normalization were used to construct the clustergram using the Ward linkage option. Data are organized with proteins as rows and cells as columns. Cells 17–32, 33–39, 40–54, and 55–68 (data from cell 59 is missing) came from single embryos.
Protein expression differences between blastomeres from the same embryo.
The spatial position of each blastomere in the embryo was noted during dissociation using the CMFM buffer, which made it possible to compare the spatial protein expression differences (Supporting Information Figures S1–S4). As expected, the shorter the distance between the blastomeres, the more similar were their protein expression profiles. Therefore, we could estimate the relative spatial position of the blastomeres based on their proteomics profiles. However, we also noticed some exceptions, which are likely due to the three-dimensional topology of the cell and to the complexity of development. We also present clustergrams for the cells dissociated using the Newport buffer (Supporting Information Figures S5–S7), but without the cell map. Blastomeres from other embryos were used in preliminary experiments (Data not shown).
CONCLUSIONS
We developed a 2×96-well plate based MICROFASP method for high throughput single cell proteomics. We simultaneously processed 113 single blastomeres from 50-cell stage Xenopus laevis embryos. On average, 3,468 protein groups and 14,525 peptides were identified in each blastomere, which is the highest throughput and deepest proteome coverage to date from single blastomeres from Xenopus embryos at this stage. We also compared dissociation of embryos using calcium magnesium free media and Newport buffer; while cluster analysis clearly resolved the cells used with these buffers, there was no clear demarcation of the charge, GRAVY, pI, or molecular weight of the proteins associated with the clustering. We hypothesize, but present no evidence, that these different buffers solubilize different protein clusters; additional work will be required to test this hypothesis.19
Supplementary Material
ACKNOWLEDGEMENT
We thank Dr. William Boggess and Dr. Matthew Champion in the Notre Dame Mass Spectrometry and Proteomics Facility for their help with this project. This work was funded by the National Institutes of Health (R35 GM136334 – NJD and P41 GM108538 – JJC)
Footnotes
Supporting Information
Clustergrams and cell identifications for blastomeres isolated from single embryos. Spreadsheet with information on peptides and protein identifications. This material is available free of charge via the Internet.
REFERENCES
- (1).Briggs JA; Weinreb C; Wagner DE; Megason S, Peshkin L; Kirschner MW; Klein AM “The dynamics of gene expression in vertebrate embryogenesis at single-cell resolution” Science 2018,360(6392), eaar5780. DOI: 10.1126/science.aar5780. [DOI] [PMC free article] [PubMed] [Google Scholar]
- (2).De Domenico E; Owens NDL; Grant IM; Gomes-Faria R; Gilchrist MJ “Molecular asymmetry in the 8-cell stage Xenopus tropicalis embryo described by single blastomere transcript sequencing” Dev. Biol 2015, 408, 252–268. DOI: 10.1016/j.ydbio.2015.06.010 [DOI] [PMC free article] [PubMed] [Google Scholar]
- (3).Flachsova M; Sindelka R; Kubista M “Single blastomere expression profiling of Xenopus laevis embryos of 8 to 32-cells reveals developmental asymmetry” Sci. Rep 2013, 3, 2278. DOI: 10.1038/srep02278. [DOI] [PMC free article] [PubMed] [Google Scholar]
- (4).Farrell JA; Wang Y; Riesenfeld SJ; Shekhar K; Regev A; Schier AF “Single-cell reconstruction of developmental trajectories during zebrafish embryogenesis” Science 2018, 360, eaar3131. DOI: 10.1126/science.aar3131 [DOI] [PMC free article] [PubMed] [Google Scholar]
- (5).Haniffa M; Taylor D; Linnarsson S; Aronow BJ, et al. “A roadmap for the human developmental cell atlas” Nature 2021, 597, 196–205. doi: 10.1038/s41586-021-03620-1. [DOI] [PMC free article] [PubMed] [Google Scholar]
- (6).Budnik B; Levy E; Harmange G; Slavov N “SCoPE-MS: mass spectrometry of single mammalian cells quantifies proteome heterogeneity during cell differentiation” Genome Biology 2018, 19, 161. DOI: 10.1186/s13059-018-1547-5 [DOI] [PMC free article] [PubMed] [Google Scholar]
- (7).Lombard-Banek C; Moody SA; Nemes P “Single-Cell Mass Spectrometry for Discovery Proteomics: Quantifying Translational Cell Heterogeneity in the 16-Cell Frog (Xenopus) Embryo.” Angew. Chem. Int. Ed 2016, 55, 2454–2458. DOI: 10.1002/anie.201510411. [DOI] [PMC free article] [PubMed] [Google Scholar]
- (8).Lombard-Banek C; Moody SA; Manzini MC; Nemes P “Microsampling Capillary Electrophoresis Mass Spectrometry Enables Single-Cell Proteomics in Complex Tissues: Developing Cell Clones in Live Xenopus laevis and Zebrafish Embryos.” Anal. Chem 2019, 91, 4797–4805. DOI: 10.1021/acs.analchem.9b00345. [DOI] [PMC free article] [PubMed] [Google Scholar]
- (9).Sun L; Dubiak KM; Peuchen EH; Zhang Z; Zhu G; Huber PW; Dovichi NJ “Single Cell Proteomics Using Frog (Xenopus laevis) Blastomeres Isolated from Early Stage Embryos, Which Form a Geometric Progression in Protein Content.” Anal. Chem 2016, 88, 6653–6657. DOI: 10.1021/acs.analchem.6b01921. [DOI] [PMC free article] [PubMed] [Google Scholar]
- (10).Manza LL.; Stamer SL; Ham A-JL; Codreanu SG; Liebler DC “Sample preparation and digestion for proteomic analyses using spin filters” Proteomics 2005, 5: 1742–1745. DOI: 10.1002/pmic.200401063. [DOI] [PubMed] [Google Scholar]
- (11).Wisniewski JR,; Zougman A; Nagaraj N; Mann M “Universal sample preparation method for proteome analysis” Nat. Methods 2009, 6: 359–362. DOI: 10.1038/nmeth.1322. [DOI] [PubMed] [Google Scholar]
- (12).Saha-Shah A; Esmaeili M; Sidoli S; Hwang H; Yang J; Klein PS; Garcia BA “Single Cell Proteomics by Data-Independent Acquisition to Study Embryonic Asymmetry in Xenopus laevis” Anal. Chem 2019, 91, 8891–8899. DOI: 10.1021/acs.analchem.9b00327. [DOI] [PMC free article] [PubMed] [Google Scholar]
- (13).Zhang Z; Dubiak KM; Huber PW; Dovichi NJ “Miniaturized Filter-Aided Sample Preparation (MICRO-FASP) Method for High Throughput, Ultrasensitive Proteomics Sample Preparation Reveals Proteome Asymmetry in Xenopus laevis Embryos.” Anal. Chem 2020, 92, 5554–5560. DOI: 10.1021/acs.analchem.0c00470. [DOI] [PMC free article] [PubMed] [Google Scholar]
- (14).Sargent TD; Jamrich M; Dawid IB “Cell interactions and the control of gene activity during early development of Xenopus laevis” Dev. Biol 1986, 114, 238–246. DOI: 10.1016/0012-1606(86)90399-4 [DOI] [PubMed] [Google Scholar]
- (15).Newport J; Kirschner M “A major developmental transition in early Xenopus-embryos .1. Characterization and timing of cellular-changes at the midblastula stage” Cell 1982, 30, 675–686. DOI: 10.1016/0092-8674(82)90272-0 [DOI] [PubMed] [Google Scholar]
- (16).Shishkova E; Hebert AS; Westphall MS; Coon JJ “Ultra-High Pressure (>30,000 psi) Packing of Capillary Columns Enhancing Depth of Shotgun Proteomic Analyses.” Anal. Chem 2018, 90 (19), 11503–11508. DOI: 10.1021/acs.analchem.8b02766. [DOI] [PMC free article] [PubMed] [Google Scholar]
- (17).Hebert AS; Thöing C; Riley NM; Kwiecien NW; Shiskova E; Huguet R; Cardasis HL; Kuehn A; Eliuk S; Zabrouskov V; Westphall MS; McAlister GC; Coon JJ “Improved Precursor Characterization for Data-Dependent Mass Spectrometry.” Anal. Chem 2018, 90, 2333–2340. DOI: 10.1021/acs.analchem.7b04808. [DOI] [PMC free article] [PubMed] [Google Scholar]
- (18).Cox J; Mann M “MaxQuant enables high peptide identification rates, individualized p.p.b.-range mass accuracies and proteome-wide protein quantification.” Nat. Biotechnol 2008, 26 (12), 1367–1372. DOI: 10.1038/nbt.1511. [DOI] [PubMed] [Google Scholar]
- (19).Kyte J; Doolittle RF “A simple method for displaying the hydropathic character of a protein.” J. Mol. Biol 1982, 157 (1), 105–132. DOI: 10.1016/0022-2836(82)90515-0. [DOI] [PubMed] [Google Scholar]
- (20).Fossati A; Li C; Uliana F; Wendt F; Frommelt F; Sykacek P; Heusel M; Hallal M; Bludau I; Capraz T; Xue P; Song J; Wollscheid B; Purcell AW; Gstaiger M; Aebersold R “PCprophet: a framework for protein complex prediction and differential analysis using proteomic data” Nat. Methods 2021, 18, 520–527. doi: 10.1038/s41592-021-01107-5. [DOI] [PubMed] [Google Scholar]
Associated Data
This section collects any data citations, data availability statements, or supplementary materials included in this article.


