

Abstract
Purpose
Competing radiosurgery plans are compared based on their conformity and gradient of dose distribution to the target volume (TV). Most widely used quality metrics such as new conformity index (NCI) and gradient index (GI) are known to have strong volume dependency on the TV of interest. A simple quality measure without the volume dependency is presented for evaluating stereotactic radiosurgery plans, expressed in distance dimension compared to the unit-less volume ratio used in NCI and GI.
Methods and Materials
The conformity distance measure (CDM) is defined as the effective radius of the union volume subtracted by that of the intersection volume, where volume operations are on TV and prescription isodose volume (PIV). Gradient distance measure (GDM) is defined as the effective radius of 50% PIV (low dose volume of the plan) subtracted by that of corresponding ideal low dose volume (iLDV). Volume independency and consistent sensitivity of CDM and GDM on PIV displacement and dose spillage are analyzed using a simple two-sphere model. 2429 cases of Gamma Knife and 76 cases of Linac based radiosurgery plans for brain metastasis were retrospectively studied to demonstrate volume independency of the new measures and their implication on target coverage.
Results
The sensitivity of NCI on PIV displacement and dose spillage was inversely proportional to the effective radius of the target volume, while the sensitivity of CDM on target motion and dose spillage was constant regardless the target volume. The iLDV for 50% PIV was approximately 2.4 times of PIV based on previous Linac based radiosurgery/IMRT/VMAT plans and single shot analysis from Gamma Knife (GK), ICON. Although NCI ranged from 1 to 14.7 for GK plans and from 1.2 to 20.8 for VMAT plans showing strong volume dependency, CDM showed negligible volume dependency of less than 2.1 mm for more than 90% cases and peak frequency was at 0.8 mm. CDM was correlated well with target coverage as a function of PIV displacement regardless of target volume. Target coverage, V100, was larger than 95% when PIV displacement is less than CDM.
Conclusions
The new conformity and gradient measure, CDM and GDM are proposed in this paper. The new measures are volume independent which is preferred for reliable evaluation of the radiosurgery plan quality over wide range of radiosurgery targets. As represented by distance dimension similar to PTV margin, the new measures may be more adequate for image guided radiosurgery applications.
Keywords: Conformity, dose gradient, dosimetric margin, stereotactic radiosurgery
INTRODUCTION
High precision conformal radiotherapy is achievable with modern treatment planning systems using advanced delivery techniques such as intensity modulated radiation therapy (IMRT) [1-2] and volumetric modulated arc radiation therapy (VMAT) [3]. The advent of on-line image guided radiotherapy (IGRT) ensures the correction of patient setup error and the management of intra-fraction patient motion during treatment which allows significant reduction in the margin for planning target volume (PTV) and leads to even more conformal radiotherapy plans with great confidence at the time of treatment delivery [4]. Stereotactic radiosurgery (SRS) employs large fractional dose with highly conformal dose distribution, aiming to minimize complication or toxicity in the irradiated normal tissue from the treatment. Along with the capability of such high precision dose delivery, careful evaluation of the plan quality in SRS plans are becoming increasingly important.
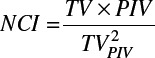
Conformity index (CI), heterogeneity index, target coverage ratio and gradient index (GI) are most widely utilized plan quality indices [7]. The concept of CI, defined as the ratio of prescription isodose volume (PIV) to target volume (TV), has been widely accepted with an assumption of adequate target coverage and the revised version, namely new conformity index (NCI, TV × PIV/TVPIV2) overcame the limitation of potential inadequate coverage in the conventional CI definition [5-7]. The low dose conformity was initially characterized by CGI [8-9] and it was updated to a more generalized and simplified parameter, GI, the ratio of low isodose volume (50%PIV) to PIV. This modification removes the limitation of prescription isodose to 50% of the maximum dose. There are multiple papers using these parameters to correlate clinical outcomes [10-13].
Although NCI and GI are easy to compute and their concepts are intuitive, they are not always ideal assessment tools due to their strong volume dependency. RTOG 0618, for example, provides a table of index as a function of target volume to correctly evaluate the plan quality of lung SBRT patients. In case of Gamma Knife (GK) treatments, volume dependency becomes more problematic since the target size of brain metastasis ranges more than 10,000 folds (0.001 cc to 10 cc) compared to lung cases (up to about 100 folds). Considering that patient motion, setup error, treatment machine related uncertainty and corresponding PTV margin are all addressed in a distance dimension (with/without rotation) regardless the volume of target, it is also beneficial to use a distance measure for plan conformity evaluation rather than volume ratio. In this paper we analyze the volume dependency of the current conformity index (NCI, GI) using two-sphere model and propose a simple and effective new quality measure without volume dependency, namely conformity distance measure (CDM) and gradient distance measure (GDM). CDM reports the distance between TV and PIV. GDM reports the distance between 50% isodose volume of the clinical plan and that of an ideal reference plan. The ideal plan is defined as the plan with the maximum dose gradient.
MATERIAL AND METHOD
Conformity distance measure (CDM)
Treatment plans are to be as conformal as possible such that the target volume (TV) is fully covered by the prescription isodose volume (PIV) and at the same time PIV is not unnecessarily larger than TV. In this study, a new conformity distance measure (CDM) is proposed which represents the average distance between the surface of TV and the surface of PIV (or as a dosimetric margin). For this end, the target volume receiving the prescription dose (TVPIV or TV ∩ PIV) and the union volume of TV and PIV (TV ∪ PIV) are considered. CDM simply computes the difference in the effective radius, Rv, of the two volumes (TV ∩ PIV and TV ∪ PIV), where Rv is the radius of the equivalent sphere with volume, V.
Note that CDM ≥ 0, NCI ≥ 1 and CI ≥ 1 where each index becomes the minimum when PIV conforms to TV.
Figure 1.
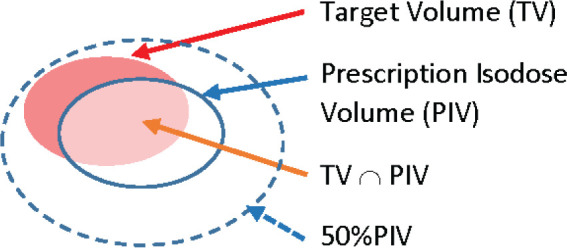
The relationship of target volume and prescription isodose volume.
Gradient distance measure (GDM)
GI is a plan quality measure describing the degree of low dose spillage around the target. It is defined by the ratio of the low dose volume (50% of prescription dose or 50%PIV) to PIV. Gradient distance measure (GDM) may be defined by R50%PIV – RPIV using the similar approach used in the derivation of CDM in the previous section. It is not fully independent on the volume effect, however, since dose gradient is affected by the field size employed for treatment. Thus it is desirable to compare R50%PIV of the clinical plan relative to that of a reference plan with the greatest dose fall-off. Finding ‘ideal reference plan’ with the greatest dose fall-off is a difficult theoretical problem considering complexity and variability of clinical plans. The greatest dose fall-off can be estimated from the literature search as an alternative approach. The minimum value of GI is reportedly to be 2.34-2.63 and 2.7 with single shot and multiple shots plans respectively for vestibular schwannoma treatment in Gamma Knife 4C [6]. McDonald et. al. [10] reported GI of 2.86 and 5.67 in comparison of GK and VMAT plans. Han et. al. [11] reported the minimum GI of 3.2, 2.9, and 2.4 for fractionated radiosurgery plans with Linear accelerator, Gamma Knife and CyberKnife respectively. Most recent version of Gamma Knife Perfexion/ICON is reviewed in this paper in order to determine 50% of prescription dose in the ideal reference plan for GDM calculation. Based on these observations, the minimum isodose volume (50%PIV) is assumed 2.4 times of PIV and GDM is determined as the distance between 50%PIV and 2.4PIV.
Sensitivity Analysis
The sensitivity of the quality measure (NCI, GI, CDM, and GDM) to the displacement of PIV (∂x), dose spillage (∂r) and target size (r0) are evaluated using two sphere model (one for TV and the other for PIV). For mathematical simplicity, two different scenarios of imperfections, (1) dose spillage and (2) displacement of PIV around the perfect alignment to TV (∂x = ∂r = 0) are considered as derived in Appendix. The sensitivity of NCI for dose spillage (A2) and PIV displacement (A7) depends on target size (r0).
(1).

(2).

(A2).
(A7).
It is noted that the sensitivity of NCI is doubled for dose spillage (r) than that of the PIV displacement (x).
On the other hand, the sensitivity of CDM for dose spillage (A4) and PIV displacement (A10) is independent to the target size (r0) as shown below.
(A4).
(A10).

It is interesting to note that CDM is also twice sensitive for dose spillage than the PIV displacement. The same relationship can be found for the sensitivity of GDM applying the two sphere model between 50%PIV and 2.4 × PIV.
Statistical Analysis of NCI, CDM, GI and GDM
Detailed information about treatment technique and treatment outcome has been electronically collected and managed since early 1990s in our institution in the form of database including dosimetric statistics for all radiotherapy and SRS plans using GK and Linac. Dose statistics for 2429 cases of GK plans during the period of Jan 2018 to June 2020 and 76 cases of Linac-based SRS plans were extracted to review the distribution of NCI and GI. Targets with maximum dimension of less than 2 mm or prescription isodose of larger than 80% were excluded. Table 1 shows the planning parameter of GK plans (Number of plans, target volume (mean, range, median), Rx dose, isocenters, CI, GI) of GK and Linac based SBRT plans.
Table 1.
Statistics of Gamma Knife and Linac based brain metastasis plans
| Gamma Knife | Linac VMAT | |||
|---|---|---|---|---|
| Mean (Range) | Total | Mean (Range) | Total | |
| Number of Patients | 986 | 26 | ||
| Number of targets/plan | 1.76 (1-12) | 2429 | 2.9 (2-3) | 76 |
| Prescription Dose (Gy) | 20.4 (11-35) | 19.2 (11-24) | ||
| %Isodose | 59.9 (50-79) | 67.2 (50.6-92.8) | ||
| Max Dimension (cm) | 1.82 (0.22-7.8) | 1.7 (0.31-6.4) | ||
| Volume of target (cc) | 3.8 (0.006-83.3) | 2.35 (0.01-17.68) | ||
| NCI | 1.89 (1-14.7) | 2.0 (1.2-20.8) | ||
| GI | 3.59 (2.35-25.5) | 5.4 (2.4-33.3) |
NCI and GI are compared to the new measures CDM and GDM in order to evaluate their volume dependency. Higher dose are often prescribed for small brain metastasis in GK. Hypothetical CDM was calculated for these small targets assuming the same prescriptions were prescribed for all size of brain metastasis.
RESULTS
Reference volume for Gradient distance measure, GDM
Literature suggests that the minimum value of GI is 2.4 in most modern radiotherapy units including Linac, CyberKnife and GKs. The Gamma Knife system, PerfexionTM or ICONTM, has different collimator sizes. Figure 2 (a) shows GI as a function of prescription isodose and collimator combinations. As reported in many papers, it is re-confirmed that the minimum GI value of 2.4 is found also in the new version of GK system. Plans using two isocenters with different collimator size (equal weighting) tends to have narrower range of prescription isodose for their minimum GI value compared to single isocenter plans. Figure 2 (b) shows GDM as a function of prescription isodose line and collimator combination. GDM is well within 1.0 mm for single isocenter technique in wide range of prescription isodose line. Whilst, two isocenter technique shows GDM of > 1 mm especially when large iso dose line is used for prescription. In terms of low dose spillage, extra care should be taken when using two shots plans with different collimator size.
Figure 2.

GI and GDM for single and two shots Gamma Knife plans. GI and GDM are function of prescription isodose line. The use of higher percentage isodose line in prescription tends to slowly decrease dose spillage or GI/GDM before rapid turnaround to huge increase in dose spillage. This turnaround happens early for two shot plans. The minimum GI and GDM are 2.4 and 0, respectively.
Sensitivity of CDM and NCI
The sensitivity of CDM and NCI is a function of PIV displacement (caused by target position uncertainty or setup error) and dose spillage as described in the previous section and Appendix. Additionally NCI depends on the target size as shown in the equation (A6) and has strong non linearity (inconsistent sensitiviy) with PIV displacement as shown in Figure 3. The simulation was based on the spherical target size with the radius of 10 mm. CDM shows consistent sensitivity (good linearity) in wide range of PIV displacement and no volume dependency. The horizontal axis of NCI is the ratio of PIV displacement to the radius of tumor. The initial slope of NCI is found 3/2r0 as calculated in the equation (A7) and the slope of CDM is 0.5 as found in equation (A10).
Figure 3.
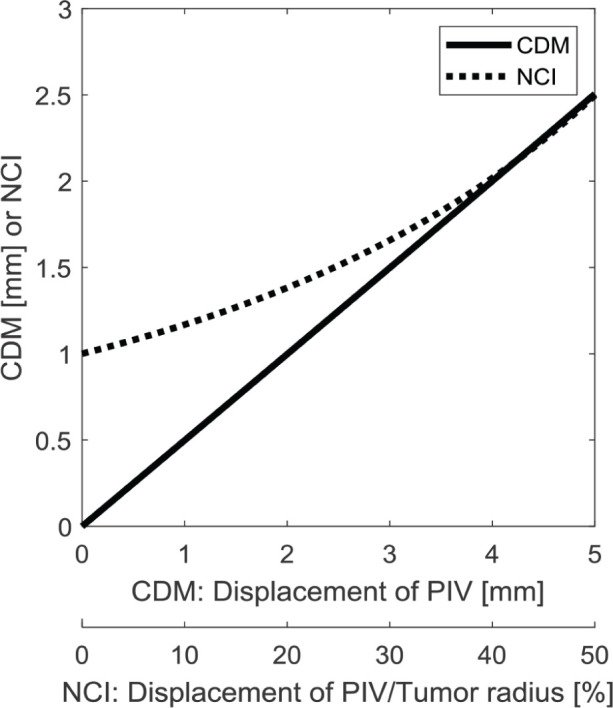
The sensitivity of CDM and NCI on PIV displacement. NCI is a function of both displacement and tumor volume and its sensitivity is lower at origin. On the other hand, CDM shows consistent sensitivity (linear relationship with PIV displacement or target motion. The initial slope of NCI is 3/2r0 as described in equation (A7), where r0 is the effective radius of tumor.
Statistical analysis of quality measures
GK plans during the period of [2018.1-2020.6] are investigated to review quality measure statistics as shown in Figures 4. The strong dependency of NCI on the target volume is observed in Figure 4 (a) with drastic increase for small targets. It is interesting to note that smaller targets are higher and larger targets are lower than the hypothetical trend lines of 1 mm. Two trend lines represent NCI curves when the plans have the dose spillage (∂r) of 1 mm or 2 mm, respectively from the perfect conformity. In other words, dose spillage is less for small targets in CDM perspective although their NCI are much larger than those of large targets. Figure 4 (b) shows the distribution of CDM for the same data set. Retrospective planning study on Linac-based SRS plans using VMAT for brain metastasis originally treated in GK [14] were overlaid with large empty circles in Fig 4. Linac-based plans show more consistent distribution of CDM over the full range of target volume and NCI distribution is better matched with 1 mm trend line. Characteristic of NCI and CDM (volume independency) analyzed in Appendix seems apparent both in GK and Linac based SRS plans. Although the difference is subtle (CDM of 0.5 mm for small targets vs 2.0 mm for large targets), the clinical experience that it is difficult to improve the conformity, NCI, for small targets corresponds well with CDM distribution. In other words, conformity evaluation based on NCI may be misleadingly strict for small targets and generous for large targets. It is not appropriate to use NCI to compare lesions with different volume.
Figure 4.

a) NCI in brain metastasis SRS plans. NCI shows high volume dependency in both treatment modalities. Solid and broken lines shows NCI for uniform dose spillage of 1 mm and 2 mm around target volume, respectively. b) CDM in brain metastasis SRS plans using GK and Linac. c) GI in brain metastasis SRS plans. GI also shows high volume dependency in both treatment modalities. Solid and broken lines shows GK for uniform dose spillage of 1 mm and 2 mm around reference volume (2.4PIV). d) GDM in brain metastasis SRS plans. GDM shows smaller volume dependency in both treatment modality. Note that NCI and GI are log scale whereas CDM and GDM are shown in linear scale.
GI and GDM are shown in Fig 4 (c) and (d) respectively. The plans with GDM inversely proportional to TV are mostly from the plans with single or two isocenters with prescription isodose line to >> 50% of the maximum dose. As shown in Fig 2, extra caution should be paid when two different size collimators were used to avoid such dose spillage. Linac-based SRS plans using VMAT show similar trend with those of GK plans in general. Like CDM, Linac-based SRS plans show better consistency in GDM than GK plans. CDM and GDM clearly shows that these quality measures are largely independent on the target volume. Note that NCI and GI are shown in log scale whereas CMD and GDM are shown in linear scale.
Histogram of CDM and GDM shows that the most frequent CDM and GDM are around 0.8 mm and more than 90% of the GK plans have less than 2.1 mm of CDM and GDM. Considering the precision of treatment delivery system and the uncertainty of image guidance system in GK ICONTM, this size of dose spillage or dosimetric margin is considered reasonable.
DISCUSSION
Dose conformity is an important requirement for successful implementation of SRS programs with high fractional dose. With modern radiotherapy technology and an increasingly demanding conformity requirement, the application of conformity indices should be carefully considered. Most widely accepted conformity indices such as NCI and GI are based on volume ratio, which are useful for their simple concept and easy computation. Although these indices serve well for direct comparison of different plans for the same target under evaluation, it is often very difficult to evaluate the quality of different plans due to the strong volume dependency and inconsistent sensitivity (nonlinearity) as described in Figure 3, equation (A2), and (A6). In this paper, we proposed the new indices, CDM and GDM that show good linearity over wide range of PIV displacement without target volume dependency (Figure 3, equation A4 and A9). Although the sensitivity curve of CDM (A9) is nonlinear as NCI (A6), the shape of the CDM curve is practically linear as shown in Fig 3. GDM is another conformity distance measure for the evaluation at lower isodose. Although the distance of 50%PIV can be compared directly with PIV, it is not fully immune to the volume dependency due to the dose gradient dependency on field size. Literature search on various SRS plans using multiple treatment modalities revealed that 2.4 times of PIV is a reasonable estimate for the minimum volume of 50%PIV or the reference volume for GDM.
Sensitivity analysis in this paper has limitation caused by simplification of the target shape to mere sphere and its assumption of near perfect condition as origin (dr = dx =0) for two cases in the Appendix. Clinical targets with complex shape may not have the same characteristics shown in Appendix and Fig 3. Spherical targets with a large deviation from the assumption (dr or dx is not small) also may not have the same characteristics. The two-sphere model, however, is still helpful to understand the difference in the mechanism of NCI and CDM. Instead of attempting to prove the accuracy of the model, volume dependency of NCI/GK and much less dependency of CDM/GDM were demonstrated by clinical data of brain metastases using both GK and Linac-based VMAT SRS plans. Fig 4 shows that Linac based plans were better aligned with model expectation. Semi-automatic optimization with scripts in Linac based plan would be partially responsible for more consistent CDM/GDM distribution than manual optimization in GK plans. CDM/GDM therefore should be applicable independent to the planning/treatment modality.
Application of CDM and GDM is more intuitive in the perspective of image guidance, PTV margin design and inter/intra target motion consideration where they are all described in the distance measure. It is also more intuitive at the time of treatment planning. As shown in Figure 4 (a), it is often difficult to achieve good conformity of NCI < 2 for small targets << 0.1 cc. When the same plans are reviewed with respect to CDM, it is apparent why it is harder to further improve NCI. CDM of small targets are already smaller than those of larger targets. NCI/GI are still useful when multiple plans are compared for the given target volume but it is hard to set a guideline generally applicable for legions with different volume. In order to investigate the impact of NCI and CDM on target coverage as a function of PIV displacement, dosimetry was simulated on randomly selected 10 targets using GK planning system with PIV displacement of up to 2.5 mm in each direction of x, y, and z with the step size of 0.5 mm. Target coverage decreased with PIV displacement but the reduction was more apparent for targets with large NCI rather than small NCI as shown in Fig 5 (a). Taking CDM into account, decrease in target coverage are better aligned regardless of target volumes. Target coverage (V100) was maintained up to 95% when the displacement is less than CDM (b).
Figure 5.

Target coverage is shown as a function of: a) PIV displacement and b) PIV displacement – CDM
CDM statistics shown in Figure 4 (b) raises a question therefore if the dose spillage for large targets in GK plans is more generous than necessary and it is too stringent for small targets. Considering image guidance characteristics, it would be beneficial to maintain uniform CDM distribution regardless of its target size. Much less than 0.5 mm margin for very small target may be inadequate considering the limitation of treatment and imaging system precision and inter/intra-fraction patient motion. In our institution like many other clinical practices, the prescription dose to brain metastasis is escalated for smaller targets. It is 24 Gy, 18 Gy and 15 Gy for target size of < 2 cm, < 3 cm and ≥ 3 cm, respectively. The distance from the 24 Gy to 18 Gy, and 15 Gy are 0.8 mm and 1.2 mm, respectively in the plans where 24 Gy is prescribed to 90% isodose using 4 mm shot which as steepest dose gradient. Dose escalation (to 18 Gy or 24 Gy) to the small targets can be regarded as having extra CDM of 0.8 mm to 1.2 mm with same prescription dose (of 15 Gy). This interpretation leads to the same prescription dose with consistent CDM of about 2 mm to all size of tumor volume in practice.
In GK plans for a small target of less than 1 cc, it is often prescribed to >> 50% of the maximum dose with single or combination of two different collimators. Figure 6 shows GK distribution with single shots or two shots plans. It is interesting to note that the distribution of GI in two shot plans is heavily governed by larger collimator. For e.g., GI distribution in two shot plans using 4 mm and 8 mm collimators is extended from the GI distribution in single shot plan using 8 mm. Two shot plans using 8 mm and 16 mm collimators is grouped similarly with single shot plan using 16 mm. A group of plans with single shot of 8 mm and two shots with 4 mm and 8 mm are indicated using thicker circle and another group of plans with single shot of 16 mm and two shots with 8 mm + 16 mm are indicated using thickest circle. It clearly shows that two-shots plans cost large increase in GI. Extra caution should be paid when two shot plan has to be utilized in terms of GI and GDM perspective. GI in plans with multiple shots (small dots in Fig 6) remain consistently low in general.
Figure 6.
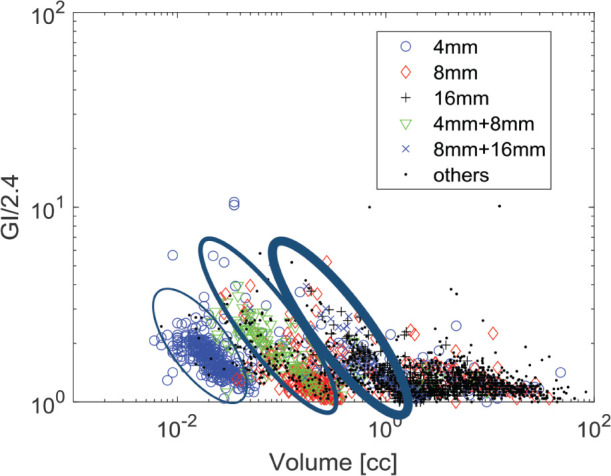
GI of single and two shots GK plans for small targets. For small targets < 1 cc are often planned with single or two shots in Gamma Knife. GI distribution of two shot plans are heavily governed by the larger collimator and aligned with their single isocenter plans counterparts.
A number of conformity indices have been introduced and applied to quantify the quality of stereotactic radiosurgery plans. Feuvert et. al. [15] reviewed various indices described in the literature including RTOG protocol. Cutoff value for these indices may be available but lack of criteria to determine unacceptable plans was questioned in the review. Authors argued that the interpretation of conformation data alone is not sufficient and machine related parameters should be taken into account. Nakamura el. al. [5] concluded that conformity does not seem to be very important for very small lesions since a worst conformity was noted in the lesions smaller than 1 cc for which no complications of radiosurgery were observed. The conformity continues to increase with target size where most complications occur. Application of constant threshold for NCI and GI may result in unsatisfactory conformity requirement when applied over the wide range of target volumes. In CDM perspective for the same data set, however, conformity seems obsessive (CDM of < 0.5 mm) for small targets and relieved (> 2.0 mm) for larger targets. Guidelines for CDM and GDM should be determined considering image guidance capability in modern radiosurgery, SRS treatment system reproducibility and immobilization technology used in each institution. Based on the statistics presented in this study, CDM of 1-2 mm and GDM of 2-4 mm would be a reasonable threshold. Although CDM reports consistent plan quality over wide range of TV, its inability of distinguishing over/under coverage requires caution of its use. To be warranted, another quality measure such as minimum dose to TV or D99 should be considered along with CDM/GDM. Correlation of the proposed new measures with clinical outcome is an interesting topic to further investigate.
CONCLUSION
New conformity measures, CDM and GDM, are proposed in this paper. Linearity of the new measures on the PIV displacement and dose spillage is demonstrated using the analytic two sphere model. Independency of the new measures on the target volume is also demonstrated. Considering wide acceptance of image guided radiosurgery in clinical practice, the new conformity measures are preferred over the conventional volume ratio methods such as NCI and GI.
ACKNOWLEDGMENTS
Authors’ disclosure of potential conflicts of interest
The authors have nothing to disclose.
APPENDIX
NCI is defined as shown below so that it becomes 1 when TV and PIV are identically overlapped and becomes larger than 1 otherwise, where TVPIV is the target volume in PIV. Two cases of conformity scenario will be reviewed using two sphere model.
(A1).
Case 1: PIV completely encloses TV (dx = 0, dr ≠ 0)
NCI is reduced to V/V0 in this case, where TV=TVPIV=V0, PIV=V, V0 and V are the volume of TV and PIV, respectively. The radius of V0 and V are denoted by r0 and r (r = r0 + dr).
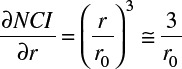
The sensitivity of NCI is calculated by its partial derivative.
(A2).
Volume ratio such as NCI in the previous example can be revisited in a different dimensional perspective such as a distance measure as shown below. For the sake of simplicity, the radius of sphere with the same volume of interest is selected in this study. Conformity distance measure is therefore defined as the difference in the radius between PIV and TV to represent the average distance between the two volumes.
(A3).
(A4).
Case 2: PIV partially encloses TV (dr ≠ 0, dx = 0)
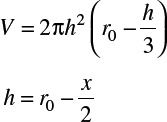
In this case, two spheres are assumed to have the same radius, r0, for the sake of simplicity. The target volume is shown in solid line and the PIV is shown in broken line. The volume of target and PIV (V0) is calculated by

The section of a sphere cut by a plane is  .
.
Thus the overlapped volume (V) by the two spheres is double the size of a sphere section. x is the displacement of PIV from the ideal location (perfect overlap with TV) and h is the height of the sphere section.
(A5).
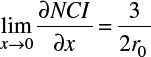
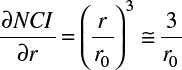
In this case, NCI becomes (V/V0)2. The Sensitivity of NCI becomes
(A6).
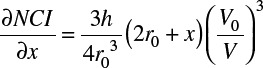
(A7).

To be more general, conformity measure is modified to be the difference between the union and the intersection of two spheres (TV and PIV). With this generalization in CDM definition, equation (A3) can be regarded as a special case of equation (A8). The conformity measure calculates the average distance between the target and PIV.
(A8).
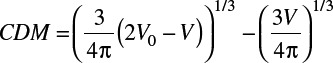
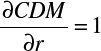
The sensitivity of the conformity distance measure (CDM) to the target motion is
(A9).
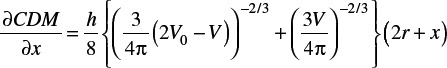
(A10).
The sensitivity of NCI is not only a function of displacement (dx) or dose spillage (dr) but also it is inversely proportional to the target size (r0). That is why the volume ratio for small target is much more sensitive than that of the larger target. On the other hand, the conformity measure is directly proportional to the displacement (dx) or dose spillage (dr) regardless of the target size (r0). Moreover it does not require complex computation since TV (V0) and PIV (V) are readily available in most modern planning systems. It is interesting to note that the sensitivity of target motion is half of the dose spillage for both NCI and CDM.
Footnotes
Author contributions
Conception and design: Young-Bin Cho
Data Collection: Young-Bin Cho, Samuel Chao, Erin Murphy and Ping Xia
Data analysis and interpretation: Young-Bin Cho, Gennady Neyman, Ping Xia, Samuel Chao, Erin Murphy, and John Suh
Manuscript writing: Young-Bin Cho
Final approval of manuscript: Young-Bin Cho, Erin Murphy, Samuel Chao, John Suh, Gennady Neyman and Xia Ping
REFERENCES
- 1.Webb S. Optimizing the planning of intensity modulated radiotherapy. Phys Med Biol 1994;39(12):2229-2246. [DOI] [PubMed] [Google Scholar]
- 2.Boyer A, Yu C. Intensity-modulated radiation therapy with dynamic multileaf collimators. Semin Radiat Oncol 1999;9(1):48-5. [DOI] [PubMed] [Google Scholar]
- 3.Otto K. Volumetric modulated arc therapy: IMRT in a single gantry arc. Med Phys 2008;35(1):310-317. [DOI] [PubMed] [Google Scholar]
- 4.Jaffray D, Siewerdsen J. Cone-beam computed tomography with a flat-panel imager: Initial performance characterization. Med Phys 2000;27(6):1311-1323. [DOI] [PubMed] [Google Scholar]
- 5.Nakamura JL, Verhey LJ, Smith V, Petti PL, Lamborn KR, Larson DA, Wara WM, McDermott MW, Sneed PK. Dose conformity of Gamma Knife radiosurgery and risk factors for complications. Int J Radiat Oncol Biol Phys 2001;51:1313-1319. [DOI] [PubMed] [Google Scholar]
- 6.Paddick I, Lippitz B. A simple dose gradient measurement tool to complement the conformity index. J Neurosurg 2006;105(Suppl):194-201. [DOI] [PubMed] [Google Scholar]
- 7.Torrens M, Chung C, Chung HT, Hanssens P, Jaffray D, Kemeny A, Larson D, Levivier M, Lindquist C, Lippitz B, Novotny J, Paddick I, Prasad D, Yu CP. Standardization of terminology in stereotactic radiosurgery: Report from the Standardization Committee of the International Leksell Gamma Knife Society. J Neurosurg. 2014;121(Suppl 2):2-15. [DOI] [PubMed] [Google Scholar]
- 8.Bova FJ, Meeks SL, Friedman WA, Buatti JM. Stereotactic plan evaluation tool, the “UF Index. Int J Radiat Oncol Biol Phys 1999;45(3 Suppl S):188. [Google Scholar]
- 9.Wagner TH, Bova FJ, Friedman WA, Buatti JM, Bouchet LG, Meeks SL. A simple and reliable index for scoring rival stereotactic radiosurgery plans. Int J Radiat Oncol Biol Phys 2003;57:1141-1149. [DOI] [PubMed] [Google Scholar]
- 10.McDonald D, Schuler J, Takacs I, Peng J, Jenrette J, Vanek K. Comparison of radiation dose spillage from the Gamma Knife Perfexion with that from volumetric modulated arc radiotherapy during treatment of multiple brain metastasis in a single fraction. J Neurosurg 2014;121:51-59. [DOI] [PubMed] [Google Scholar]
- 11.Han EY, Wang H, Luo D, Li J, Wang X. Dosimetric comparison of fractionated radiosurgery plans using frameless Gamma Knife ICON and CyberKnife systems with linear accelerator-based radiosurgery plans for multiple large brain metastases. J Neurosurg 2020;132:1473-1479. [DOI] [PubMed] [Google Scholar]
- 12.Cilla S, Laniro A, Romano C, Deodato F, Macchia G, Buwenge M, Dinapoli N, Boldrini L, Morganti AG, Valentini V. Template-based automation of treatment planning in advanced radiotherapy: A comprehensive dosimetric and clinical evaluation. Sci Rep 2020;10:423. 10.1038/s41598-019-56966-y [DOI] [PMC free article] [PubMed] [Google Scholar]
- 13.Reynolds TA, Jensen AR, Bellairs EE, Ozer M. Dose gradient index for stereotactic radiosurgery/radiation therapy. Int J Radiat Oncol Biol Phys 2020;106(3):604-611. [DOI] [PubMed] [Google Scholar]
- 14.Liu C-W, Ahmed S, Gray T, Ma T, Cho Y-B, Neyman G, Chao S, Suh J, Xia P. Is there a volume threshold of brain metastases for Linac-based stereotactic radiotherapy?. J Radiosurg Body Radiat Ther 2021;7:309-18. [PMC free article] [PubMed] [Google Scholar]
- 15.Feuvret L, Noël G, Mazeron JJ, Bey P. Conformity index: A review. Int J Radiat Oncol Biol Phys 2006;64(2):333-342. doi: 10.1016/j.ijrobp.2005.09.028. . [DOI] [PubMed] [Google Scholar]