Abstract
Gene amplification drives oncogenesis in a broad spectrum of cancers. A number of drugs have been developed to inhibit the protein products of amplified driver genes, but their clinical efficacy is often hampered by drug resistance. Here, we introduce a therapeutic strategy for targeting cancer-associated gene amplifications by activating the DNA damage response with triplex-forming oligonucleotides (TFOs), which drives induction of apoptosis in tumors, whereas cells without amplifications process lower levels of DNA damage. Focusing on cancers driven by HER2-amplification, we find that TFOs targeting HER2 induce copy number-dependent DNA double strand breaks and activate p53-independent apoptosis in HER2-positive cancer cells and human tumor xenografts via a mechanism that is independent of HER2 cellular function. This strategy has demonstrated in vivo efficacy comparable with current precision medicines and provided a feasible alternative to combat drug resistance in HER-positive breast and ovarian cancer models. These findings offer a general strategy for targeting tumors with amplified genomic loci.
Introduction
Advancements in DNA sequencing technology have not only revealed commonly mutated and deleted genes across cancer types but also enabled identification of amplified cancer-promoting genes 1. Amplification of genes involved in normal cell growth and survival pathways drives oncogenesis, ultimately affecting tumor progression and clinical outcome 2–4. These amplified genes include epigenetic regulators, cell cycle-associated genes, and genes linked to signaling pathways, such as the EGFR and HER2 genes 5. The first drugs directed against the overexpressed protein products encoded by these genes were major breakthroughs in cancer therapeutics 6. For example, trastuzumab targets the HER2 receptor tyrosine kinase, which is overexpressed in ∼25% of breast tumors due to gene amplification 7. Trastuzumab works, at least in part, by disrupting HER2 signaling, resulting in cell cycle arrest and suppression of cell growth and proliferation 8. While trastuzumab has proven to be effective in prolonging the survival of HER2-positive breast cancer patients, primary and acquired drug resistance limits overall success rates 9,10. Similar problems hamper the long-term efficacy of other cancer drugs, including the tyrosine kinase inhibitors gefitinib and erlotinib, which target EGFR gene amplification in breast, colorectal and lung cancer 11,12.
As an alternative strategy to targeting the overexpressed proteins, we developed a potential drug platform that directly converts the amplified oncogenic driver genes into DNA damage to trigger cell death. Our approach employs triplex-forming oligonucleotides (TFOs) that recognize unique polypurine sites within the amplified chromosomal region 13–15. TFO-induced DNA damage provokes apoptosis when multiple triplex structures are formed, while DNA repair processes the formation of one or two structures 16. Amplified regions of a gene can span kilobases to tens of megabases that include multiple oncogenic genes as well as passenger genes. Consequently, it would be expected that across the 14 human cancer subtypes characterized by gene amplification, the majority should have amplified regions with sequences that are conducive for our TFO approach.
Results
Triplex formation as a therapeutic strategy to target gene amplification
Binding of TFOs within the major groove of the double helix causes DNA perturbation that can impede replication fork progression, resulting in fork collapse and double strand break (DSB) formation 17. As such, formation of multiple chromosomal triplex structures can induce sufficient DNA damage to activate apoptosis in human cells 16. The nucleotide excision repair (NER) pathway resolves low levels of triplex-induced DNA damage and hence normal cells can tolerate TFO treatment 18,19. HER2 gene amplification in breast cancers provides an opportunity to test the efficacy of TFOs as a specific apoptosis inducing agent in cancer cells with limited toxicity in healthy cells, which lack HER2 amplification 20 (Fig. 1a-c). This approach is particularly feasible due to the presence of several polypurine sites in the HER2 gene that are a prime target for triplex formation 14.
Figure 1. Targeting gene amplification in cancer via triplex formation.
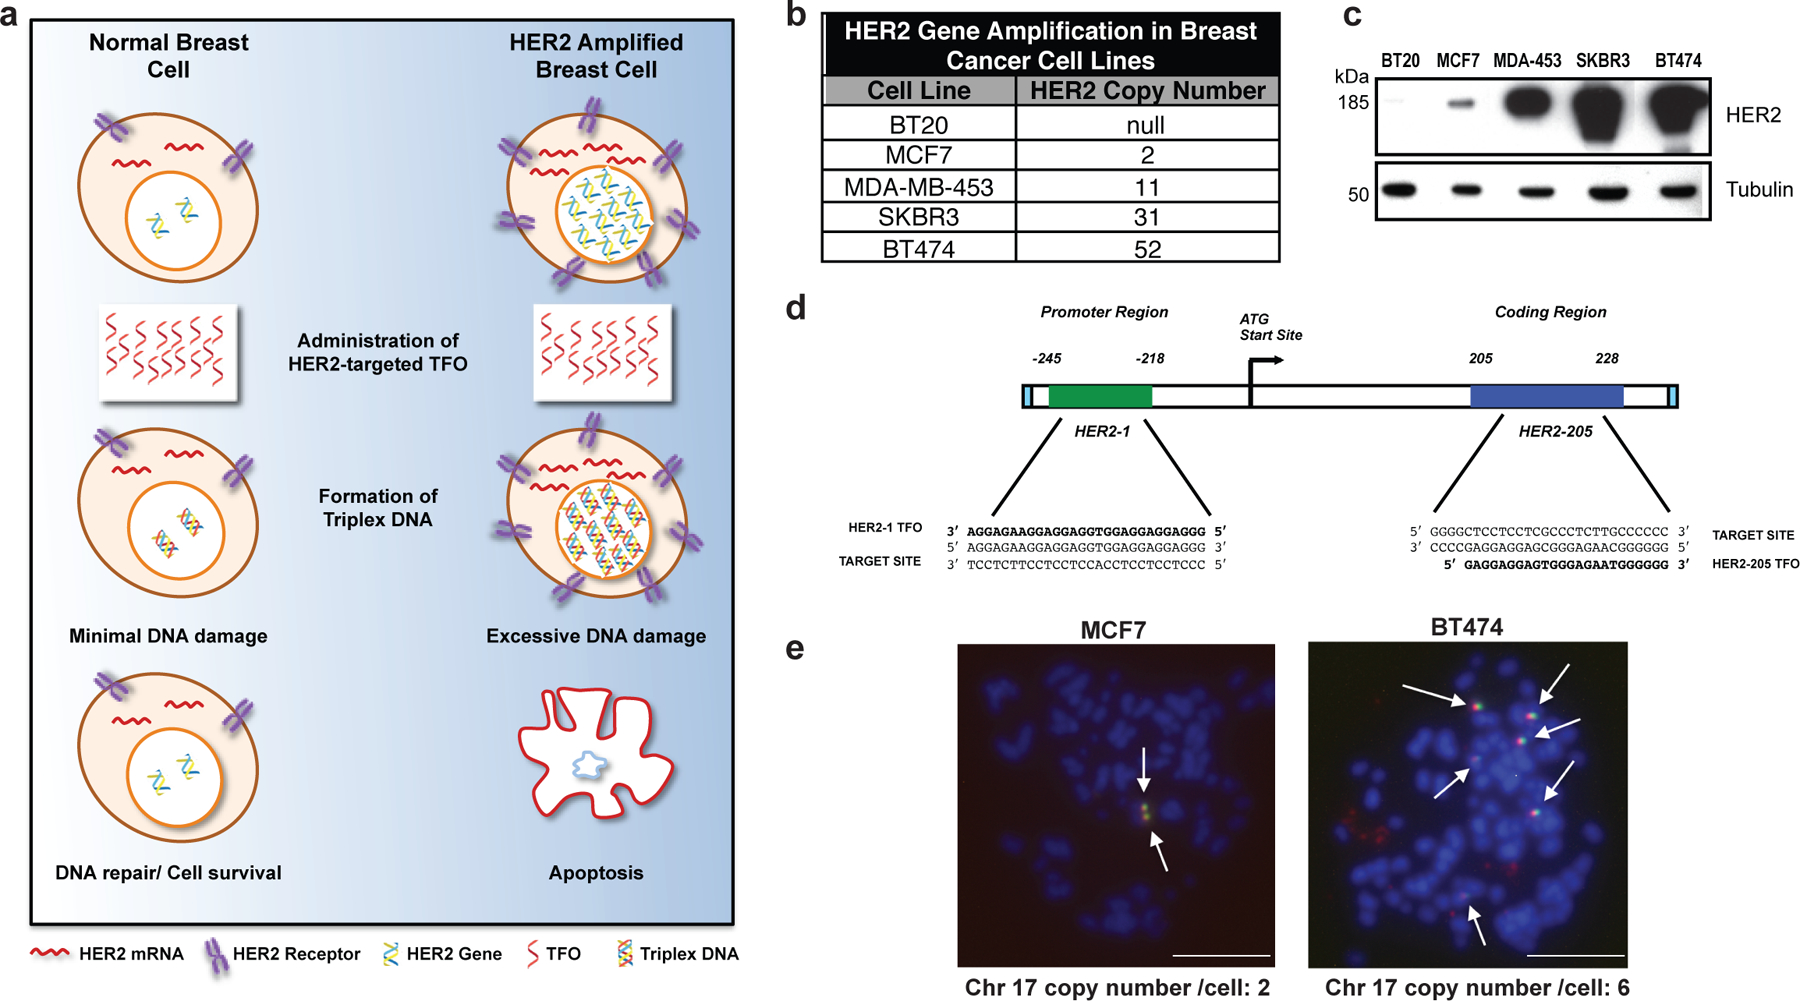
(a) Drug design scheme. Targeting the HER2 gene on a genomic level using DNA-binding molecules provides a therapeutic option to directly manipulate the DNA damage response pathways to specifically attack the HER2-amplified tumor. Triplex-induced DNA damage will only provoke apoptosis when multiple triplex structures are formed, while NER-dependent repair prevails in the presence of one or two structures. (b) Gene copy number characteristics of breast cancer cells lines 20. (c) Western blot analysis of HER2 protein levels in breast cancer cell lines with varying gene copy number. (d) TFOs bind as third strands in a sequence-specific manner within the major groove of duplex DNA at polypurine stretches. The specificity of these molecules arises from the formation of base triplets via reverse Hoogsteen hydrogen bonds between the third strand and the purine strand of the duplex DNA. Triplex structures were created in our studies using TFOs, HER2–1 and HER2–205 designed to bind to a polypurine sequence located either in the promoter or coding region of the HER2 gene. (e) Non-denatured metaphase chromosome spreads of MCF7 and BT474 breast cancer cells demonstrate chromosomal (blue) binding of TAMRA-HER2–205 (red) to its target site located on chromosome (chr.) 17 (green) (scale bar, 10μm).
We designed a TFO, HER2–1, to target the polypurine sequence in the promoter region of the HER2 gene at positions −218 to −245 relative to the transcription start site (Fig. 1d). Another polypurine site favorable for high affinity triplex formation is located within the coding region beginning at position 205 and is targeted by TFO, HER2–205 (Fig. 1d). To confirm chromosomal TFO binding, we prepared non-denatured metaphase spreads from MCF7 and BT474 breast cancer cells that had been treated with TAMRA-labeled HER2–205. The generation of chromosomal HER2–205 foci represent third strand binding to fixed chromosomes with intact DNA double helix, indicative of triplex formation 16. Using a FITC labeled satellite probe specific for human chromosome 17, we were able to verify gene-specific triplex formation (Fig. 1e). TAMRA-HER2–205 chromosomal foci were only generated on chromosome 17, the location of the HER2 gene, thus validating target site specificity (Fig. 1e).
Gene copy number dependent induction of DNA damage and apoptosis
We next assessed whether the level of triplex-induced DNA damage correlated with higher gene copy numbers. Using a neutral comet assay, we established that HER2–205 was more effective at inducing DNA damage than HER2–1, as indicated by an increase in DNA tail moment (Fig. 2a). Additionally, HER2–205 induced significantly more DSBs in cell lines containing multiple copies of the HER2 gene (Fig. 2b and Extended Data Fig. 1a). Importantly, the level of triplex-induced DNA damage was directly proportional to gene copy number (Fig. 2c). We also observed markedly increased γH2AX positive cells, indicative of DSBs, upon treatment of breast cancer cells with high HER2 gene copy numbers (Fig. 2d). We further assessed 53BP1 foci, which colocalizes with γH2AX at damage sites. HER2–205 treated BT474 cells exhibited substantially increased γH2AX and 53BP1 foci compared to cells treated with the control oligonucleotide MIX24 (Fig. 2e). Furthermore, colocalization of γH2AX and 53BP1 was observed in 49% of cells following HER2–205 treatment as shown in Extended Data Fig. 1b.
Figure 2. Triplex induced DNA Damage and Apoptosis Correlates with Gene Copy Number.
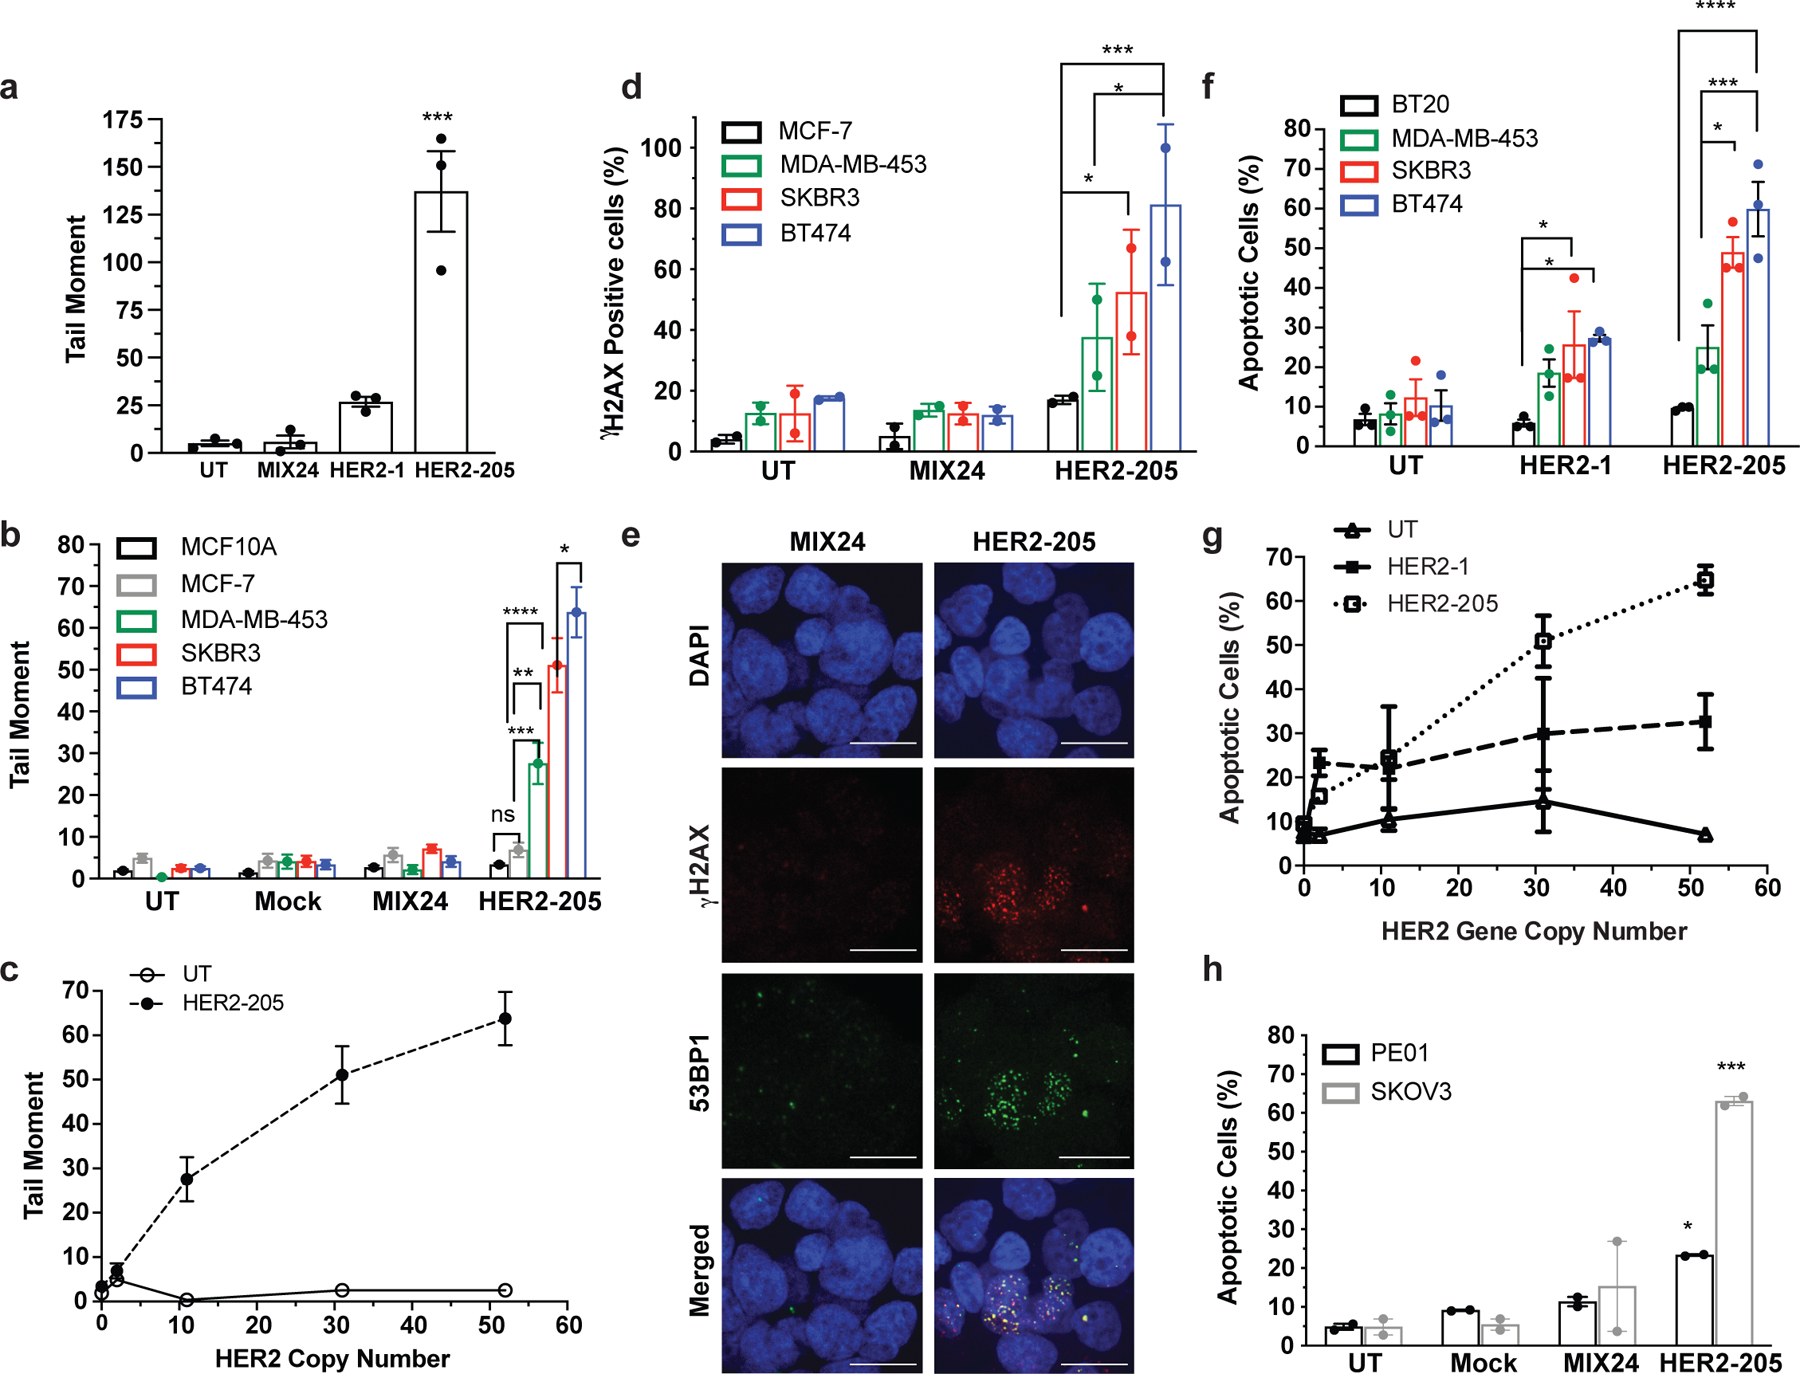
(a) Characterization of TFO induced DNA damage in BT474 cells as measured by neutral comet assay 24h post-treatment (n= 3 independent experiments). (b) Quantification of triplex-induced DNA double strand breaks using the neutral comet assay as measured by tail moment in multiple breast cancer cell lines (mean ± SEM, n= combined comets from 3 experiments, 300 comets). (c) Triplex-induced DNA damage increases in cell lines containing multiple copies of the HER2 gene (mean ± SEM, n=3 independent experiments). (d) Frequency of cells with greater than 5 γH2AX foci per nuclei following 24h HER2–205 treatment (50 cells per sample, n= 2 independent experiments). (e) Representative images of HER2–205 induced 53BP1 (green) and γH2AX (red) foci in nuclei (blue) compared to MIX24 24h post-treatment in BT474 cells (n= 2 independent experiments; scale bar, 5μm; quantification Extended Data Fig. 1b). (f) Analysis of triplex-induced apoptosis as measured by Annexin-V staining in breast cancer cell lines 24h post TFO-treatment (n= 3 independent experiments). (g) Results demonstrate that the level of triplex-induced apoptosis increases with gene copy number (mean ± SEM, n= 3 independent experiments). (h) Analysis of triplex-induced apoptosis in HER2-positive ovarian cancer cells as measured by Annexin V staining 48h post-treatment (n= 2 independent experiments). The TFO concentration used in these studies is 2μg/well (∼100nM). Data are presented as mean ± SEM (a,b,f,h) or mean ± SD (d) and were analyzed by two-way ANOVA with Tukey’s test as post hoc. ****P<0.0001, ***P<0.001, **P<0.01, *P<0.05
Given the association of increased DNA damage with activation of apoptosis, we hypothesized that HER2-targeting TFOs would be capable of inducing apoptosis specifically in amplified breast cancer cells. Our results revealed TFO-induced apoptosis specifically in the HER2-positive cell lines and that HER2–205 treatment resulted in a higher percentage of apoptotic cells than that with HER2–1 (Fig. 2f, g and Extended Data Fig. 1c). Together, the results demonstrate that the intensity of triplex-induced DNA damage and apoptosis is dependent on gene copy number (Fig. 2c, g). Furthermore, these findings indicate that triplex-induced apoptosis provides the basis to develop therapeutics that specifically target cancers stemming from gene amplification, while sparing normal non-amplified tissues.
To demonstrate the adaptability of this technology to target other cancers, we also evaluated therapeutic efficacy in HER2-positive ovarian cancers. When administered to PE01 and SKOV3 cells, both of which have HER2 copy number gains (Extended Data Fig. 1d), HER2–205 treatment induced increased γH2AX foci and DNA tail moments (Extended Data Fig. 1e-h). We also observed elevated levels of unrepaired DSBs in the untreated PE01 cells, which harbor a deficiency in BRCA2, a key factor involved in DSB repair by homologous recombination (Extended Data Fig. 1g, h). Importantly, TFO treatment significantly increased the level of DSBs above baseline (Extended Data Fig. 1h). In addition, HER2–205 reduced cell viability (Extended Data Fig. 1i) and activated apoptosis in both cancer cell lines (Fig. 2h and Extended Data Fig. 1j).
In vivo efficacy of triplex-induced apoptosis on tumor growth
We reasoned that the HER2-targeting TFO could have clinical efficacy in treating HER2-positive cancers. We therefore developed two independent subcutaneous xenograft tumor models to test this premise and confirmed TFO tumor uptake by ex vivo fluorescence imaging and confocal microscopy of tumor tissue using TAMRA-labeled HER2–205 (Fig. 3a-c). Importantly, treatment of BT474 human breast tumors in athymic nude mice with HER2–205 suppressed tumor growth to a significantly greater degree than the control group of animals treated with MIX24 (Fig. 3d, f). IP administration of HER2–205 resulted in a notable reduction in tumor growth that was comparable to the currently used targeted therapy trastuzumab, thus demonstrating the potential utility of this gene-targeted cancer therapy (Fig. 3d, e). A tumor tripling time of 29 ± 5.7 days post-initial dose was observed in tumors treated with HER2–205 compared to 24 ± 2.1 days in tumors treated with trastuzumab (Fig. 3g). In contrast, the control oligonucleotide, MIX24 had no impact on BT474 tumor growth relative to the control buffer alone, with a tumor tripling time for control tumors of 15.7 ± 4.9 days versus 16.3 ± 6.6 days in tumors treated with MIX24 (ANOVA, p=0.99; Fig. 3g). Histological and immunohistochemical analyses were performed on paraffin-embedded tumor tissue sections. Tumor cell apoptosis (evidenced by the presence of cleaved caspase 3), decreased proliferation as measured by Ki67 staining and a confluent area of tumor necrosis were observed in the HER2–205 treated specimen (Fig. 3h). Magnification of the HER2–205 treated tumor revealed that areas of tumor cell apoptosis are accompanied by a brisk infiltrate of inflammatory cells consisting predominantly of neutrophils and macrophages (Fig. 3i).
Figure 3. In vivo effect of HER2–205 on human HER2-positive cancer xenografts.
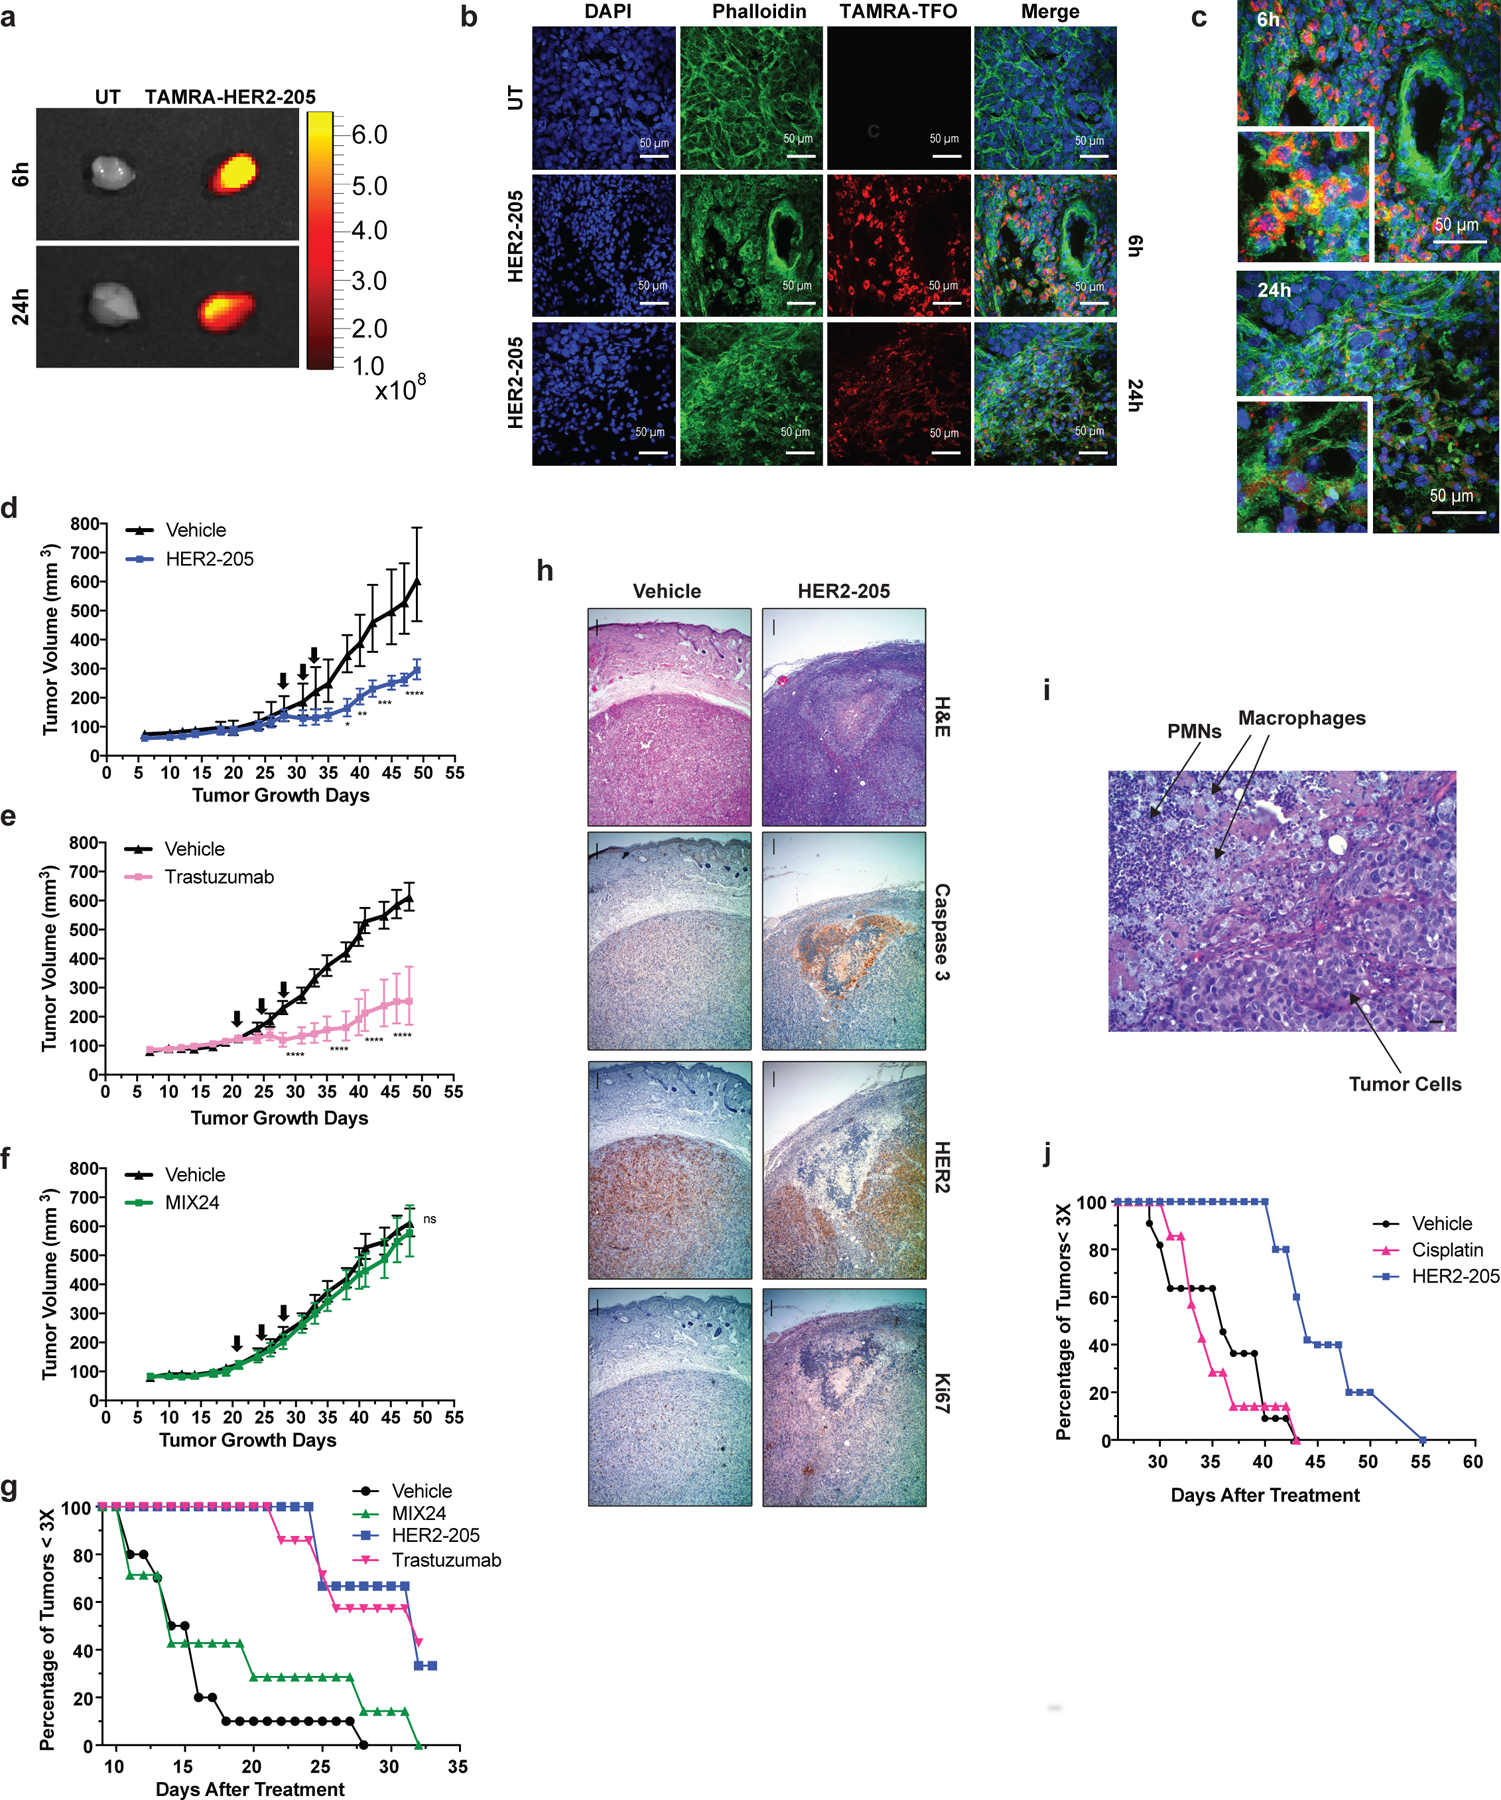
(a) Ex vivo fluorescence imaging of TAMRA-HER2–205 uptake in tumors harvested 6h and 24h post IP injection. (b) Confocal microscopy imaging of tumor tissue from mice treated with TAMRA-HER2–205 (20 mg/kg). Representative images of tumors sections at 6h (n=2 tumors) and 24h (n=2 tumors) post dosing. (c) Tumor sections visualize DAPI (blue), phalloidin (green) and HER2–205 (red) following a single dose of TAMRA-HER2–205 (20 mg/kg). (d) Tumor growth delay curves of BT474 xenografts generated by subcutaneous injection of female athymic nude mice. Twenty-eight days after implantation mice were treated by IP injection with three 20 mg/kg doses (evenly administered over 7 days) (d) HER2–205, n= 5 (e) trastuzumab, n= 8 and (f) MIX24, n= 8. Arrows indicate administration of doses. Tumor growth measurements are presented as mean ± SEM shown and analyzed by two-way ANOVA with Sidak test post-hoc. ****P<0.0001, ***P<0.001, **P<0.01, *P<0.05, ns, not significant. (g) Kaplan-Meier plots of the percentage of tumors smaller than three times baseline size. Baseline size was defined as tumor size on the first day of treatment [Day 28 in (d) and Day 21 in (e) and (f)]. (h) Histopathologic analysis of BT474 tumor sections from mice 24h after treatment with a single dose of HER2–205 (20 mg/kg body weight) or vehicle. Haematoxylin and eosin (H&E), caspase 3, HER2, Ki67 stain at 4X magnification (scale 10µm). (i) Higher magnification of H&E tumor section from HER2–205 treatment specimen (scale 10µm). (j) Kaplan-Meier plot of the percentage of SKOV3 ovarian cancer tumors smaller than three times baseline size. Mice were treated with 3 doses of HER2–205 (n=5) at a concentration of 20 mg/kg or cisplatin (n=7) at a concentration of 10 mg/kg.
The standard of care for epithelial ovarian cancers consists of platinum-based chemotherapy and surgical cytoreduction 21. However, as in the case of the SKOV3 cell line, many human ovarian cancers are resistant to platinum-based drugs. Using SKOV3 ovarian cancer xenografts, we found that HER2–205 treatment confers a substantial survival advantage compared with cisplatin (Fig. 3j). HER2–205 demonstrated significant tumor growth inhibitory activity with the average tumor volume being 49% smaller than those in cisplatin-treated mice (ANOVA, p=0.006). These data demonstrate that triplex-induced apoptosis may provide a feasible therapeutic alternative for drug resistant cancers with copy number gains.
TFO targets within different genomic regions of the HER2 gene
In humans, there is at least one unique and high affinity triplex targeting site located in the promoter and transcribed regions of each protein-coding gene. However, mapping of polypurine sequences with characteristics to serve as a potential target site have identified 519,971 unique sequences throughout the human genome 22. In order to further investigate the versatility of our approach, we designed TFOs to target sites within other regions of the HER2 gene (Fig. 4a). HER2–5922 was designed to target a polypurine sequence in intron 2 and HER2–40118 was directed to a sequence within intron 19 (Fig. 4a). We first assessed the TFOs for their ability to induce DNA damage as compared to the TFOs targeting the promoter and coding regions. We determined by neutral comet assay that HER2–5922 and HER2–40118 were more effective at inducing DNA damage than HER2–205 as indicated by an increase in DNA tail moment (Fig. 4b). BT474 cells were then exposed to increasing concentrations of the HER2-targeted TFOs. As shown in Figure 4c, cell viability decreased with increasing TFO concentrations, with HER2–205, HER2–5922 and HER2–40118 exhibiting similar dose responses with ∼50% cell death at a concentration of 12.5 nM. Western blot analysis of cleaved PARP confirmed triplex-induced apoptosis that corresponded to an increase in DSBs as indicated by H2AX phosphorylation at S139 (Fig. 4d). These results solidify the feasibility of our therapeutic strategy and emphasize that every amplified cancer driver gene should have multiple polypurine sequences that can be targeted using gene-specific bioactive TFOs.
Figure 4. Triplex targeting of non-essential regions of the HER2 gene.
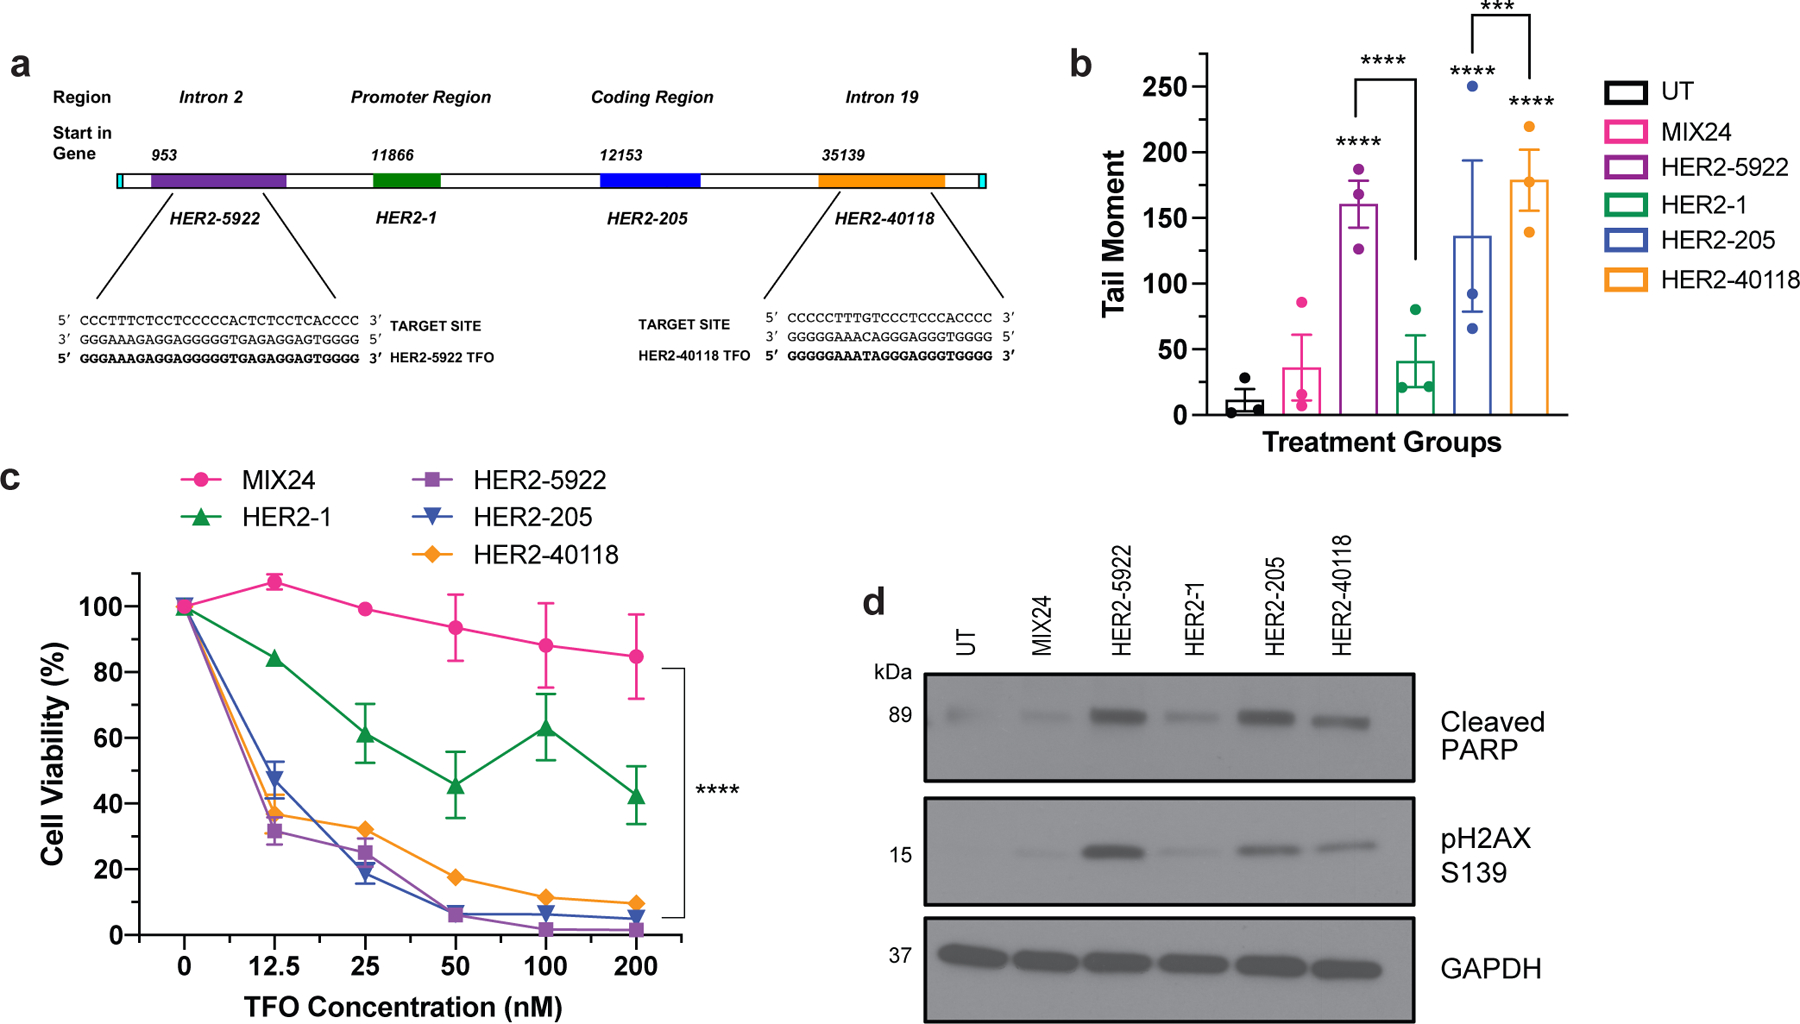
(a) TFOs were designed to bind to polypurine sequences located in the introns of the HER2 gene. HER2–5922 was designed to bind to a region of intron 2 and HER2–40118 targets a site in intron 19. (b) Characterization of TFO induced DNA damage in BT474 cells as measured by neutral comet assay 24h post-treatment. Data presented as mean ± SEM and analyzed by two-way ANOVA with Tukey test post hoc (****p<0.0001, ***p<0.001; n= 3 independent experiments). (c) Evaluation of dose-dependent cell viability using CellTiter-Glo luminescent assay 48h post-treatment with HER2-targeted TFOs in BT474 cells. Data presented as mean ± SEM and analyzed by two-way ANOVA with Tukey test post hoc (****p<0.0001; n=2 independent experiments with triplicate wells per dose). (d) Western blot analysis of triplex-induced apoptosis as measured by cleaved PARP and DNA damage by pH2AX S139 in BT474 cells 12h following TFO-treatment.
Mechanism of action based on activation of DNA damage response
To define the mechanism of drug action and characterize the DNA damage response activated in TFO-treated cells, we first confirmed target specific induction of DNA damage by HER2–205 using chromatin immunoprecipitation (ChIP) assays for γH2AX and multiplexed qPCR with a probe for the HER2 gene locus. We detected a 22-fold enrichment of γH2AX at the HER2 gene relative to untreated cells 8h post TFO-treatment (Fig. 5a). Moreover, analysis for the induction of DNA damage at a non-targeted region of the genome using a probe for the GAPDH gene locus did not detect the presence of γH2AX above background levels following HER2–205 treatment (Fig. 5a). Furthermore, targeting of the intron with HER2–5922 also resulted in gene-specific induction of DNA damage (Extended Data Fig. 2a). These findings support a mechanism that TFO-generated structures can induce DNA damage specifically at the targeted amplified oncogenic gene locus.
Figure 5. Molecular mechanism of anticancer activity.
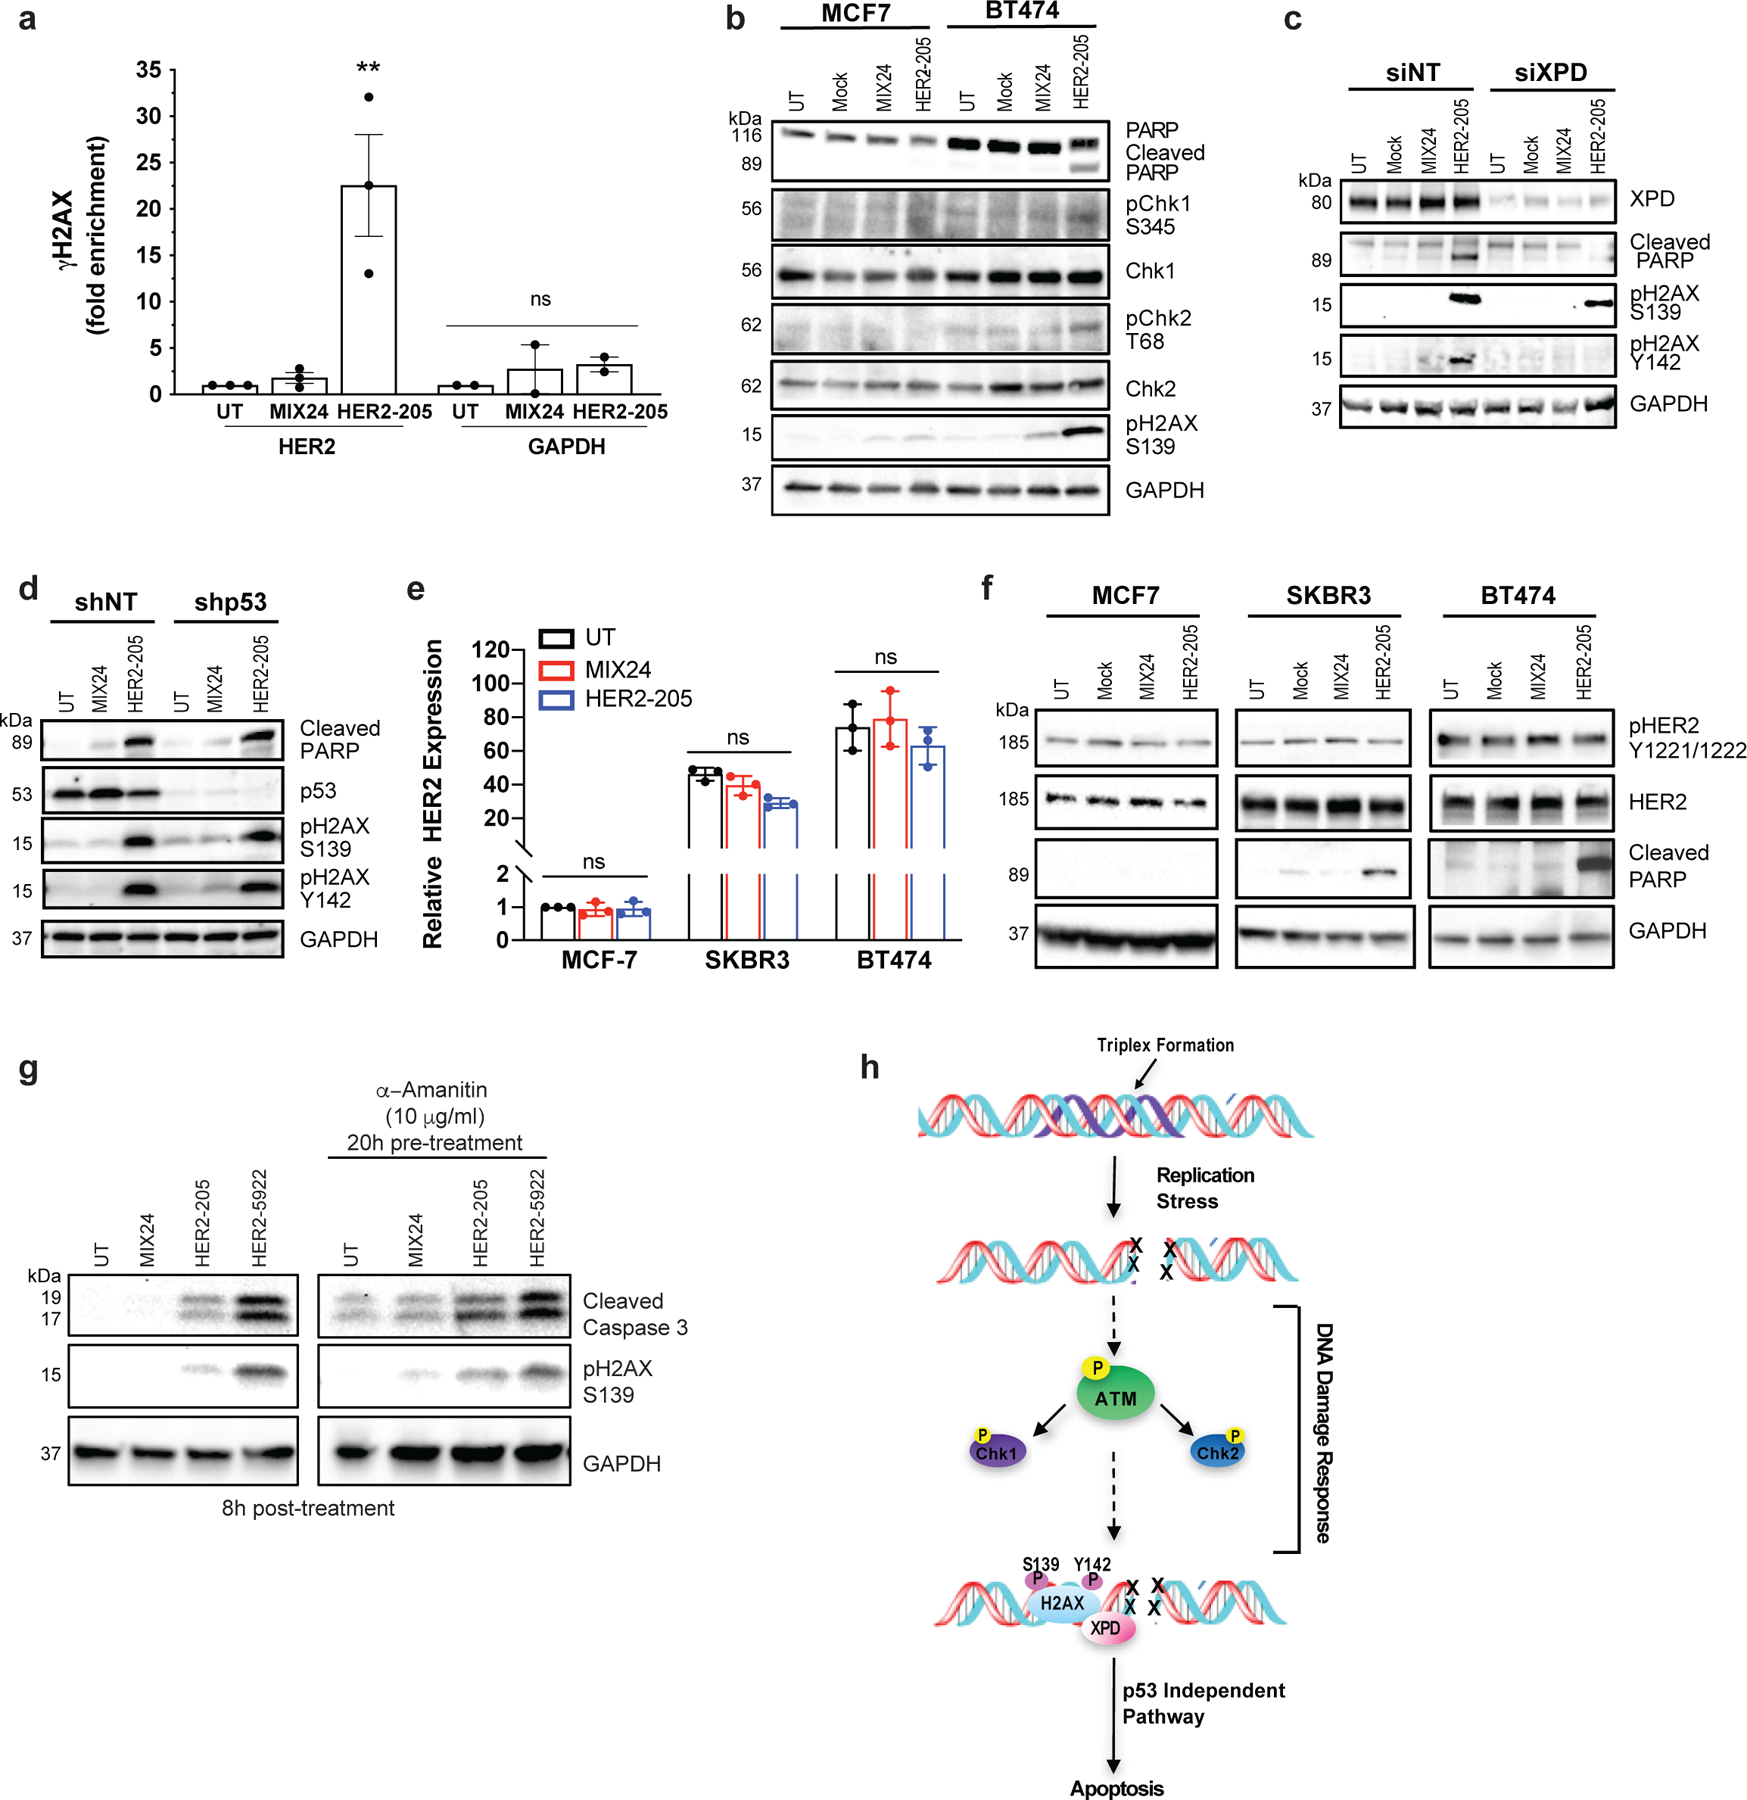
(a) ChIP analysis of BT474 cells demonstrate gene-specific enrichment of γH2AX at the HER2 target site (n= 3 independent experiments) and an absence of DNA damage at the non-targeted GAPDH locus (n= 2 independent experiments) 8h post-treatment with HER2–205. Data presented as mean ± SEM and analyzed with one-way ANOVA with Tukey test post-hoc (***p<0.001; ns, not significant). (b) Western blot analysis of the phosphorylation status of the DNA damage response proteins Chk1 and Chk2 following TFO treatment (n= 2 independent experiments). (c) Knockdown of the NER factor, XPD, in BT474 cells results in a decrease in the induction of apoptosis as measured by cleaved PARP and pH2AX Y142. pH2AX Y142 is an essential post-translational modification for the recruitment of pro-apoptotic factors to the tail of γH2AX (n= 2 experiments). (d) HER2–205 activates p53-independent apoptosis in HER2-positive BT474 cells (n= 2 independent experiments). (e) Analysis of HER2 gene expression by RT-PCR (mean ± SD; two-ANOVA with Tukey test post-hoc; ns, not significant; n= 3 independent experiments) and (f) determination of HER2 protein levels and phosphorylation status using Western blot analysis provide evidence that HER2–205 achieves therapeutic activity using a mechanism that is independent of HER2 cellular function (n= 2 experiments). (g) Inhibition of transcription in BT474 cells prior to TFO treatment results in a similar level of triplex-induced DNA damage and apoptosis as indicated by Western blot analysis of pH2AX S139 and cleaved caspase 3 (n= 2 independent experiments). (h) Schematic of molecular mechanism of gene-targeted apoptosis. TFO binding in the major groove of duplex DNA causes a distortion of the double helix, which can induce DNA replication fork collapse and induction of DSBs. DNA damage response activates an XPD-dependent but p53-independent apoptotic pathway.
We next determined the status of ATM, Chk1/Chk2 and the NER factor, XPD in HER2 positive cells following HER2–205 treatment. As shown in Fig. 5b, Chk1 phosphorylation at serine 345 was observed after HER2–205 treatment in the HER2-amplified cells and not in the cells with normal HER2 gene copy numbers. Chk1 activation in BT474 cells corresponds to induction of DSBs and apoptosis as determined by Western blot analysis of pH2AX S139 and cleaved PARP, respectively. In addition, phosphorylation of Chk2 at threonine 68 was observed in response to triplex-induced DSBs in the BT474 cells (Fig. 5b). These phosphorylation events correspond to an increase in pATM positive cells following HER2–205 treatment (Extended Data Fig. 2b).
Regulation of the phosphorylation status of H2AX at tyrosine 142 (Y142) is crucial for determining the recruitment of either DNA repair or pro-apoptotic factors to the DSB site 23. We have found that H2AX Y142 is phosphorylated in response to HER2–205 induced DSBs to trigger apoptosis as indicated by Western blot analysis of cleaved PARP (Fig. 5c). XPD occupies a central role in the mechanism that modulates survival/death decisions in response to triplex-induced DNA damage 16. Accordingly, a requirement for XPD in the phosphorylation of Y142 in H2AX and activation of apoptosis following HER2–205 treatment was seen (Fig. 5c). These results suggest that the absence of XPD disrupts the signaling pathway used to activate apoptosis following TFO treatment and support a mechanism of action that is dependent upon DNA damage response.
The p53 tumor suppressor regulates pro-apoptotic pathways in response to severe DNA damage. However, over 50% of human cancers exhibit chemotherapeutic resistant phenotypes due to loss of function p53 mutations which lead to an inability to trigger apoptosis. To test whether triplex-induced DNA damage could activate p53-independent apoptosis, we treated p53-depleted BT474 cells with HER2–205. We found that TFO-treatment of p53-depleted cells results in a similar level of PARP cleavage compared to treatment of control cells, confirming that triplex formation can activate apoptosis irrespective of p53 status (Fig 5d). Unlike XPD-depleted cells, which displayed a decrease in TFO-induced apoptosis, we also demonstrate that triplex-induced DSBs trigger robust H2AX Y142 phosphorylation in the absence of p53 (Fig. 5 c, d).
Trastuzumab’s anticancer activity has been attributed in part to changes in HER2 tyrosine phosphorylation and a reduction in total HER2 protein 24,25. To further demonstrate that HER2–205 activity is independent of the cellular function of HER2, we analyzed HER2 gene expression by RT-PCR (Fig. 5e) and monitored total HER2 protein and phosphorylation levels by Western blot following treatment in several breast cancer cell lines (Fig. 5f). Our results showed that HER2 gene expression is not significantly affected by HER2–205 treatment in either the non-amplified or amplified breast cancer cell lines (Fig. 5e) and that total and activated HER2 levels remain the same following triplex-induced apoptosis in the HER2-positive cells compared to the control samples (Fig. 5f). Although we did not detect a significant impact on HER2 gene expression following HER2–1 treatment, we observed significantly more TFO-induced DNA damage and activation of apoptosis with HER2–205 compared to HER2–1, further supporting a mechanism that activity is dependent on the ability to induce DNA damage and not disruption of gene expression (Extended Data Fig. 2c-e). In general, no changes were noted in the levels of HER3, HER4 and EGFR following HER2–205 treatment compared to the untreated or MIX24 treated cells (Extended Data Fig. 2 f-h). Additionally, targeting in the introns did not result in a significant decrease in HER2 gene expression following treatment with either HER2–5922 or HER2–40118 (Extended Data Fig. 2i).
In order to investigate whether active transcription was a prerequisite for TFO induced DNA damage and activation of apoptosis, we inhibited transcription in BT474 cells with α-amanitin prior to HER2–205 treatment (Extended Data Fig. 2j). Our results demonstrate similar increases in the levels of γH2AX and cleaved caspase 3 compared to controls following TFO treatment in cells with and without transcription inhibitor pretreatment (Fig. 5g), suggesting that active transcription is not required for TFO-induced DNA damage or activation of apoptosis. Taken together, these results support a mechanism of action for the HER2-targeted TFO that is independent of the cellular function of HER2 (Fig. 5h).
Enhanced drug efficacy via increased bioavailability
Inadequate drug delivery to the intended disease site can significantly impact therapeutic effect. We hypothesized that polymeric, biodegradable nanoparticles (NPs) could serve as a delivery platform and enhance drug efficacy of the HER2-targeted TFOs. We evaluated several NPs formulations for their tumor delivery potential by screening for fluorescent dye uptake using DiD (Extended Data Fig. 3). We encapsulated DiD using two NP formulations fabricated from poly(lactic-co-glycolic acid) (PLGA), a polymer that has been approved by the FDA for numerous drug delivery applications. In addition, we also screened NPs from a copolymer of poly(lactic acid) (PLA) and hyperbranched polyglycerol (HPG), PLA-HPG, which has previously demonstrated long blood circulation times and effective tumor uptake 26. We determined that DiD-loaded PLA-HPG NPs had more efficient tumor uptake compared to the PLGA formulations following intravenous administration by retro-orbital (RO) injection in an orthotopic mouse model of BT474 breast cancer cells (Extended Data Fig. 3a). To better understand the overall impact of PLA-HPG NPs delivery, we also evaluated biodistribution in the liver, lung, spleen, kidney and heart 12h post administration (Extended Data Fig. 3b).
To visualize TFO uptake and inform timing and dosing for subsequent tumor growth studies, TAMRA-HER2–205 was encapsulated in PLA-HPG NPs and tumor distribution was evaluated 12 and 24 hours post systemic administration in mice bearing orthotopic BT474 breast cancer tumors (Fig. 6a). To confirm that cells internalized HER2–205, we performed confocal microscopy on tumor tissue and quantified nuclear and extranuclear TAMRA fluorescence. Administration of the NPs resulted in TAMRA-HER2–205 accumulation in the tumor, which is detectable at 12 hours with a slight reduction in fluorescence intensity 24 hours post treatment (Fig. 6b). Furthermore, PLA-HPG NPs delivered TAMRA-HER2–205 to the nucleus, with significantly greater fluorescence being detected at 12h post-treatment compared to 24h (Fig. 6b). We also evaluated the fluorescence intensity of TAMRA-HER2–205 in the liver, kidney and spleen compared to tumors in order to determine TFO biodistribution at 12 and 24 hours post treatment (Extended Data Fig. 4). Administration of TAMRA-HER2–205 PLA-HPG NPs resulted in ∼10% distribution of the TFO in the tumor at both time points (Extended Data Fig. 4d, e). As observed in our biodistribution studies using DiD, we detected higher uptake in the liver and spleen (27% and 49%, respectively at 12 h post-treatment) compared to the tumor (Extended Data Fig. 4d, e).
Figure 6. Impact of nanoparticle delivery on therapeutic efficacy.
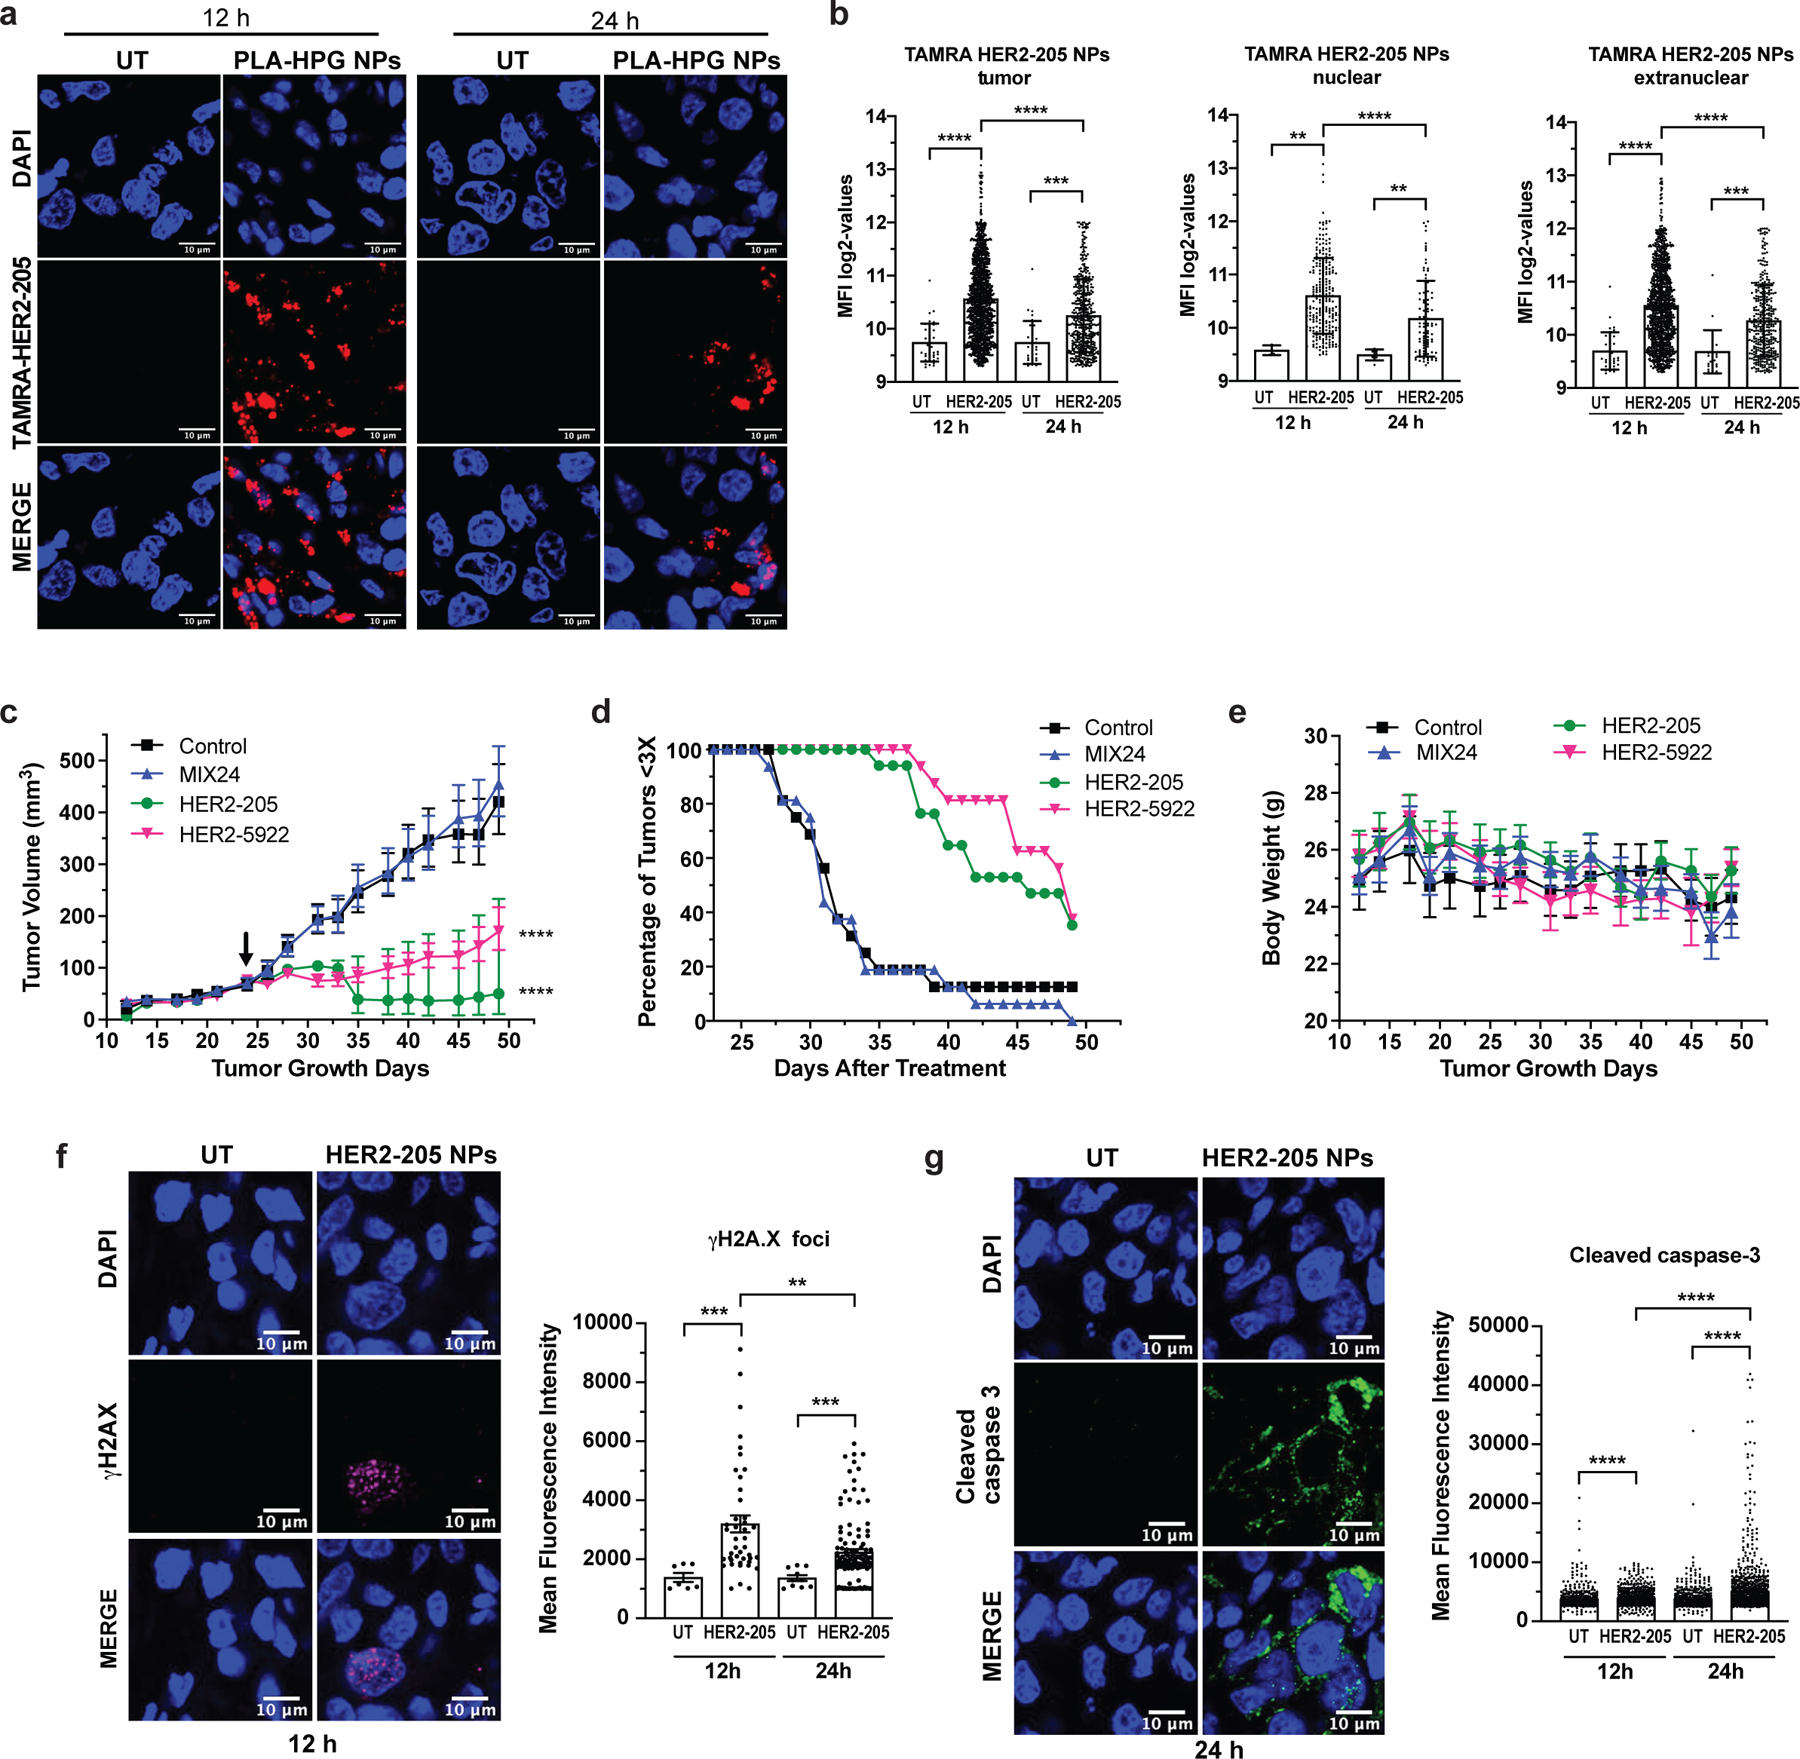
(a) Confocal imaging of tumor tissue from mice treated with TAMRA-HER2–205 encapsulated PLA-HPG nanoparticles (NPs) visualize tumor distribution. Representative images of tumor sections 12 and 24 hours post intravenous administration via retro-orbital injection (scale bars, 10μm). (b) Intratumor TAMRA fluorescence was detected and quantified at both 12 and 24 hours after a 2mg dose of TAMRA-HER2–205 PLA-HPG NPs (n=4 tumors/timepoint). TFO uptake in the total tumor and the sub-compartments of nuclear and extranuclear was quantified as mean fluorescence intensity (MFI) ± SD. Statistical significance was calculated by Kolmogorov-Smirnov test (****P<0.0001, ***P<0.001, **P<0.01). (c) Tumor growth delay curves in an orthotopic breast cancer model generated from BT474 cells in female athymic nude mice. Twenty-four days after implantation mice were treated by systemic administration with a 2 mg dose of PLA-HPG encapsulated NPs of HER2–205, n= 8; HER2–5922, n= 8 and MIX24, n= 8. Arrow indicates administration of the first dose of seven evenly administered over 15 days. Tumor volume measurements ± SEM are shown (two-way ANOVA with Tukey test post-hoc; ****P<0.0001). (d) Kaplan-Meier plots of the percentage of tumors smaller than three times baseline size. Baseline size was defined as tumor size on the first day of treatment. (e) Body weight was monitored as a means to detect gross toxicity (mean ± error, 95% CI, n=8 animals per treatment group). (f) Immunofluorescence of γH2AX indicate an increase in DNA damage in tumors following treatment with HER2–205 PLA-HPG NPs (n=4 tumors/timepoint). Representative images of confocal microscopy (scale bar, 10μm) 12h post-treatment and quantification of γH2AX foci is reported as mean fluorescence intensity (mean ± SEM; Kolmogorov-Smirnov test; ***P<0.001, **P<0.01) (g) Representative images of confocal microscopy of cleave caspase 3 immunofluorescence in tumors 24h post HER2–205 PLA-HPG NP treatment (n=4 tumors/timepoint; scale bar, 10μm). Quantification of mean fluorescence intensity indicates an activation of apoptosis in tumors (mean ± SEM; Kolmogorov-Smirnov test; ****P<0.0001).
We then assessed the impact of the PLA-HPG delivery system (Extended Data Fig. 5a) on therapeutic efficacy using an orthotopic mouse tumor xenograft model of BT474 breast cancer cells. In this model, systemic administration of HER2–205 and HER2–5922 PLA-HPG NPs significantly decreased tumor growth and improved survival (as defined by tumor volume 3X that of initial treatment) (Fig. 6c, d). As observed in other models, MIX24 PLA-HPG NPs did not alter tumor growth or survival as compared with untreated controls (Fig. 6c). The efficacy of this therapeutic strategy is not limited by the target region, as HER2–5922 NP treatment resulted in a significant delay in tumor growth (Fig. 6c). A tumor tripling time of 45 ± 1.5 days post-initial dose was observed in tumors treated with HER2–205 NPs and 47 ± 1.2 days with HER2–5922 NPs compared to 33 ± 1.4 days with MIX24 NPs (Fig. 6d). In contrast, MIX24 NPs had no impact on BT474 tumor growth relative to untreated controls (31 ± 0.8 2 days). Notably, when compared to treatment with naked oligonucleotides, the TFO encapsulated PLA-HPG NP delivery system reduced by more than 99% the amount of TFO (∼80 nmol/dose with naked TFO compared to ∼0.14 nmol/dose with NPs) required to have a significant impact on tumor growth delay and improved survival. Additionally, no gross toxicity, including weight loss was noted in mice treated with the HER2-targeted TFOs NPs (Fig. 6e).
To investigate the mechanism underlying efficacy, we treated BT474 tumor-bearing mice with HER2–205 NPs (2mg, RO injection) and collected tumors for immunofluorescence analysis 12 and 24 hours after treatment. As compared with untreated controls, tumors treated with HER2–205 had significantly higher levels of γH2AX foci (2-fold increase as measured by MFI), confirming that HER2-targeted TFOs were capable of inducing DNA damage in tumors (Fig. 6f and Extended Data Fig. 5b). To determine whether this degree of DNA damage was sufficient to induce cell death, we also investigated the activation of caspase 3 as a biomarker for apoptosis (Fig. 6g and Extended Data 5c). We observed a significant increase in apoptosis 24h following HER2–205 treatment compared to untreated tumors (Fig. 6g), which corresponded to the increase in DNA damage observed at 12h (Fig. 6f). Similar to the mechanistic studies in cells, we did not observe a decrease in HER2 protein levels in the HER2–205 treated tumors compared to tumors from untreated mice (Extended Data Fig. 5d, e). Together, these results indicate that HER2–205 exhibits therapeutic efficacy utilizing a mechanism independent of HER2 cellular function and based on DNA damage response, where induction of DNA damage activates apoptosis.
Discussion
Our work introduces targeted therapeutics that may be efficacious in the treatment of cancers driven by gene amplification with minimal potential for toxicity to normal tissue. We have developed agents with a unique mechanism of action and have provided evidence that induction of the DNA damage response via TFO treatment is as effective as targeting the overexpressed oncogenic protein product. HER2–205 treatment of HER2-positive breast cancer xenografts resulted in a 52% reduction in tumor volumes compared to controls, which is comparable to the 58% reduction observed with trastuzumab. We have also demonstrated that enhanced tumor delivery using a NP platform can significantly improve the efficacy of TFO-treatment. Furthermore, development of bioactive reagents is not restricted to polypurine sequences within a specific region of the amplified gene. Notably, we confirm that triplex formation can activate p53-independent apoptosis, which is especially important since p53 mutations are associated with therapeutically challenging cancers. We envision the use of this drug design platform as a treatment option for several cancers with gene amplification and resistance to current therapies.
Methods
Oligonucleotides.
Oligonucleotides were synthesized by IDT with a 3′-amino modifier, purified by reverse-phase HPLC and analyzed by ESI-MS (Extended Data Fig. 6). The TFO, HER2–1 was designed to bind to the HER2 promoter with the sequence 5′-GGGAGGAGGAGGTGGAGGAGGAAGAGGA-3′. HER2–205 was synthesized with the sequence 5′-GAGGAGGAGTGGGAGAATGGGGGG-3′ and has been designed to bind to a polypurine sequence in the coding region of the HER2 gene. The TFO, HER2–5922 was designed to bind to a region of intron 2, with the sequence 5′ GGGAAAGAG GAGGGGGTGAGAGGAGTGGGG 3′. HER2–40118 was synthesized with the sequence, 5′ GGGGGAAATAGGGAGGGTGGGG 3′ and has been designed to bind to a polypurine sequence in intron 19 of the HER2 gene. The control mixed-sequence oligonucleotide MIX24 has the following sequence: 5′-AGTCAGTCAGTCAGT CAGTCAGTC-3′. Labeled oligonucleotide was synthesized with 5′-TAMRA modifications.
Cell Lines and Transfections.
Human breast cancer cell lines were obtained from ATCC and routinely tested for mycoplasma. The human cell lines, MDA-MB-453 (ATCC HTB-131), SKBR3 (ATCC HTB-30), and BT474 (ATCC HTB-20) are HER2-amplified breast cancer cell lines. BT20 (ATCC HTB-19) and MCF7 (ATCC HTB-222) cells are non-amplified breast cancer cell lines. MCF-10A (ATCC CRL-10317) is a non-tumorigenic breast epithelial cell line. PEO1 and SKOV3 (ATCC HTB-77) are human ovarian cancer cell lines with HER2 gene amplification.
Cells were seeded in six-well plates at a density of 2–4×10⁵ cells per well the day before transfection. Cells were transfected with 2µg (∼100 nM) of HER2-targeted TFO or MIX24 using Oligofectamine (Invitrogen) or Dharmafect-1 (Dharmacon) transfection reagent. Transfection was performed as per manufacturer’s instructions. siRNA directed against p53, XPD and non-target controls (ON-Target plus SMARTpool reagents; Dharmacon) were transfected into BT474 cells using Dharmafect-1 transfection reagent (Dharmacon) according to the manufacturer’s instructions. Western blot analysis was used to confirm knockdown of protein.
Metaphase Chromosome Spreads.
Cells were transfected with 2μg of TAMRA labeled HER2–205. Twenty-four hours post-transfection, cells were treated for 5h with Colcemid (0.1μg/μl). Cells were then collected and washed once with PBS. To the cell pellet, a 75mM KCl solution was added for 20 minutes at 37°C. Cell pellets were then resuspended in Carnoy’s fixative solution (75% methanol, 25% acetic acid). Following 10 minutes incubation at room temperature, the cells were pelleted and resuspended in an additional 500μl of Carnoy’s fixative solution (3:1 methanol:acetic acid). Cells were dropped from a height onto glass slides and mounting medium with DAPI (Prolong Gold antifade reagent, Invitrogen) was added to each slide. A FITC labeled satellite probe specific for human chromosome 17 (Cytocell) was used to detect gene-specific triplex formation. Pictures were taken of 50–60 metaphase spreads using an Axiovert 200 microscope (Carl Zeiss Micro Imaging, Inc.).
Western blotting.
Whole cell lysates were prepared from floating and adherent cells using RIPA or AZ lysis buffer according to standard protocols. Total protein (30–50 μg/sample) was resolved by SDS-PAGE. Proteins were detected by a standard immunoblot protocol using the following primary antibodies: PARP, cleaved PARP, cleaved caspase 3, γH2AX, XPD, p53, HER2, pHER2 (Y11221/1222), HER3, pHER3 (Y1289), HER4, pHER4 (Y1284), EGFR, pEGFR (Y1068), Chk1, pChk1(S345), pChk2 (T68), and Chk2 (Cell Signaling Technology); pH2AX (tyrosine 142; EMD Millipore); tubulin (clone B-512; Sigma), γH2AX (Santa Cruz Biotechnology) and GAPDH-HRP (Proteintech). Each experiment was repeated with independent sample preparation a minimum of three times, and representative western blots are shown.
Apoptosis analysis.
Cells (2–4×10⁵) were seeded in six-well plates 24h prior to treatment with MIX24, HER2–1 or HER2–205 (2μg). Post-treatment analysis was performed using the Annexin V-FITC/PI apoptosis detection kit (BD Pharmingen) according to the manufacturer’s protocol. Apoptotic frequency was calculated as the combined percentage of early and late apoptotic cells. Data analysis was performed using FlowJo software (Extended Data Fig. 7a).
Immunofluorescence.
Cells were seeded onto UV-irradiated coverslips and were treated for 24h with HER2–205, MIX24, or a mock transfection. Cells were processed 24h post-transfection, fixed with 4% formaldehyde and then incubated with ice-cold 100% methanol for 20 minutes followed by a methanol and acetone solution (1:1) for 20 minutes each at −20°C. After washing with PBS, cells were blocked with blocking buffer (4% BSA, 0.2% Triton X-100 in PBS) for 30 minutes and then incubated overnight with the following primary antibodies: γH2AX (1:500; Cell Signaling or Millipore) and 53BP1 (1:100; Santa Cruz) in blocking buffer at 4°C. After three washes, cells were incubated with secondary antibodies Alexa 488 F(ab′)2 fragment goat anti-rabbit IgG or Alexa 568 F(ab′)2 fragment goat anti-mouse IgG (1:1000; Molecular Probes) for 1h at room temperature. Cells were mounted on microscope glass slides with anti-fade mounting media containing DAPI (Life Technologies), and pictures were taken with a Leica SP5 microscope. Immunofluorescence experiments were repeated for validation.
Comet Assay.
Neutral comet assays were performed 24h post TFO-transfection as per the manufacturer’s instructions (Trevigen) with the adjustment of 3.5×10⁵ cells/ml for each single cell suspension and 30 minutes electrophoresis. Comets were visualized using an Axiovert 200 microscope and analyzed with Autocomet or Comet Score 2.0 software. Approximately 100–200 comets were analyzed per experiment. Experiments were performed in triplicate and results were expressed as mean tail moment and standard error of the mean.
Mouse Models.
All mice were maintained at Yale School of Medicine in accordance with guidelines of the Animal Care and Use Committee of Yale University and conformed to the recommendations in the Guide for the Care and Use of Laboratory Animals (Institute of Laboratory Animal Resources, National Research Council, National Academy of Sciences). Studies were conducted in accordance with the Tumor Policy for Mice, including adhering to the maximal tumor size of 1cm3 and total tumor burden of less than 10% baseline body weight.
Six to seven-week old female BALB/c athymic, ovariectomized nude mice (Harlan Sprague-Dawley) were implanted with 0.72mg, 60-day release 17β-estradiol pellets (Innovative Research). The following day 2.5 ×10⁷ BT474 cells suspended in 100μl equal volume of media and Matrigel Basement Membrane Matrix (BD Bioscience) were injected subcutaneously in the right flank of each mouse. Mice bearing a tumor of ∼100 mm3 in volume were randomly divided into four treatment groups: vehicle (PBS), n=8; mixed-sequence oligonucleotide, MIX24, n=8; HER2-targeted TFO, HER2–205, n=5; and trastuzumab (Herceptin), n=8. Mice were treated with 20mg/kg body weight of MIX24, HER2–205 or trastuzumab in PBS by intraperitoneal injection (3 doses evenly administered over 7days). Tumor volumes in each group were then monitored and mice were sacrificed when tumor volumes reached 1000 mm3. Error bars represent standard error of the mean. Tumor tripling time was calculated as the time required for tumors to increase in volume three-fold over baseline (defined as tumor volume before administration of dose on first day of treatment). Harvested tumors were fixed in 10% neutral buffered formalin and processed by Yale Pathology Tissue Services for H&E, Caspase 3, HER2, and Ki67. Images were taken at 4x magnification.
To establish an ovarian cancer model, female BALB/c athymic nude mice were injected subcutaneously in the flank with 5 ×10⁶ SKOV3 cells suspended in 100μl equal volume of media and Matrigel. Mice bearing a tumor of ∼100 mm3 in volume were randomly divided into three treatment groups: vehicle (PBS), n=5; HER2-targeted TFO, HER2–205, n=5; and cisplatin, n=7. HER2–205 (20 mg/kg) and cisplatin (10 mg/kg) were administered by intraperitoneal injection (3 doses/ once per week for three weeks). This dosing schedule was adapted from an established regimen that avoids cisplatin toxicity in this mouse line. Tumor volumes were monitored and tumor tripling times were calculated as described above.
To establish an orthotopic breast cancer model, four-week female BALB/c athymic nude mice (Envigo) were implanted with 0.72mg, 60-day release 17β-estradiol pellets. The following day 2.5 ×10⁷ BT474 cells suspended in 100μl equal volume of media and Matrigel Basement Membrane Matrix (BD Bioscience) were injected subcutaneously in the left and right inguinal mammary fat pad of each mouse. Mice bearing a tumor of ∼100 mm3 in volume were randomly divided into four treatment groups: untreated, n=8; mixed-sequence oligonucleotide, MIX24, n=8; HER2-targeted TFO, HER2–205, n=8; and HER2-targeted TFO, HER2–5922, n=8. Mice were treated with 2mg PLA-HPG nanoparticles encapsulated (∼70 pmol TFO/mg) with either MIX24, HER2–205 or HER2–5922 in PBS (200 μl) by intravenous systemic administration using retro-orbital injection (7 doses evenly administered over 15 days). Tumors volumes were monitored by digital calipers and calculated using the formula V = (L X W X W) X 0.523.
Gene Expression.
RNA was extracted from snap-frozen cells using the RNeasy Kit (Qiagen) per the manufacturer’s protocol. cDNA synthesis was carried out with 1 μg of RNA via reverse transcription reactions and the High-Capacity cDNA Reverse Transcription Kit (ThermoFisher or Applied Biosystems). cDNA (10 ng) was then combined with TaqMan Universal PCR master mix (20 µl) (Applied Biosystem) and primers specific to HER2 (HER2, Hs01001580_m1, ThermoFisher Scientific) or the internal control, β-actin (Hs99999903_m1, ThermoFisher Scientific). qRT-PCR was performed in 96-well optical plates in triplicate for each sample. Briefly, reactions were performed at 50 °C for 2 minutes, followed by 95 °C for 10 minutes. Amplification of the target or control gene was carried out with 40 cycles of the two-step reaction, which included 95 °C for 15 seconds and 1 minute at 60°C. β-actin expression levels were used to normalize the difference between cDNA levels in different samples. Relative expression levels were calculated using the 2(-Delta Delta C(T)) method. Experiments were conducted at least three times and results are expressed as relative fold change and standard error of the mean.
Flow Cytometry.
BT474 cells were collected 24h following treatment with either MIX24 or HER2–205. After washing with PBS, cells were incubated with 1% paraformaldehyde for 15 minutes on ice. Cells were then fixed with cold 70% ethanol at −20 °C for 2h or kept for up to 2 weeks until further analysis. Cells were centrifuged and rinsed with PBS, blocked with PBST buffer (1% w/v bovine serum albumin and 0.2% v/v Triton X-100 in PBS) for 15 minutes on ice, followed by another PBS rinse. Cells were first incubated with anti-phospho-ATM (S1981, EMD Millipore) in PBST at 1:100 dilution for 1h at room temperature. Cells were rinsed with PBST and incubated with anti-rabbit IgG Fab2 Alexa 488 (Molecular Probes) at 1:100 dilution at room temperature for 1h, and then rinsed with PBST. Acquisition of labeled cells and analysis of data was completed using a flow cytometer (FACS Calibur) and FlowJo software respectively (Extended Data Fig. 7b).
Survival and Cell Viability Assays.
Cell survival was assayed by visualization of monolayer growth. Briefly, cells were plated at a defined density in 6 or 12-well dishes and treated with either transfection reagent alone (mock), MIX24, or HER2–205 as previously described. Monolayers were visualized by staining cells with crystal violet 72h post-treatment.
Cells (1.5 ×10⁴) were seeded in 96-well plates 18–24 hours prior to treatment with increasing concentration of either MIX24, HER2–1, HER2–5922-2, HER2–205 or HER2–40118. Cell viability was evaluated 48h post-treatment using CellTiter-Glo® Luminescent Cell Viability Assay per manufacturer’s instructions. Luminescent signals were normalized to mock treatment with transfection reagent alone. Experiments were performed in triplicate and results are expressed as percentage of viable cells and standard error of mean.
Fluorescence in situ Hybridization (FISH).
HER2 and chromosome 17 probes were obtained from Cytocell. The HER2 gene (17q12) probe was labeled with fluorescent Texas Red spectrum and the CEP17 (17p11.1-q11.1) probe was tagged with FITC. PEO1 and SKOV3 cells were treated with colcemid (0.1 µg/ml) for three hours and collected by trypsinizing the monolayer. After washing the cells with PBS, cells were treated with a hypotonic solution (0.075 M KCl) at 37°C for 20 minutes. Cells were then washed and fixed with Carnoy’s fixative solution (methanol and acetic acid in 3:1 ratio). Cells were dropped on slides and fluorescent in situ hybridization was performed on the spreads as per the manufacturer’s instructions. Images were obtained using a Zeiss microscope with Metafer software. A minimum of 50 cells were scored to quantify HER2 and chromosome 17 positive foci.
Chromatin immunoprecipitation assay (ChIP).
Gene specific induction of DNA damage at the triplex site was evaluated using ChIP assays as previously described with some modifications 27. Briefly, BT474 cells (1.5×10⁶ cells) were transfected with MIX24 or HER2–205, and cells were collected 8h post-transfection. Cell lysis was performed using SimpleChIP® Enzymatic Cell Lysis Buffers (Cell Signaling Technology) as per manufacturer’s instructions. To obtain chromatin fragments ranging from 200–1000bp nuclear pellets were incubated with micrococcal nuclease (0.25 µL) at 37 °C on a rotary shaker (600 rpm for 20 min). Digestion reactions were inhibited with EDTA (20 µL, 0.5M) and one min incubation on ice. ChIP was performed using γH2AX antibody (SantaCruz Biotech). Samples were then sonicated with Qsonica sonicator for 9 min set at 30 sec on/ 30 sec off cycles at 100% amplitude. After decrosslinking samples were purified using QIAquick PCR purification columns (Qiagen). The primers utilized in these studies for the HER2 coding region: forward primer: 5’ GAC AGT CGA GAC GCT CAG G - 3’ and reverse primer: 5’ GGA AAG CGC CAG TCT CTT GG - 3’. HER2 intron 2 primers are: forward primer: 5’ GCC TTGTAG CTA AGG ATC ACC- 3’ and reverse primer: 5’ CAA CCC CCA GGA CGA AAA AAG- 3’. qPCR was performed on samples using SYBR mastermix, 5 nM each of forward and reverse primers, 5 μL of ChIP or input DNA and amplified using a the Stepone plus quantitative PCR machine (Applied Biosystems). To analyze induction of non-specific DNA damage, SimpleChIP Human GAPDH Exon 1primers (Cell Signaling Technology) were utilized. Fold change was calculated using the ∆∆CT method. The relative enrichment was determined via normalization of CT values against input followed by normalization to the untreated samples.
Transcription Inhibition Assay.
To determine the role of transcription on TFO induced DNA damage, BT474 cells (400,000 cells) were pretreated for 20h with the transcription inhibitor, α-amanitin (10 μg/μL) prior to transfection with TFOs. Following pre-treatment, the media was removed and cells were washed with PBS after which TFO treatment was performed as described above. Cells were collected 8h after treatment and lysates were analyzed by western blot of cleaved caspase 3 and γH2AX.
Nanoparticle Delivery System.
Dye-loaded NPs were synthesized using a single-emulsion technique as previously described 26,28. For PLGA NPs, 50 mg of polymer was dissolved in 1 mL of dichloromethane (DCM, J.T. Baker) overnight. DiD (Biotium) was added to the polymer solution at 0.5% wt:wt, DiD:PLGA. The polymer-dye solution was then added dropwise to a 5% solution of poly(vinyl alcohol) (PVA) and sonicated on ice using a probe sonicator for three, 10 second cycles, at 38% amplitude (Tekmar Company). The emulsion was then added to a stirring solution of 0.3% PVA for 3 hours. Dried NPs were stored at −20 °C until use. PLA-HPG DiD loaded particles were generated using the method described below.
Poly(lactic acid)-hyperbranched polyglycerol (PLA-HPG) polymer was synthesized and characterized as previously described 26,29. Nanoparticles (NPs) were synthesized as previously described using a double-emulsion solvent evaporation technique 26. Briefly, 50 mg of PLA-HPG polymer was dissolved in a mixture of 2.4 mL ethyl acetate (EtOAc, Sigma-Aldrich) and 0.6 mL of dimethyl sulfoxide (DMSO, J.T. Baker) overnight. Oligonucleotides (100nmol, MIX24, HER2–205 or HER2–5922) in 100 μl of diH2O were added drop-wise to the polymer solution under vortex. The water-in-oil mixture was immediately sonicated using a probe sonicator for three, 10 second cycles, at 38% amplitude (Tekmar Company). Following sonication, the first emulsion was added dropwise to 4 mL of diH2O under vortex. The second emulsion was sonicated as above and diluted into 20 mL of diH2O and placed on a rotary evaporator at room temperature to remove EtOAc. NPs were subsequently collected via centrifugation at 4,000 g for 30 min at 4°C using a 100 kDa MWCO centrifugal filter (Amicon® Ultra-15, MilliporeSigma) and washed twice with 15 ml of diH2O. Nanoparticle aliquots (2mg) were prepared and stored at −80°C until used.
The nanoparticles were characterized according to their surface charge, size and loading capacity. NP hydrodynamic size by dynamic light scatter and zeta potential were measured in water at room temperature using the Zetasizer Nano-ZS by Malvern according to manufacturer protocols (n=3). For loading analysis, 2 mg of NPs (n=3) were dissolved in DMSO and analyzed for total nucleic acid content using the Quant-iT™ OliGreen™ ssDNA Assay Kit (ThermoFisher Scientific) according to manufacturer protocols.
Nanoparticle Biodistribution Studies.
PLA-HPG nanoparticles loaded with either DiD or TAMRA-HER2–205 were thawed on ice and resuspended in PBS (2mg NP/200μl) by vortex. In studies designed to evaluate NP formulations for their tumor uptake efficiency, a single dose of DiD loaded particles were administered via retro-orbital (RO) injection. TAMRA-HER2–205 encapsulated PLA-HPG NPs were utilized in the TFO biodistribution studies (4 tumors per treatment group/time point), with systemic administration of a single dose via RO injection. Mice were euthanized by CO2 exposure and tumors and organs including the lungs, heart, liver, kidney and spleen, were harvested 12 and 24h following treatment. Tumors and organ tissues were processed as paraformaldehyde fixed frozen sections (6 μM). Nuclear staining was achieved with a DAPI solution (1:250 dilution in PBS).
Tumor Immunofluorescence.
Prior to processing, frozen sections were dried in the dark for 15 min. Slides were then washed three times with PBS, followed by 10 min incubation with permeabilization solution containing 0.3% triton X-100 and 30% sucrose. Following two PBS washes, tissue sections were blocked with 500 μL of blocking solution (10% normal goat serum) in a humidification chamber for 1h at room temperature. Following blocking, tissue sections were incubated overnight at 4 °C with 350 μL of primary antibody diluted in blocking solution. Tissue sections were washed with PBS and incubated with secondary antibody for 1h at room temperature. The following primary and secondary antibodies were used: mouse Alexa Fluor 647 anti-γH2A.X (pS139) (1:100; #560447; BD Bioscience, Franklin Lakes, NJ, USA), rabbit anti- HER2 (1:250; #4290; Cell Signaling Tech., Danvers, MA, USA), anti-rabbit Alexa Fluor Plus 488 and anti-rabbit Alexa Fluor Plus 647 (1:400 each, #A32731 and #A21244 respectively; Thermo Fisher Scientific, Waltham, MA, USA). Some samples were additionally stained for F-actin filaments (cytoplasmic marker) using fluorescein isothiocyanate labeled phalloidin (100nM; #P5282; Burlington, MA, USA). Nuclear staining was achieved with a DAPI solution (1:250 dilution in PBS). Subsequently, samples were washed three times with PBS, slides were mounted with glass coverslips using DAKO fluorescence Mounting Medium.
Microscopy Imaging and Quantification.
Images were obtained with a Nikon Eclipse Ti fluorescence microscope with a Plan Apo 60X/1.40 Oil DIC h objective, a CSU-W1 confocal scanning unit with an iXon Ultra camera (Andor Technology, Belfast, UK), MLC 400B laser unit (Agilent Technologies, Santa Clara, CA, USA), and NIS Elements 4.30 software (Nikon Corporation, Tokyo, Japan). Magnification for all images was 600x. Images were taken with three fourth of the maximum intensity without overexposure. The pictures were saved as a 16-bit Tagged Image File Format (TIFF), with no further editing. Representative images were generated using ImageJ version 1.52t (NIH, Bethesda, MD, USA). Whole sample and nuclear nanoparticles foci, along with γH2AX, cleaved caspase 3 and HER2 expression were analyzed with the Focinator v2–31 software as previously described 30–32. Software, instructions and supporting information are provided at https://www.focinator.com. TFO biodistribution within a designated set of tissues is reported as the TAMRA-HER2–205 fluorescence intensity for each tissue as a percentage of the combined total TAMRA-HER2–205 fluorescence intensities detected in the spleen, kidney, liver and tumor. TAMRA fluorescence intensity was quantified for each tissue using the Focinator as a measure of HER2–205 uptake. The sum of these fluorescence intensities within each organ (liver, spleen, kidney and tumor) yielded the total fluorescence or HER2–205 uptake and was depicted through the pie charts. Each slice gives the relative percent HER2–205 uptake for each organ.
Statistical analysis.
Statistical analysis was performed by one-way or two-way ANOVA with the Tukey test as post hoc unless otherwise stated. All analysis was completed using GraphPad Prism software. ****p<0.0001, ***p<0.001, **p<0.01, *p<0.05.
Extended Data
Extended Data Figure 1.
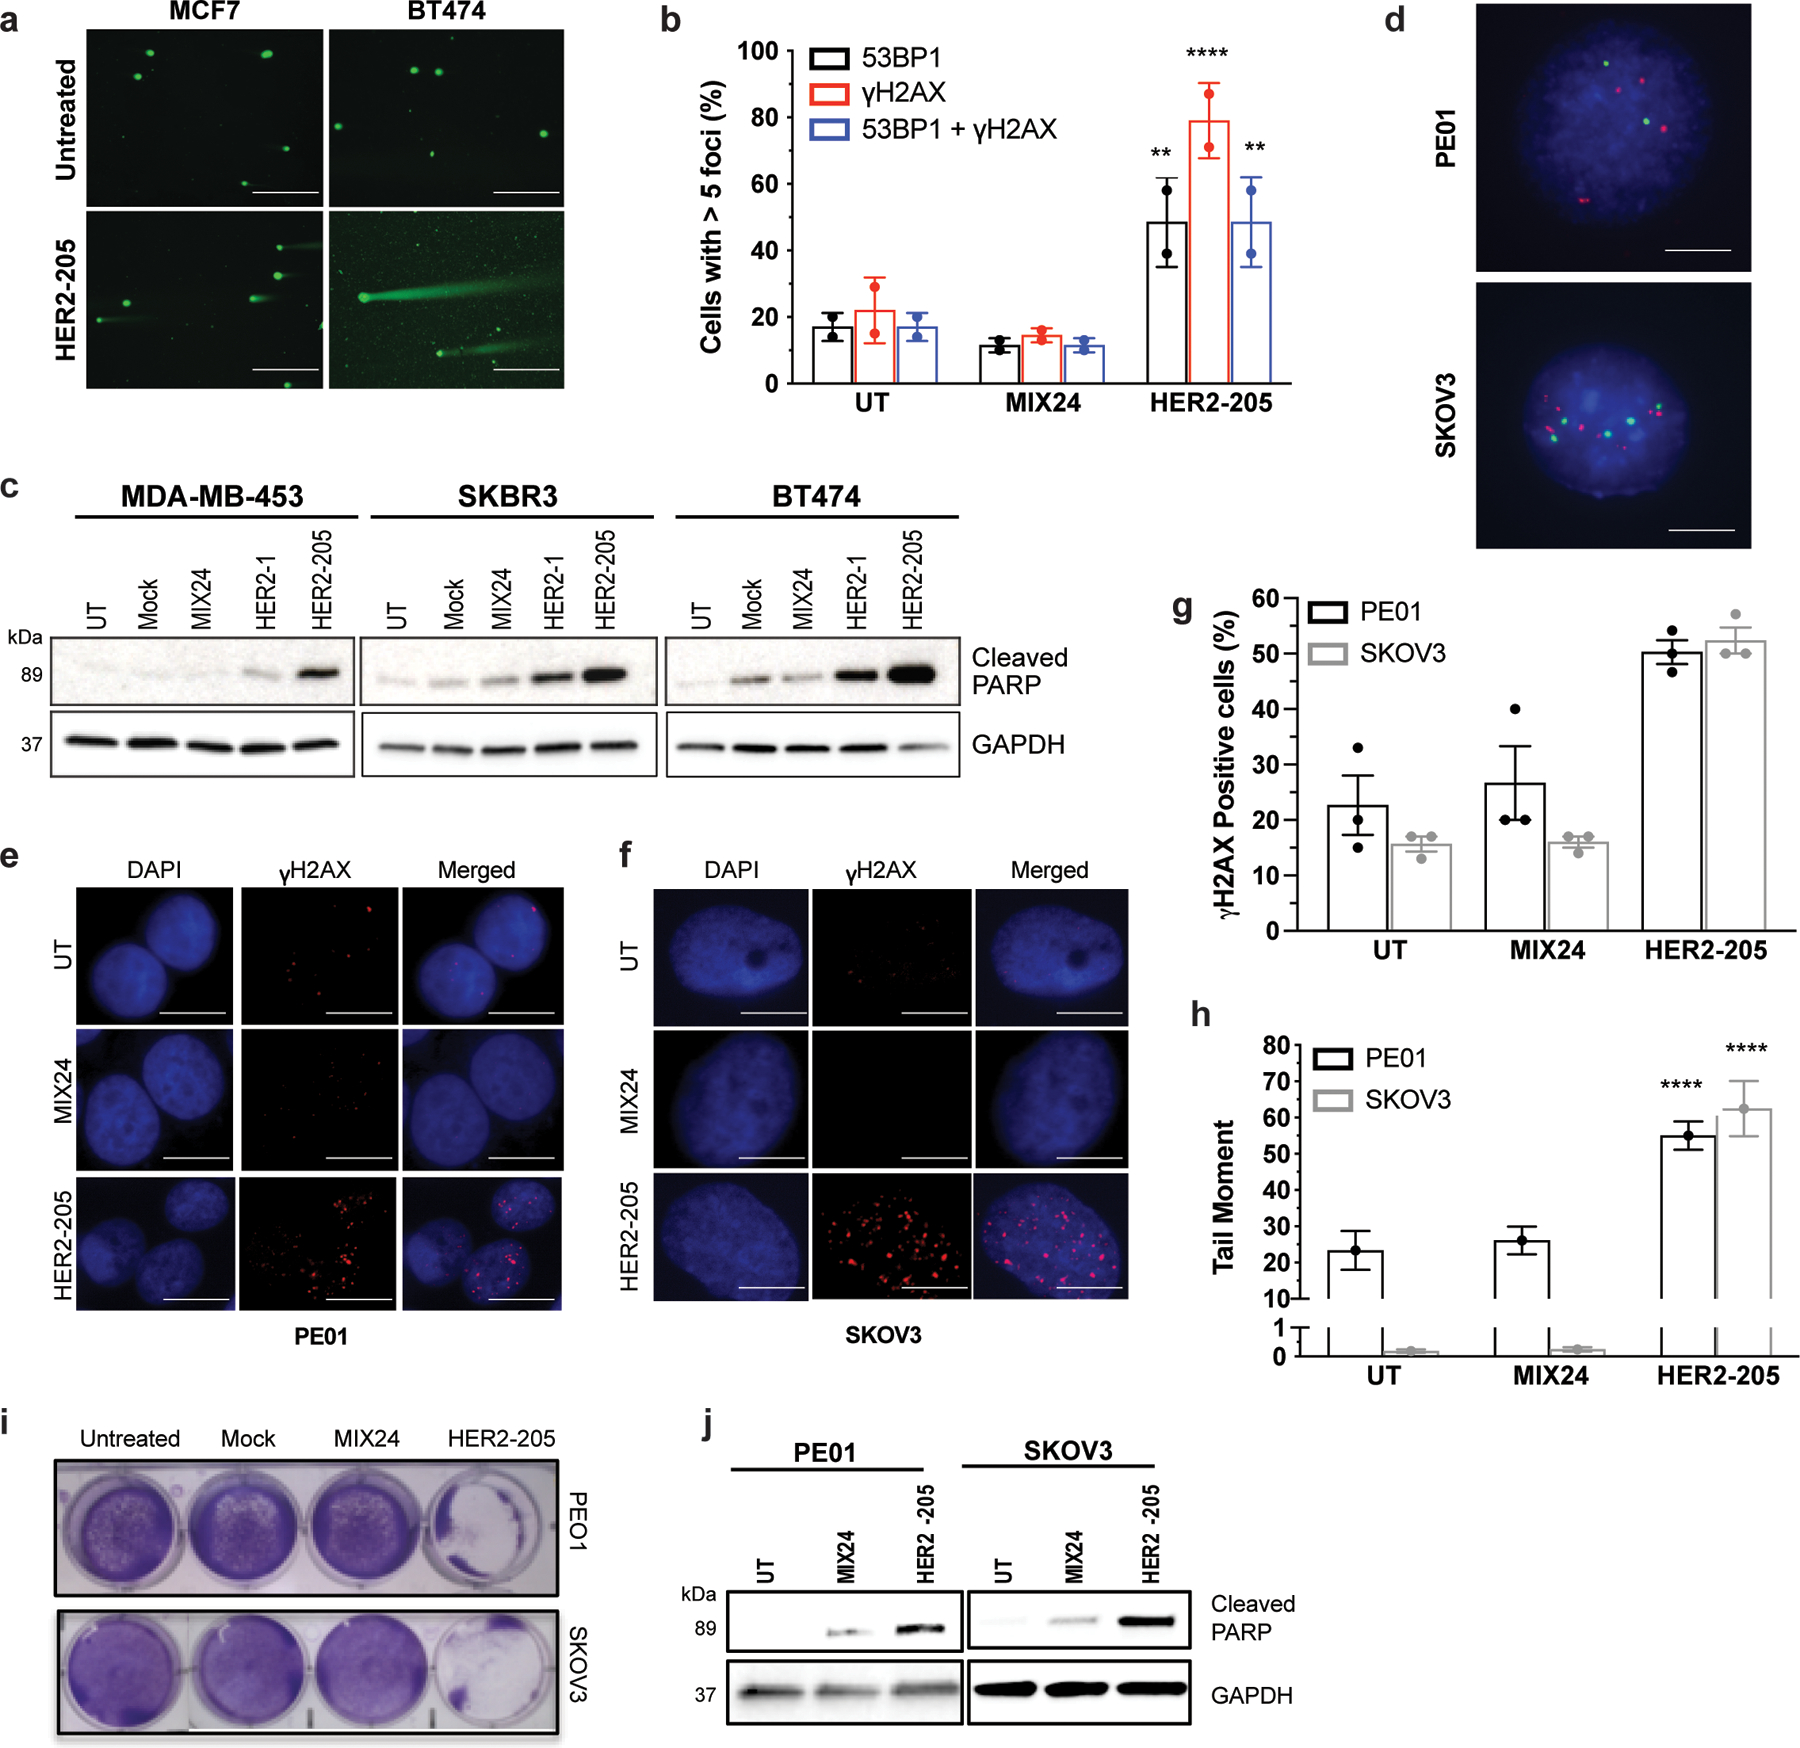
(a) Representative images of neutral comet assays performed 24h after HER2–205 treatment in MCF7 and BT474 cells (scale bars, 200μm). (b) Quantification of cells with greater than 5 γH2AX and/or 53BP1 foci per nuclei in BT474 cells treated with HER2–205 or MIX24 (mean ± SD; two-way ANOVA with Tukey test post-hoc; ****P<0.0001, **P<0.01; 50 cells per sample, n= 2 independent experiments). (c) Triplex formation induces apoptosis in HER2-positive breast cancer cell lines as measured by Western blot analysis of cleaved PARP (n= 3 independent experiments). (d) Detection of HER2 copies in interphase nuclei by dual color FISH with HER2 probe (red) and chromosome 17 probe (green), scale bars, 2.5 μm. (e) Immunofluorescence of γH2AX in PE01 ovarian cancer cells 24h post-treatment with HER2–205 or MIX24 (scale bars, 5 μm). (f) Representative immunofluorescence images of γH2AX foci in SKOV3 ovarian cancer cells 24h following treatment with HER2–205 or MIX24 (scale bars, 2.5 μm). (g) Frequency of PE01 and SKOV3 cells positive for γH2AX following 24h treatment (mean ± SD; two-way ANOVA with Tukey test post-hoc; ***P<0.001, **P<0.01; 50 cells per sample, n= 2 independent experiments). (h) Quantification of triplex-induced DNA double strand breaks using the neutral comet assay as measured by tail moment (mean ± SEM; two-way ANOVA with Tukey test post-hoc, ****P<0.0001; n= 150 comets). (i) Monolayer growth assay demonstrates a decrease in cell survival in PE01 and SKOV3 cells treated with HER2–205 72h after treatment. (j) Western blot analysis of activation of apoptosis as measured by cleaved PARP in ovarian cancer cells following TFO treatment (n=3 independent experiments).
Extended Data Figure 2.
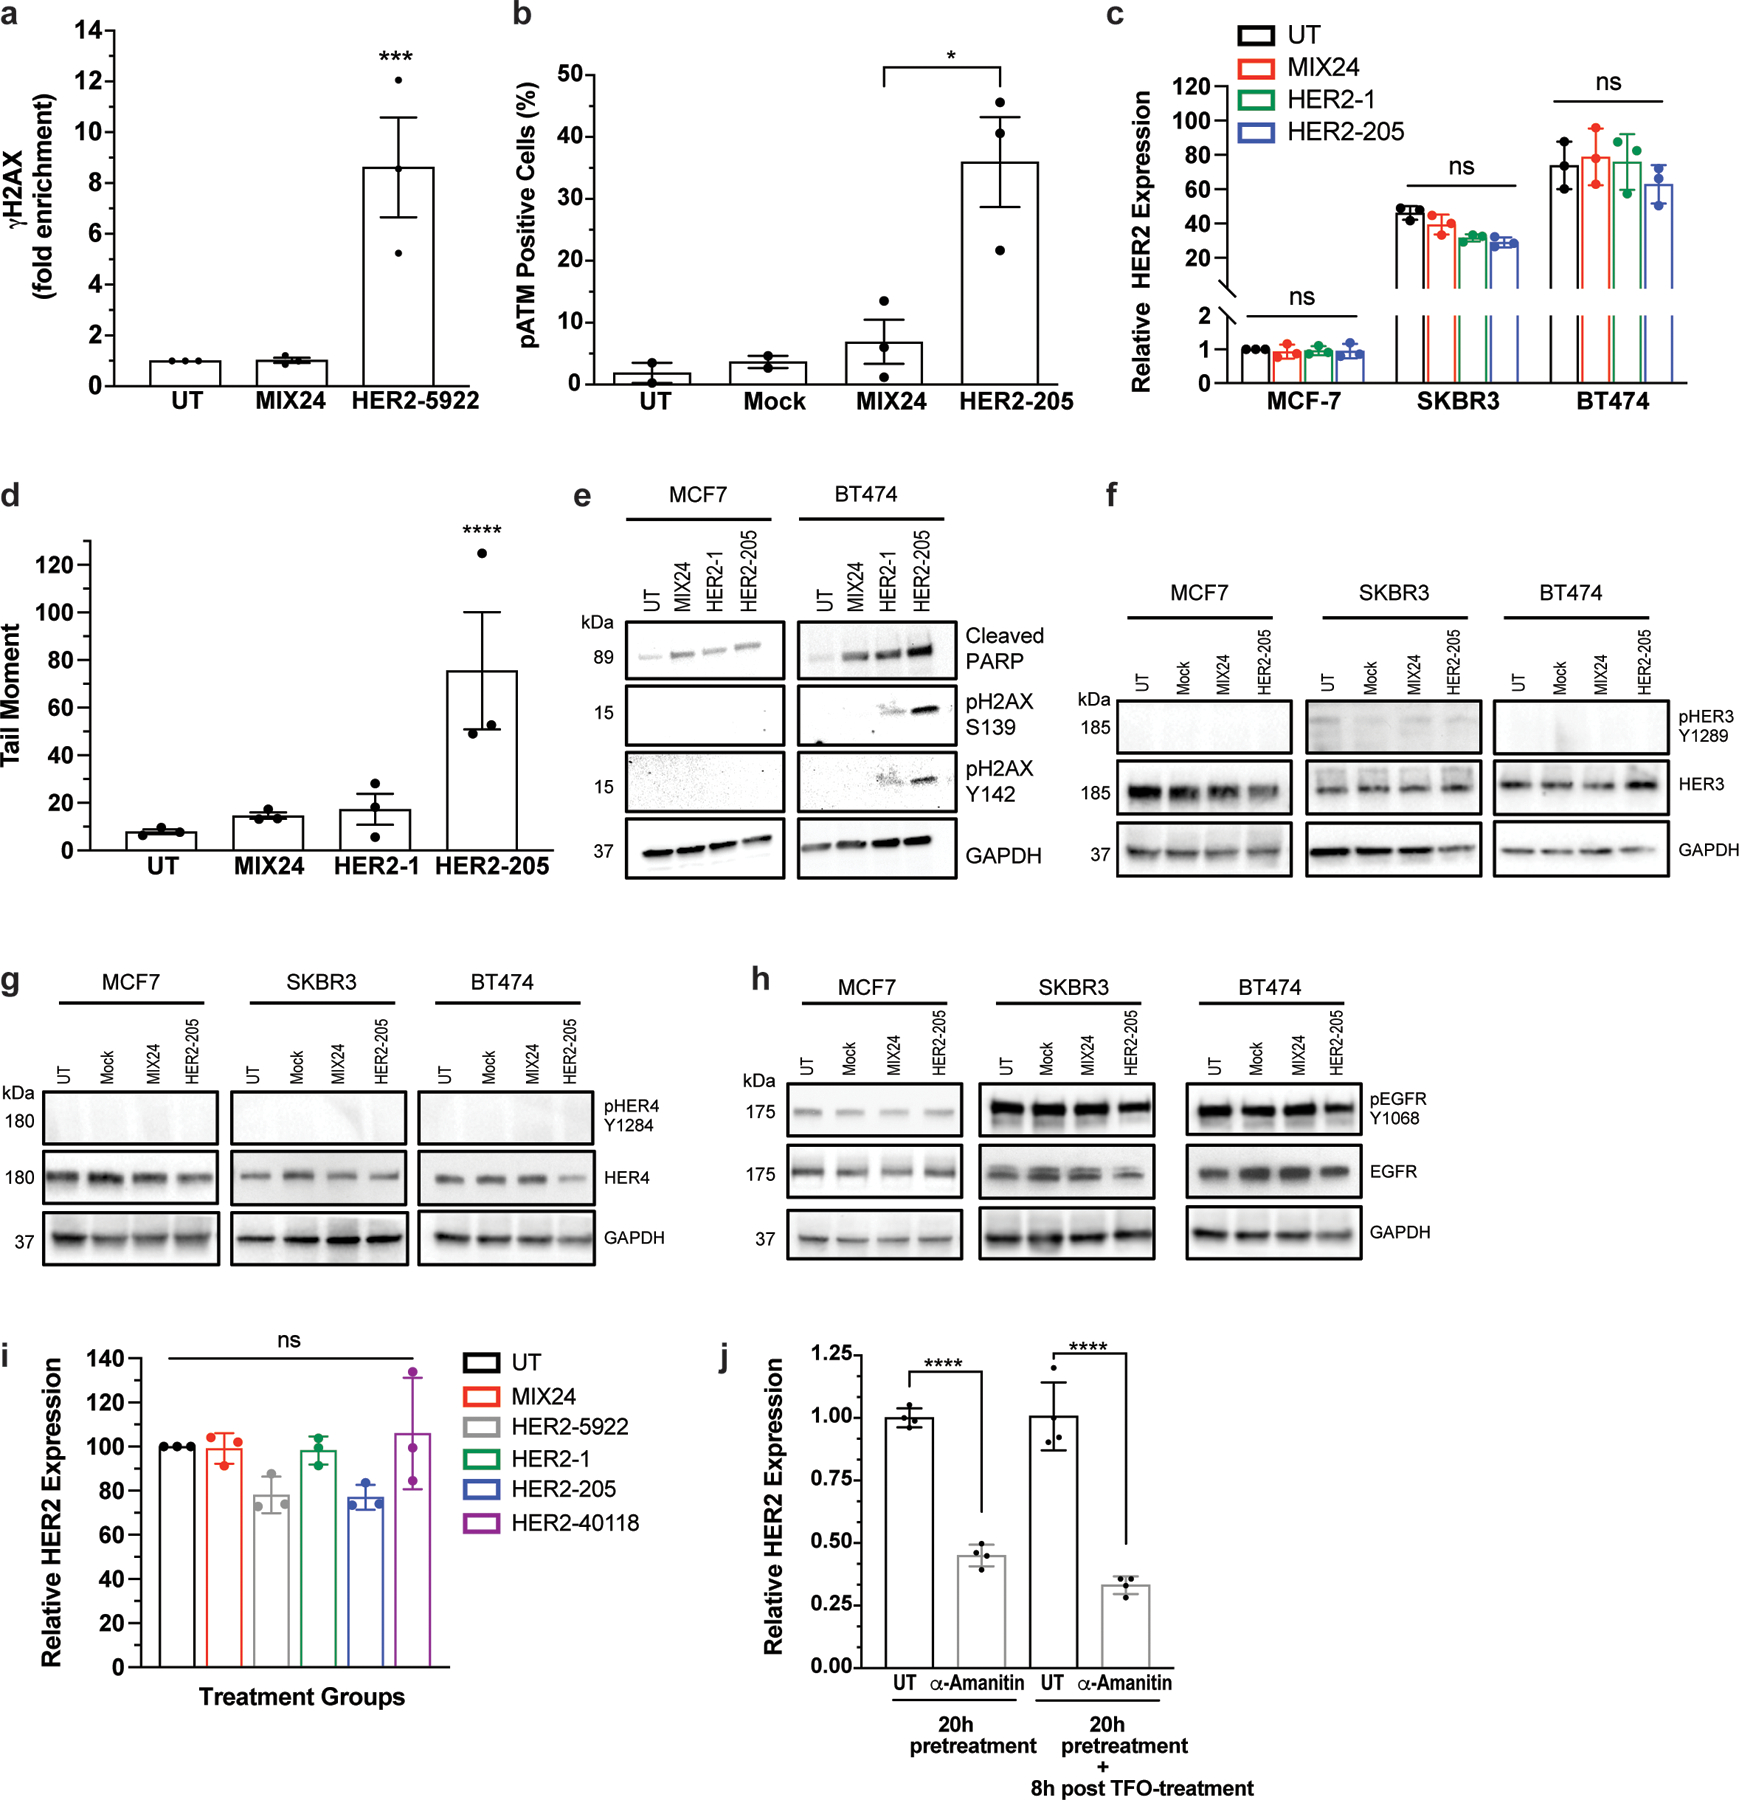
(a) ChIP analysis of γH2AX in BT474 cells detected increased DNA damage at the targeted HER2 gene following HER2–5922 treatment. Data are presented as mean ± SEM and analyzed by two-way ANOVA with Tukey test post-hoc, ***P<0.001, n= 3 independent experiments. (b) Quantification of phosphorylated ATM by flow cytometry following treatment with HER2–205. Data are presented as mean ± SEM and analyzed by one-way ANOVA with Tukey test post-hoc, *P<0.05, n= 3 independent experiments. (c) Analysis of HER2 gene expression by RT-PCR 12h post-treatment with HER2-targeted TFOs (mean ± SD; two-ANOVA with Tukey test post-hoc; ns, not significant; n= 3 independent experiments). (d) Quantification of triplex-induced DNA double strand breaks using the neutral comet assay as measured by tail moment 12h post TFO treatment (mean ± SEM; one-ANOVA with Tukey test post-hoc; ****P<0.0001; n= 3 independent experiments). (e) Western blot analysis of activation of apoptosis as measured by cleaved PARP and pH2AX Y142 12h following TFO treatment (representative immunoblots, n= 2 independent experiments). Western blot analysis of the phosphorylation status of HER family receptors (f) HER3, (g) HER4, and (h) EGFR (HER1) in multiple breast cancer cell lines following HER2–205 treatment (representative immunoblots, n=2). (i) Analysis of HER2 gene expression by RT-PCR 12h post-treatment with HER2-targeted TFOs (mean ± SEM; one-way ANOVA with Tukey test post-hoc; ns, not significant; n= 3 independent experiments). (j) Analysis of HER2 gene expression by RT-PCR 20h following pretreatment with the transcription inhibitor, α-amanitin (mean ± SD; one-way ANOVA with Tukey test post-hoc; ****P<0.0001; n= 4 experiments).
Extended Data Figure 3.
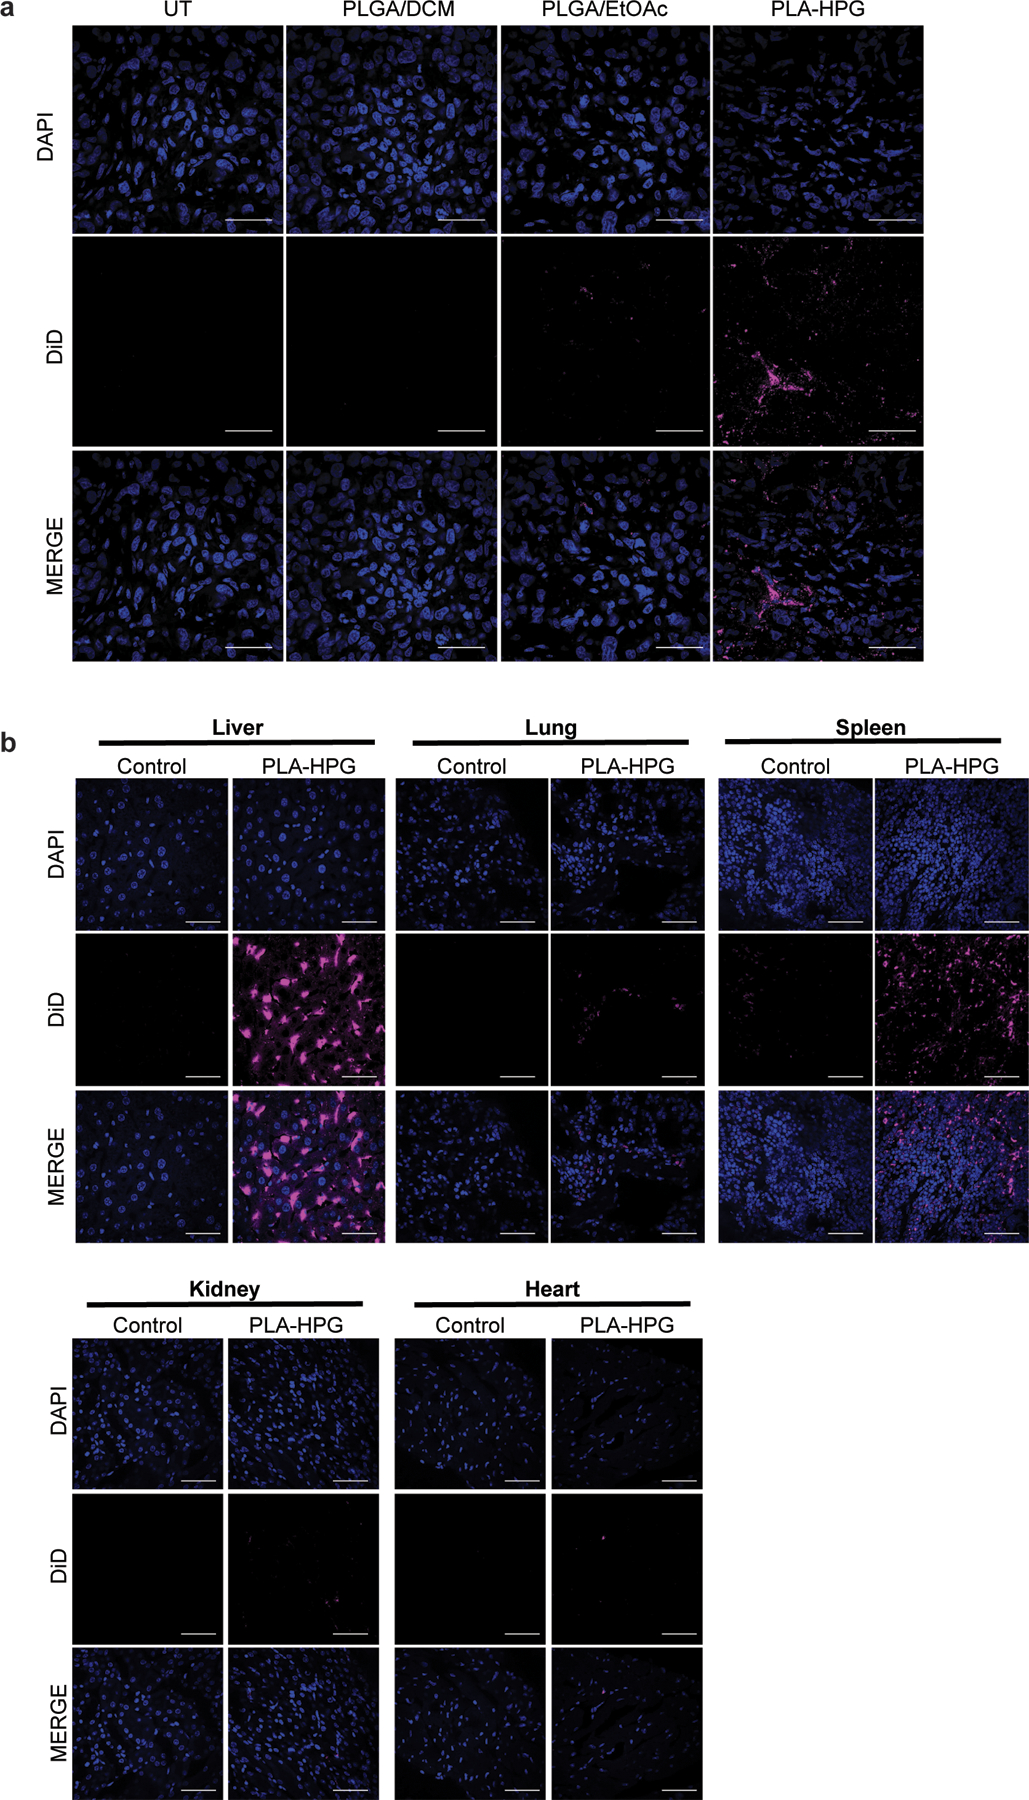
Comparison of PLGA and PLA-HPG NPs in vivo. (a) Uptake of DiD-loaded NPs, PLGA/DCM, PLGA/EtOAc and PLA-HPG, 12h after systemic administration via retro-orbital injection. Tumor cryosections visualize DAPI (blue) and DiD (red) (scale bars, 50 μm; n=2 tumors). (b) Biodistribution of DiD-loaded PLA-HPG NPs 12h after systemic administration. DiD fluorescence in isolated organs after retro-orbital injection with DiD encapsulated NPs (2mg). Cryosections visualize DAPI (blue) and DiD (red) (scale bars, 50 μm; n= 2 animals).
Extended Data Figure 4.
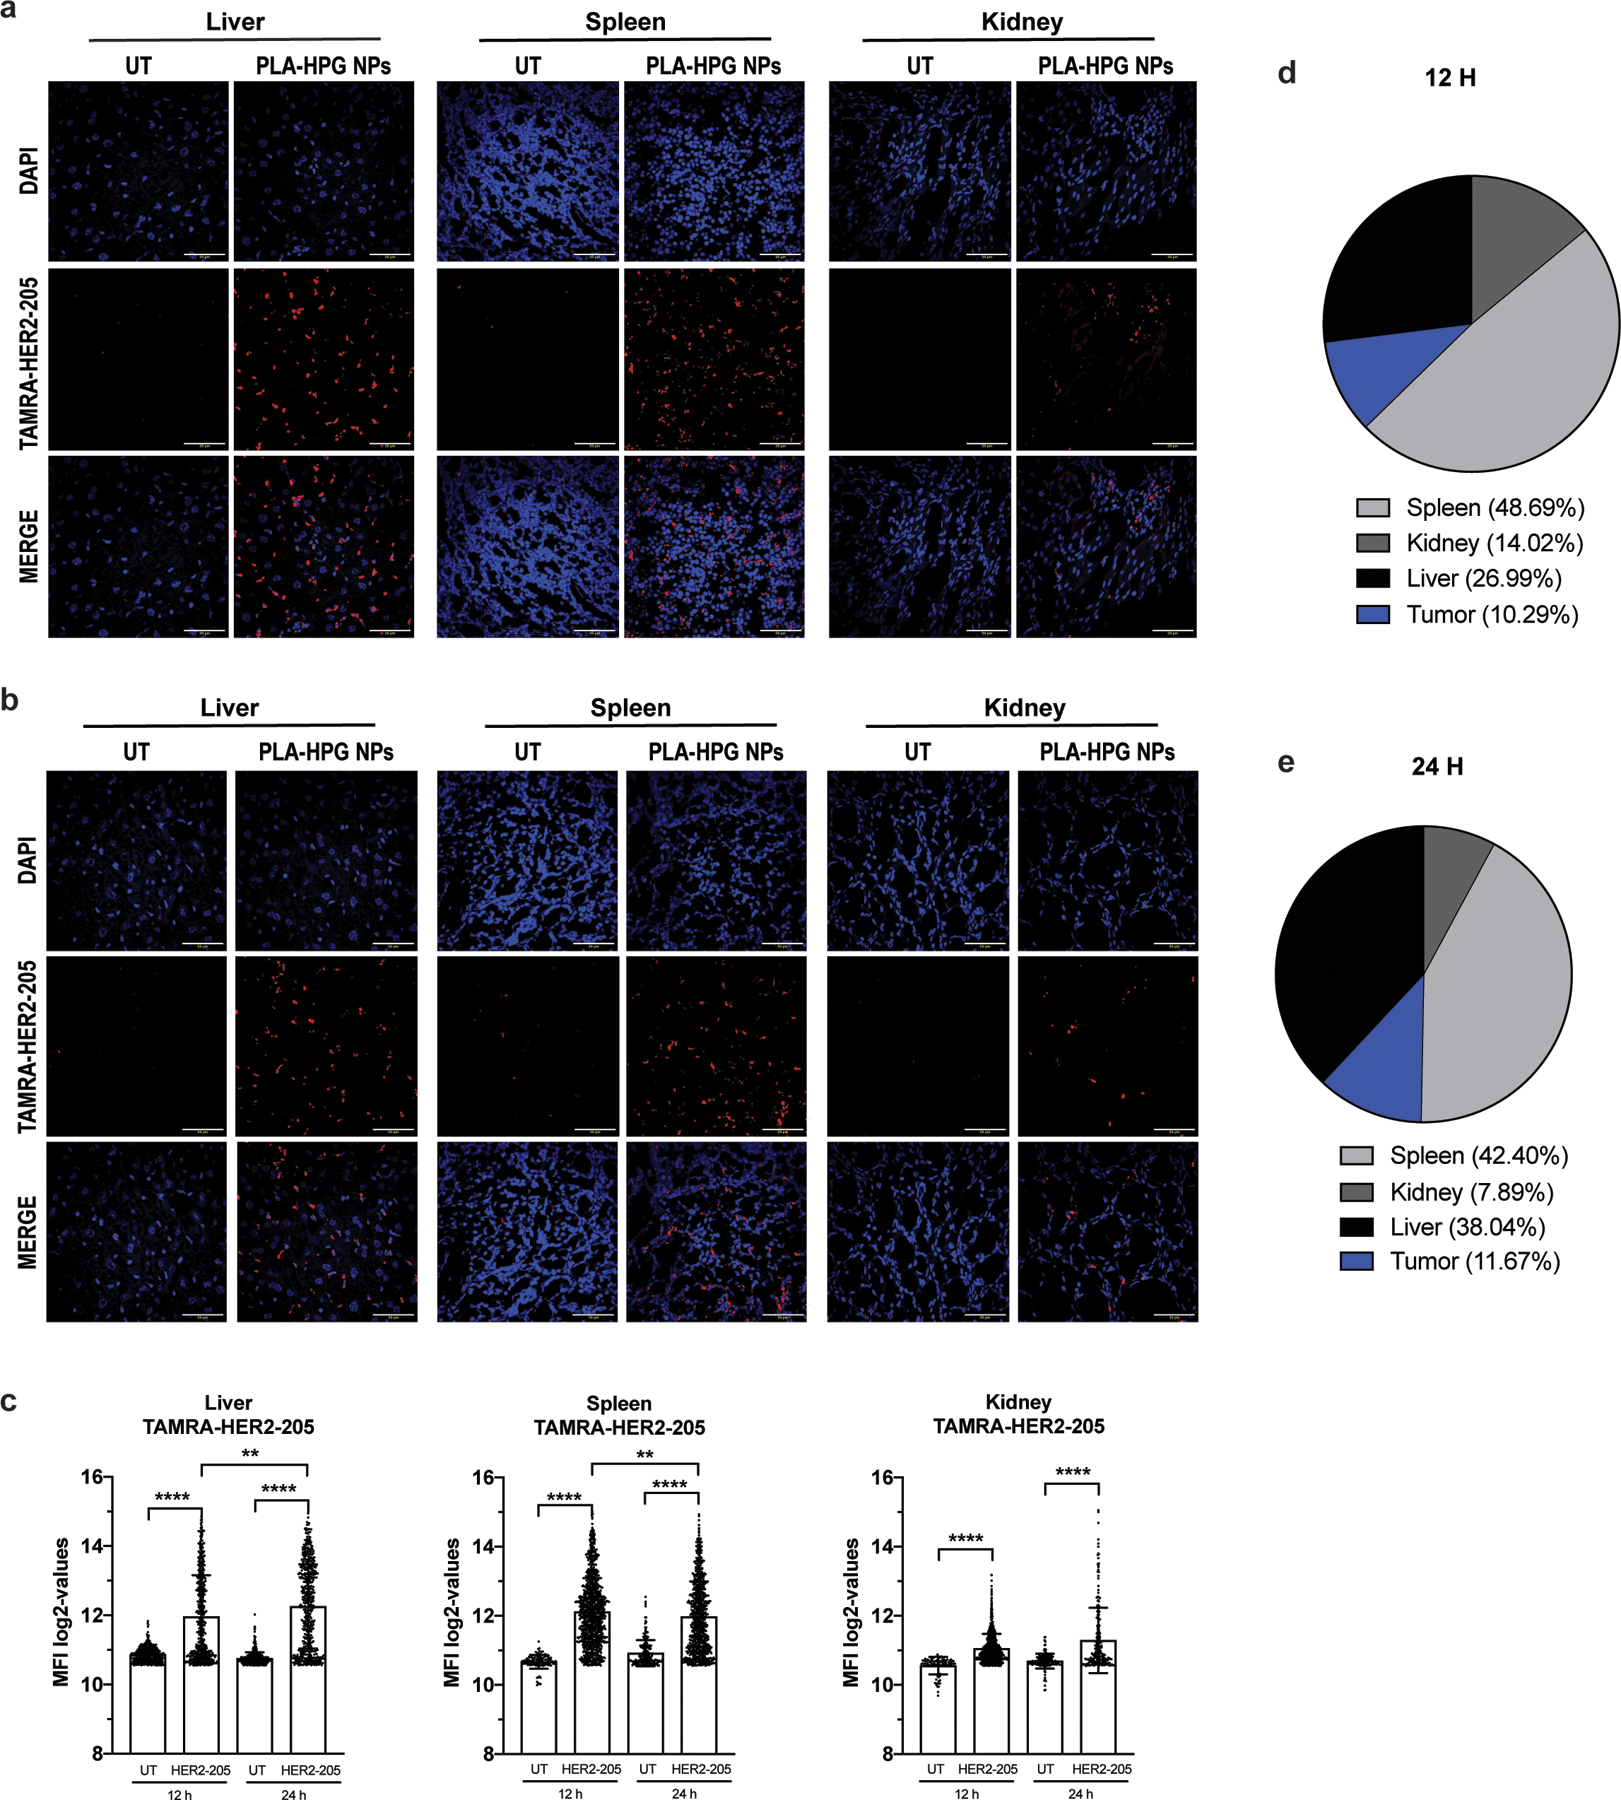
Biodistribution of TAMRA-HER2–205 encapsulated PLA-HPG nanoparticles (NPs). (a) Representative confocal images of tissue sections 12 hours post intravenous administration via retro-orbital injection of a 2mg dose of NPs (scale bars, 50 μm). (b) Representative confocal images of TAMRA-HER2–205 biodistribution in tissues 24 hours post treatment (scale bars, 50 μm). (c) TAMRA fluorescence was quantified at both 12 and 24 hours after dosing (2mg of NPs) and TFO uptake in each tissue is reported as mean fluorescence intensity (MFI) (mean ± SEM, n= 2 mice). Statistical significance was calculated by one-way ANOVA and Kruskal-Wallis test (****P<0.0001, **P<0.01). (d) Analysis of TAMRA-HER2–205 biodistribution 12 h post treatment. Fluorescence intensity observed in each tissue is reported as a percentage of the combined total fluorescence intensity detected in spleen, kidney, liver and tumor (tumor data is shown and quantified in Fig. 6a, b). Total area of the pie chart denotes the sum of the absolute fluorescence within the four organs, representing the total TFO uptake by these organs, and each slice gives the relative HER2–205 uptake for each organ. (e) Analysis of TAMRA-HER2–205 biodistribution 24 h post systemic administration. Fluorescence intensity observed in each tissue is reported as a percentage of the combined total fluorescence intensity detected in spleen, kidney, liver and tumor (tumor data is shown and quantified in Fig. 6a, b). Total area of the pie chart denotes the sum of the absolute fluorescence within the four organs, representing the total TFO uptake by these organs, and each slice gives the relative HER2–205 uptake for each organ.
Extended Data Figure 5.
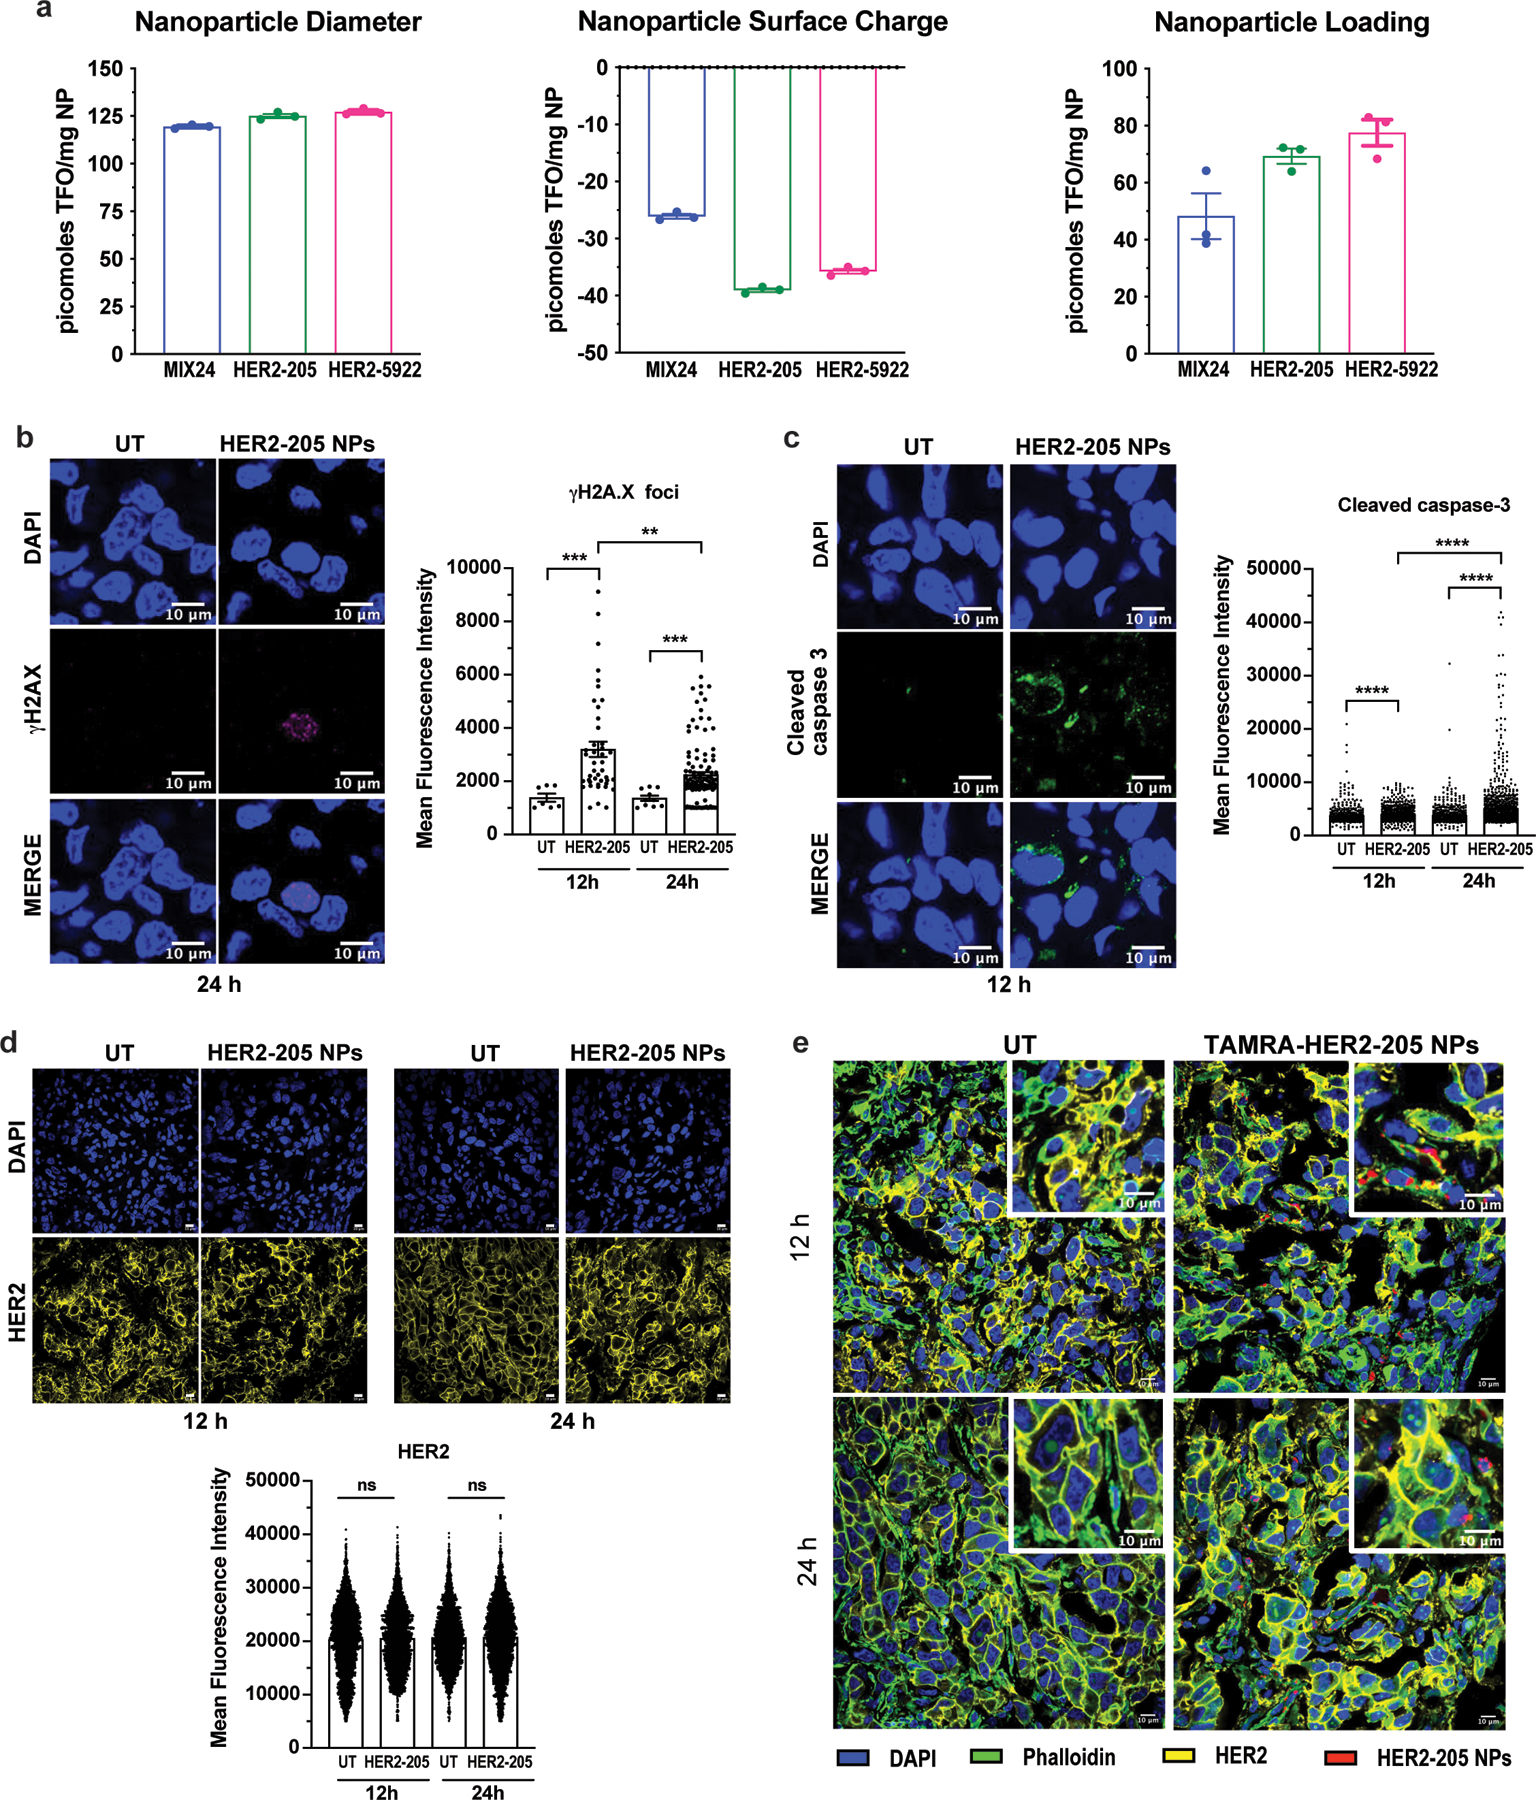
(a) Nanoparticle Characterization. Nanoparticle diameter as measured by dynamic light scattering. Nanoparticle surface charge measured by zeta potential. Nanoparticle loading of TFOs measured by extraction and analysis. All data is plotted as mean ± SEM, n=3 experiments. (b) Representative images of confocal microscopy of γH2AX immunofluorescence in tumors 24h post-treatment with HER2–205 PLA-HPG NPs and quantification of γH2AX foci is reported as mean fluorescence intensity (MFI) (mean ± SEM; Kolmogorov-Smirnov test; ***P<0.001, **P<0.01; n=4 tumors/timepoint; scale bars, 10μm). (c) Representative images of confocal microscopy of cleaved caspase 3 immunofluorescence in tumors 12h post-treatment with HER2–205 PLA-HPG NPs and quantification of activated caspase 3 is reported as mean fluorescence intensity (mean ± SEM; Kolmogorov-Smirnov test; ****P<0.0001; n=4 tumors/timepoint; scale bars, 10μm). (d) HER2 immunofluorescence analysis of BT474 tumor sections from mice 12h and 24h after treatment with a single dose of HER2–205 PLA-HPG NPs (2 mg). Data represented as mean ± SEM and analyzed by one-way ANOVA Kruskal-Wallis test (n= 4 tumors/time point; ns, not significant). Scale bar, 10μm. (e) Confocal microscopy images of tumor sections analyzed by immunofluorescence 12h and 24h following a single dose of TAMRA-HER2–205 PLA-HPG NPs (scale bars, 10μm).
Extended Data Figure 6.
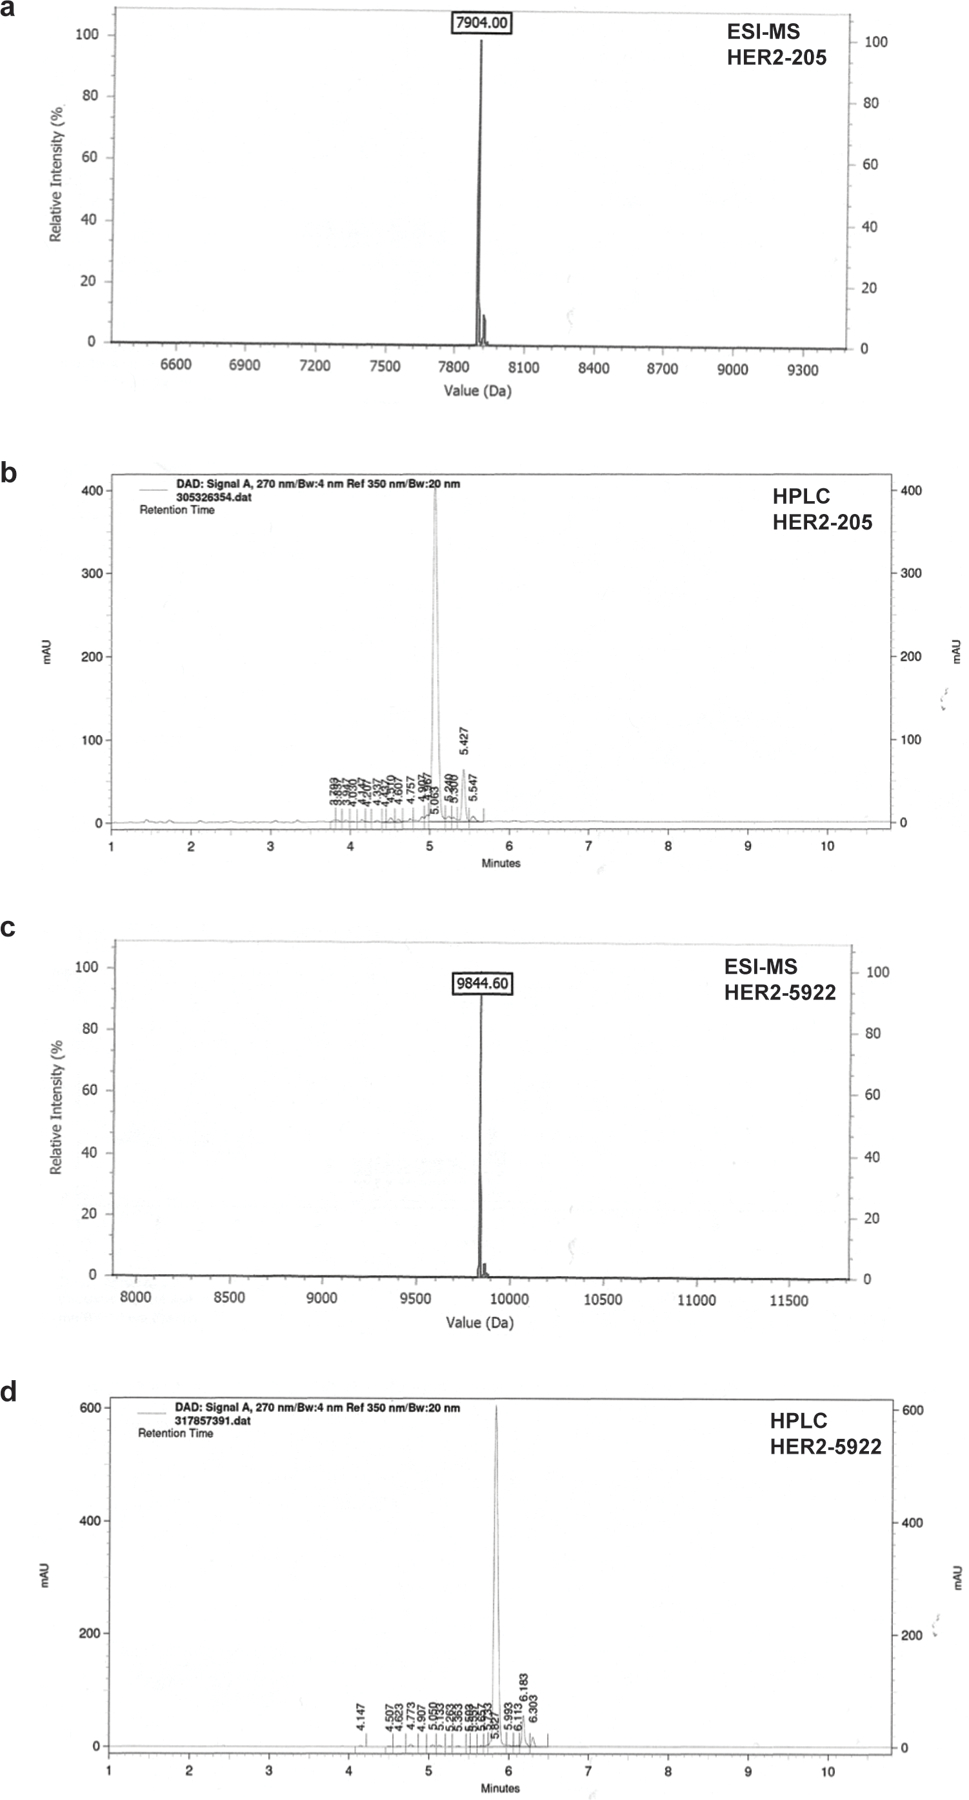
(a) Analytical ESI-MS spectrum of HER2–205. (b) Analytical reverse-phased HPLC of HER2–205. (c) Analytical ESI-MS spectrum of HER2–5922. (d) Analytical reverse-phased HPLC of HER2–5922.
Extended Data Figure 7.
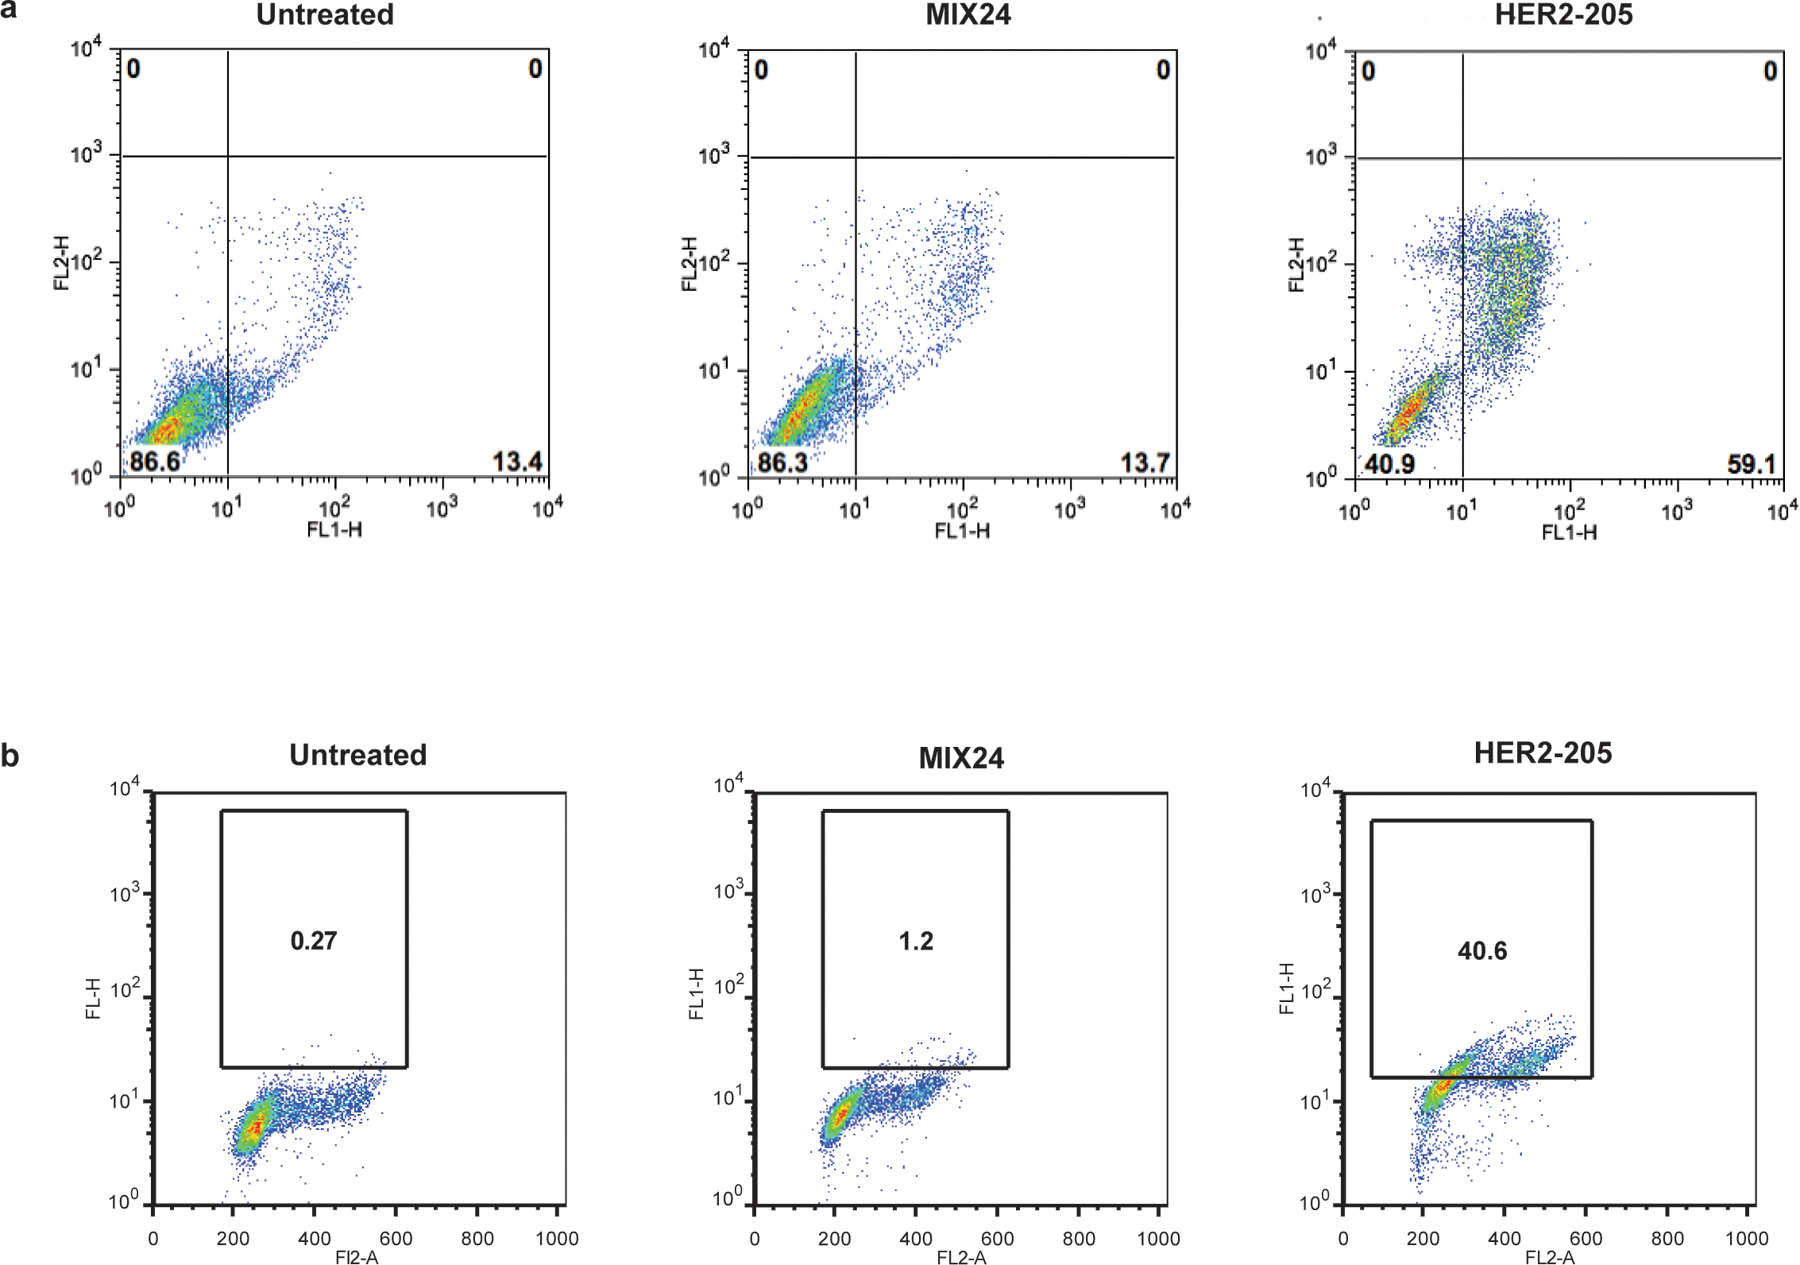
A single cell homogeneous population was utilized for FCS/SSC gating of the starting cell population. (a) Flow cytometry profiles of BT474 cells stained for Annexin V-FITC/PI to measure apoptotic cells. Cells were harvested 24h after treatment. Lower right quadrant represents the combined percentage of early and late apoptotic cells. (b) Flow cytometry profiles of BT474 cells stained for pATM. Cells were harvested 24h after treatment. The box indicates the gate for high levels of pATM and numbers represent percentage of cells with high levels of pATM.
Supplementary Material
Acknowledgements.
This work was supported by grants from the National Cancer Institute (NCI) of the National Institutes of Health (NIH) R21CA185192 to F.A.R., the Breast Cancer Alliance Exceptional Project Grant to F.A.R., National Institute of General Medical Sciences R01GM126211 to F.A.R., and NIH R01-CA149128 to W.M.S. E.Q. was supported by training grants T32GM07205 and 5T32GM007223–43.
Footnotes
Competing Interests. Yale University has filed patent applications related to this work (inventor F.A.R.).
Data Availability Statement.
The authors declare that data supporting the findings of this study are available within the paper and its supplementary information files.
REFERENCES
- 1.Chen Y. et al. Identification of druggable cancer driver genes amplified across TCGA datasets. PloS one 9, e98293, doi: 10.1371/journal.pone.0098293 (2014). [DOI] [PMC free article] [PubMed] [Google Scholar]
- 2.Matsui A, Ihara T, Suda H, Mikami H & Semba K Gene amplification: mechanisms and involvement in cancer. Biomol Concepts 4, 567–582, doi: 10.1515/bmc-2013-0026 (2013). [DOI] [PubMed] [Google Scholar]
- 3.Santarius T, Shipley J, Brewer D, Stratton MR & Cooper CS A census of amplified and overexpressed human cancer genes. Nat Rev Cancer 10, 59–64, doi: 10.1038/nrc2771 (2010). [DOI] [PubMed] [Google Scholar]
- 4.Albertson DG Gene amplification in cancer. Trends Genet 22, 447–455, doi: 10.1016/j.tig.2006.06.007 (2006). [DOI] [PubMed] [Google Scholar]
- 5.Ohshima K. et al. Integrated analysis of gene expression and copy number identified potential cancer driver genes with amplification-dependent overexpression in 1,454 solid tumors. Sci Rep 7, 641, doi: 10.1038/s41598-017-00219-3 (2017). [DOI] [PMC free article] [PubMed] [Google Scholar]
- 6.Moasser MM & Krop IE The Evolving Landscape of HER2 Targeting in Breast Cancer. JAMA Oncol 1, 1154–1161, doi: 10.1001/jamaoncol.2015.2286 (2015). [DOI] [PubMed] [Google Scholar]
- 7.Slamon DJ et al. Studies of the HER-2/neu proto-oncogene in human breast and ovarian cancer. Science (New York, N.Y 244, 707–712 (1989). [DOI] [PubMed] [Google Scholar]
- 8.Baselga J, Albanell J, Molina MA & Arribas J Mechanism of action of trastuzumab and scientific update. Seminars in oncology 28, 4–11 (2001). [DOI] [PubMed] [Google Scholar]
- 9.Swain SM et al. Pertuzumab, trastuzumab, and docetaxel in HER2-positive metastatic breast cancer. The New England journal of medicine 372, 724–734, doi: 10.1056/NEJMoa1413513 (2015). [DOI] [PMC free article] [PubMed] [Google Scholar]
- 10.Wilks ST Potential of overcoming resistance to HER2-targeted therapies through the PI3K/Akt/mTOR pathway. Breast 24, 548–555, doi: 10.1016/j.breast.2015.06.002 (2015). [DOI] [PubMed] [Google Scholar]
- 11.Petty RD et al. Gefitinib and EGFR Gene Copy Number Aberrations in Esophageal Cancer. J Clin Oncol 35, 2279–2287, doi: 10.1200/JCO.2016.70.3934 (2017). [DOI] [PubMed] [Google Scholar]
- 12.Pao W. et al. Acquired resistance of lung adenocarcinomas to gefitinib or erlotinib is associated with a second mutation in the EGFR kinase domain. PLoS Med 2, e73, doi: 10.1371/journal.pmed.0020073 (2005). [DOI] [PMC free article] [PubMed] [Google Scholar]
- 13.Ricciardi AS, McNeer NA, Anandalingam KK, Saltzman WM & Glazer PM Targeted genome modification via triple helix formation. Methods Mol Biol 1176, 89–106, doi: 10.1007/978-1-4939-0992-6_8 (2014). [DOI] [PMC free article] [PubMed] [Google Scholar]
- 14.Gaddis SS et al. A web-based search engine for triplex-forming oligonucleotide target sequences. Oligonucleotides 16, 196–201 (2006). [DOI] [PubMed] [Google Scholar]
- 15.Ebbinghaus SW et al. Triplex formation inhibits HER-2/neu transcription in vitro. The Journal of clinical investigation 92, 2433–2439 (1993). [DOI] [PMC free article] [PubMed] [Google Scholar]
- 16.Kaushik Tiwari M & Rogers FA XPD-dependent activation of apoptosis in response to triplex-induced DNA damage. Nucleic acids research 41, 8979–8994, doi: 10.1093/nar/gkt670 (2013). [DOI] [PMC free article] [PubMed] [Google Scholar]
- 17.Kaushik Tiwari M, Adaku N, Peart N & Rogers FA Triplex structures induce DNA double strand breaks via replication fork collapse in NER deficient cells. Nucleic acids research 44, 7742–7754, doi: 10.1093/nar/gkw515 (2016). [DOI] [PMC free article] [PubMed] [Google Scholar]
- 18.Rogers FA, Vasquez KM, Egholm M & Glazer PM Site-directed recombination via bifunctional PNA-DNA conjugates. Proceedings of the National Academy of Sciences of the United States of America 99, 16695–16700 (2002). [DOI] [PMC free article] [PubMed] [Google Scholar]
- 19.Wang G, Seidman MM & Glazer PM Mutagenesis in mammalian cells induced by triple helix formation and transcription-coupled repair. Science (New York, N.Y 271, 802–805 (1996). [DOI] [PubMed] [Google Scholar]
- 20.Szollosi J, Balazs M, Feuerstein BG, Benz CC & Waldman FM ERBB-2 (HER2/neu) gene copy number, p185HER-2 overexpression, and intratumor heterogeneity in human breast cancer. Cancer research 55, 5400–5407 (1995). [PubMed] [Google Scholar]
- 21.Vergote I. et al. Neoadjuvant chemotherapy or primary surgery in stage IIIC or IV ovarian cancer. The New England journal of medicine 363, 943–953, doi: 10.1056/NEJMoa0908806 (2010). [DOI] [PubMed] [Google Scholar]
- 22.Jenjaroenpun P & Kuznetsov VA TTS mapping: integrative WEB tool for analysis of triplex formation target DNA sequences, G-quadruplets and non-protein coding regulatory DNA elements in the human genome. BMC Genomics 10 Suppl 3, S9, doi: 10.1186/1471-2164-10-S3-S9 (2009). [DOI] [PMC free article] [PubMed] [Google Scholar]
- 23.Cook PJ et al. Tyrosine dephosphorylation of H2AX modulates apoptosis and survival decisions. Nature 458, 591–596, doi: 10.1038/nature07849 (2009). [DOI] [PMC free article] [PubMed] [Google Scholar]
- 24.zum Buschenfelde CM, Hermann C, Schmidt B, Peschel C & Bernhard H Antihuman epidermal growth factor receptor 2 (HER2) monoclonal antibody trastuzumab enhances cytolytic activity of class I-restricted HER2-specific T lymphocytes against HER2-overexpressing tumor cells. Cancer research 62, 2244–2247 (2002). [PubMed] [Google Scholar]
- 25.Cuello M. et al. Down-regulation of the erbB-2 receptor by trastuzumab (herceptin) enhances tumor necrosis factor-related apoptosis-inducing ligand-mediated apoptosis in breast and ovarian cancer cell lines that overexpress erbB-2. Cancer research 61, 4892–4900 (2001). [PubMed] [Google Scholar]
- 26.Deng Y. et al. The effect of hyperbranched polyglycerol coatings on drug delivery using degradable polymer nanoparticles. Biomaterials 35, 6595–6602, doi: 10.1016/j.biomaterials.2014.04.038 (2014). [DOI] [PMC free article] [PubMed] [Google Scholar]
- 27.Bindra RS & Glazer PM Repression of RAD51 gene expression by E2F4/p130 complexes in hypoxia. Oncogene 26, 2048–2057, doi: 10.1038/sj.onc.1210001 (2007). [DOI] [PubMed] [Google Scholar]
- 28.Balashanmugam MV et al. Preparation and characterization of novel PBAE/PLGA polymer blend microparticles for DNA vaccine delivery. ScientificWorldJournal 2014, 385135, doi: 10.1155/2014/385135 (2014). [DOI] [PMC free article] [PubMed] [Google Scholar]
- 29.Seo YE et al. Nanoparticle-mediated intratumoral inhibition of miR-21 for improved survival in glioblastoma. Biomaterials 201, 87–98, doi: 10.1016/j.biomaterials.2019.02.016 (2019). [DOI] [PMC free article] [PubMed] [Google Scholar]
- 30.Oeck S. et al. The Focinator v2–0 - Graphical Interface, Four Channels, Colocalization Analysis and Cell Phase Identification. Radiat Res 188, 114–120, doi: 10.1667/RR14746.1 (2017). [DOI] [PubMed] [Google Scholar]
- 31.Oeck S, Malewicz NM, Hurst S, Rudner J & Jendrossek V The Focinator - a new open-source tool for high-throughput foci evaluation of DNA damage. Radiat Oncol 10, 163, doi: 10.1186/s13014-015-0453-1 (2015). [DOI] [PMC free article] [PubMed] [Google Scholar]
- 32.Mandl HK et al. Optimizing biodegradable nanoparticle size for tissue-specific delivery. Journal of controlled release : official journal of the Controlled Release Society 314, 92–101, doi: 10.1016/j.jconrel.2019.09.020 (2019). [DOI] [PMC free article] [PubMed] [Google Scholar]
Associated Data
This section collects any data citations, data availability statements, or supplementary materials included in this article.
Supplementary Materials
Data Availability Statement
The authors declare that data supporting the findings of this study are available within the paper and its supplementary information files.


