

Abstract
Cancer therapy often results in heterogeneous responses in different metastatic lesions in the same patient. Inter- and intra-tumor heterogeneity in signaling within various tumor compartments and its impact on therapy are not well characterized due to the limited sensitivity of single cell proteomic approaches. To overcome this barrier, we applied single cell mass cytometry with a customized 26-antibody panel to PTEN-deleted orthotopic prostate cancer xenograft models to measure the evolution of kinase activities in different tumor compartments during metastasis or drug treatment. Compared with primary tumors and circulating tumor cells (CTC), bone metastases but not lung and liver metastases exhibited elevated PI3K/mTOR signaling and overexpressed receptor tyrosine kinases (RTK) including c-Met protein. Suppression of c-MET impaired tumor growth in the bone. Intra-tumoral heterogeneity within tumor compartments also arose from highly proliferative EpCAM-high epithelial cells with increased PI3K and mTOR kinase activities co-existing with poorly proliferating EpCAM-low mesenchymal populations with reduced kinase activities; these findings were recapitulated in epithelial and mesenchymal CTC populations in metastatic prostate and breast cancer patients. Increased kinase activity in EpCAM-high cells rendered them more sensitive to PI3K/mTOR inhibition, and drug-resistant EpCAM-low populations with reduced kinase activity emerged over time. Taken together, single cell proteomics indicate that microenvironment- and cell state-dependent activation of kinase networks create heterogeneity and differential drug sensitivity among and within tumor populations across different sites, defining a new paradigm of drug responses to kinase inhibitors.
Keywords: Single cell proteomics, Mass Cytometry, EMT, Metastasis, PI3K/mTOR pathway, c-Met, circulating tumor cells
INTRODUCTION
Cancer cells initially confined to the primary site eventually disseminate through the blood and lymphatics to distant sites, including the bone, lung, liver, and brain. The spatially separated cancer cells in each metastatic site continue to evolve within the different microenvironments. This, together with selection pressures imposed by drug treatment, leads to cellular and molecular heterogeneity among tumor cells(1–3). Single cell RNA-sequencing of tumor cells and molecular analyses of circulating tumor DNA and circulating tumor cell (CTC) have been extensively used to interrogate these dynamic adaptations and to develop intervention and diagnostic tools(4,5). However, the poor sensitivity of current proteomic approaches has limited the mapping of signal transduction networks and post-transcriptional/translational events in single cells, creating a gap in our understanding of how the proteome evolves during cancer progression and therapeutic responses.
Heterogeneity of protein expression in tumors is often evaluated using antibody-based staining of a few targets and is confounded by the overlapping emission spectra of fluorophores(6). Mass cytometry, which can simultaneously evaluate up to 60 different epitopes(7), is one of the few methodologies currently available to query and quantify larger proteomic signaling networks in single cells and in limited amounts of tissue samples. Specially designed lanthanide-conjugated antibody panels against targets of interest have been used to collect quantitative multi-dimensional protein expression profiles to identify cellular lineages, proliferation, and signaling programs in the hematopoietic compartment(8) as well as in cancers of the endometrium(9), intestine(10), breast(11), pancreas(12) and lung(13). Single cell proteomics has also been applied to prostate cancer to primarily evaluate tumor cell diversity and the immune microenvironment(14,15). However, differences in kinase activities within the prostate tumors growing at different sites and across epithelial and mesenchymal tumor cell lineages have not yet been interrogated. Defining the differential activity of kinases within prostate tumor deposits growing at various sites using single cell proteomics could provide new insights into prostate cancer heterogeneity and how it contributes to varied responses to drugs targeting these signaling nodes.
In this manuscript, we use single cell proteomics on mouse models of prostate cancer to show that PI3K/mTOR signaling is differentially activated across different tumor deposits/metastatic sites, rendering them differentially sensitive to BEZ235, a dual inhibitor of PI3K/mTOR signaling. Further dissection of single cell proteomic data from the PC3 tumor grafts treated with BEZ235 revealed an additional layer of intra-tumor heterogeneity depending on the lineage of tumor cells: epithelial tumor cells (compared with mesenchymal tumor cells) harbored higher levels of PI3K/mTOR activity, which was confirmed in prostate and breast patient-derived cancer cells. These observations predict that epithelial tumor cell populations with elevated PI3K/mTOR signaling are naturally poised to better respond to drugs targeting these kinase activities, whereas mesenchymal populations with low kinase activity would be inherently resistant providing a hitherto unappreciated insight into the role of epithelial to mesenchymal transition (EMT) in drug resistance.
MATERIALS AND METHODS
Reagents
Details of antibodies used in mass cytometry experiments are listed in Supplementary Table 1. For experiments involving CE1–4 tumor cells, clones of EpCAM, c-Met and CK antibodies were exchanged with the following clones to detect mouse epitopes: EpCAM: G8.8 (BioLegend Cat# 118202, RRID:AB_1089027), c-Met: 1G7NB (Novus Biologicals Cat# NBP2–44306SS, RRID:AB_2895272), CK: AE1+AE3 (Novus Cat# NB 600–1322, RRID:AB_608509). Metal labeling kits were purchased from Fluidigm and used according to manufacturer’s instructions. Mass-tag barcoding reagents were purchased from Fluidigm and used with a modified protocol detailed below. BEZ235 and GDC0941 were purchased from Selleck Chemical, and stock solutions were prepared fresh by dissolving in DMSO at 1 μM concentration. Osmium tetroxide (>99%) was purchased from ACROS Organics. AbC™ Total Antibody Compensation Bead Kit (catalog # A10513) was purchased from Thermo Fisher Scientific and used for validating all the antibodies and generating signal spillover table (Supplementary Table 2).
Cell Culture and lentiviral expression
The human prostate cancer cell line PC3 was obtained from ATCC (ATCC Cat# CRL-1435, RRID:CVCL_0035), authenticated by STR profiling and maintained as recommended. No mycoplasma contamination was detected. The mouse prostate cancer cell line CE1–4 has been described(16). shRNA constructs against c-Met and non-targeting shRNA control were acquired from the molecular profiling laboratory (MPL) at MGH. Transfection of cells was performed using lipofectamine together with lentiviral packaging plasmids. Lentivirus was collected 48 and 72 hours after transfection. PC3 and CE1–4 cells were infected with lentivirus in the presence of 8 μg/ml polybrene and selected in growth medium containing 2 μg/mL puromycin for 3 days.
Primers and quantitative real-time PCR
Total RNA was extracted using RNeasy Mini Kit (Qiagen). 1 μg of RNA was used to generate cDNA using superscript III First Strand synthesis system (Life Technologies). Reactions were amplified and analyzed in triplicate using the ABI 7500 Real-Time PCR System. Primers used to detect c-Met were 5’-TCCCCAATGACCTGCTGAAA-3’ (Forward) and 5’-CTTTTCCAAGGACGGTTGAAGAA-3’ (Reverse).
PC3 and CE1–4 graft models
PTEN-deleted PC3 and CE1–4 orthotopic prostate cancer graft models were used to investigate the signaling changes within CTCs as well as in primary and metastatic tumor cells in untreated and drug-treated mice. Briefly, 1×10⁶ cells stably expressing luciferase and GFP were introduced into the prostates of mice. Tumors were grown for two weeks, after which the PC3-tumor-bearing mice were treated with 40 mg/kg of BEZ235 for 9 additional weeks with a 5-days on/2-days off weekly regimen. Tumor growth was monitored weekly using the Xenogen IVIS Spectrum in vivo imaging system (Caliper Life Sciences). Animal care was in accordance with institutional guidelines using protocols approved by MGH IACUC.
For evaluating tumor growth in the bone, control or in c-Met depleted PC3 (1,000 cells) and CE1–4 (250 cells) cells with luciferase and GFP expression were inoculated into mouse tibia, and signals were measured by Xenogen IVIS Spectrum in vivo imaging system every week for 4 weeks and 16 weeks, respectively.
Tumor cell Isolation
Blood was directly collected into preservatives containing Cyto-Chex BCT tubes (Streck cat# 218980) and processed the same day using the microfluidic CTC-iChip as described(17). Briefly, preserved blood was incubated while rocking after addition of biotinylated anti-mouse CD45 for twenty minutes and twenty more minutes after the addition of magnetic microbeads coated with streptavidin. CTC-iChip was used to remove the CD45 positive leukocytes, plasma, platelets and red blood cells. The CTC enriched sample was fixed with 4% PFA, washed with PBS and transferred to 90% methanol and stored at −80°C until the labeling step.
PC3 and CE1–4 tumors in the prostate, bone, liver, and lung were excised and removed with the help of luminescence and the fluorescence of GFP positive cells. Portions of the tumors were fixed at this stage for immunohistochemical analyses. The rest of the tumors were quickly minced and incubated with collagenase solution (Stemcell Technologies cat# 100–0679) in serum-free media for thirty minutes in a 37°C incubator. Following digestion, cells were immediately fixed in 4% PFA, washed with PBS, and transferred to 90% methanol and stored at −800C until the labeling step.
Tumor Cell Labeling
Methanol permeabilized samples were washed with PBS and incubated for thirty minutes with barcoding reagents (5 μl) that were diluted in PBS (500 μl). Cells were washed with 0.5% BSA in PBS and mixed before labeling was performed. Samples were resuspended in 0.5% BSA in PBS containing the antibody cocktail and incubated at room temperature while being rocked for 1 hour. To minimize the loss of rare CTCs, samples were washed using the CTC-iChip, by processing the cells through the chip without depletion antibodies and magnetic beads. Samples were then incubated overnight with iridium-labeled DNA intercalator with 0.2% PFA in PBS for labeling DNA. Following a wash with 0.5% BSA in FBS, cells were fixed in 4% PFA, washed with pure water and filtered. Internal control beads (Fluidigm Sciences) were added for normalizing any changes to signal response of the instrument. The samples were analyzed using CyTOF 2 housed at the Ragon Institute Facility or CyTOF Helios housed at the MGH Flow and Mass Cytometry Core Facility (Fluidigm CyTOF Helios Mass Cytometer, RRID:SCR_019916).
Mass Cytometry Data Analysis
Data was normalized, concatenated and debarcoded using the software from the Nolan Lab (http://web.stanford.edu/group/nolan/resources.html). Data was gated and analyzed online using Cytobank (RRID:SCR_014043) and all gated events were exported for further analysis at JMP. Tumor cells were identified by gating for Ir intercalator+, 140Ce- (internal control bead signal), CD45-, IgG-(non-specific binding), cytokeratin+, GFP+. We used positive control cells (PC3) and negative hematopoietic cells (CD45+) that were labeled with the same cocktail and analyzed the same day to determine the gates. Intensities were normalized using arcsinh transform (arcsinh(x/5)) and exported to JMP software where illustrations were prepared and to Prism and R, where statistics were computed. In samples without barcoding (PC3 BEZ235 in vivo treatment), additional data quality control was performed on data, by comparing background antigen levels on CD45+/CK-/GFP- events across all samples and identifying outliers using Mahalanobis distances (JMP). Cell number statistics are reported in Supplementary Table 3. All data supporting the findings of this study are available from the corresponding author on request.
Patient CTC RNA-Sequence based signaling score calculations
Primary tumors and CTCs isolated from prostate cancer patients and CTCs enriched from breast cancer patients were analyzed by single cell RNA-Seq as previously described(18,19). Given a gene signature and reads-per-million (RPM) values for all genes for a sample, we defined the metagene value as the mean over the genes in the signature of log10(RPM + 1). If the signature has both up genes and down genes, the log10(RPM + 1) values for the down genes are added into the calculation of the mean only after being multiplied by −1. In addition to using the metagene values for a dataset, we sometimes combined the metagene values for two gene signatures as follows. For each gene signature we normalized the metagene values by dividing them by the sample standard deviation of the metagene values across the dataset. We then added the two normalized metagene values for each sample to form the combination metagene value for that sample.
Expression of genes previously identified in a mTOR gene signature (Rad001 sensitive genes)(20) were averaged. For the PI3-Kinase signature, expression of genes identified in a PI3-kinase signature(21) were analyzed. Positively correlating genes were assigned a positive log10(RPM+1) value while negatively correlating genes were assigned a negative log10(RPM+1). The average log(RPM+1) expression across primary tumors and circulating tumor cells was compared using the Mann-Whitney comparison with significance consider to be p<0.05.
Creation of Kaplan-Meier plot and calculation of logrank p-value was done on a per-patient basis for breast CTC dataset 1 and on a per-blood-draw basis for breast CTC dataset 2 as follows. If there were multiple CTCs per patient or per blood-draw, the metagenes for all the CTCs from a given patient or blood-draw were averaged. We classified those averages into high and low values using Otsu’s method(22).
Immunohistochemistry
Discarded formalin fixed paraffin embedded primary prostate tumors and prostate cancer bone metastases from 6 and 5 patients, respectively, were obtained in accordance with Institutional Review Board approved protocols. Tissues were sectioned and processed for c-Met immunohistochemistry. Portions of the mouse primary tumor samples were fixed overnight in 4% PFA and stored in 70% ethanol at 4°C. Portions of mouse bone samples were fixed and decalcified (Cal-Ex II, Fisher Scientific). Tissues sections were stained with hematoxylin and the following antibodies: anti-c-Met (DAB), anti-pS6 (DAB), anti-p4EBP1 (DAB) or anti-EpCAM (DAB) plus anti-GFP (alkaline phosphatase) and imaged with the Aperio Scanscope. Quantification was done using ImageJ (RRID:SCR_003070) color deconvolution followed by thresholding and measuring mean number of positive pixels.
RESULTS
Characterization of a 26-antibody panel using in vitro models
Inter- and intra-tumor heterogeneity in the phospho-proteome and kinase networks across primary tumor, CTCs, and metastatic tumors residing at various distal sites, and the influence of these signaling nodes (often activated and maintained through specific post-translational modifications) on tumor cell survival and drug responses are poorly defined. To address these questions, we applied single cell mass cytometry primarily focused on the phosho-proteome - that queries kinase activities - to two orthotopic PTEN-deleted mouse prostate cancer graft models and compared the activity of signaling nodes in the primary tumor, CTCs enriched from blood and in metastatic tumors residing in the lung, liver and bone, and during response to molecularly targeted therapy. These models are derived from orthotopic prostate injections of the androgen receptor-negative PTEN-deleted human prostate cancer cell line, PC3(23), and the PTEN-deleted mouse prostate tumor line, CE1–4, which recapitulates androgenic and epithelial features of primary human prostate cancer(16). Both models display broad metastatic potential following orthotopic prostate injections. Single cells were interrogated by mass cytometry to measure the kinase activities active within the different tumor compartments, and signaling changes following treatment with BEZ235, a dual inhibitor of PI3K and mTOR signaling(24), were evaluated in the PC3 tumor model. The PTEN-deleted tumor graft models are particularly relevant since PTEN deletion, and PI3K mutations occur in many cancers, including prostate- and breast cancer, and inhibitors targeting the PI3K/mTOR signaling pathways present promising therapeutic targets against these cancers(25–27).
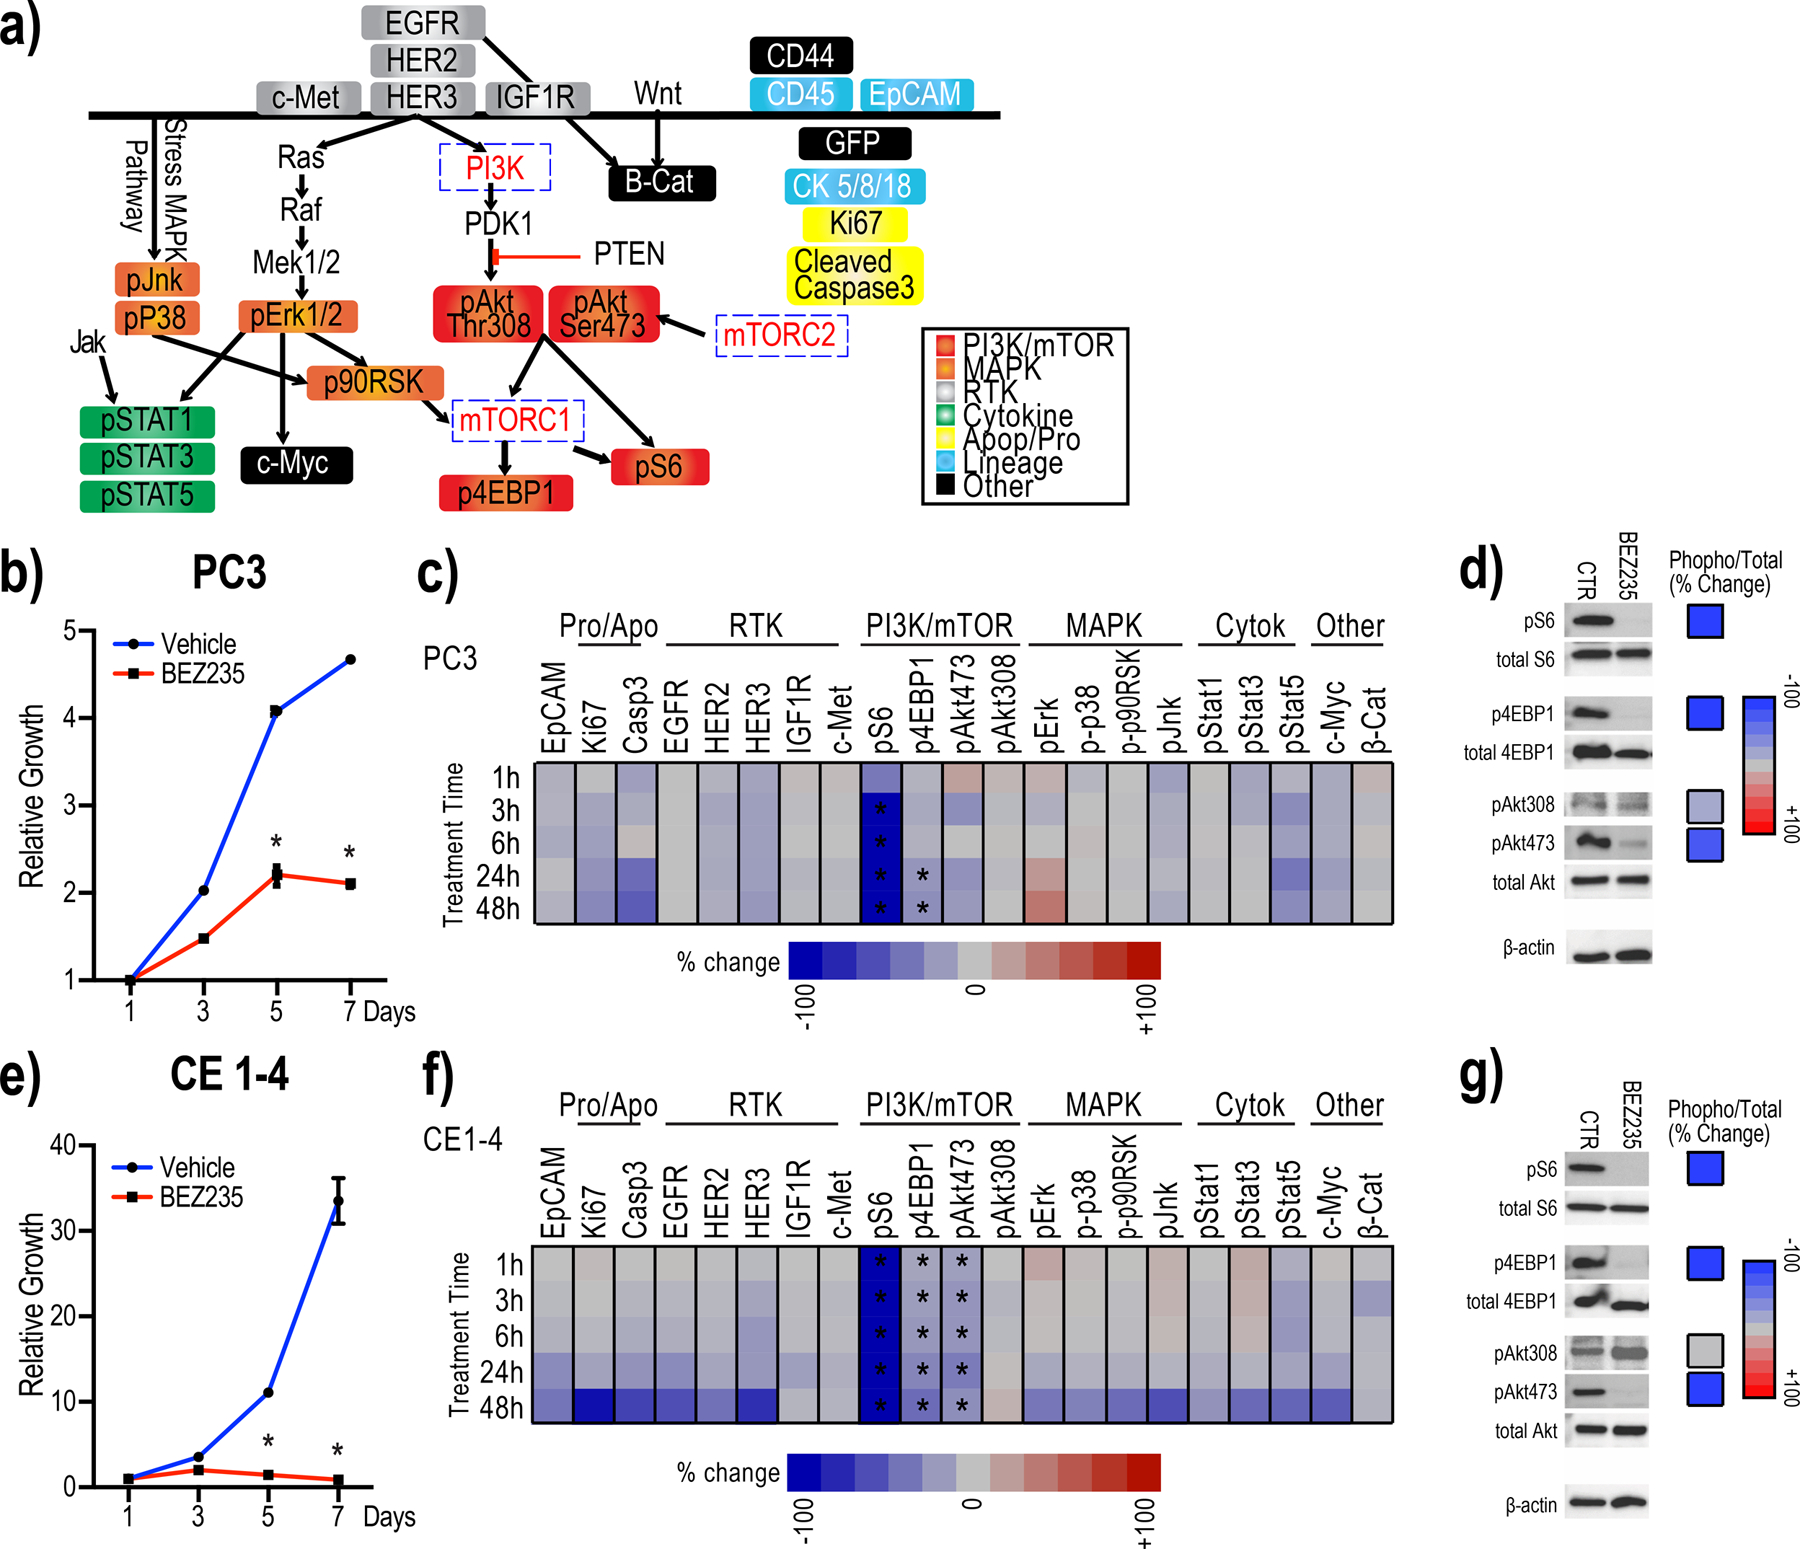
A customized antibody panel against 26 proteins including specific phospho-proteins was used to simultaneously quantify cell lineage/cell state, signaling pathways, proliferation, and apoptosis to identify signaling nodes active within tumor cells (Fig. 1a, Supplementary Table 1). Many of these antibodies have been extensively used in previously reported mass cytometry studies(8,28–32), including those specifically marking epithelial tumor cells (EpCAM, and cytokeratin) and leukocytes (CD45), antibodies detecting signaling via PI3K/mTOR [phospho-S6 (pS6), phospho-4EBP1 (p4EBP1), phospho-Akt (pAkt; both p-Thr308 and p-Ser473)], MAPK [phospho-p38 (p-p38), phospho-ERK (pERK), phospho-JNK (pJNK), and phospho-p90RSK (p-p90RSK)], receptor tyrosine kinase (RTK; EGFR, HER2, HER3, IGFR and c-Met) and cytokine [phospho-Stat1 (pStat1), phospho-Stat3 (pStat3), and phospho-Stat5 (pStat5)] signaling pathways. In addition, we also included antibodies against critical transcription factors (activated ß-catenin and c-Myc), apoptosis (activated Caspase3) and proliferation (Ki67).
Figure 1:
Antibody panel detects suppression of PI3K/mTOR activity in individual PC3 and CE1–4 cells treated with BEZ235 in vitro.
1a: The customized 26-antibody panel used to detect and quantify protein and phospho-protein levels in single cells by mass cytometry include PI3K/mTOR-, MAPK-, and cytokine-signaling, RTKs as well as apoptosis, proliferation, lineage and other (c-Myc, β-catenin, CD44 and GFP) markers.
1b: BEZ235 treatment suppresses the growth of PC3 cells in vitro. Untreated cells are shown as control (*q<0.1).
1c: Heat map showing mean change in the signaling proteins within each of the indicated pathways in PC3 cells treated with BEZ235 in vitro, compared with untreated control cells (n=4 experimental replicates). Significant changes are marked with asterisks (q<0.1 by multiple t-tests FDR correction).
1d: Western blots detect the trend in changes observed by mass cytometry of single PC3 cells. Western blots from BEZ235 or DMSO-treated PC3 cells (left) and percent change in each signaling epitope (phospho-protein/total protein) (right) are shown.
1e: BEZ235 treatment suppresses the growth of CE1–4 cells in vitro. Untreated cells are shown as control (*q<0.1).
1f: Heat map showing mean change in the signaling proteins within each of the indicated pathways in CE1–4 cells treated with BEZ235 in vitro, compared with untreated control cells (n=4 experimental replicates). Significant changes are marked with asterisks (q<0.1 by multiple t-tests FDR correction).
1g: Western blots detect the trends in changes observed in single CE1–4 cells by mass cytometry. Western blots from BEZ235 or DMSO-treated CE1–4 cells (left) and percent change in each signaling epitope (phospho-protein/total protein) (right) are shown.
We first tested this 26-antibody panel in vitro using PC3 cells treated with BEZ235(24). BEZ235 significantly reduced the growth of PC3 cells in vitro (Fig. 1b; q<0.1). Following drug exposure for 1, 3, 6, 24, and 48 hours, a total of more than 650,000 individual PC3 cells were analyzed across four independent experimental replicates. Consistent with BEZ235 inhibiting the PI3K/mTOR signaling axis(24), both pS6 and p4EBP1 (compared with untreated control) were significantly inhibited (Fig. 1c; q<0.1). BEZ235 also reduced pAkt473 but not pAkt308 levels. Western blot analysis showed that BEZ235 treatment of PC3 cells suppressed pS6 and p4EBP1 in vitro confirming the trends in the changes observed using mass cytometry. The drug did not suppress total Akt levels but, consistent with the mass cytometry data, suppressed pAkt473 and not pAkt308 (Fig. 1d). Single cell proteomic analysis and western blots of CE1–4 treated with BEZ235 in vitro further confirmed these findings showing drug-induced suppression of growth as well as pS6, p4EBP1 and pAkt473 (Fig 1e–g; q<0.1). Single cell mass cytometry analysis of CE1–4 cells showed that the PI3K inhibitor, GDC0941(33) suppressed the downstream targets pS6 and pAkt308/473 (Supplementary Fig. 1a; p<0.01).
To further confirm the reliability and specificity of this antibody panel, we analyzed the BEZ235-treated breast cancer patient-derived CTC culture, BRX142, harboring mutant PI3K; BEZ235 robustly suppressed the PI3K/mTOR pathway intermediates, pS6, p4EBP1and pAkt473 in BRX142 cells in vitro (Supplementary Fig. 1b; p<0.01). Taken together, these results confirm and validate the specificity of the customized 26 antibody panel to detect changes in kinases mediating PI3K/mTOR signaling in cells.
Prostate cancer bone metastases exhibit elevated PI3K/mTOR activity
Having validated the specificity of the antibody panel using multiple in vitro cell culture models, we applied it to interrogate and quantify the differences in signaling pathways in tumor cells growing at different sites in mouse models. Single tumor cells, collected following collagenase dissociation of primary and metastatic tumors growing in the lung, liver and bone, were identified based on GFP, cytokeratin, and nuclear label (Ir-intercalator) positivity and CD45 negativity (Supplementary Fig. 2a). For CTC isolation, mouse blood was collected into tubes containing preservatives to stabilize the phospho-epitopes on the proteins. After incubating with immunomagnetic bead-conjugated antibodies against white blood cells, the blood was processed through the CTC-iChip, a microfluidic device that uses negative selection to enrich CTCs(17,34). Over 85% of the cells enriched from the various compartments following enzymatic digestion were intact/live as measured by 103Rh-intercalator labeling (Supplementary Fig. 2a). Osmium labeling intensities showed no significant size differences in the tumor cells isolated from the various tissue compartments (Supplementary Fig. 2b). All samples were analyzed the same day using identical antibody cocktails/barcoding. Negative (leukocytes) and positive controls (cell lines grown in vitro) were included to ensure signal specificity. Additional data quality control was performed on data by comparing background antigen levels on CD45+/CK-/GFP- events across all samples to identify outliers using Mahalanobis distance.
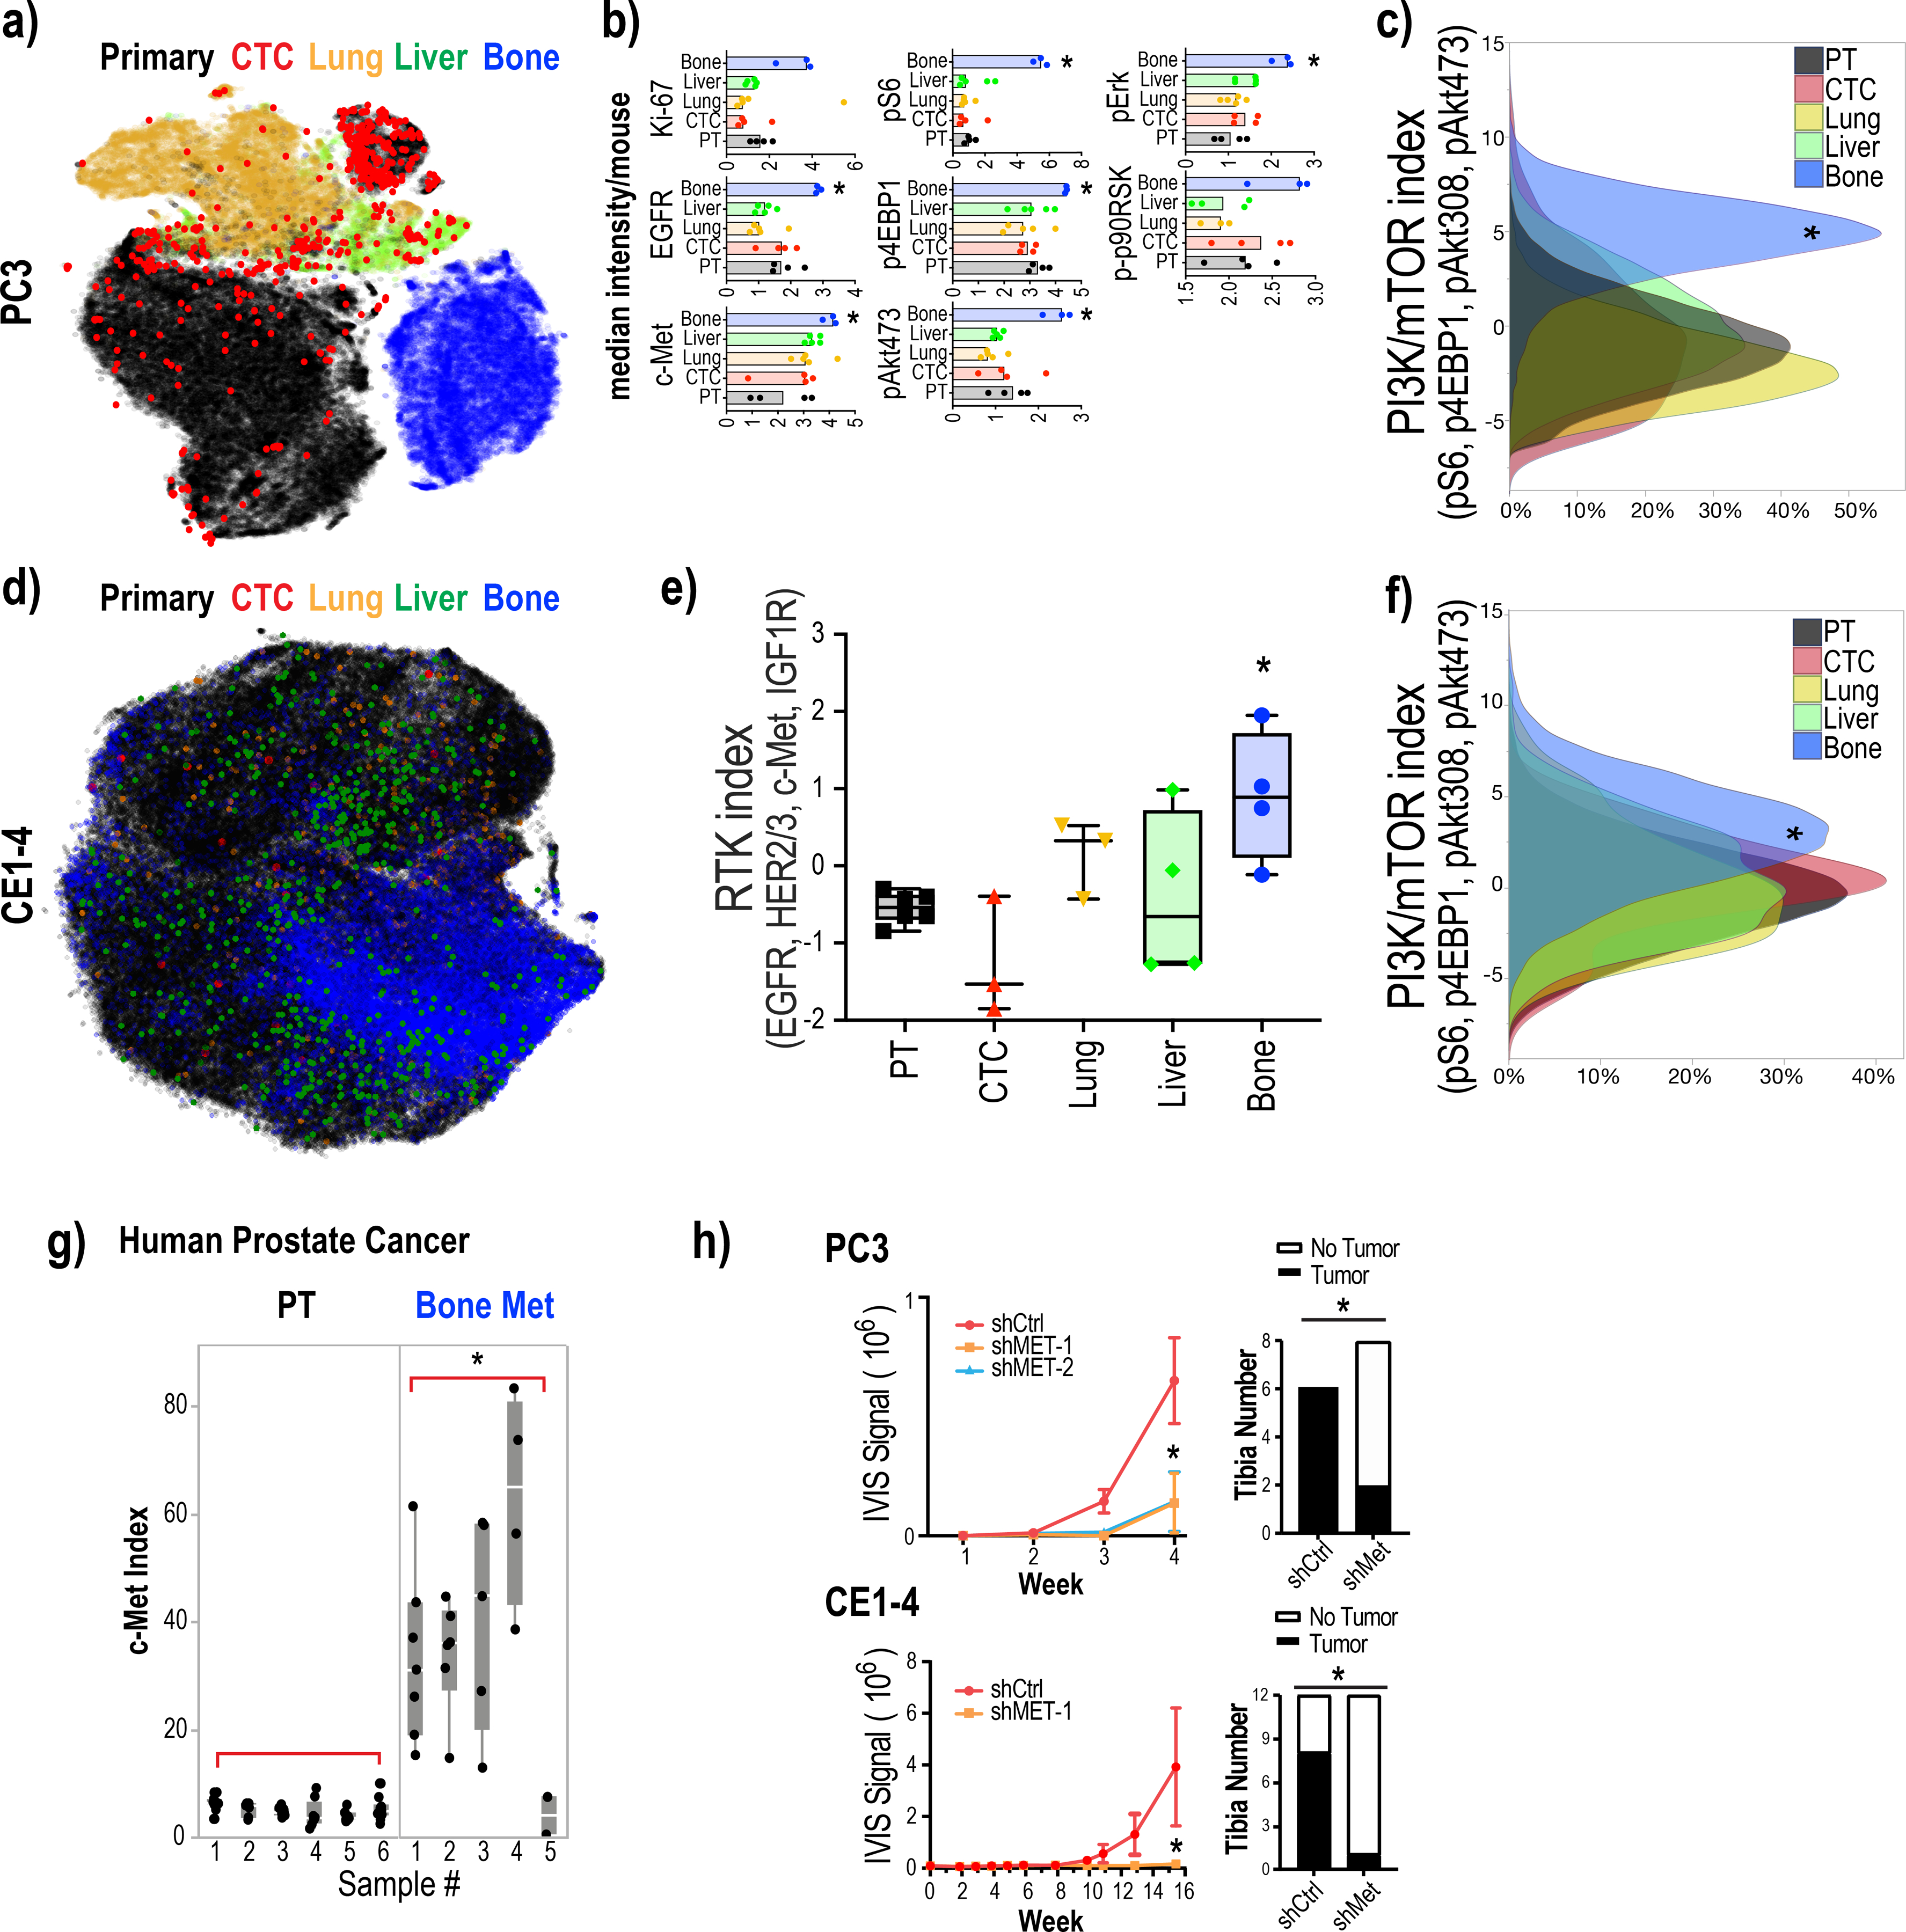
Dimensional reduction of all epitopes of interest (excluding CD44, CD45, CK, and GFP) using the viSNE method(35), showed that the primary PC3 tumor cells are highly heterogeneous (Fig. 2a, Supplementary Data 1), with some cells overlapping with the CTCs and the metastatic tumor cells enriched from the lung and liver. Bone metastatic tumor cells in the PC3 tumor model clustered separately on the viSNE plot implying unique molecular properties (Fig. 2a). Quantification of the mean expression level of each of the epitopes within all the single cells collected from the different tissue compartments (per mouse) (Fig. 2b) showed that the bone metastatic cells, compared with the primary tumor, CTCs and lung and liver metastasis, expressed significantly higher levels of the proliferation marker, Ki67, PI3K/mTOR - (pS6, p4EBP1, pAkt473, pAkt308), and MAPK- (pErk and p-p90RSK) signaling intermediates as well as the RTKs, EGFR and c-Met (Fig. 2b; q- and p- values for each epitope provided in the figure legend); The PI3K/mTOR signaling index, measured using the sum of standardized pS6, p4EBP1, pAkt473, and pAkt308 channels, was significantly higher in the single cells collected from bone metastasis compared with tumor cells enriched from all the other sites (Fig. 2c; q<0.0001, see Supplementary Fig. 3 for individual channels). Signals for pSTATs (pSTAT1, pSTAT5), c-Myc, HER2 and IGF1R were not upregulated in bone metastases compared with the tumor cells residing at the other sites (Supplementary Fig. 4), reflecting the specificity of elevated PI3K/mTOR activity in bone metastasis.
Figure 2:
PI3K/mTOR activity is elevated in bone metastases
2a: Dimensional reduction of the expression of all analyzed epitopes in single tumor cells in the PC3 mouse tumor metastasis model using viSNE shows a large, fractured island consisting of dispersed primary tumor cells (black) and CTCs (red), and liver (green), lung (yellow) and bone (blue) metastatic cells.
2b: Signaling intermediates of the PI3K/mTOR- and MAPK-pathways and RTKs are elevated in bone metastases. Median epitope levels across single tumor cells isolated from the primary tumor and lung, liver and bone metastases as well as CTCs per mouse are shown in box plots. Each dot represents the median intensity of the epitope quantified (across single cells from each of the tumor compartment) for a single mouse. Ki67 q=0.3088/p=0.0702, pS6 q=0.002/p=0.0007, EGFR q=0.0098/p=0.0047, p4EBP1 q<0.0001/p<0.0001, pErk q<0.0001 p<0.0001, c-Met q=0.0294/p=0.0.0094 by one-way ANOVA, corrected for multiple comparisons by FDR, Benjamini, Krieger and Yekutieli.
2c: PI3K/mTOR index (measured as the sum of standardized pS6, p4EBP1, pAkt473 and pAkt308 levels) was significantly elevated in PC3 bone metastatic cells compared to primary tumor cells, CTCs, and metastatic cells in other sites. q<0.0001 by one-way ANOVA, corrected for multiple comparisons by FDR, Benjamini, Krieger and Yekutieli, whereas MAPK- and cytokine-signaling pathway signatures were not significantly different (also see Supplementary Fig. 4b).
2d: viSNE of all analyzed epitopes in single tumor cells from the CE1–4 mouse prostate cancer model showing primary tumor cells (black), CTCs (red), and liver (green), lung (yellow) and bone (blue) metastatic cells.
2e: RTK index (measured as the sum of standardized EGFR, HER2, HER3, c-Met and IGF1R levels) is significantly elevated in CE1–4 bone metastatic cells compared to primary tumor cells, CTCs, and metastatic cells in other sites. q<0.0001 by one-way ANOVA, corrected for multiple comparisons by FDR, Benjamini, Krieger and Yekutieli.
2f: PI3K/mTOR index (measured as the sum of standardized pS6, p4EBP1, pAkt473 and pAkt308 levels) is significantly elevated in CE1–4 bone metastatic cells compared to primary tumor cells, CTCs, and metastatic cells in other sites. q<0.0001 by one-way ANOVA, corrected for multiple comparisons by FDR, Benjamini, Krieger and Yekutieli.
2g: c-Met protein expression is significantly elevated prostate cancer bone metastases compared with primary tumors. Quantification of c-Met protein expression by IHC of primary human prostate cancer (n=6) and prostate cancer bone metastases (n=5). p=0.0066 by t-test.
2h: Suppression of c-Met impairs prostate tumor growth in the bone. c-Met depleted (using shRNAs against c-Met) and control PC3 (1000 cells each) and CE1–4 (250 cells each) were injected into the tibia of mice and their growth was monitored over 4 weeks and 16 weeks, respectively. Left panel showing bioluminescence signal over time and right panel showing number of tibiae with and without tumor growth observed at the final time point. p<0.01 by t-test. c-Met knockdown impaired tumor growth in the bone in both models. p=0.0188 for PC3, p=0.0114 for CE1–4 by t-test.
To further validate these findings, we evaluated a second orthotopic mouse prostate cancer model developed from the PTEN-deleted mouse prostate tumor cells, CE1–4(16). We applied single cell proteomic analysis following the same procedures as described for the PC3 model. The antibodies used to detect EpCAM, c-Met and CK, however, were switched to specifically detect mouse-specific epitopes. We analyzed individual tumor cells enriched from the CE1–4 primary tumor, CTCs, and metastatic tumors collected from the lung, liver, and bone (n=4 mice). Consistent with the PC3 tumor model, metastatic CE1–4 cells growing in the bone but not in the lung and the liver showed significantly increased RTKs (the sum of standardized values for EGFR, HER2/3, c-Met, and IGF1R) and PI3K/mTOR signaling index (the sum of standardized values for pS6, p4EBP1, pAkt473, pAkt308) compared with the primary tumor and CTCs (Fig. 2d–2f; q<0.0001).
Taken together, our analysis of two complementary prostate cancer graft models shows that the PI3K/mTOR signaling activity is elevated in bone metastases.
c-Met protein is required for prostate cancer growth in the bone
Findings from single cell proteomic analysis were further confirmed by immunohistochemical staining of primary tumor and bone metastases with antibodies against c-Met, pS6 and p4EBP1, all of which show significantly increased levels in bone metastases compared with matched primary tumors; we quantified the staining in multiple fields across each slide/tissue to account for variation in staining intensities (Supplementary Fig. 5; c-Met: p=0.0053; p4EBP1: p=0.0019; pS6 p=0.0386). Increased c-Met and EGFR expression in bone metastases compared with primary prostate cancer, identified using the single cell mass cytometry, is consistent with previously reported findings(36,37). Thus, this report serves as additional confirmation of the specificity of the antibody panel used for single cell proteomic analysis of prostate cancer cells residing within the various tissue compartments. Interestingly, analysis of multiple publicly available datasets also showed that c-Met RNA is not upregulated in metastatic prostate cancer compared with primary tumors (Supplementary Fig. 6). However, c-Met protein expression, evaluated using immunostaining, was higher in four out of five human bone metastatic prostate cancers compared with primary tumors (n=6) (Fig. 2g; p=0.0066; Supplementary Fig. 7) suggesting that c-Met protein expression is elevated in prostate cancer bone metastases most likely through post-transcriptional mechanisms.
Cabozantinib, a tyrosine kinase inhibitor primarily targeting MET and VEGFR2 as well as other tyrosine kinases(38), has been shown to inhibit bone metastasis in mouse prostate cancer xenografts(39). Consistent with these findings, Cabozantinib in phase II randomized trial in men with metastatic castration-resistant prostate cancer(40) showed that 68% of evaluable patients had improvement on bone scan. Several c-Met inhibitors have entered clinical evaluation, of which two drugs gained FDA approval, neither being a specific inhibitor of c-Met(41). To evaluate if inhibition of c-Met alone can suppress the survival and growth of prostate cancer cells in the bone, we chose to use shRNAs against c-Met instead of small molecule inhibitors that lack specificity. We knocked down c-Met expression in both PC3 and CE1–4 cells using two different shRNAs against c-Met. Knockdown of c-Met expression does not change the proliferation rate of the PC3 and CE1–4 cells in vitro compared to control cells (Supplementary Fig. 8a and 8b). However, depletion of c-Met significantly impairs both PC3 and CE1–4 tumor growth in the bone microenvironment when inoculated into the mouse tibia (Fig. 2h; PC3: p=0.0188; CE1–4: p=0.0114), suggesting the c-Met is essential for prostate tumor cell growth in the bone. Taken together, these findings show that tumors residing within different compartments, despite originating from the same primary tumor, exhibit differential kinase activities and growth dependencies, which may provide a mechanistic explanation for heterogeneous responses to therapies that can occur across different metastatic sites.
Tumor deposits at various sites exhibit differential response to PI3K/mTOR inhibition
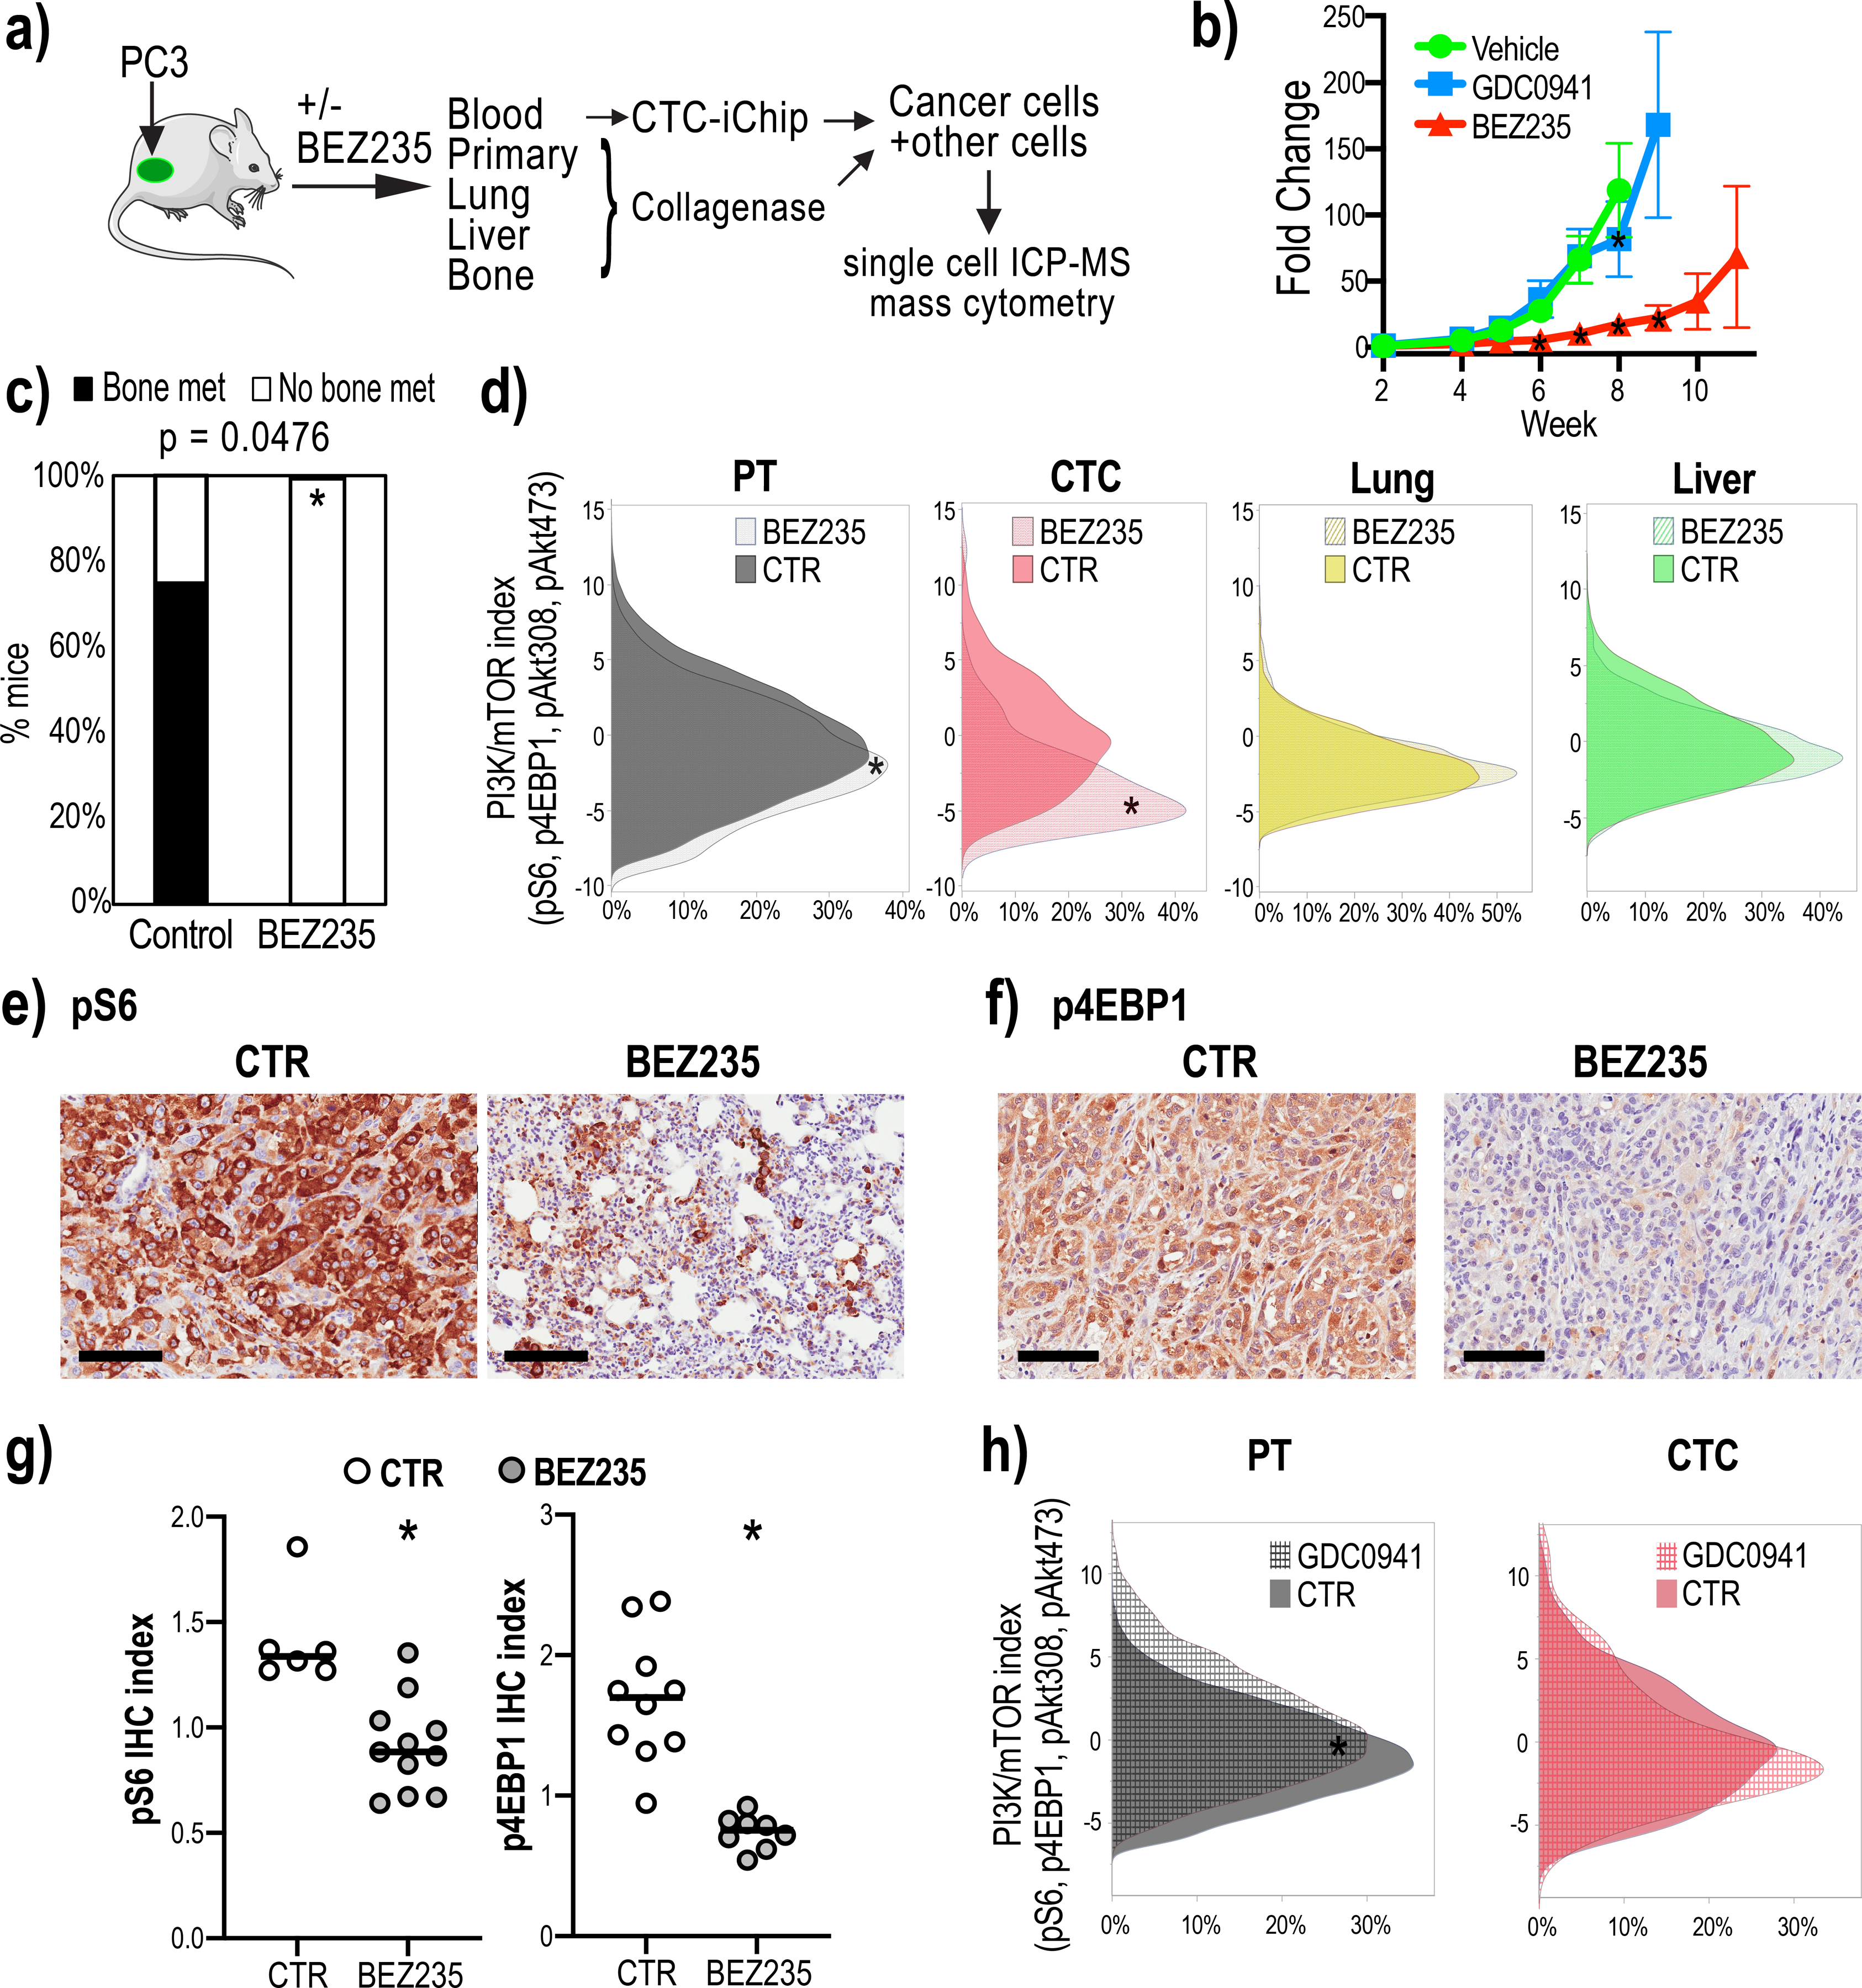
We then characterized drug-induced changes in tumor burden and in signaling pathways across tumors growing within the different tissue compartments. Mice bearing two-week-old GFP and luciferase-labeled, orthotopic PC3 tumors were treated with BEZ235(24) for 9 to 10 weeks (Fig. 3a; n=4 mice for untreated control, n=5 mice for BEZ235 treatment). Growth was monitored by IVIS live imaging. BEZ235 significantly suppressed PC3 tumor burden in mice (Fig. 3b; p-values shown in figure legends). To determine signaling changes within the different tumor deposits, single cells were collected from primary tumors and lung, liver and bone metastases of untreated and drug-treated mice at the end of the experiment. CTCs were enriched from mouse blood. While 75% of mice in the untreated group presented with bone metastases, none of the BEZ235-treated mice (0%) had bone metastases (Fig. 3c, p=0.047). Consistent with this observation, no tumor cells were evident in the bones of five BEZ235-treated mice (0%), whereas we were able to collect a total of >20K bone metastatic cells from untreated animals.
Figure 3:
Dual PI3K/mTOR inhibitor treatment shows heterogeneous drug responsiveness of tumor deposits.
3a: Mouse model outlining the experiment to collect single cells from the primary and metastatic tumors and CTCs from untreated and BEZ235-treated mice harboring orthotopic PC3 tumor grafts. CTCs were enriched from the mouse blood processed through the CTC-iChip.
3b: GFP and luciferase labeled PC3 cells were injected into the prostates of immune-compromised mice and 2-week old tumors were treated with BEZ235 or GDC0941 (n=6 mice for BEZ235; n=4 mice for GDC0941). BEZ235-treatment significantly suppressed tumor growth (week 5 p=0.3571, week 6 p=0.0032, week 7 p<0.0001, week 8 p<0.0001, two-way ANOVA, Dunnett correction). GDC0941 had no effect on tumor growth (week 5 p=0.9579, week 6 p=0.4257, week 7 p=0.9294, week 8<0.001, two-way ANOVA, Dunnett correction). Untreated tumor growth is shown as control (n=7 mice).
3c: BEZ235-treatment eliminates tumor growth in the bone. The bar graph shows that the percentage of mice with bone metastases in the untreated group is significantly higher than in the BEZ235-treated group (p=0.047 by Two-tailed Fisher’s exact test).
3d: PI3K/mTOR indices (measured as the sum of standardized pS6, p4EBP1, pAkt473 and pAkt308 levels) of single tumor cells enriched from the primary tumors, CTCs and lung and liver metastases collected from mice untreated or treated with BEZ235. PI3K/mTOR indices in primary tumor cells and CTCs were significantly decreased upon drug treatment (p<0.0001 by Mann-Whitney test); lung and liver metastases showed no significant change upon BEZ235 treatment.
3e-3g: pS6 and p4EBP1 staining of primary tumors resected from untreated control (CTR) and BEZ235-treated animals. Representative images are shown in Fig. 3e and 3f. Scale bar represents 100 μm. Quantification of staining indices in Fig. 3g shows that BEZ235 treatment significantly reduced pS6 and p4EBP1 levels in primary tumors (n=3 mice and n=17 tumor areas for pS6, n=2 mice and n=18 tumor areas for p4EBP1). p<0.001 for p4EBP1, p=0.0011 for pS6 by Mann-Whitney test.
3h. PI3K/mTOR indices primary tumor-derived cells and CTCs treated with the PI3K inhibitor, GDC0941. Untreated controls are shown (CTR). GDC0941 significantly increased PI3K/mTOR levels in the primary tumor cells (p<0.001 by Mann-Whitney test), whereas the levels in CTCs did not change.
Single cell analysis showed that the PI3K/mTOR index in primary tumor cells and CTCs was significantly decreased following BEZ235 treatment (Fig. 3d; p<0.0001). Suppression of pS6 and p4EBP1 levels in the primary tumor following BEZ235 treatment was further confirmed through quantification of immunohistochemical staining of these tissues (Fig. 3e–3g; p4EBP1: p<0.001; pS6: p=0.0011). Interestingly, despite the PI3K/mTOR index in the lung and liver metastases being comparable to the primary tumor (Fig. 2c), these metastatic tumor cells, unlike the primary tumor, did not show any significant differences in PI3K/mTOR activity upon drug treatment (Fig. 3d).
To determine whether drug-induced signaling changes in the PI3K/mTOR pathway coincide with growth responses, we evaluated PC3 tumor-bearing mice treated with the PI3K inhibitor GDC0941, which did not affect tumor growth in this model (Fig. 3b). Single cells collected from PC3 tumor-bearing mice untreated or treated with GDC0941 for 8 weeks showed that the PI3K/mTOR index was not suppressed in the primary tumor or CTCs (Fig. 3h). Instead, there was a small but significant increase in PI3K/mTOR index consistent with previously published work showing that PI3K inhibited cancer cells depend on mTOR signaling for proliferation(42) (Supplementary Fig. 9).
Taken together, these results indicate that PI3K/mTOR signaling activity and drug responsiveness of tumor compartments at different sites may be modulated by the tumor microenvironment, and that suppression of the PI3K/mTOR activity is indeed associated with growth responses to these drugs.
PI3K/mTOR activity is elevated in epithelial cancer cells
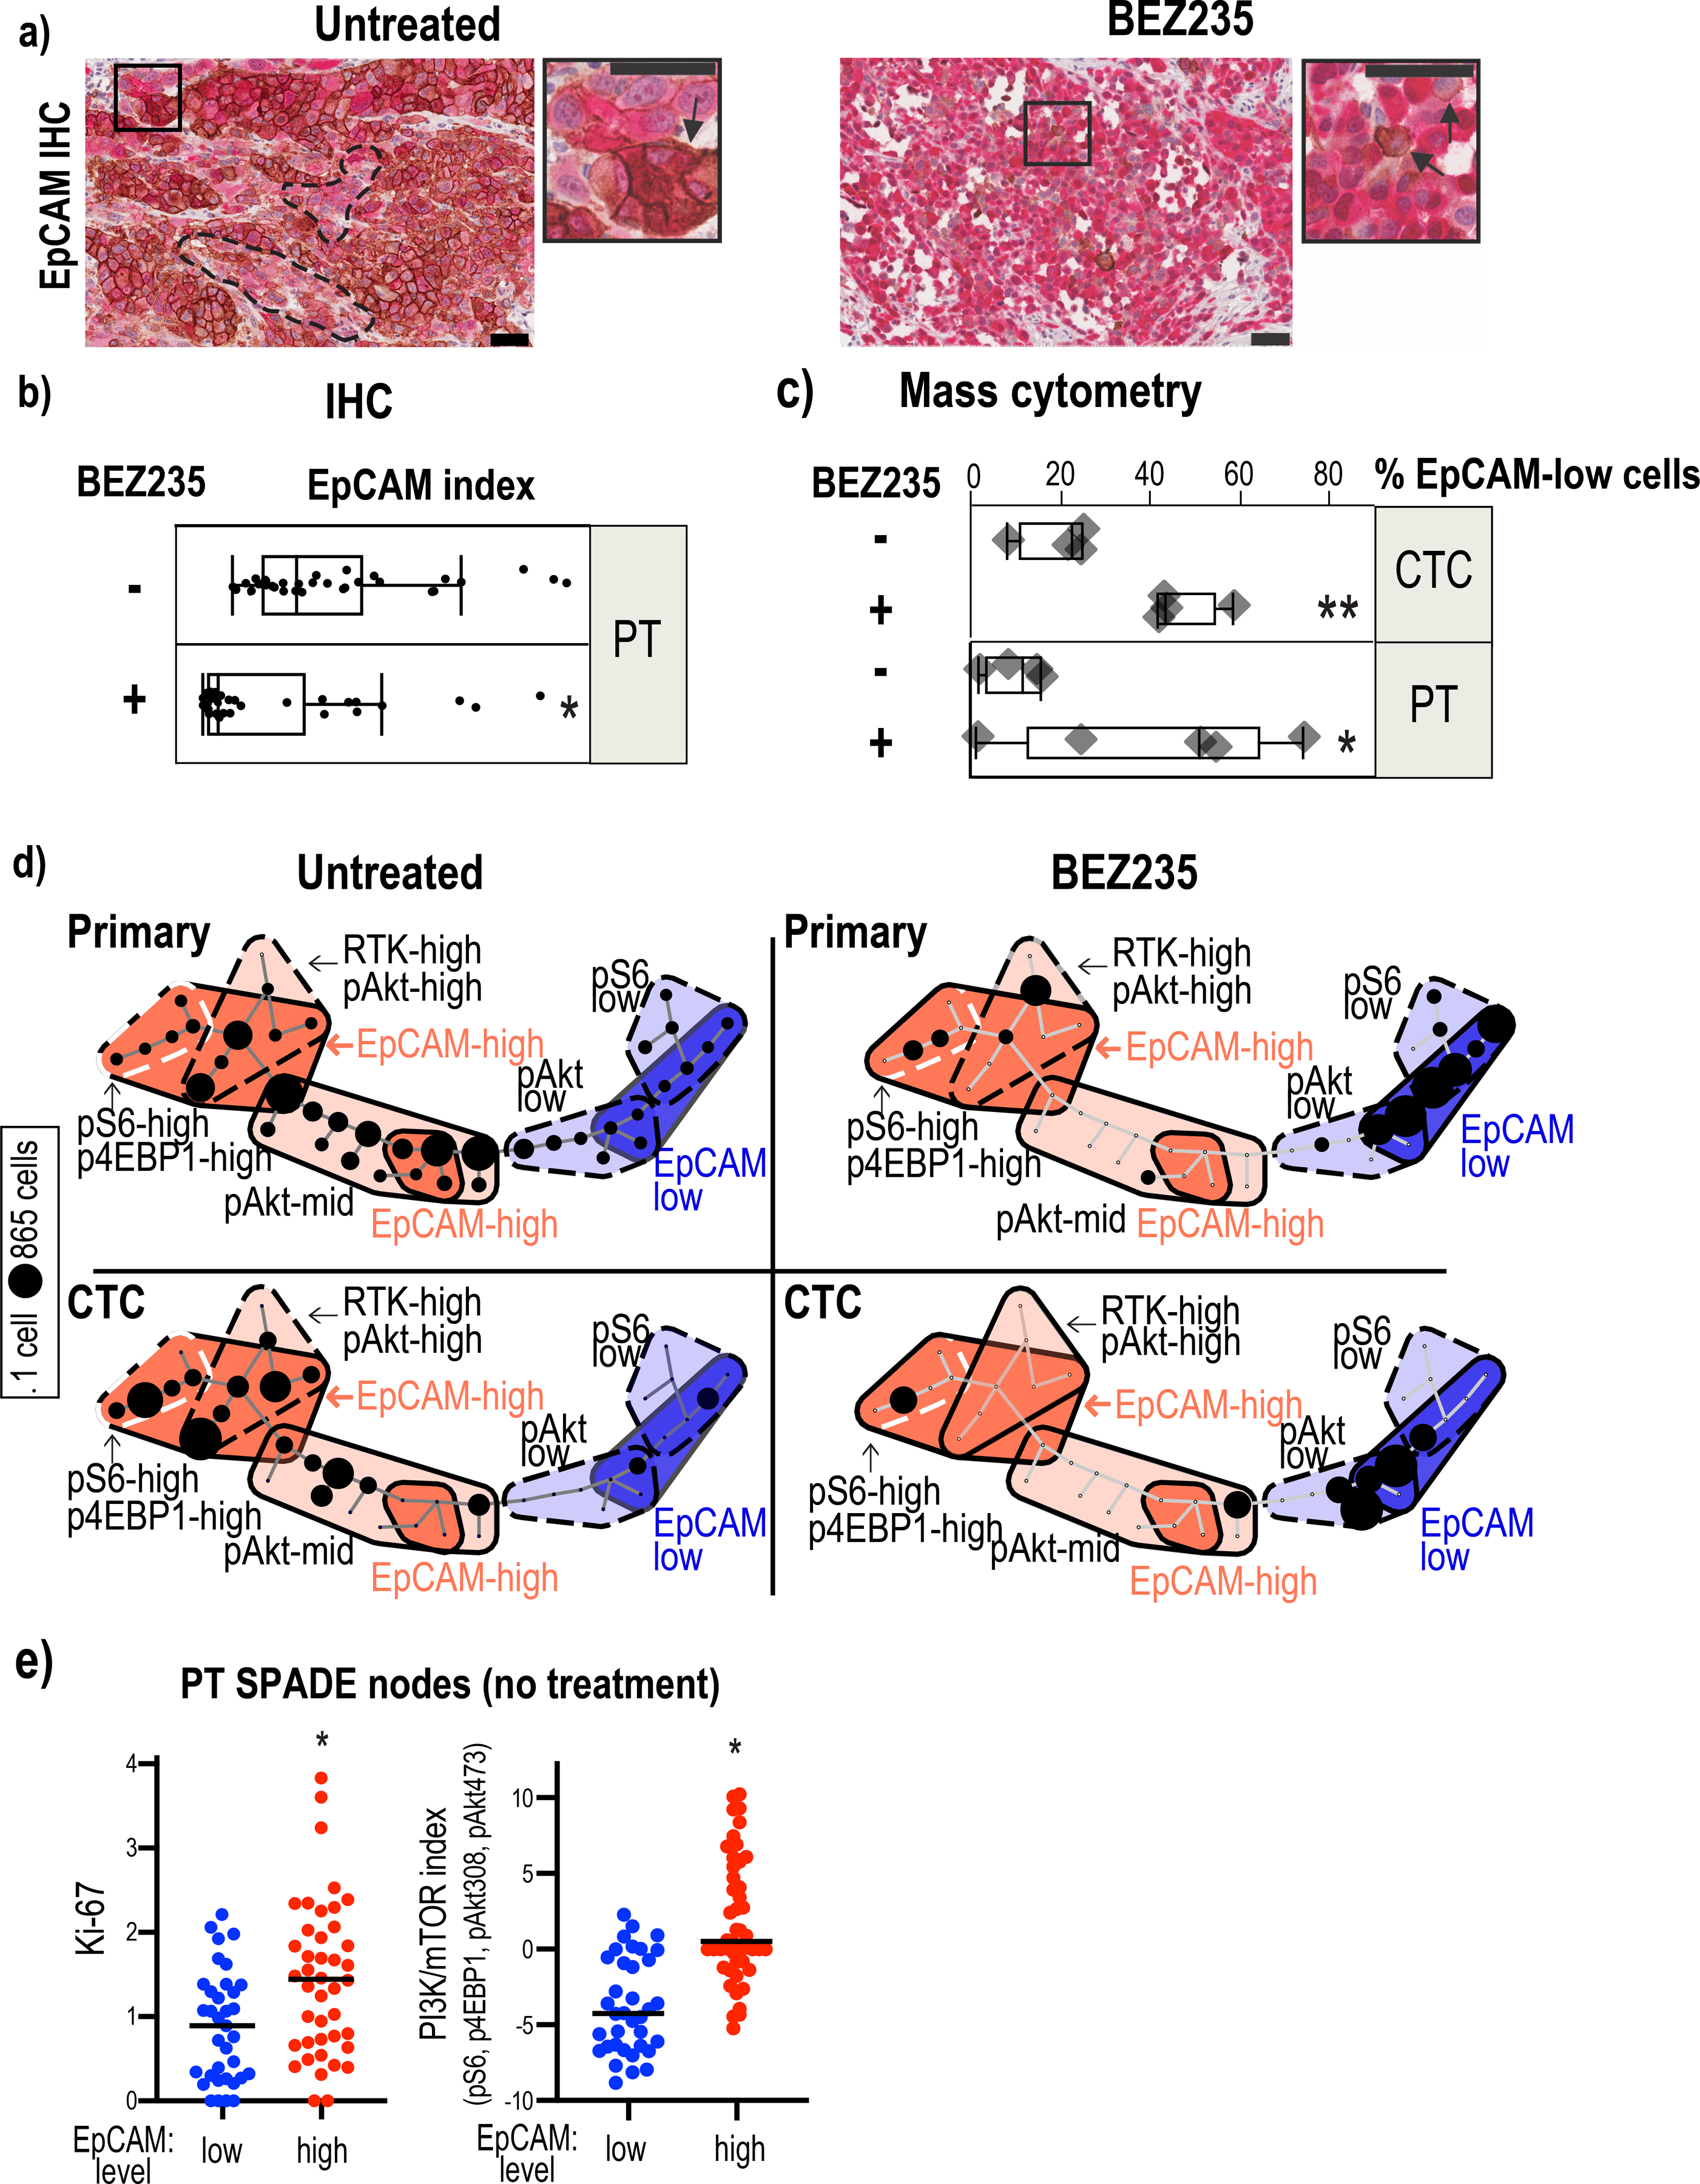
Since epithelial to mesenchymal transition (EMT) is a critical process implicated in promoting resistance to therapeutic intervention with kinase inhibitors, we analyzed the extent to which EMT impacts BEZ235 responsiveness in the PC3 mouse tumor model. We first stained the untreated and BEZ235-treated primary tumors with antibodies against EpCAM and GFP to distinguish human tumor cells from mouse stromal cells. EpCAM expression was heterogeneous throughout the GFP+ tumor tissue (Fig. 4a). The percentage of EpCAM positive cells was drastically reduced in the drug-resistant primary tumors remaining after 11 weeks of treatment (Fig. 4b; p<0.001; Fig. 4c; Primary tumors: p=0.037; CTC: p=0.0014). Islands of low-EpCAM (EpCAMlow) expressing tumor cells in untreated primary tumors suggest the preexistence of these resistant cells in untreated tumors. The presence of resistant tumor cells prior to drug exposure has been shown in several models(43,44). To determine whether high and low EpCAM, an epithelial marker, accurately identified epithelial and mesenchymal states, respectively, we interrogated the expression of the mesenchymal marker, N-Cadherin in EpCAMhigh and EpCAMlow PC3 cells (Supplementary Fig. 10a and 10b); EpCAMhigh cells expressed lower N-Cadherin compared with EpCAMlow cells demonstrating that EpCAM levels accurately differentiate epithelial and mesenchymal PC3 populations (Supplementary Fig. 10c).
Figure 4:
Epithelial and mesenchymal tumor cell populations exhibit differential PI3K/mTOR activity.
4a: EpCAM (brown-DAB) and GFP (red-alkaline phosphatase) staining of primary tumors resected from untreated and BEZ235-treated mice. Sections were counterstained with hematoxylin. Clusters of EpCAMlow cells (marked with hatched lines) pre-exist within EpCAMhigh cell populations in the untreated tumors. A EpCAMhigh cell cluster is marked with an arrow in the high magnification image of the inset. BEZ235-treated tumors have a prevalence of EpCAMlow cells with very few EpCAM positive cells (marked by arrows in the higher magnification inset). Scale bar represents 50μm.
4b: Quantification of EpCAM intensity in the untreated and drug-treated primary tumors following immunohistochemical staining with an EpCAM antibody. p<0.001 by Mann-Whitney test.
4c: The bar graph shows the percentage of EpCAMlow cells in untreated and BEZ235- treated primary tumor (PT) cells (p=0.037 by t-test) and in CTCs (p=0.0014 by t-test). EpCAMlow is defined by the median level of EpCAM in all primary tumor cells.
4d: SPADE map of primary tumor cells and CTCs from untreated and BEZ235-treated mice shows two major tumor cell populations defined by EpCAM expression: EpCAMhigh (red) and EpCAMlow (blue). The EpCAMhigh cells are further classified into three subclasses based on the expression levels: EpCAMhigh-RTKhigh-pAkthigh, EpCAMhghi-pS6high-p4EBP1high, EpCAMhi-pAktmid ) and mesenchymal subpopulations into four subclasses (EpCAMvery-low-pS6low, EpCAMvery-low-pAktlow, EpCAMlowpAktmid, EpCAMlowpS6low). The number of tumor cells within each compartment is illustrated using circles, the size of which corresponds to the number of cells.
4e: Median Ki67 and PI3K/mTOR levels were compared in SPADE nodes of untreated primary tumors that had low or high median EpCAM levels. EpCAMhigh nodes harbored significantly higher Ki67 (p=0.0003 by Mann-Whitney test) and PI3K/mTOR index (p<0.0001 by Mann-Whitney test).
Quantification of EpCAM by single cell proteomic analysis of untreated primary tumor cells identified the coexistence of EpCAMlow and EpCAMhigh populations with differential kinase activities (Fig. 4d). The EpCAMhigh epithelial populations had elevated PI3K/mTOR activity marked by increased pS6, p4EBP1 and pAkt, as well as RTKs whereas the EpCAMlow expressing mesenchymal cells harbored lower kinase activities. Quantification of Ki67 showed that the EpCAMhigh cells, are more proliferative than the EpCAMlow cells, which harbor a lower PI3K/mTOR index (Fig. 4e; Ki67: p=0.0003; PI3K/mTOR: p<0.0001). The CTCs isolated from untreated mice also show high and low PI3K/mTOR activity in epithelial and mesenchymal populations, respectively (Fig. 4d). Consistent with their elevated PI3K/mTOR activity, the epithelial populations are more sensitive to BEZ235. Their decline upon treatment coincided with increased mesenchymal cells with low pAkt and pS6 activity (Fig. 4d).
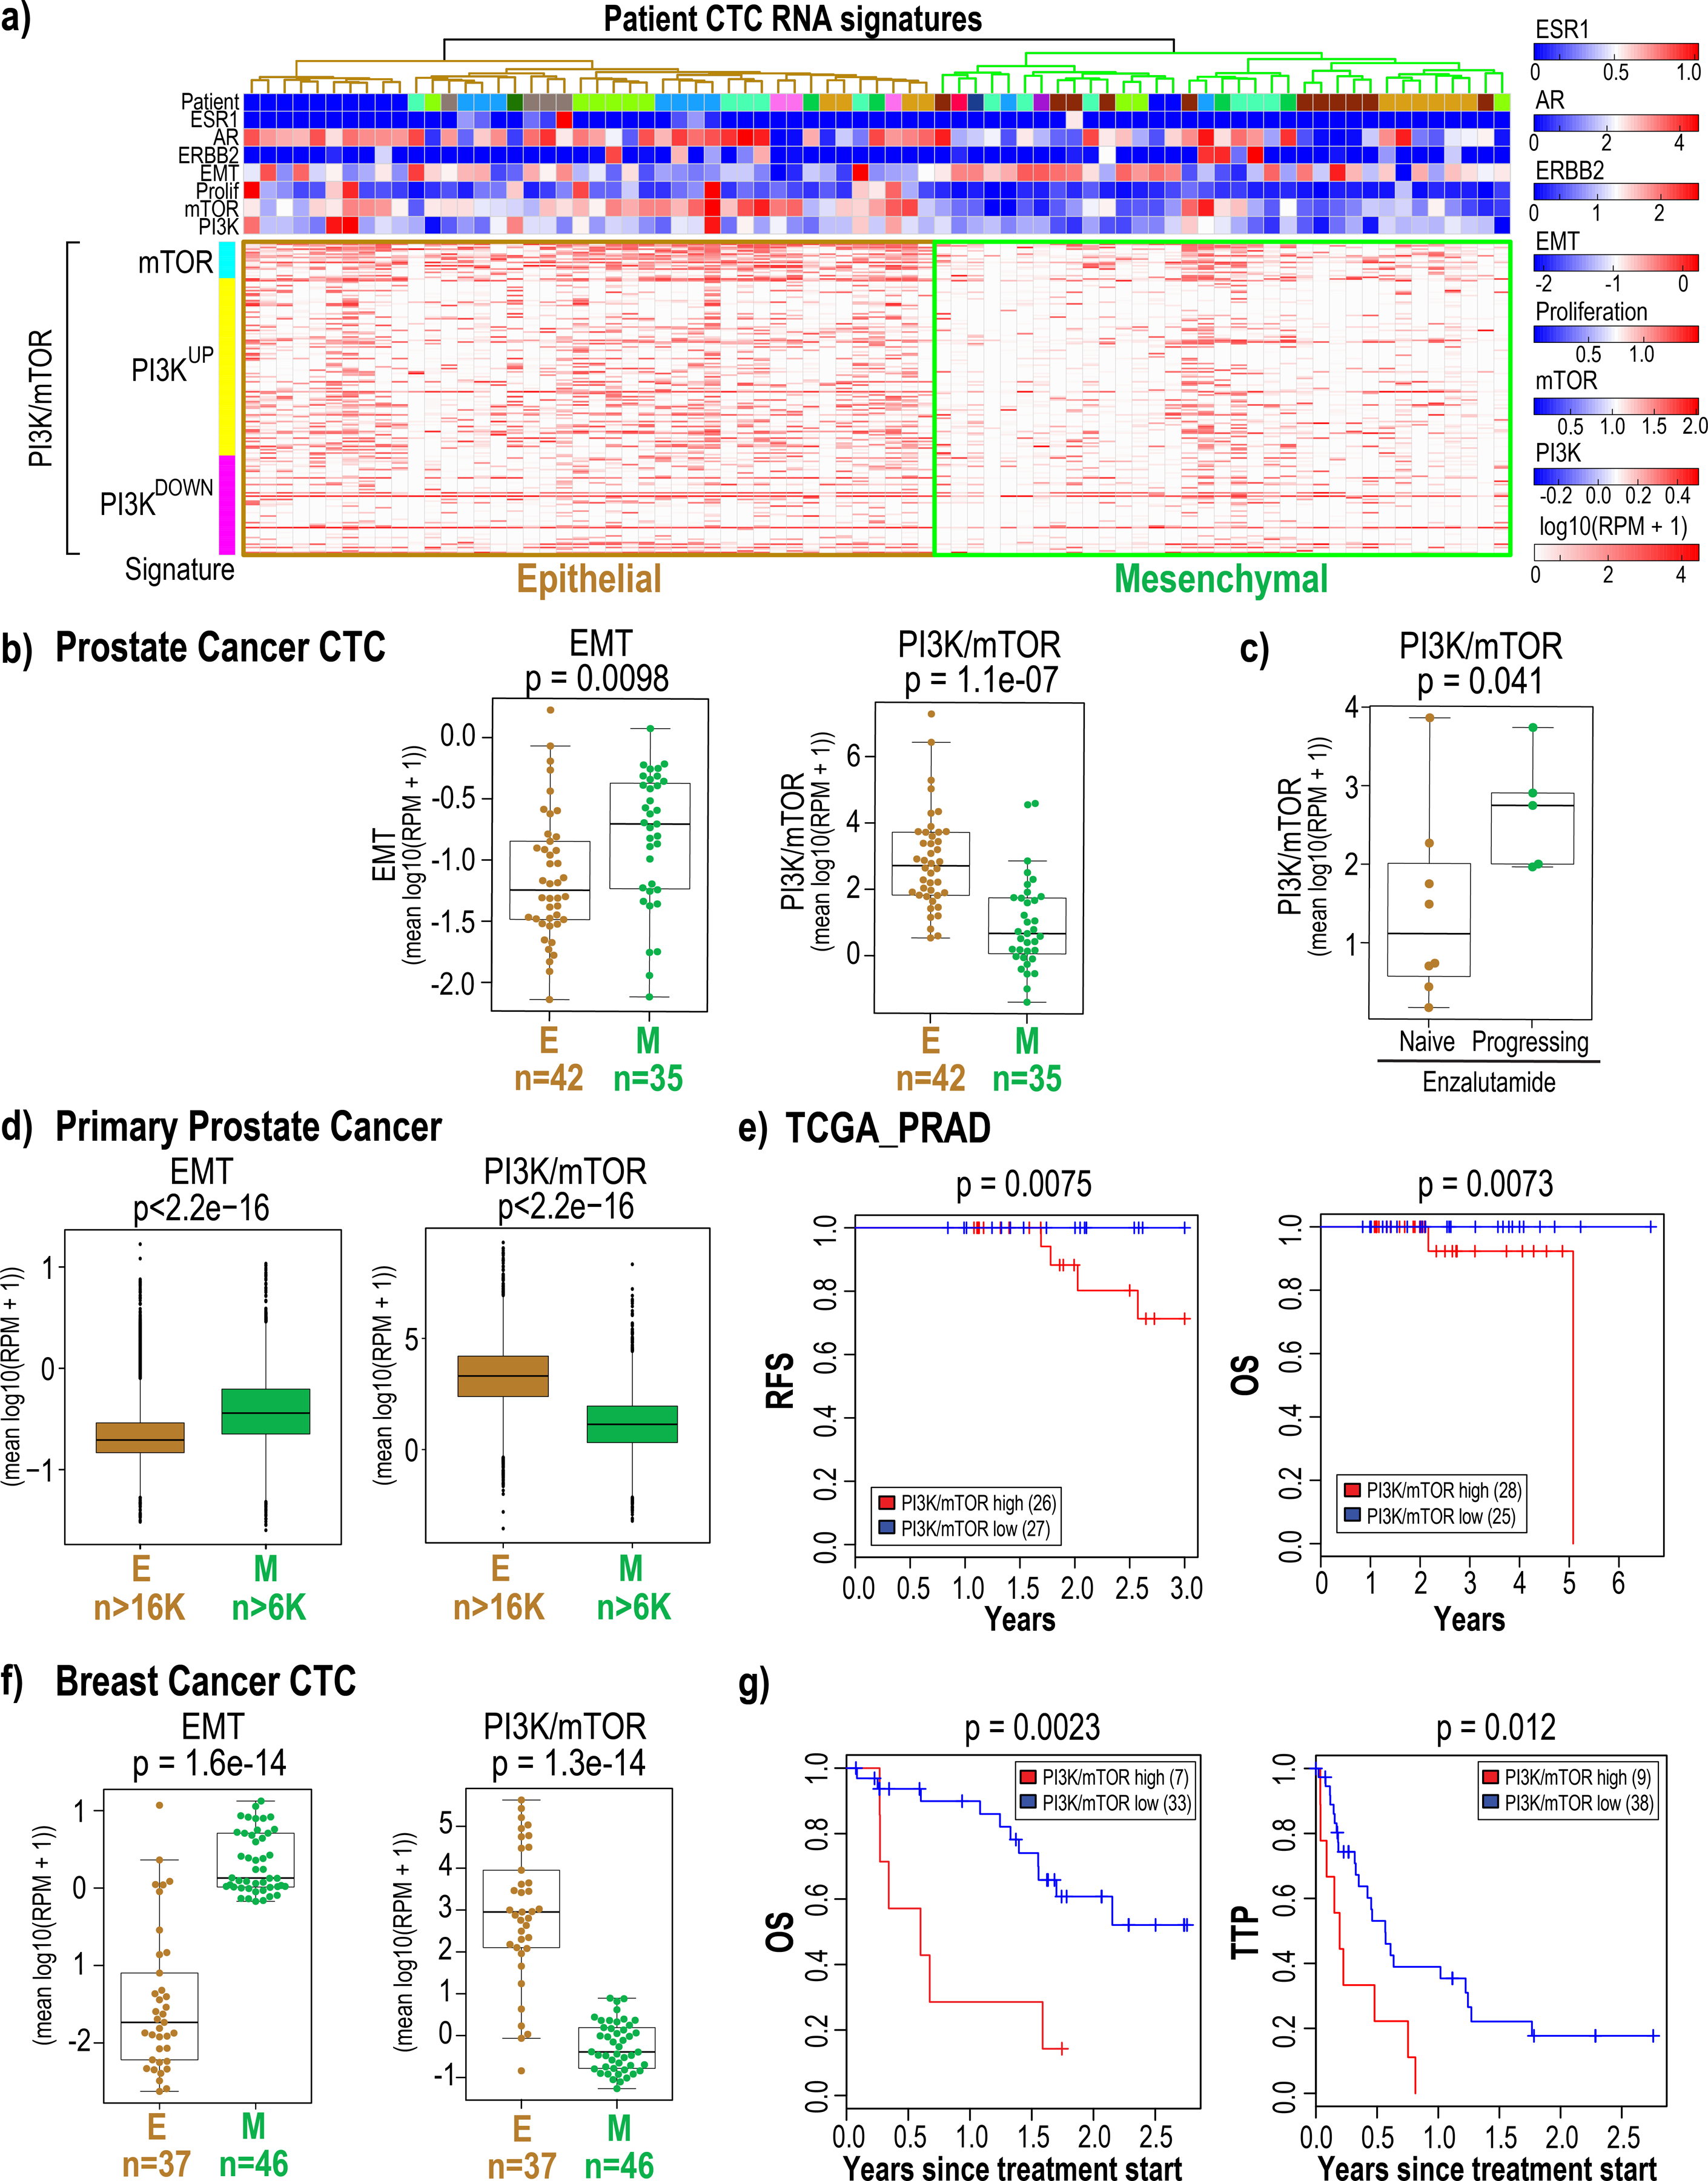
To determine if the differential PI3K/mTOR kinase activation in epithelial and mesenchymal tumor cell populations observed in the mouse prostate graft models could be extrapolated to human patient-derived tumor cells, we interrogated single cell RNA-sequencing data from CTCs isolated from metastatic castration-resistant prostate cancer (mCRPC) patients (n=77 CTCs from 13 patients(19)). The lineage of each tumor cell was allocated using the EMT gene signature(45); the threshold to classify cells as epithelial or mesenchymal was set using Otsu’s method(46). Expression of the EMT gene signature(45) identified 42 epithelial and 35 mesenchymal CTCs in mCRPC patients (Fig. 5a, 5b (left); p=0.0098). The gene expression signature associated with PI3K/mTOR activity(20,21) was significantly elevated in epithelial CTCs compared with mesenchymal CTCs in these prostate cancer patients (Fig. 5b (right); p=1.1e−07); CTCs in 5 patients who exhibited radiographic and/or PSA progression during enzalutamide therapy harbored higher PI3K/mTOR activity compared with 8 patients who had not received enzalutamide (Fig. 5c; p=0.041, Supplementary Fig. 11).
Figure 5:
Epithelial and mesenchymal CTC populations enriched from metastatic breast and mCRPC patients exhibit differential PI3K/mTOR activity.
5a: Single cell RNA-sequencing data derived from 77 CTCs enriched from 13 mCRPC patients (mean 6 CTCs per patient) was interrogated for the expression of estrogen and androgen receptor and ERBB2 expression as well as for proliferation, EMT(45), PI3K and mTOR(20,21) signatures. Expression values represent log10 (RPM+1). The epithelial and mesenchymal CTC populations identified based on EMT marker expression are highlighted.
5b: The plots show the level of EMT (left) and combined PI3K/mTOR (right) gene signatures in each individual epithelial and mesenchymal CTCs enriched from mCRPC patients. The number of CTCs in each category is shown below.
5c: The plot shows that patients with increased PI3K/mTOR signaling progress on enzalutamide compared with treatment naïve patients who harbor lower levels of PI3K/mTOR activity. The p-values shown were calculated using the two-sided Welch t-test.
5d: The plots show the level of EMT (left) and combined PI3K/mTOR (right) gene signatures in epithelial and mesenchymal prostate cancer cells from 13 samples (12 primary tumors and 1 lymph node metastasis from 12 patients) following analysis of single cell RNA-sequencing data. The tumor cells were identified using copy number variation. The number of tumor cells within each category is shown below. The p-values shown were calculated using the two-sided Welch t-test.
5e: Kaplan-Meier analysis of overall survival (OS) and recurrence free survival (RFS) upon analysis of TCGA-PRAD transcriptome data from prostate cancer patients for whom treatment and outcome data were available shows that high average PI3K/mTOR activity is associated with poor clinical outcome. The high and low PI3K/mTOR subgroups were determined based on average PI3K/mTOR activity using Otsu’s method(22). P-value was calculated by log rank test.
5f: The plots show the level of the EMT (left) and combined PI3K/mTOR (right) gene signatures in each individual epithelial and mesenchymal CTCs enriched from of breast cancer patients (dataset #1). The number of CTCs in each category is shown below. The p-values shown were calculated using the two-sided Welch t-test.
5g: Kaplan-Meier analysis of overall survival (OS) and time to progression (TTP) on previous therapy for metastatic breast cancer patients (dataset #1) with high average PI3K/mTOR activity versus low average PI3K/mTOR activity. The high and low PI3K/mTOR subgroups were determined based on average PI3K/mTOR activity for each patient blood draw using Otsu’s method(22). P-value was calculated by log rank test.
We also analyzed publicly available single cell transcriptomic data from 13 prostate tumor samples from 12 patients (12 primary tumors and one lymph node metastasis)(47). The tumor cells were identified using copy number variations; cells annotated as leukocytes were used as control. The gene expression signature associated with PI3K/mTOR activity(20,21) was significantly elevated in epithelial cells compared with mesenchymal cells within these prostate cancer samples (Fig 5d, Supplementary Fig. 12a, 12b).
Analysis of TCGA-PRAD data to evaluate the contribution of elevated PI3K/mTOR activity to the clinical outcome of prostate cancer patients showed that increased PI3K/mTOR activity in prostate cancer trends towards predicting poor overall survival of patients [Contal - O’Quigley p = 0.078] (Supplementary Fig 12c). Analyses of samples from patients for whom both treatment and outcome data were available showed that increased PI3K/mTOR activity is significantly associated with poor recurrence free- (RFS) and -overall survival (OS) [RFS: Contal - O’Quigley p = 0.0075; OS: Contal - O’Quigley p = 0.0073] (Fig. 5e).
We then extended this study to breast cancer patients. Single cell RNA-sequencing data was available from 241 CTCs collected from a total of 78 patients across two different datasets(18). Analysis of these two single cell RNA-sequencing datasets from breast CTCs also showed that the gene expression signature associated with PI3K/mTOR activity(20,21) was significantly elevated in epithelial CTCs compared with mesenchymal CTCs in both dataset 1 (EMT: p=1.5e−14; PI3K/mTOR: p=1.3e−14) (Fig. 5f, Supplementary Fig. 13a and 13b) and in dataset 2 (EMT: p=5.8e−34; PI3K/mTOR: p=6.2e−19) (Supplementary Fig. 14a and 14b). Since clinical outcome data was available for breast cancer patient dataset 1 (GSE144494, Supplementary Table 4), we investigated whether elevated PI3K/mTOR activity in breast CTCs correlated with either overall survival (OS) and time to progression (TTP) on previous therapy. Using a Cox proportional hazards model, we identified that increased PI3K/mTOR activity in epithelial CTCs is associated with poor OS [Log Rank p=0.0023; hazard ratio (HR)=4.4 (1.6, 12)] and TTP [Log Rank p=0.012; HR=2.7 (1.2, 5.9)] (Fig. 5g, Supplementary Fig. 15).
DISCUSSION
In summary, we find that single cell phospho-proteomic analysis defines changes in kinase activities in PTEN-deleted prostate cancer graft cells residing within different tissue compartments in the mouse, identifying tumor-microenvironment and cell-state specific activation of kinase networks. Microenvironmental factors are critical in promoting metastatic growth at distal sites. In breast cancer, different metastatic sites show variable enrichment of immune cells. Compared with primary breast tumors, the metastatic bone lesions show more neutrophil infiltration whereas the lymph node metastases have fewer macrophages(48). Differences in the cell types present in the lung, liver and bone and variations in the extracellular matrix composition, growth factors as well as oxygen concentrations at these sites can also contribute to signaling heterogeneity observed across tumor deposits growing in different distal sites and regulate their drug responsiveness(49). Bone metastasis, commonly observed in metastatic castration resistant prostate cancer (mCRPC), is strongly modulated by cells in the microenvironment(50) including osteoblasts(51), endothelial cells(52), macrophages(53), and monocytes(50) leading to heterogeneity in cancer cell proliferation and drug responsiveness(54). mCRPC patients treated with docetaxel exhibit poor overall survival (OS) when the metastatic tumors reside in the liver, rather than in the lung or bone(54). Together these findings suggest that differences in the tumor microenvironment contribute to signaling pathway heterogeneity and varied drug responses in metastatic tumors growing at various distal sites.
Our observation of increased PI3K/mTOR activity in metastatic prostate tumors growing in the bone microenvironment, compared with isogenic tumor cells residing within other tissue compartments, indicates that it is independent of the PI3K mutational status of the tumor; instead, tumor microenvironmental factors, which remain to be identified, may be significantly contributing to this differential kinase activity. The 26-antibody panel identifies cell state-specific activation of the PI3K–Akt–mTOR kinase axis in PTEN-deleted prostate cancer graft models, as well as in CTCs from breast cancer patients confirming that increased of PI3K/mTOR activity independent of PI3K mutational status of the tumor (p=0.0021; Supplementary Fig. 16). This suggests that the differential kinase activity identified in the epithelial and mesenchymal tumor compartments may be dictated by the lineage differences of tumor cells.
The high and low kinase activity in the epithelial and mesenchymal tumor cell populations, respectively, provides a mechanism underlying the differential sensitivity of these cell states to kinase inhibitors and identifies a new molecular paradigm for the kinase inhibitor-resistant phenotypes associated with EMT, as observed by the accumulation of PI3K/mTORlow mesenchymal cells in PC3 tumors treated with BEZ235 (Fig. 4a–d). The PI3K/mTOR signaling pathway is a master regulator of the RNA translation machinery. Inhibiting this pathway suppresses the translation of mRNAs encoding ribosomal proteins(55). We recently showed that a subset of proliferative CTCs from breast cancer patients harbor strong ribosome and translational gene signatures, which coincided with the expression of epithelial lineage markers(18). It is possible that increased PI3K/mTOR activity in the epithelial CTCs contributes to increased translation in this subset of CTCs, and it may sensitize them to inhibitors of translation as well. We note that EMT is a continuum with multiple intermediates. The heterogeneity in the epithelial and mesenchymal markers themselves within the CTCs made it difficult to definitively define kinase activities prevalent in the hybrid states.
PI3K/mTOR activation, typically by genetic aberrations in PTEN and PI3K, is common in advanced castration resistant prostate cancer(27) and other cancers(26) including breast cancer(25,56). Deregulation of the PI3K-Akt-mTOR signaling axis, an important intracellular pathway regulating cell cycle, quiescence, and proliferation, presents an attractive molecularly targetable therapeutic node. The first PI3K inhibitor, alpelisib, was recently approved for clinical management of breast cancer patients(57); alpelisib plus fulvestrant led to responses in heavily pretreated metastatic breast cancer patients with PI3K-mutated tumors(58). Although the first-generation mTOR inhibitors have limited efficacy due to their partial inhibitory effects, the second-generation mTOR inhibitors, currently under clinical investigation(59), may be more competent in blocking mTOR activity through complete inhibition of 4EBP1 phosphorylation(60–62). A third generation of mTOR inhibitors being generated by connecting the rapamycin-like domain to an ATP-site may further enhance their activity in the clinic(63). Complementing current therapeutic interventions in cancers including prostate and breast cancer with inhibitors targeting PI3K/mTOR may prove useful to clinically exploit the PI3K/mTOR-driven molecular heterogeneity exhibited by the different tumor cell populations. The recently reported IPATential150 phase 3 trial showed that the addition of the Akt inhibitor ipatasertib to abiraterone prolonged radiographic progression-free survival in mCRPC patients with PTEN-loss(64). Thus, combining inhibitors of PI3K/mTOR and androgen receptor signaling may result in superior antitumor activity compared with either agent alone. Consistent with this, our data shows that CTCs from mCRPC patients progressing on enzalutamide harbor increased PI3K/mTOR activity (Fig. 5b; right panel), which may render them sensitive to inhibitors of PI3K/mTOR signaling.
Finally, the striking difference in c-MET activity in bone metastases compared to other metastatic sites suggests a possible explanation for the failure of the c-MET/VEGFR2 inhibitor cabozantinib to improve overall survival in mCRPC patients despite a significant improvement in bone scan response(65). Based on our data, one potential mechanistic explanation for this result is that the drug preferentially targets bone metastases which have increased c-MET activity but does not induce sufficient tumor cell killing in other sites of disease where c-MET activity may be lower due to differences in the tumor microenvironment. Such heterogeneity in kinase activity across multiple metastatic sites may necessitate the use of combination therapies to ensure simultaneous targeting of all therapeutic vulnerabilities of cancer cells in different tissue compartments.
Supplementary Material
Significance:
Single cell mass cytometry analyses provide insights into the differences in kinase activities across tumor compartments and cell states, which contribute to heterogeneous responses to targeted therapies.
Acknowledgements:
We thank Dr. Nick Dyson for critical reading of the manuscript. We thank Michael Koulopoulos, Dr. Narges Rashidi, Heather Cahill and MGH Flow and Mass Cytometry Core Facility, MGH Pathology Core Facility for experimental assistance. This work was supported by funding from the ESSCO Breast Cancer Research Fund (S.M), BCRF Drug Research Collaborative (S.M.) NIH/NCI (U01CA214297; S.M., D. A. H., M.T.) NIH P41 BioMEMS Resource Center (EB002503; M.T.), NIH/NIBIB (EB012493; M.T.), the Howard Hughes Medical Institute (D.A.H.), NIH/NCI (2R01CA129933; D.A.H.), National Foundation for Cancer Research (D.A.H.), Shriners Hospital for Children Mass Spectrometry Special Shared Facility (N.M.K.), Harvard Medical School Eleanor and Miles Shore Fellowship (N.M.K) and Tosteson & Fund for Medical Discovery Fellowship (N.M.K.).
Footnotes
Conflict of interest statement: Drs. Maheswaran, Toner, Haber and Karabacak report a patent for the microfluidic device used to enrich circulating tumor cells has been licensed to Tellbio Inc, a startup biotech company.
REFERENCES
- 1.Andor N, Graham TA, Jansen M, Xia LC, Aktipis CA, Petritsch C, et al. Pan-cancer analysis of the extent and consequences of intratumor heterogeneity. Nat Med 2015;22:105–13 [DOI] [PMC free article] [PubMed] [Google Scholar]
- 2.Gerlinger M, Rowan AJ, Horswell S, Larkin J, Endesfelder D, Gronroos E, et al. Intratumor Heterogeneity and Branched Evolution Revealed by Multiregion Sequencing. N Engl J Med 2012;366:883–92 [DOI] [PMC free article] [PubMed] [Google Scholar]
- 3.Wang ZA, Mitrofanova A, Bergren SK, Abate-Shen C, Cardiff RD, Califano A, et al. Lineage analysis of basal epithelial cells reveals their unexpected plasticity and supports a cell-of-origin model for prostate cancer heterogeneity. Nat Cell Biol 2013;15:274–83 [DOI] [PMC free article] [PubMed] [Google Scholar]
- 4.Ramskold D, Luo S, Wang YC, Li R, Deng Q, Faridani OR, et al. Full-length mRNA-Seq from single-cell levels of RNA and individual circulating tumor cells. Nat Biotechnol 2012;30:777–82 [DOI] [PMC free article] [PubMed] [Google Scholar]
- 5.Stewart CM, Kothari PD, Mouliere F, Mair R, Somnay S, Benayed R, et al. The value of cell-free DNA for molecular pathology. J Pathol 2018;244:616–27 [DOI] [PMC free article] [PubMed] [Google Scholar]
- 6.Gerdes MJ, Sevinsky CJ, Sood A, Adak S, Bello MO, Bordwell A, et al. Highly multiplexed single-cell analysis of formalin-fixed, paraffin-embedded cancer tissue. Proc Natl Acad Sci USA 2013;110:11982–7 [DOI] [PMC free article] [PubMed] [Google Scholar]
- 7.Hartmann FJ, Bendall SC. Immune monitoring using mass cytometry and related high-dimensional imaging approaches. Nature Reviews Rheumatology 2020;16:87–99 [DOI] [PMC free article] [PubMed] [Google Scholar]
- 8.Bendall SC, Simonds EF, Qiu P, Amir E-aD, Krutzik PO, Finck R, et al. Single-cell mass cytometry of differential immune and drug responses across a human hematopoietic continuum. Science 2011;332:687–96 [DOI] [PMC free article] [PubMed] [Google Scholar]
- 9.Lin L-L, Kost ER, Lin C-L, Valente P, Wang C-M, Kolonin MG, et al. PAI-1-Dependent Inactivation of SMAD4-Modulated Junction and Adhesion Complex in Obese Endometrial Cancer. Cell Reports 2020;33 [DOI] [PMC free article] [PubMed] [Google Scholar]
- 10.Klotz-Noack K, Klinger B, Rivera M, Bublitz N, Uhlitz F, Riemer P, et al. SFPQ Depletion Is Synthetically Lethal with BRAFV600E in Colorectal Cancer Cells. Cell Reports 2020;32 [DOI] [PubMed] [Google Scholar]
- 11.Jackson HW, Fischer JR, Zanotelli VRT, Ali HR, Mechera R, Soysal SD, et al. The single-cell pathology landscape of breast cancer. Nature 2020;578:615–20 [DOI] [PubMed] [Google Scholar]
- 12.Peran I, Dakshanamurthy S, McCoy MD, Mavropoulos A, Allo B, Sebastian A, et al. Cadherin 11 Promotes Immunosuppression and Extracellular Matrix Deposition to Support Growth of Pancreatic Tumors and Resistance to Gemcitabine in Mice. Gastroenterology 2021;160:1359–72.e13 [DOI] [PMC free article] [PubMed] [Google Scholar]
- 13.Karacosta LG, Anchang B, Ignatiadis N, Kimmey SC, Benson JA, Shrager JB, et al. Mapping lung cancer epithelial-mesenchymal transition states and trajectories with single-cell resolution. Nat Comms 2019;10:5587. [DOI] [PMC free article] [PubMed] [Google Scholar]
- 14.Crowell PD, Fox JJ, Hashimoto T, Diaz JA, Navarro HI, Henry GH, et al. Expansion of Luminal Progenitor Cells in the Aging Mouse and Human Prostate. Cell Rep 2019;28:1499–510.e6 [DOI] [PMC free article] [PubMed] [Google Scholar]
- 15.De Vargas Roditi L, Jacobs A, Rueschoff JH, Bankhead P, Chevrier S, Jackson HW, et al. Single-Cell Proteomics Defines the Cellular Heterogeneity of Localized Prostate Cancer. bioRxiv 2021:2021.01.25.428046 [DOI] [PMC free article] [PubMed] [Google Scholar]
- 16.Liao C-P, Liang M, Cohen MB, Flesken-Nikitin A, Jeong JH, Nikitin AY, et al. Mouse prostate cancer cell lines established from primary and post-castration recurrent tumors. Hormones & cancer 2010;1:44–54 [DOI] [PMC free article] [PubMed] [Google Scholar]
- 17.Karabacak NM, Spuhler PS, Fachin F, Lim EJ, Pai V, Ozkumur E, et al. Microfluidic, marker-free isolation of circulating tumor cells from blood samples. Nat Protoc 2014;9:694–710 [DOI] [PMC free article] [PubMed] [Google Scholar]
- 18.Ebright RY, Lee S, Wittner BS, Niederhoffer KL, Nicholson BT, Bardia A, et al. Deregulation of ribosomal protein expression and translation promotes breast cancer metastasis. Science 2020;367:1468–73 [DOI] [PMC free article] [PubMed] [Google Scholar]
- 19.Miyamoto DT, Zheng Y, Wittner BS, Lee RJ, Zhu H, Broderick KT, et al. RNA-Seq of single prostate CTCs implicates noncanonical Wnt signaling in antiandrogen resistance. Science 2015;349:1351–6 [DOI] [PMC free article] [PubMed] [Google Scholar]
- 20.Creighton CJ. A gene transcription signature of the Akt/mTOR pathway in clinical breast tumors. Oncogene 2007;26:4648–55 [DOI] [PubMed] [Google Scholar]
- 21.Saal LH, Johansson P, Holm K, Gruvberger-Saal SK, She Q-B, Maurer M, et al. Poor prognosis in carcinoma is associated with a gene expression signature of aberrant PTEN tumor suppressor pathway activity. Proc Natl Acad Sci USA 2007;104:7564–9 [DOI] [PMC free article] [PubMed] [Google Scholar]
- 22.Otsu. Threshold Selection Method from Gray-Level Histograms. IEEE Transactions on Systems, Man, and Cybernetics 1979;9:62–6 [Google Scholar]
- 23.Vlietstra RJ, van Alewijk DC, Hermans KG, van Steenbrugge GJ, Trapman J. Frequent inactivation of PTEN in prostate cancer cell lines and xenografts. Cancer Research 1998;58:2720–3 [PubMed] [Google Scholar]
- 24.Maira S-M, Stauffer F, Brueggen J, Furet P, Schnell C, Fritsch C, et al. Identification and characterization of NVP-BEZ235, a new orally available dual phosphatidylinositol 3-kinase/mammalian target of rapamycin inhibitor with potent in vivo antitumor activity. Molecular Cancer Therapeutics 2008;7:1851–63 [DOI] [PubMed] [Google Scholar]
- 25.Carbognin L, Miglietta F, Paris I, Dieci MV. Prognostic and Predictive Implications of PTEN in Breast Cancer: Unfulfilled Promises but Intriguing Perspectives. Cancers (Basel) 2019;11 [DOI] [PMC free article] [PubMed] [Google Scholar]
- 26.Carnero A, Blanco-Aparicio C, Renner O, Link W, Leal JF. The PTEN/PI3K/AKT signalling pathway in cancer, therapeutic implications. Curr Cancer Drug Targets 2008;8:187–98 [DOI] [PubMed] [Google Scholar]
- 27.Robinson D, Van Allen EM, Wu YM, Schultz N, Lonigro RJ, Mosquera JM, et al. Integrative clinical genomics of advanced prostate cancer. Cell Research 2015;161:1215–28 [DOI] [PMC free article] [PubMed] [Google Scholar]
- 28.Brandt R, Sell T, Lüthen M, Uhlitz F, Klinger B, Riemer P, et al. Cell type-dependent differential activation of ERK by oncogenic KRAS in colon cancer and intestinal epithelium. Nat Comms 2019;10:2919. [DOI] [PMC free article] [PubMed] [Google Scholar]
- 29.Herring CA, Banerjee A, McKinley ET, Simmons AJ, Ping J, Roland JT, et al. Unsupervised Trajectory Analysis of Single-Cell RNA-Seq and Imaging Data Reveals Alternative Tuft Cell Origins in the Gut. Cell Systems 2018;6:37–51.e9 [DOI] [PMC free article] [PubMed] [Google Scholar]
- 30.Fisher DAC, Miner CA, Engle EK, Hu H, Collins TB, Zhou A, et al. Cytokine production in myelofibrosis exhibits differential responsiveness to JAK-STAT, MAP kinase, and NFκB signaling. Leukemia 2019;33:1978–95 [DOI] [PMC free article] [PubMed] [Google Scholar]
- 31.Bodenmiller B, Zunder ER, Finck R, Chen TJ, Savig ES, Bruggner RV, et al. Multiplexed mass cytometry profiling of cellular states perturbed by small-molecule regulators. Nature biotechnology 2012;30:858–67 [DOI] [PMC free article] [PubMed] [Google Scholar]
- 32.Mingueneau M, Krishnaswamy S, Spitzer MH, Bendall SC, Stone EL, Hedrick SM, et al. Single-cell mass cytometry of TCR signaling: amplification of small initial differences results in low ERK activation in NOD mice. Proc Natl Acad Sci U S A 2014;111:16466–71 [DOI] [PMC free article] [PubMed] [Google Scholar]
- 33.Sarker D, Ang JE, Baird R, Kristeleit R, Shah K, Moreno V, et al. First-in-human phase I study of pictilisib (GDC-0941), a potent pan-class I phosphatidylinositol-3-kinase (PI3K) inhibitor, in patients with advanced solid tumors. Clin Cancer Res 2015;21:77–86 [DOI] [PMC free article] [PubMed] [Google Scholar]
- 34.Ozkumur E, Shah AM, Ciciliano JC, Emmink BL, Miyamoto DT, Brachtel E, et al. Inertial Focusing for Tumor Antigen–Dependent and –Independent Sorting of Rare Circulating Tumor Cells. Science Translational Medicine 2013;5:179ra47–ra47 [DOI] [PMC free article] [PubMed] [Google Scholar]
- 35.Amir E-AD, Davis KL, Tadmor MD, Simonds EF, Levine JH, Bendall SC, et al. viSNE enables visualization of high dimensional single-cell data and reveals phenotypic heterogeneity of leukemia. Nature Biotechnology 2013;31:545–52 [DOI] [PMC free article] [PubMed] [Google Scholar]
- 36.Nastaly P, Stoupiec S, Popeda M, Smentoch J, Schlomm T, Morrissey C, et al. EGFR as a stable marker of prostate cancer dissemination to bones. Br J Cancer 2020 [DOI] [PMC free article] [PubMed] [Google Scholar]
- 37.Varkaris A, Corn PG, Gaur S, Dayyani F, Logothetis CJ, Gallick GE. The role of HGF/c-Met signaling in prostate cancer progression and c-Met inhibitors in clinical trials. Expert Opin Investig Drugs 2011;20:1677–84 [DOI] [PMC free article] [PubMed] [Google Scholar]
- 38.Yakes FM, Chen J, Tan J, Yamaguchi K, Shi Y, Yu P, et al. Cabozantinib (XL184), a novel MET and VEGFR2 inhibitor, simultaneously suppresses metastasis, angiogenesis, and tumor growth. Mol Cancer Ther 2011;10:2298–308 [DOI] [PubMed] [Google Scholar]
- 39.Dai J, Zhang H, Karatsinides A, Keller JM, Kozloff KM, Aftab DT, et al. Cabozantinib inhibits prostate cancer growth and prevents tumor-induced bone lesions. Clin Cancer Res 2014;20:617–30 [DOI] [PMC free article] [PubMed] [Google Scholar]
- 40.Smith DC, Smith MR, Sweeney C, Elfiky AA, Logothetis C, Corn PG, et al. Cabozantinib in patients with advanced prostate cancer: results of a phase II randomized discontinuation trial. J Clin Oncol 2013;31:412–9 [DOI] [PMC free article] [PubMed] [Google Scholar]
- 41.Hughes VS, Siemann DW. Have Clinical Trials Properly Assessed c-Met Inhibitors? Trends Cancer 2018;4:94–7 [DOI] [PMC free article] [PubMed] [Google Scholar]
- 42.Milton CK, Self AJ, Clarke PA, Banerji U, Piccioni F, Root DE, et al. A Genome-scale CRISPR Screen Identifies the ERBB and mTOR Signaling Networks as Key Determinants of Response to PI3K Inhibition in Pancreatic Cancer. Mol Cancer Ther 2020;19:1423–35 [DOI] [PMC free article] [PubMed] [Google Scholar]
- 43.Hata AN, Niederst MJ, Archibald HL, Gomez-Caraballo M, Siddiqui FM, Mulvey HE, et al. Tumor cells can follow distinct evolutionary paths to become resistant to epidermal growth factor receptor inhibition. Nat Med 2016;22:262–9 [DOI] [PMC free article] [PubMed] [Google Scholar]
- 44.Maheswaran S, Sequist LV, Nagrath S, Ulkus L, Brannigan B, Collura CV, et al. Detection of mutations in EGFR in circulating lung-cancer cells. N Engl J Med 2008;359:366–77 [DOI] [PMC free article] [PubMed] [Google Scholar]
- 45.Yu M, Bardia A, Wittner BS, Stott SL, Smas ME, Ting DT, et al. Circulating breast tumor cells exhibit dynamic changes in epithelial and mesenchymal composition. Science 2013;339:580–4 [DOI] [PMC free article] [PubMed] [Google Scholar]
- 46.Otsu N A Threshold Selection Method from Gray-Level Histograms. IEEE Transactions on Systems, Man, and Cybernetics 1979;9:62–6 [Google Scholar]
- 47.Chen S, Zhu G, Yang Y, Wang F, Xiao YT, Zhang N, et al. Single-cell analysis reveals transcriptomic remodellings in distinct cell types that contribute to human prostate cancer progression. Nat Cell Biol 2021;23:87–98 [DOI] [PubMed] [Google Scholar]
- 48.Lee H, Na KJ, Choi H. Differences in Tumor Immune Microenvironment in Metastatic Sites of Breast Cancer. Front Oncol 2021;11:649004. [DOI] [PMC free article] [PubMed] [Google Scholar]
- 49.Pein M, Oskarsson T. Microenvironment in metastasis: roadblocks and supportive niches. Am J Physiol Cell Physiol 2015;309:C627–38 [DOI] [PubMed] [Google Scholar]
- 50.Jin J-K, Dayyani F, Gallick GE. Steps in prostate cancer progression that lead to bone metastasis. Int J Cancer 2011;128:2545–61 [DOI] [PMC free article] [PubMed] [Google Scholar]
- 51.Nordstrand A, Bovinder Ylitalo E, Thysell E, Jernberg E, Crnalic S, Widmark A, et al. Bone Cell Activity in Clinical Prostate Cancer Bone Metastasis and Its Inverse Relation to Tumor Cell Androgen Receptor Activity. Int J Mol Sci 2018;19 [DOI] [PMC free article] [PubMed] [Google Scholar]
- 52.Ghajar CM, Peinado H, Mori H, Matei IR, Evason KJ, Brazier H, et al. The perivascular niche regulates breast tumour dormancy. Nat Cell Biol 2013;15:807–17 [DOI] [PMC free article] [PubMed] [Google Scholar]
- 53.Lewis Claire E, Harney Allison S, Pollard Jeffrey W. The Multifaceted Role of Perivascular Macrophages in Tumors. Cancer Cell 2016;30:18–25 [DOI] [PMC free article] [PubMed] [Google Scholar]
- 54.Halabi S, Kelly WK, Ma H, Zhou H, Solomon NC, Fizazi K, et al. Meta-Analysis Evaluating the Impact of Site of Metastasis on Overall Survival in Men With Castration-Resistant Prostate Cancer. Journal of clinical oncology : official journal of the American Society of Clinical Oncology 2016;34:1652–9 [DOI] [PMC free article] [PubMed] [Google Scholar]
- 55.Roux PP, Topisirovic I. Signaling Pathways Involved in the Regulation of mRNA Translation. Mol Cell Biol 2018;38 [DOI] [PMC free article] [PubMed] [Google Scholar]
- 56.Mukohara T PI3K mutations in breast cancer: prognostic and therapeutic implications. Breast Cancer (Dove Med Press) 2015;7:111–23 [DOI] [PMC free article] [PubMed] [Google Scholar]
- 57.Markham A Alpelisib: First Global Approval. Drugs 2019;79:1249–53 [DOI] [PubMed] [Google Scholar]
- 58.Juric D, Janku F, Rodon J, Burris HA, Mayer IA, Schuler M, et al. Alpelisib Plus Fulvestrant in PIK3CA-Altered and PIK3CA-Wild-Type Estrogen Receptor-Positive Advanced Breast Cancer: A Phase 1b Clinical Trial. JAMA Oncol 2019;5:e184475. [DOI] [PMC free article] [PubMed] [Google Scholar]
- 59.Voss MH, Gordon MS, Mita M, Rini B, Makker V, Macarulla T, et al. Phase 1 study of mTORC1/2 inhibitor sapanisertib (TAK-228) in advanced solid tumours, with an expansion phase in renal, endometrial or bladder cancer. Br J Cancer 2020 [DOI] [PMC free article] [PubMed] [Google Scholar]
- 60.Hsieh AC, Liu Y, Edlind MP, Ingolia NT, Janes MR, Sher A, et al. The translational landscape of mTOR signalling steers cancer initiation and metastasis. Nature 2012;485:55–61 [DOI] [PMC free article] [PubMed] [Google Scholar]
- 61.Feldman ME, Apsel B, Uotila A, Loewith R, Knight ZA, Ruggero D, et al. Active-site inhibitors of mTOR target rapamycin-resistant outputs of mTORC1 and mTORC2. PLoS Biol 2009;7:e38. [DOI] [PMC free article] [PubMed] [Google Scholar]
- 62.Thoreen CC, Kang SA, Chang JW, Liu Q, Zhang J, Gao Y, et al. An ATP-competitive mammalian target of rapamycin inhibitor reveals rapamycin-resistant functions of mTORC1. J Biol Chem 2009;284:8023–32 [DOI] [PMC free article] [PubMed] [Google Scholar]
- 63.Rodrik-Outmezguine VS, Okaniwa M, Yao Z, Novotny CJ, McWhirter C, Banaji A, et al. Overcoming mTOR resistance mutations with a new-generation mTOR inhibitor. Nature 2016;534:272–6 [DOI] [PMC free article] [PubMed] [Google Scholar]
- 64.Sweeney C, Bracarda S, Sternberg CN, Chi KN, Olmos D, Sandhu S, et al. Ipatasertib plus abiraterone and prednisolone in metastatic castration-resistant prostate cancer (IPATential150): a multicentre, randomised, double-blind, phase 3 trial. Lancet 2021;398:131–42 [DOI] [PubMed] [Google Scholar]
- 65.Smith M, De Bono J, Sternberg C, Le Moulec S, Oudard S, De Giorgi U, et al. Phase III Study of Cabozantinib in Previously Treated Metastatic Castration-Resistant Prostate Cancer: COMET-1. J Clin Oncol 2016;34:3005–13 [DOI] [PubMed] [Google Scholar]
Associated Data
This section collects any data citations, data availability statements, or supplementary materials included in this article.