

Abstract
Background and Aims:
The relationship between alcohol consumption and cirrhosis is well established. Policies that can influence population-level use of alcohol should, in turn, impact cirrhosis. We examined the effect of population-level alcohol control policies on cirrhosis mortality rates in Lithuania –a high-income European Union country with high levels of alcohol consumption.
Methods:
Age-standardized, monthly liver mortality data (deaths per 100,000 adults, aged 15+) from Lithuania were analysed from 2001 to 2018 (n = 216 months) while controlling for economic confounders (gross domestic product and inflation). An interrupted time-series analysis was conducted to estimate the effect of three alcohol control policies implemented in 2008, 2017 and 2018 and the number of cirrhosis deaths averted.
Results:
There was a significant effect of the 2008 (P < .0001) and 2017 (P = .0003) alcohol control policies but a null effect of the 2018 policy (P = .40). Following the 2008 policy, the cirrhosis mortality rate dropped from 4.93 to 3.41 (95% CI: 3.02–3.80) deaths per 100,000 adults, which equated to 493 deaths averted. Further, we found that following the 2017 policy, the mortality rate dropped from 2.85 to 2.01 (95% CI: 1.50–2.52) deaths per 100,000 adults, corresponding to 245 deaths averted.
Conclusions:
Our findings support the hypothesis that alcohol control policies can have a significant, immediate effect on cirrhosis mortality. These policy measures are cost-effective and aid in reducing the burden of liver disease.
Keywords: alcohol policy, alcohol-related liver disease, interrupted time-series analysis, population-level interventions
1 |. INTRODUCTION
Cirrhosis is a major cause of death that has globally increased its proportion of all deaths despite marked decreases of age-standardized mortality rates in low-income countries.1 Alcohol use has long been established as a major risk factor for cirrhosis,2,3 and since the publication of the International Classification of Diseases (ICD-3) in 1920, alcoholic cirrhosis has always been presented as a distinct condition with its own unique code (ICD-10: K70 and ICD-11: DB94.3, DB94.10),4 although it has been widely recognized that the involvement of alcohol is often not recorded on the death certificate,5 so that the combined category of cirrhosis is often used in analyses. The status of alcohol as a risk factor opens the possibility to reduce cirrhosis mortality with population-level public health interventions in addition to proven effective therapies.6
On the individual level, the toxic effects of alcohol on the liver may take many years to accumulate, often resulting in a lagged effect of consumption on mortality rates.7 However, if alcohol use is markedly reduced, in addition to the lagged effects there are immediate effects on mortality at a population level, as several natural experiments have shown, such as the Gorbachev-era reforms of drastically reducing alcohol sales in the Soviet Union,8 the invasion of Paris by the Germans,9 and the introduction of prohibition.10
However, the question of whether less drastic events such as implementing restrictive alcohol control policies (eg increases in excise taxes for alcohol) can also achieve marked reductions in cirrhosis remains. There is some controversy surrounding this idea. While some reviews point to pricing policies and other general population measures as the best practice for alcohol control policies with respect to alcohol-attributable liver disease,11,12 other reviews did not find conclusive evidence in this regard.13,14 For instance, in a systematic review by Nelson13 only two out of nine studies found a significant decrease in cirrhosis after alcohol price increases.
The implementation of increased alcohol excise taxation in 2017 in Lithuania, a high-income European Union member state will be used to analyse the effect of alcohol control policy on cirrhosis mortality. Lithuania has a complex history, both of its governance of control of alcohol, and its alcohol consumption. Lithuania established its independence in 1918, developing its own governance over alcohol control policies, until the 1940s when it was occupied and became part of the Soviet Union. Alcohol regulation became controlled by the Soviet Union, most notably alcohol became more tightly regulated during the Gorbachev-era campaign in the 1980s, a response to an increase in alcohol-attributable mortality. Accordingly, there was an increase in the legal drinking age, reduced availability of alcohol and an increase in alcohol prices, and reduced alcohol production.15 Lithuania later regained its independence in 1990 and simultaneously approved the Provisional Basic Law (an equivalent of temporary Constitution; the new Constitution of the Republic of Lithuania came into effect in 1992). The first few years of Independence Lithuania are marked by a lack of formally established alcohol control policies. One of the first significant measures was the introduction of excise duties on alcohol in 1994, followed by the Law on Alcohol Control in 1995 when a supervisory body and governing act restored state control and the implementation of alcohol control policies.16 Consequently, the cirrhosis trends in Lithuania are also complex. Following a rise and drop in deaths due to the occupation by the Soviet Union and the Gorbachev reform eras respectively, there has been a steady, about fourfold, increase in the cirrhosis mortality rate between the 1990s and 2017.17 Then it started to continuously drop, but in 2019 rates are still at more than twice the level of 1990.18
To this day, despite decreases in consumption, Lithuania continues to have one of the highest alcohol-attributable mortality rates and remains in the upper quintile in levels of consumption per capita.19
In the present work, we aimed to analyse changes in liver mortality rates following the introduction of major alcohol control policies that were expected to have sizeable effects on health outcomes,20 testing both immediate and lagged effects. The policies selected were based on the World Health Organization (WHO) ‘best buys’,21 which are expected to have a substantial impact on alcohol consumption,20 and consequently on cirrhosis rates. Our main hypothesis was that the implementation of such policies would result in a significant immediate reduction in the age-standardized cirrhosis mortality rates.
2 |. METHODS
2.1 |. Data
Mortality data were obtained from the Lithuanian University of Health Sciences which received access to the datasets through Statistics Lithuania (data from 2001 to 2009) and the Lithuanian Institute of Hygiene (data from 2010 to 2018). The dataset contained cirrhosis death counts (ICD-10 codes K70 and K74: cirrhosis and alcoholic cirrhosis, respectively) by sex and age for all months between January 2001 and December 2018. Deaths were grouped into five-year age groups up to age 84, with another group denoting people ages 85 years and older. Analyses were performed separately for men and women, and for both sexes combined. Based on experiences that alcoholic cirrhosis is often not coded correctly,22,23 and based on changes of coding practices in Lithuania for this condition,24 we collapsed all kinds of cirrhosis into one category in the main analysis, with a sensitivity analysis of only alcoholic cirrhosis presented in the Supplementary Materials. In total, the dataset contains mortality data spanning the entire 18-year period (n = 216 months).
2.2 |. Dependent variable
The dependent variable measured was monthly cirrhosis mortality rate per 100,000 population computed for the age group 15+ years; standardized using WHO standard.25 As only yearly population data were available, we performed a linear interpolation to derive monthly population values in order to calculate monthly mortality rates.
2.3 |. Key influencing factors
We selected three alcohol policies based on the WHO ‘best buys’ framework, which are classified as the most cost-effective, and based on those expected to have the strongest immediate impact on alcohol consumption (ie those classified as ‘Tier 1’ by Rehm et al 202120). Specifically, among all of the ‘best buys’ (taxation, bans on advertising, restriction of availability), criteria were determined to evaluate the relative strength of the intervention: for taxation, we selected only taxation changes which were large enough to result in less affordability for the following year (based on data on alcohol affordability from Statistics Lithuania, demonstrating that the disposable income increased less than the average price for alcoholic beverages26). The alcohol taxation policy changes on 1 January 2008, and 1 March 2017, fulfilled these criteria, and are analysed here as Policy 1 and Policy 2 respectively. With respect to availability, we selected policies that fulfilled the criteria of marked decreases in general availability, for example by a reduction in opening hours (for comparable effect sizes27). Based on this criterion, 1 January 2018, was selected and analysed as Policy 3. Since the effect of a ban on marketing was expected to be delayed by several years, we did not anticipate these effects to be a primary driver for an immediate change in liver mortality rates. However, it should be noted that a ban on advertising was implemented at the same time as taxation during Policy 1, thus this effect should be considered when interpreting the effect of this event on the time series. The exact policies are described in Table 1 and were implemented on 1 January 2008 (Policy 1), 1 March 2017 (Policy 2) and 1 January 2018 (Policy 3, see Supplementary Table S9 for a general overview of all alcohol control policies introduced from 2001 to 2018; for more detailed breakdown of policies, see also Miščikienė et al16).
TABLE 1.
List of alcohol control policies used in the analysis
| Policy | Description | Date enacted |
|---|---|---|
| Policy 1 | Changes to drinking and driving legislation: | 1 January 2008 |
| Increased fines for drinking and driving | ||
| Consequences now include car impoundment or a prison sentence | ||
| Legally allotted blood alcohol content reduced from 0.4 to 0.2 permille for young drivers (*equivalent =change from 0.04% to 0.02% BAC) | ||
| Changes to advertising legislation: | ||
| Alcohol advertising is banned on TV and radio between 6 AM and 11 PM | ||
| Changes to taxation: | ||
| Excise tax increased by 10%–20% | ||
| Policy 2 | Changes to taxation: | 1 March 2017 |
| Excise tax increased by 112% for beer, 111% for wine and 23% for ethyl alcohol (relevant for spirits pricing) | ||
| Policy 3 | Changes to alcohol availability: | 1 January 2018 |
| Legal age for purchasing and consuming alcohol is increased from 18 years old to 20 years old. | ||
| Alcohol vendors are obliged to ask for identification for individuals appearing younger than 25 years old | ||
| Off-site alcohol sales (ie not at restaurants and bars) are restricted and kept between the hours of 10 AM and 8 PM | ||
| Changes to advertising legislation: | ||
| Full ban of alcohol advertising on TV and radio, with exception to printed logos |
2.4 |. Economic control variables
To account for possible confounding factors, we considered the following four variables in the analyses: gross domestic product (GDP), inflation rates (consumer price index, CPI), the economic crisis (dummy coded as occurring from October 2008 to December 200928) and unemployment rates.26 When all variables were included in a model, the economic crisis variable and unemployment rates were not significant predictors of mortality rates and thus were excluded from our analyses. GDP more accurately represents an indicator of changes in income and is a key driver for affordability, and thus an important confounding variable for studies of the effects of taxation increases on mortality. Similarly, but in the opposite direction, inflation rates were included in the models to account for a reduced impact of taxation increases, as taxation law in Lithuania consists of fixed excise duties on alcoholic beverages, which decrease in value with inflation.
2.5 |. Statistical analyses
We analysed basic descriptive statistics of the dataset (eg average mortality rates for men and for women, cirrhosis average mortality rate for each age group). To address our hypothesis that alcohol control policies can reduce the burden of cirrhosis, we performed interrupted time-series analyses by employing a generalized additive mixed model (GAMM29). In the GAMM, seasonality was adjusted by adding a smoothing term that was a cyclic cubic spline with 12 knots (ie a monthly pattern). Residuals were examined with plots of the autocorrelation function and partial autocorrelation function to determine the orders of auto-regressive (AR) and moving average (MA) series and were controlled for by using the Box-Jenkins method (ARIMA (p, d, q) model, where p, q and d are the order of autoregression, differencing and moving averages). Next, we introduced the effects of the three policies implemented during the time series. Given that cirrhosis is a chronic disease that develops over a number of years,30 we expected some lagged effects of alcohol control policy, before the peak impact of reduced consumption would appear. However, natural experiments such as the Gorbachev-era reforms or the German invasion into Paris, have consistently shown that the main effect of reducing alcohol availability is almost immediate.31 We specified lag-periods based on Holmes and colleagues7 assuming the full effect of the policy to accrue within a 2-year period (60% for the first month after policy enactment, 85% for the following 11 months, 90% for the following 12 months, and 100% for the remainder of the time series).
In a sensitivity analysis, we also examined the assumption of an abrupt full effect without lags (see Supplementary Materials). To estimate the impact of the significant policy effects, we produced a counterfactual estimate of the mortality rate for the policies. Based on the methods of Jiang et al,32 for each significant policy, we created a GAMM model for the mortality rates leading up to their implementation based on the covariates only. We then used these counterfactual GAMM models (models without the policy effect included) to predict the mortality rate for the 12 months following the introduction of the policy. Each counterfactual model included the economic covariates, seasonal effect and autoregressive effects (see Supplementary Table S8 for full details of counterfactual models). As indicated above, a sensitivity analysis was also conducted for alcoholic cirrhosis (ICD-10 code K70) specifically. All analyses were performed using R version 4.0.2.33
3 |. RESULTS
As expected, there was a significantly higher cirrhosis mortality rate among men (3.60 ± 1.15 deaths per 100,000 adults) when compared to women (1.46 ± 0.50 deaths per 100,000 adults; Welch’s t test, t(293.39) = −25.13, P < .0001). The highest average mortality rate was among middle-aged (60–64 years old) adults (6.28 ± 2.78 deaths per 100,000 adults, see Table 2 and Figure 1).
TABLE 2.
Descriptive statistics of average monthly cirrhosis mortality rate separated by sex and 5-year age groups
| Average monthly mortality rate (deaths per 100,000) |
||
|---|---|---|
| Age group | Males | Females |
| 15–19 | 0 | 0 |
| 20–24 | 0 | 0 |
| 25–29 | 0.01 | 0 |
| 30–34 | 0.09 | 0.03 |
| 35–39 | 0.66 | 0.20 |
| 40–44 | 1.75 | 0.58 |
| 45–49 | 3.24 | 1.13 |
| 50–54 | 4.95 | 1.69 |
| 55–59 | 6.52 | 2.38 |
| 60–64 | 7.80 | 3.08 |
| 65–69 | 7.89 | 4.08 |
| 70–74 | 8.74 | 4.47 |
| 75–79 | 7.55 | 2.85 |
| 80–84 | 4.78 | 1.80 |
| 85+ | 3.55 | 1.47 |
FIGURE 1.
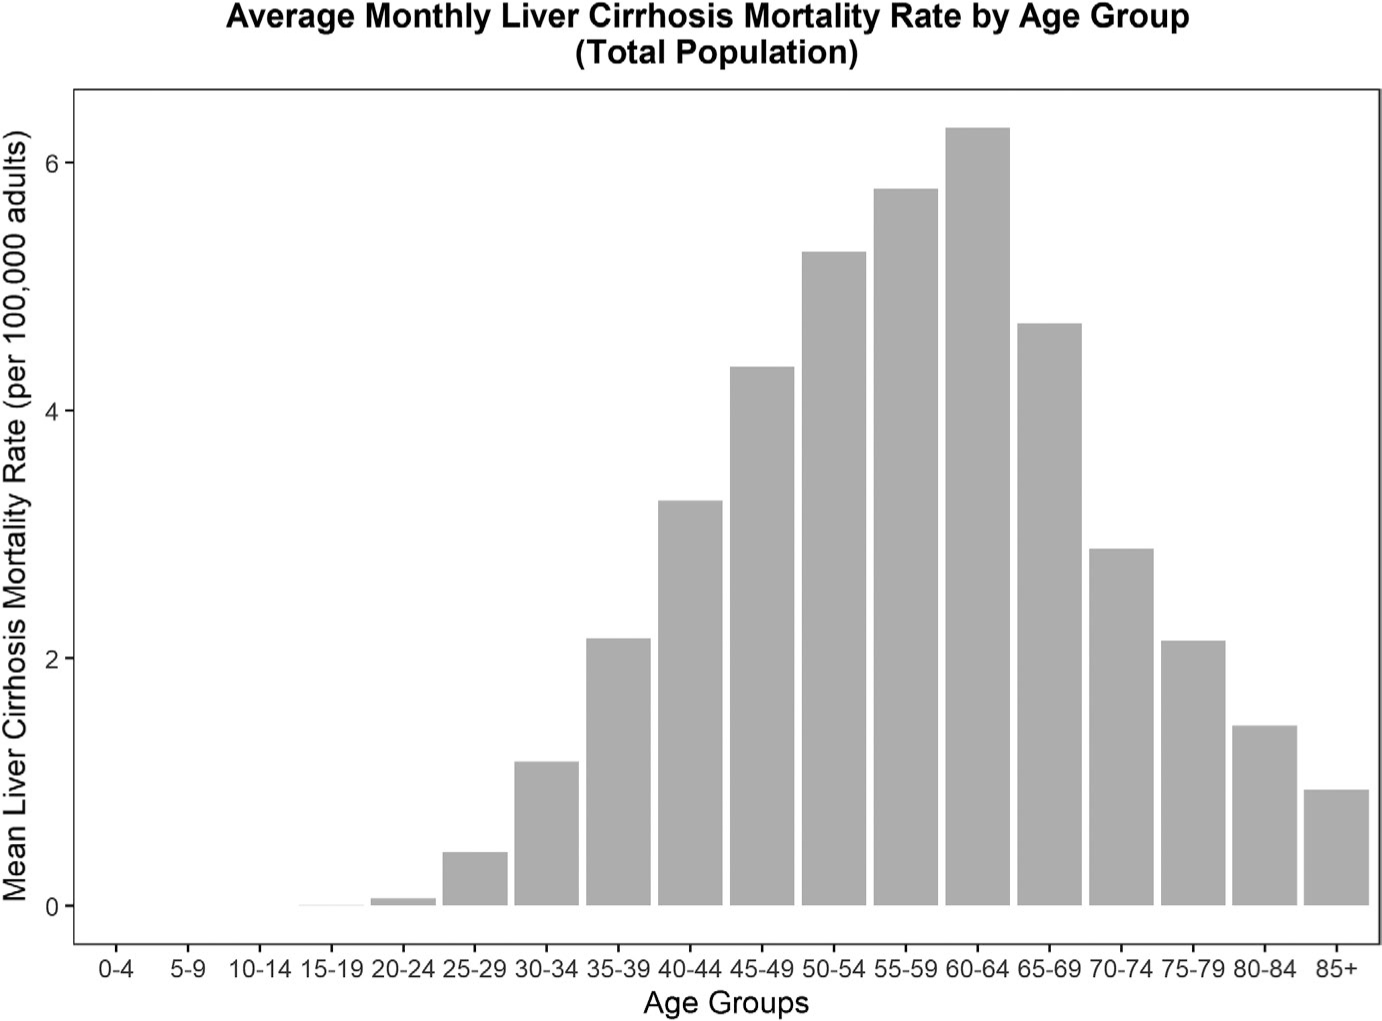
Distribution of mean monthly cirrhosis mortality rate (deaths per 100,000 adults) from 2001 to 2018, separated by 5-year age groups, and for both sexes combined
The model explained over 60% (adjusted-R2 = 0.65) of the variance in cirrhosis mortality. In the model, the effect of GDP was significant and had a positive correlation with the cirrhosis mortality rate (ie the higher the GDP, the higher the cirrhosis rate); in addition, the effect of inflation was significant and had a positive correlation with cirrhosis (see Figure 2). In the model, there was also a significant effect of Policy 1 and Policy 2 on mortality, with both policies leading to decreased mortality rates, but no effect of Policy 3 (see Table 3). Separate analyses for men and women indicated that for each sex, there was also a significant, negative association of Policy 1 and Policy 2 on cirrhosis mortality rates. There was a slightly better fit of the model in males (adjusted-R2 = 0.62) compared to females (adjusted-R2 = 0.54) as indicated by a higher R2, however, both sexes had similar sized standardized effects for each respective policy (Policy 1 males, Cohen’s d = 0.62, Policy 1 females, Cohen’s d = 0.82, Policy 2 males, Cohen’s d = 0.51, Policy 2 females, Cohen’s d = 0.73, See Table 3).
FIGURE 2.
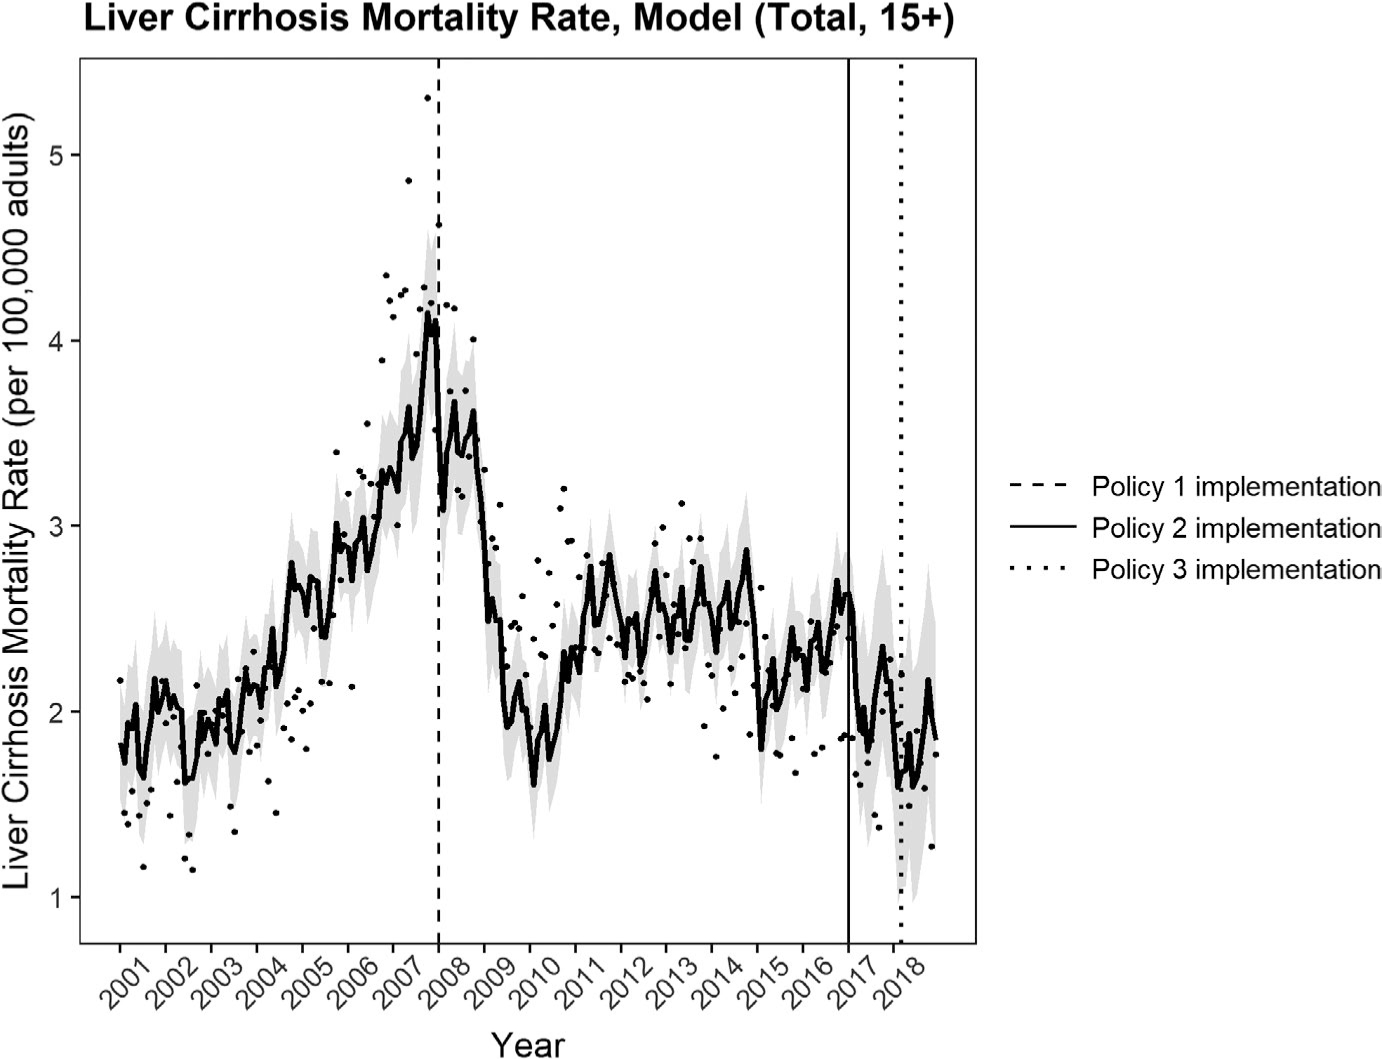
General additive mixed model (GAMM) of cirrhosis mortality rate (deaths per 100,000 adults, 15+ years of age), as predicted by GDP and inflation, and 3 policy effects with seasonality and ARIMA (auto-regressive, integrated moving average) terms (black line). Rates presented are for both sexes combined and are age-standardized according to the WHO standard, 95% Cis are also shown in light grey. Policy 1 and Policy 2 were significant (raw observed mortality rates (also age-standardized to WHO standard) of cirrhosis mortality rate (points))
TABLE 3.
Model statistics for the effects of alcohol control policy, GDP and CPI on cirrhosis mortality rates (deaths per 100,000 adults, aged 15+)
| Estimated effect | Standard Error | t-value | p-value | Adjusted-R2 | |
|---|---|---|---|---|---|
| Modelled policy effects (Total population) | 0.65 | ||||
| Intercept | 1.20 | 0.25 | 4.77 | P < .0001 | |
| GDP | 0.00064 | 0.00013 | 4.88 | P < .0001 | |
| CPI | 0.080 | 0.022 | 3.81 | P = .00019 | |
| Policy 1 (January 2008) | −1.28 | 0.28 | −4.50 | P < .0001 | |
| Policy 2 (March 2017) | −1.13 | 0.31 | −3.66 | P = .0003 | |
| Policy 3 (January 2018) | −0.42 | 0.50 | −0.85 | P = .40 | |
| Seasonality (smooth term) | P < .0001 | ||||
| ARIMA (1,1,1) | |||||
| Modelled policy effects (Men) | 0.62 | ||||
| Intercept | 1.85 | 0.36 | 5.07 | P < .0001 | |
| GDP | 0.00091 | 0.00019 | 4.69 | P < .0001 | |
| CPI | 0.14 | 0.033 | 4.31 | P < .0001 | |
| Policy 1 (January 2008) | −1.86 | 0.41 | −4.51 | P < .0001 | |
| Policy 2 (March 2017) | −1.84 | 0.50 | −3.68 | P = .00030 | |
| Policy 3 (January 2018) | −0.59 | 0.75 | −0.79 | P = .42 | |
| Seasonality (smooth term) | P < .0001 | ||||
| ARIMA (1,1,1) | |||||
| Modelled policy effects (Women) | 0.54 | ||||
| Intercept | 0.59 | 0.10 | 5.58 | P < .0001 | |
| GDP | 0.00041 | 0.000057 | 7.07 | P < .0001 | |
| CPI | 0.067 | 0.010 | 6.48 | P < .0001 | |
| Policy 1 (January 2008) | −0.72 | 0.12 | −5.90 | P < .0001 | |
| Policy 2 (March 2017) | −0.90 | 0.17 | −5.30 | P < .0001 | |
| Policy 3 (January 2018) | 0.012 | 0.23 | 0.052 | P = .96 | |
| Seasonality (smooth term) | P = .11 | ||||
| ARIMA (1,1,1) |
Abbreviations: AR, autoregressive; CPI, consumer price index, GDP, gross domestic product (in USD) per capita; I, integrated; MA, moving average, with respective coefficients (q,d,p).
According to the model, in the 12-month period following 1 January 2008, the average monthly mortality rate was 3.41 (95% CI = 3.02, 3.80) deaths per 100,000 adults, translating to an estimated 1,108 (95% CI = 983, 1,234) deaths in 2008. We compared this estimated mortality rate to the counterfactual estimate, which predicted a mortality rate following the policy of 4.93 (95% CI = 4.49, 5.36) deaths per 100,000 adults, translating to an estimated 1,601 (95% CI = 1,460, 1,742) deaths in 2008, suggesting that 493 (95% CI = 477, 508) deaths were averted due to Policy 1 (see Figure 2). Following Policy 2 (1 March 2017, increased taxation), between March 2017 to April 2018 the mortality rate was estimated to be 2.01 (95% CI = 1.50, 2.52) deaths per 100,000 adults, translating to 580 (95% CI = 489, 727) deaths during that 12-month period. The counterfactual model estimated a mortality rate of 2.86 (95% CI = 2.47, 3.25) deaths per 100,000 adults, translating to an estimated 825 (95% CI = 713, 937) deaths during that same 12-month period and suggesting that 245 (95% CI = 209, 279) deaths were averted due to Policy 2 (see Figure 3, See Supplementary Materials for sex-specific results). Given that Policy 3 was not significant, we did not translate the effect into deaths averted.
FIGURE 3.
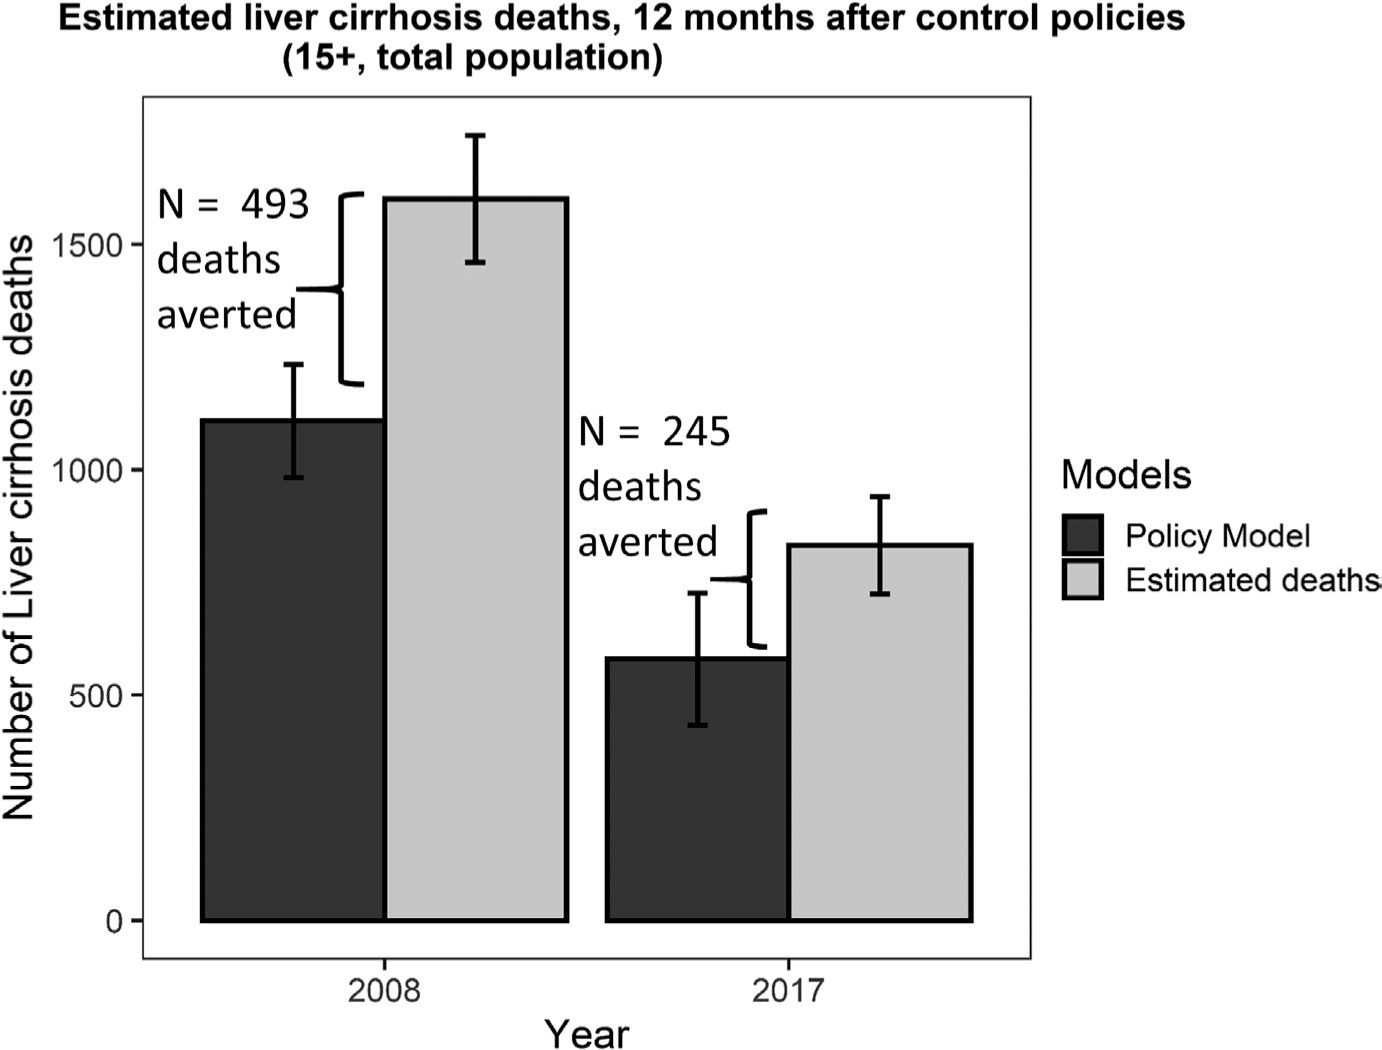
Estimated number of cirrhosis deaths as predicted by the model (black) and as predicted by the counterfactual GAMM model (grey). Significant policies included Policy 1 in January 2008, and Policy 2 in March 2017, estimates were made for the 12-month period after the implementation of each policy, with 95% Cls. Estimated deaths averted were computed as the difference between the policy model and the counterfactual GAMM model: 493 deaths averted following Policy 1 and 245 deaths averted following Policy 2
In our sensitivity analyses, we also analysed a model where the effects of Policies 1–3 were dummy coded (ie no lagged structure, with an immediate, maximal effect). The results of this analysis showed that the non-lagged effects were very similar to the lagged effects (see Supplementary Material). In another sensitivity analysis, the same models were tested on deaths coded specifically as alcoholic cirrhosis mortality rates (see Supplementary Materials).
4 |. DISCUSSION
We found that two out of three alcohol control policies evaluated in this study were associated with an immediate reduction in cirrhosis mortality rates, for both men and women, as well as each sex separately. In women, the mortality rate was half that of men, however, the standardized effect was similar between the sexes indicating that although the estimated effect of the policies in females was a decrease of less than 1 death per 100,000 adults per month, the relative impact of the policy effects was equal to that of males. Thus, it appears that the policies have a significant impact, even when there is a relatively low number of monthly deaths. Another notable difference between the genders was that there was no seasonal variation in mortality rates in women, while there was in men. In sum, across all analyses, our models showed that cirrhosis mortality rates declined following the enactment of Policy 1 (January 2008) and Policy 2 (March 2017). Notably, the immediate decline in mortality rates following Policy 1 from 4.93 to 3.41 (approximately 30.4%) was, in a relative sense, similar to Policy 2 (from 2.86 to 2.01, approximately 29.4%). Notably, the individuals between the ages of 45 and 64 appear to have the highest mortality rates due to cirrhosis (peaking in the 60–64 age group for both sexes); meanwhile younger age groups have a much lower mortality rate due to cirrhosis (one half to one-third of the average monthly rate), emphasizing the fact that it is a chronic condition. Yet, in the present paper, we showed that there were immediate declines in mortality rates following two of the policy implementations.
It is worth pointing out that Policy 1 included several alcohol control policy measures which included taxation, whereas Policy 2 only involved increases in alcohol excise taxation. There was also a combination of other factors occurring around 2008. In Lithuania, the period of rapid economic growth between 2001 and 2007 was marked by a doubling of alcoholic cirrhosis deaths. We were able to control for these economic confounds (eg inflation and GDP were used as covariates), allowing for a more robust test of the policy effects and lending support for our hypothesis that these effects in our models were due specifically to the alcohol control policies. In addition to the named interventions (Table 1), in 2008, the ‘Year of Sobriety’ was declared. The social and political change, overlap of multiple policies and the economic recession in 2008 gives us reason to be cautious about claiming the effects found for Policy 1 were due to any one alcohol policy intervention (ie taxation only). Others have found similar results, such that there was a dramatic decrease in mortality in Lithuania around 2008, but unlike their work, we controlled for economic indicators and thus provide more convincing support for the impact of alcohol policy on mortality.28 Still, it is also possible that the changing social and political climate played a role in the apparent fall of cirrhosis mortality rates in 2008. For instance, the widespread economic shock due to the recession and its effect on alcohol consumption and alcohol-related disease may have affected individuals across the socioeconomic spectrum differently.34 Thus, analyses of how economic hardship affects cirrhosis rates for various groups may be an avenue for future studies.
Our findings are consistent, however, with other research that shows that significant changes in per capita alcohol consumption predict changes in liver disease mortality rates. 35,36 We also show that alcohol policies can have significant, immediate effects on cirrhosis, a chronic disease. It was surprising that restricting opening hours of alcohol sales (a ‘best buy’ policy included in Policy 3) had no discernable effect on cirrhosis mortality rates, but this null finding may be due to its position in the time series, that is, the policy was implemented towards the end of the dataset with insufficient data points to establish this effect. A recent simulation study found that when policy effects are positioned towards the end of a dataset, the estimated impact of a policy effect may not be as accurately captured with an interrupted time-series analysis.32 In addition, the null effect of the various measures in Policy 3 may also have been be due to the fact that this intervention is expected to have more of an impact on causes of death associated with acute harm due to alcohol (rather than a chronic disease)37–39 or in the case of advertisement and marketing restrictions, have more long term effects via changing the culture.40 In addition, this policy was at the end of a longer period of a collection of alcohol policies, notably, the significant effects of Policy 2, which may have interacted with Policy 3. In this paper, we focus on the immediate effects of alcohol control policy on cirrhosis deaths, as longer-term trends are difficult to model correctly with interrupted time-series analysis.29 Longitudinal trends are affected by multiple, interacting factors and can have various specifications. In future work, it may be possible to test different longitudinal models of restricting alcohol availability on cirrhosis deaths once more data is available for analysis. In addition, future studies may aim to better separate the results of our time-series analyses to investigate and compare the individual effects of each policy. That is, what policies specifically, were most effective in reducing cirrhosis mortality, and how long did these effects last? It is probably that this would be best modelled with daily data on cirrhosis hospitalizations and a longer time series.
Due to the coding practices for cirrhosis in Lithuania, alcoholic and non-alcoholic cirrhosis deaths were not separated in the present study. Specifically, there seems to be a tendency to code cirrhosis as non-alcoholic, given the social perceptions and political stigma surrounding the heavy drinking culture in Lithuania. Therefore, there is a reason to believe that the alcoholic cirrhosis rates are underestimated.22,23 In general, deaths due to alcohol-attributable conditions are associated with a large degree of stigma, often leading to highly underestimated reports (for a classic paper see Puffer23; for a recent review see Rehm et al22). Noteworthy, however, the tendency to code alcohol-attributable condition as non-alcohol-attributable conditions would not affect the findings if the under-reporting of alcohol-attributable conditions were constant over time. However in the case of Lithuania, there were continued attempts to improve the coding practices for 100% alcohol-attributable causes of deaths, with the most recent attempt being in 2019.24 For this reason, we chose all cirrhosis as the more reliable measure for our analyses. However, the sensitivity analysis with alcoholic cirrhosis showed a nearly identical effect of alcohol policy on mortality rates (full detailed statistics can be found in the Supplementary Materials). One limitation of the study, however, was that we analysed mortality rates due to cirrhosis, and not necessarily deaths that had cirrhosis as an accompanying disease.
Overall, the present paper demonstrates that alcohol control policy measures directed at the general population can have a meaningful impact on cirrhosis mortality rates in a high-income European country. These findings are particularly encouraging given that the policies implemented are part of the WHO’s ‘best buys’ – that is to say, they are interventions that are feasible, cost-effective and have the potential to have a significant impact on alcohol-attributable deaths. The study highlights the importance of implementing effective policy interventions in addition to individual-level interventions, in order to reduce the burden of liver disease.
Supplementary Material
Key points.
Some countries in the European region have among the highest levels of alcohol consumption globally. Given the strong association between alcohol consumption and cirrhosis, we explored the link between alcohol control policies introduced in Lithuania (namely high alcohol taxation and availability restrictions) and their effect on cirrhosis deaths. We found that taxation policies in 2008 and 2017 resulted in significant immediate declines in cirrhosis mortality in Lithuania, indicating that population-level policies related to alcohol can have a substantial impact on liver disease.
ACKNOWLEDGEMENTS
The authors would like to thank Kawon Victoria Kim and Sean Feng for their helpful comments on earlier versions of the manuscript. Research reported in this publication was supported by the National Institute on Alcohol Abuse and Alcoholism (NIAAA) of the National Institutes of Health.
Funding information
The NIAAA grant (Award Number 1R01AA028224) supported the research in this paper, however it played no role in the design, data collection, analyses, interpretation, writing or decision to submit this article.
Abbreviations:
- ARIMA
Autoregressive integrated moving average
- BAC
Blood alcohol content
- CPI
Consumer Price Index
- GAMM
General additive mixed model
- GDP
Gross Domestic Product
- ICD
International Classification of Diseases
- WHO
World Health Organization.
Footnotes
CONFLICT OF INTEREST
All authors declare no competing interests.
SUPPORTING INFORMATION
Additional supporting information may be found in the online version of the article at the publisher’s website.
DATA AVAILABILITY STATEMENT
The data used in the current study can be obtained by request through Lithuanian Governmental institutions (Lithuanian Institute of Hygiene, Statistics Lithuania). The R coding script used to analyse and compute variables for the current study is available from the corresponding author upon request.
REFERENCES
- 1.World Health Organization Global Health Estimates; 2019. Available from: https://www.who.int/data/globalhealthestimates Accessed June 22, 2021.
- 2.Rush B An inquiry into the effects of ardent spirits upon the human body and mind: With an account of the means of preventing, and of the remedies for curing them, 8th edition. Boston: James Loring; 1823. https://www.google.com.au/books/edition/An_Inquiry_Into_the_Effects_of_Ardent_Sp/-6UoAAAAYAAJ?hl=en&gbpv=0 Accessed Jan 23, 2022. [Google Scholar]
- 3.Rehm J, Gmel GE, Gmel G, et al. The relationship between different dimensions of alcohol use and the burden of disease-an update. Addiction. 2017;112(6):968–1001. [DOI] [PMC free article] [PubMed] [Google Scholar]
- 4.Wolfbane.com International List of Causes of Death, Revision 3 (1920); 2020. Available from: http://www.wolfbane.com/icd/icd3h.htm Accessed April 04, 2021.
- 5.Kemp I, Carstairs V. The reliability of death certification as a measure of the level of alcohol problems. J Public Health. 1987;9(2):146–151. [PubMed] [Google Scholar]
- 6.Liver EAftSot. EASL Clinical Practice Guidelines: management of alcohol-related liver disease. J Hepatol. 2018;69(1):154–181. [DOI] [PubMed] [Google Scholar]
- 7.Holmes J, Meier PS, Booth A, Guo Y, Brennan A. The temporal relationship between per capita alcohol consumption and harm: a systematic review of time lag specifications in aggregate time series analyses. Drug Alcohol Depend. 2012;123(1–3):7–14. [DOI] [PubMed] [Google Scholar]
- 8.Leon DA, Chenet L, Shkolnikov VM, et al. Huge variation in Russian mortality rates 1984–94: artefact, alcohol, or what? Lancet. 1997;350(9075):383–388. [DOI] [PubMed] [Google Scholar]
- 9.Fillmore KM, Roizen R, Farrell M, Kerr W, Lemmens P. Wartime Paris, cirrhosis mortality, and the ceteris paribus assumption. J Stud Alcohol. 2002;63(4):436–446. [DOI] [PubMed] [Google Scholar]
- 10.Chrystoja BR, Rehm J, Crépault JF, Shield K. Effect of alcohol prohibition on liver cirrhosis mortality rates in Canada from 1901 to 1956: a time-series analysis. Drug Alcohol Rev. 2020;39(6):637–645. [DOI] [PubMed] [Google Scholar]
- 11.Ventura-Cots M, Ballester-Ferré MP, Ravi S, Bataller R. Public health policies and alcohol-related liver disease. JHEP Rep. 2019;1(5):403–413. [DOI] [PMC free article] [PubMed] [Google Scholar]
- 12.Wagenaar AC, Tobler AL, Komro KA. Effects of alcohol tax price policies on morbidity and mortality: a systematic review. Am J Public Health. 2010;100(11):2270–2278. [DOI] [PMC free article] [PubMed] [Google Scholar]
- 13.Nelson JP. Does heavy drinking by adults respond to higher alcohol prices and taxes? A survey and assessment. Econ Anal Policy. 2013;43(3):265–291. [Google Scholar]
- 14.Nelson JP, McNall AD. Alcohol prices, taxes, and alcohol-related harms: a critical review of natural experiments in alcohol policy for nine countries. Health Policy. 2016;120(3):264–272. [DOI] [PubMed] [Google Scholar]
- 15.Bhattacharya J, Gathmann C, Miller G. The Gorbachev anti-alcohol campaign and Russia’s mortality crisis. Am Econ J Appl Econ. 2013;5(2):232–260. [DOI] [PMC free article] [PubMed] [Google Scholar]
- 16.Miščikienė L, Goštautaitė Midttun N, Galkus L, et al. Review of the Lithuanian Alcohol Control Legislation in 1990–2020. Int J Environ Res Public Health. 2020;17(10):3454. [DOI] [PMC free article] [PubMed] [Google Scholar]
- 17.Sepanlou SG, Safiri S, Bisignano C, et al. The global, regional, and national burden of cirrhosis by cause in 195 countries and territories, 1990–2017: a systematic analysis for the Global Burden of Disease Study 2017. Lancet Gastroenterol Hepatol. 2020;5(3):245–266. [DOI] [PMC free article] [PubMed] [Google Scholar]
- 18.Institute for Health Metrics and Evaluation (IHME). Lithuania country profile. IHME, University of Washington; 2021. [Available from: http://www.healthdata.org/lithuania] Accessed November 17, 2021. [Google Scholar]
- 19.World Health Organization Global status report on alcohol and health 2018.2018. 05/20/2019. Available from: https://www.who.int/substance_abuse/publications/global_alcohol_report/en/ Accessed June 8, 2021.
- 20.Rehm J, Stelemekas M, Ferreira-Borges C, et al. Classifying alcohol control policies with respect to expected changes in consumption and alcohol-attributable harm: the example of Lithuania. Int J Environ Res Public Health. 2021;18(5):2419. [DOI] [PMC free article] [PubMed] [Google Scholar]
- 21.World Health Organization. Tackling NCDs:‘best buys’ and other recommended interventions for the prevention and control of noncommunicable diseases. (No. WHO/NMH/NVI/17.9). World Health Organization; 2017. [Google Scholar]
- 22.Rehm J, Hasan OSM, Imtiaz S, Neufeld M. Quantifying the contribution of alcohol to cardiomyopathy: a systematic review. Alcohol. 2017;61:9–15. [DOI] [PubMed] [Google Scholar]
- 23.Puffer RR & Griffith GW Patterns of urban mortality: Report of the Inter-American investigation of mortality; report of the Inter-American investigation of mortality. Patterns of urban mortality: Report of the Inter-American investigation of mortality; report of the Inter-American investigation of mortality, 1967. p. 353.
- 24.Cicėnienė V, Mekšriūnaitė S, Malinauskiene N & Regina S MEDICININIO MIRTIES LIUDIJIMO PILDYMAS Vilnius; 2019. Available from: https://hi.lt/uploads/pdf/padaliniai/MPR/MML_rekomendacijos.pdf
- 25.Ahmad OB, Boschi-Pinto C, Lopez AD, Murray CJ, Lozano R, Inoue M. Age standardization of rates: a new WHO standard. Geneva: World Health Organization; 2001:9(10). [Google Scholar]
- 26.Lithuanian Department of Statistics Official Statistics Portal 2020. Available from: https://www.stat.gov.lt/tyrimai-ir-analizes Accessed July 10, 2020.
- 27.Cook WK, Bond J, Greenfield TK. Are alcohol policies associated with alcohol consumption in low-and middle-income countries?. Addiction. 2014;109(7):1081–1090. 10.1111/add.12571 [DOI] [PMC free article] [PubMed] [Google Scholar]
- 28.Stumbrys D, Telksnys T, Jasilionis D, et al. Alcohol-related male mortality in the context of changing alcohol control policy in Lithuania 2000–2017. Drug Alcohol Rev. 2020;39(7):818–826. [DOI] [PubMed] [Google Scholar]
- 29.Beard E, Marsden J, Brown J, et al. Understanding and using time series analyses in addiction research. Addiction. 2019;114(10):1866–1884. [DOI] [PubMed] [Google Scholar]
- 30.Schuppan D, Afdhal NH. Liver cirrhosis. Lancet. 2008;371(9615): 838–851. [DOI] [PMC free article] [PubMed] [Google Scholar]
- 31.Zatonski WA, Sulkowska U, Manczuk M, et al. Liver cirrhosis mortality in Europe, with special attention to Central and Eastern Europe. Eur Addict Res. 2010;16(4):193–201. [DOI] [PubMed] [Google Scholar]
- 32.Jiang H, Feng X, Lange S, Tran A, Manthey J & Rehm J Estimating effects of health policy interventions using interrupted time series analyses: a simulation study. (under review). [DOI] [PMC free article] [PubMed]
- 33.R Development Core Team. R: A language and environment for statistical computing, 4.0.2th.0.2 ed. Vienna, Austria: R Foundation for Statistical Computing; 2010. https://www.R-project.org/ [Google Scholar]
- 34.Jones L, Bates G, McCoy E, Bellis MA. Relationship between alcohol-attributable disease and socioeconomic status, and the role of alcohol consumption in this relationship: a systematic review and meta-analysis. BMC Public Health. 2015;15(1):1–14. [DOI] [PMC free article] [PubMed] [Google Scholar]
- 35.Jiang H, Livingston M, Room R, Dietze P, Norström T, Kerr WC. Alcohol consumption and liver disease in Australia: a time series analysis of the period 1935–2006. Alcohol Alcohol. 2014;49(3):363–368. [DOI] [PMC free article] [PubMed] [Google Scholar]
- 36.Ramstedt M. Population drinking and liver cirrhosis mortality: is there a link in eastern Europe? Addiction. 2007;102(8):1212–1223. [DOI] [PubMed] [Google Scholar]
- 37.Sanchez-Ramirez DC, Voaklander D. The impact of policies regulating alcohol trading hours and days on specific alcohol-related harms: a systematic review. Injury Prev. 2018;24(1):94–100. [DOI] [PubMed] [Google Scholar]
- 38.Sanchez AI, Villaveces A, Krafty RT, et al. Policies for alcohol restriction and their association with interpersonal violence: a time-series analysis of homicides in Cali, Colombia. Int J Epidemiol. 2011;40(4):1037–1046. [DOI] [PMC free article] [PubMed] [Google Scholar]
- 39.Wilkinson C, Livingston M, Room R. Impacts of changes to trading hours of liquor licences on alcohol-related harm: a systematic review 2005–2015. Public Health Res Pract. 2016;26(4):e2641644. [DOI] [PubMed] [Google Scholar]
- 40.Babor TF, Casswell S, Graham K, et al. Alcohol: no ordinary commodity. Research and public policy, 3rd ed. Oxford University Press; in press. [Google Scholar]
Associated Data
This section collects any data citations, data availability statements, or supplementary materials included in this article.
Supplementary Materials
Data Availability Statement
The data used in the current study can be obtained by request through Lithuanian Governmental institutions (Lithuanian Institute of Hygiene, Statistics Lithuania). The R coding script used to analyse and compute variables for the current study is available from the corresponding author upon request.