Abstract
Haematopoietic stem cells (HSCs) home to the bone marrow (BM) via, in part, the interactions with Vascular Cell Adhesion Molecule-1 (VCAM1)1–3. Once into the BM, HSCs are vetted by perivascular phagocytes to ensure their self-integrity. Here, we show that VCAM1 is also expressed on healthy HSCs and upregulated on leukaemic stem cells (LSCs) where it serves as a quality-control checkpoint for entry into BM by providing ‘don’t-eat-me’ stamping in the context of major histocompatibility complex (MHC) class-I presentation. While haplotype-mismatched HSCs can engraft, Vcam1 deletion, in the setting of haplotype mismatch, leads to impaired haematopoietic recovery due to HSC clearance by mononuclear phagocytes. Mechanistically, VCAM1 ‘don’t-eat-me’ activity is regulated by ß2-microglobulin MHC presentation on HSCs and paired Ig-like receptor-B (PIR-B) on phagocytes. VCAM1 is also used by cancer cells to escape immune detection as its expression is upregulated in multiple cancers, including acute myeloid leukaemia (AML), where high expression associates with poor prognosis. In AML, VCAM1 promotes disease progression while VCAM1 inhibition or deletion reduces leukaemia burden and extends survival. These results suggest that VCAM1 engagement regulates a critical immune-checkpoint gate in the BM, and offers an alternative strategy to eliminate cancer cells via modulation of the innate immune tolerance.
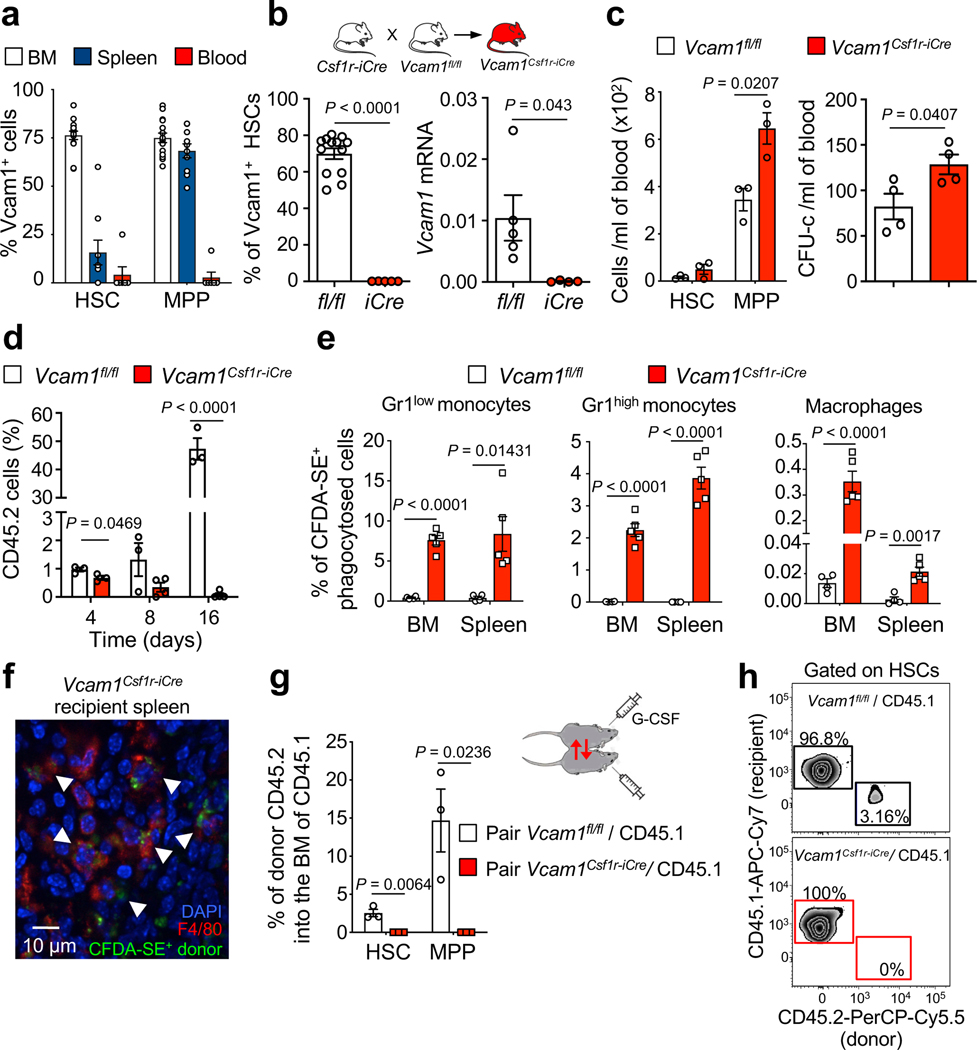
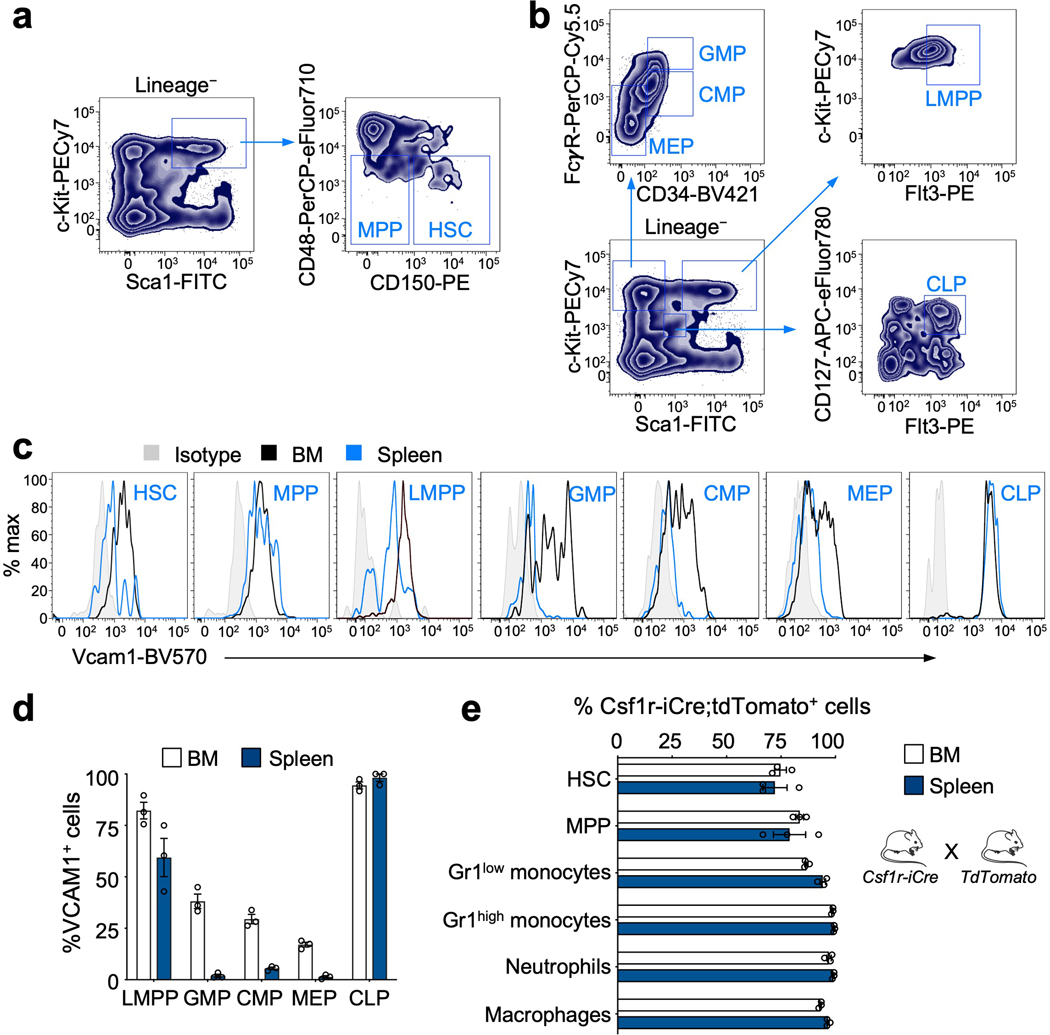
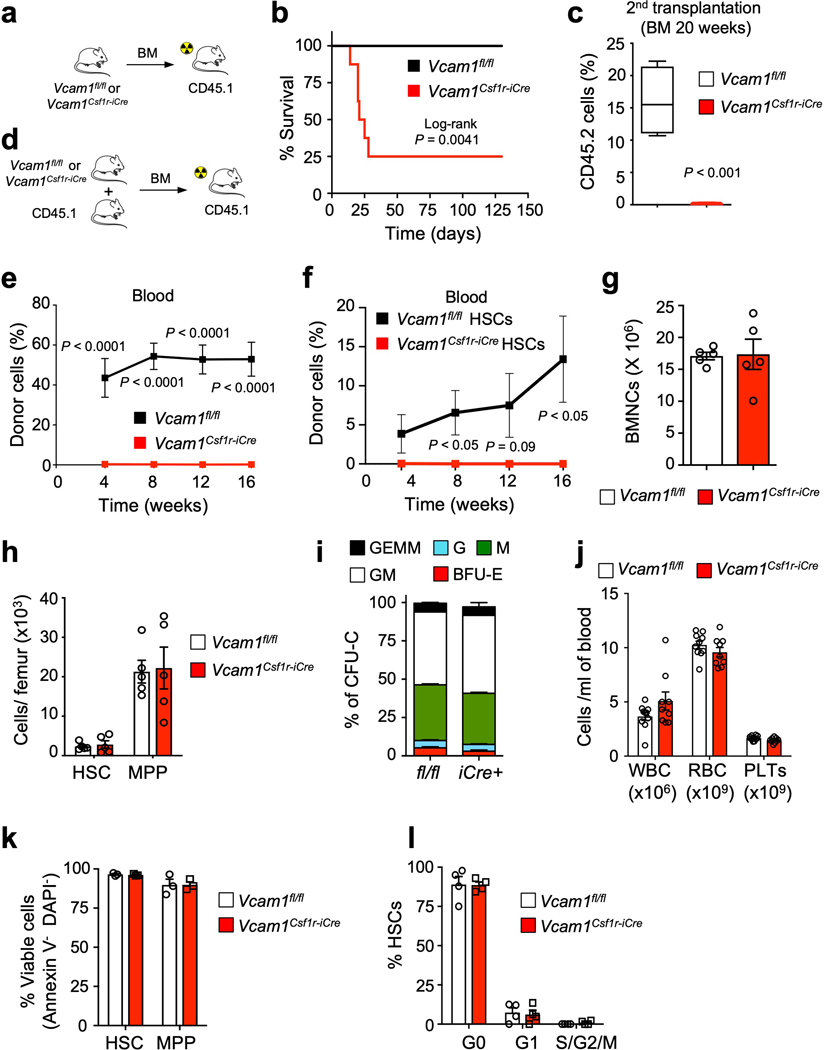
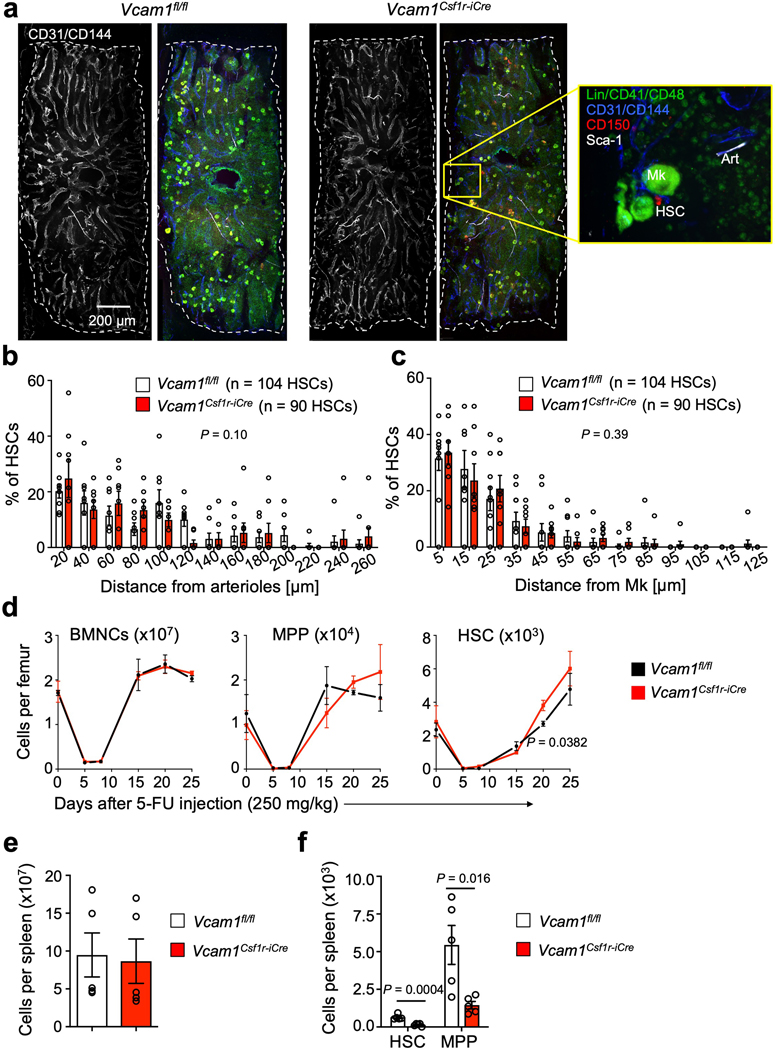
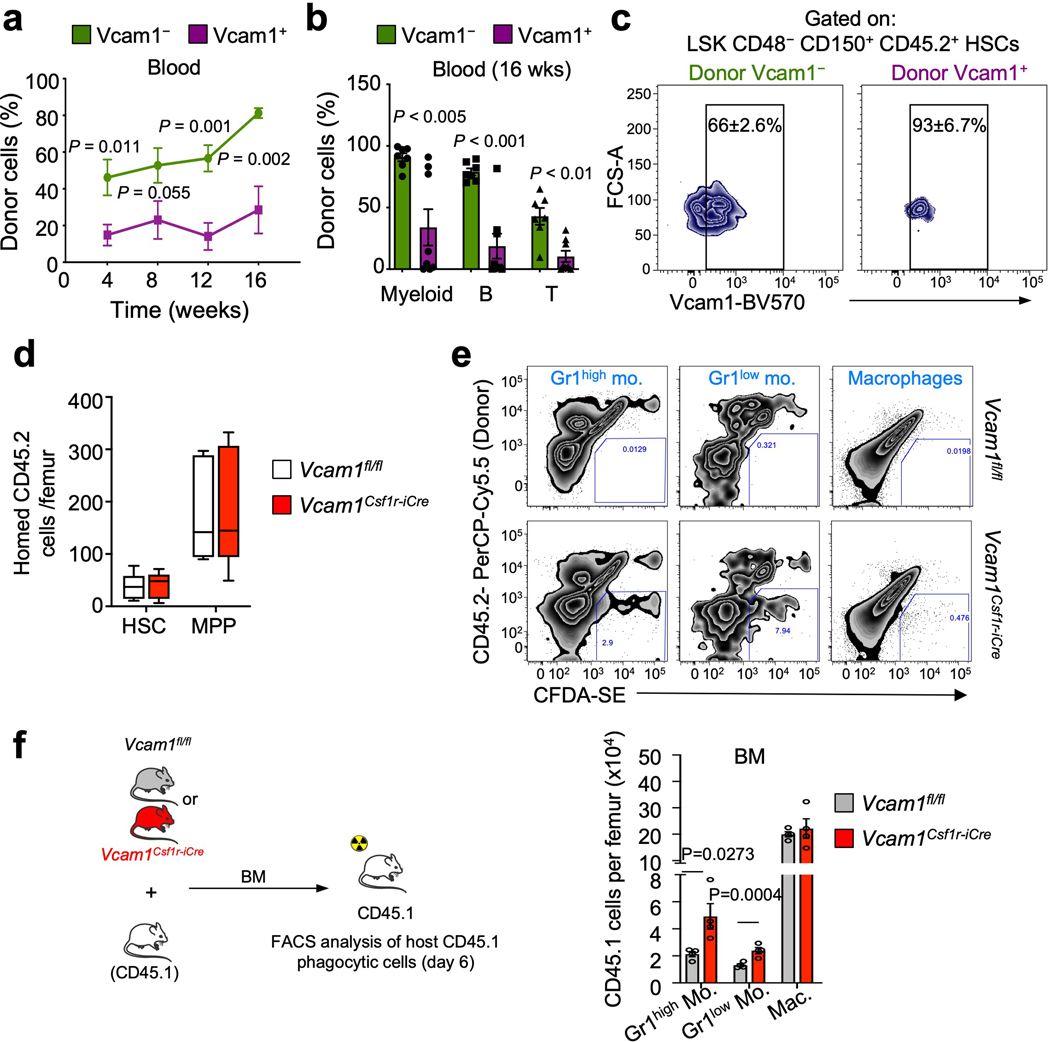
HSCs possess the ability to replenish the haematopoietic system following transplantation4. VCAM1, an endothelial and stromal adhesion molecule, is required for vascular development5 and to mediate the entry6, 7 and egress7–9 of HSCs and progenitors (HSPCs) between BM and blood. We found that VCAM1 was also highly expressed on BM HSCs (~75%) and some progenitors, and its expression was downregulated in HSCs mobilized in the periphery (Fig. 1a and Extended Data Fig. 1a–d)3. We bred Vcam1 floxed mice (Vcam1fl/fl)10 with a Csf1r-iCre line11 (Vcam1Csf1r-iCre) to evaluate its role on macrophages of erythroblastic islands12. Using this Cre-expressing line, we have found high deletion efficiency in HSCs consistent with the reported Csf1r expression in HSCs13, 14 (Fig. 1b and Extended Data Fig. 1e). To evaluate VCAM1’s function on HSCs, we transplanted Vcam1Csf1r-iCre BM cells into lethally irradiated recipients. Unexpectedly, the majority of Vcam1Csf1r-iCre recipients succumbed and BM from surviving chimeras failed to engraft secondary recipients (Extended Data Fig. 2a–c). No repopulating contribution from Vcam1Csf1r-iCre was also observed in competitive reconstitution experiments (Extended Data Fig. 2d,e). Similar results were obtained with sorted HSCs (Extended Data Fig. 2f), suggesting that this effect was not mediated by VCAM1 expression on other cells, such as macrophages. By contrast, without transplantation, the deletion of Vcam1 did not alter HSC numbers, location, cycling status, or the numbers of multipotent progenitors (MPPs), colony-forming progenitors or blood cell counts (Extended Data Fig. 2g–l and Extended Data Fig. 3a–c). Additionally, 5-FU treatment did not reveal any significant deficit in Vcam1Csf1r-iCre haematopoietic recovery (Extended Data Fig. 3d). However, Vcam1 deletion led to reduced numbers of splenic HSPCs (Extended Data Fig. 3e,f) with slight augmentation of circulating progenitors (Fig. 1c), in line with a previous report15. To assess whether VCAM1 expression could mark a distinct subset of HSCs, we transplanted sorted wild-type VCAM1+ or VCAM1– HSCs into C57BL/6 mice. Analyses of the blood chimaerism revealed a higher competitive repopulation capacity from the rare VCAM1– HSCs compared to VCAM1+ HSCs (Extended Data Fig. 4a,b). In addition, VCAM1– HSCs regenerated both the VCAM1+ and VCAM1– HSCs, whereas VCAM1+ HSCs regenerated almost exclusively the VCAM1+ subset (Extended Data Fig. 4c), suggesting a hierarchical relationship. These results indicate that VCAM1 on HSCs may regulate their engraftment, but appears dispensable for BM maintenance.
Figure 1. VCAM1 provides “don’t-eat-me” recognition.
(a) Percentage of VCAM1+ cells within HSC and MPP from the BM (n=15 biological replicates), spleen (n=10 biological replicates) and blood (n=7 biological replicates). (b) Vcam1 is efficiently depleted in Vcam1Csf1r-iCre BM HSCs, as seen by FACS (n=13 Vcam1fl/fl, n=5 Vcam1Csf1r-iCre biological replicates) and mRNA (n=5 Vcam1fl/fl, n=4 Vcam1Csf1r-iCre biological replicates) analyses. (c) Concentration of HSCs, MPPs (n=3 biological replicates) and colony-forming unit cell (CFU-C) in the blood of Vcam1Csf1r-iCre mice as compared to littermate Vcam1fl/fl (n=4 biological replicates). (d) Time course of blood chimerism post-transplant of Vcam1fl/fl and Vcam1Csf1r-iCre donor cells (n=3 Vcam1fl/fl, n=4 Vcam1Csf1r-iCre biological replicates). (e) In vivo phagocytosis assay comparing Vcam1fl/fl and Vcam1Csf1r-iCre Lineage− cells labelled with CFDA-SE and transplanted. Recipient mice were sacrificed 4 days after and the percentage of recipient CD45.1 CFDA-SE+ phagocytic cells determined by FACS in the BM and spleen (n=4 Vcam1fl/fl, n=5 Vcam1Csf1r-iCre biological replicates). (f) Representative immunofluorescence image of splenic F4/80+ macrophages with Vcam1Csf1r-iCre phagocytosed CFDA-SE+ cells (arrowheads), (n=2 randomly selected spleen samples from the mice in (e) were selected for confocal microscopy). (g) Blood circulation was connected between CD45.2 Vcam1fl/fl and Vcam1Csf1r-iCre mice and CD45.1 mice by parabiotic surgery and mobilization induced by G-CSF injection. Frequency of donor CD45.2 HSC and MPP from Vcam1fl/fl and Vcam1Csf1r-iCre that homed and engrafted in the BM of CD45.1 paired mice, one week after the last G-CSF injection (n=3 biological replicates). (h) Examples of BM HSC chimaerism plots for Vcam1fl/fl and Vcam1Csf1r-iCre donors. MPP (LSK CD150− CD48−); HSC (LSK CD150+ CD48−). All error bars, mean ± s.e.m. Unpaired two-tailed student’s t test (b-e, g). Significant P values are indicated in the figure.
To resolve the discrepancy between the dramatic transplantation phenotype and the absence of constitutive HSC phenotype, we tracked the fate of Vcam1Csf1r-iCre cells after transplantation. While we found no difference in BM homing 3h after injection (Extended Data Fig. 4d), a time-course revealed that the contribution of Vcam1Csf1r-iCre progenitors to the recipient blood was reduced by ~35% on day 4, and was undetectable after 2 weeks (Fig. 1d). Post-transplantation failure was due to clearance by phagocytosis as CFDA-SE labelled Vcam1Csf1r-iCre cells accumulated in host Gr-1high and Gr-1low monocytes and macrophages after transplantation (Fig. 1e,f and Extended Data Fig. 4e). This was accompanied by increased numbers of host monocytes in Vcam1Csf1r-iCre recipient mice (Extended Data Fig. 4f). To ascertain that the clearance was not dependent on the damaged inflicted by irradiation, we assessed the chimaerism in G-CSF-mobilized parabiotic mice. While Vcam1fl/fl HSPCs engrafted the parabiont partner, Vcam1Csf1r-iCre cells did not (Fig. 1g,h). These data indicate that Vcam1-deficient HSPCs are susceptible to recognition by host phagocytes.
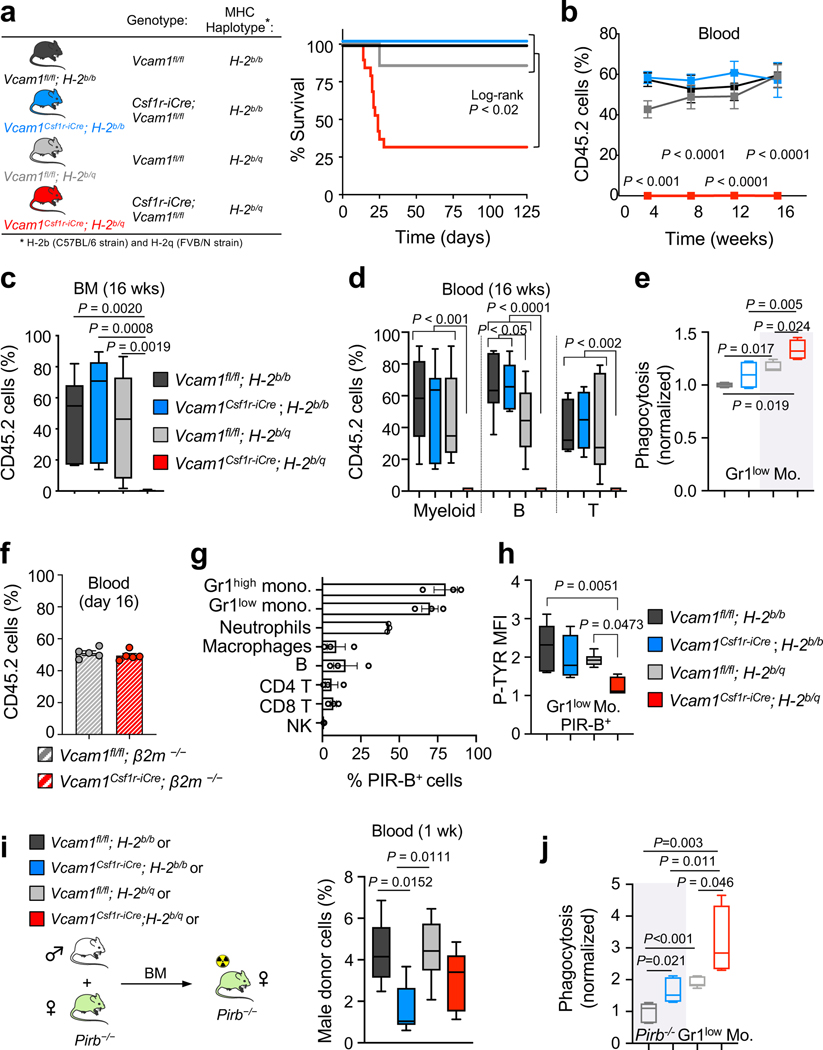
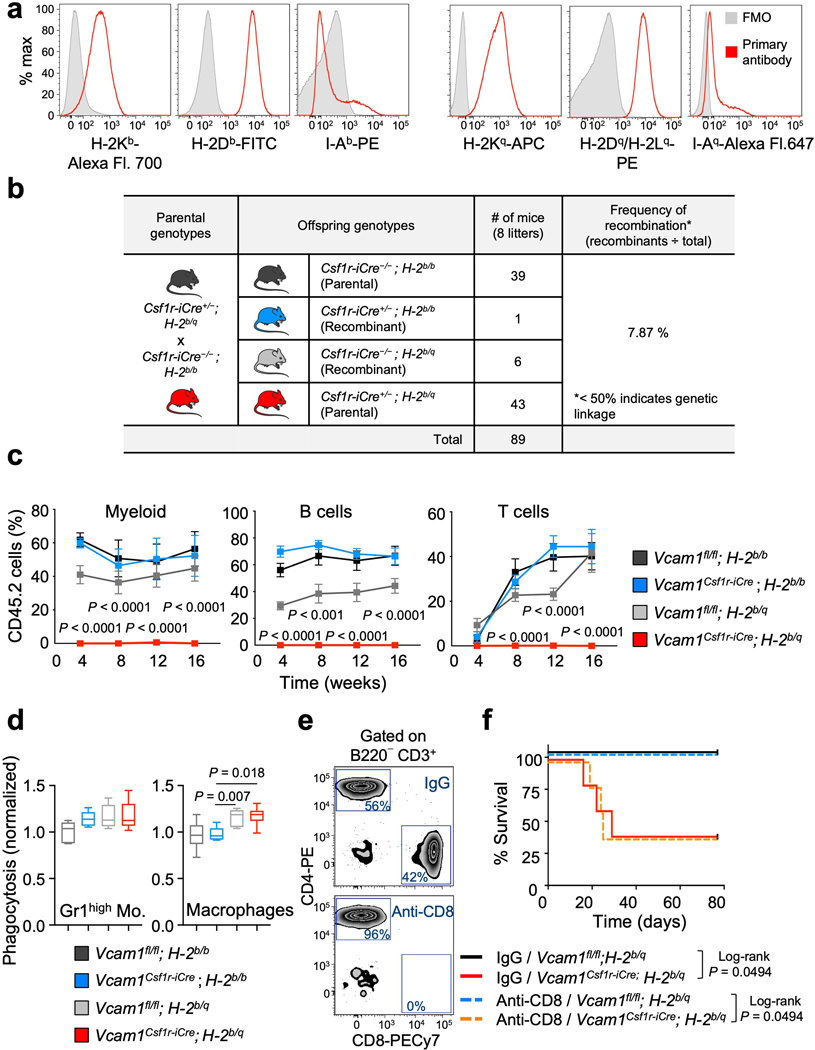
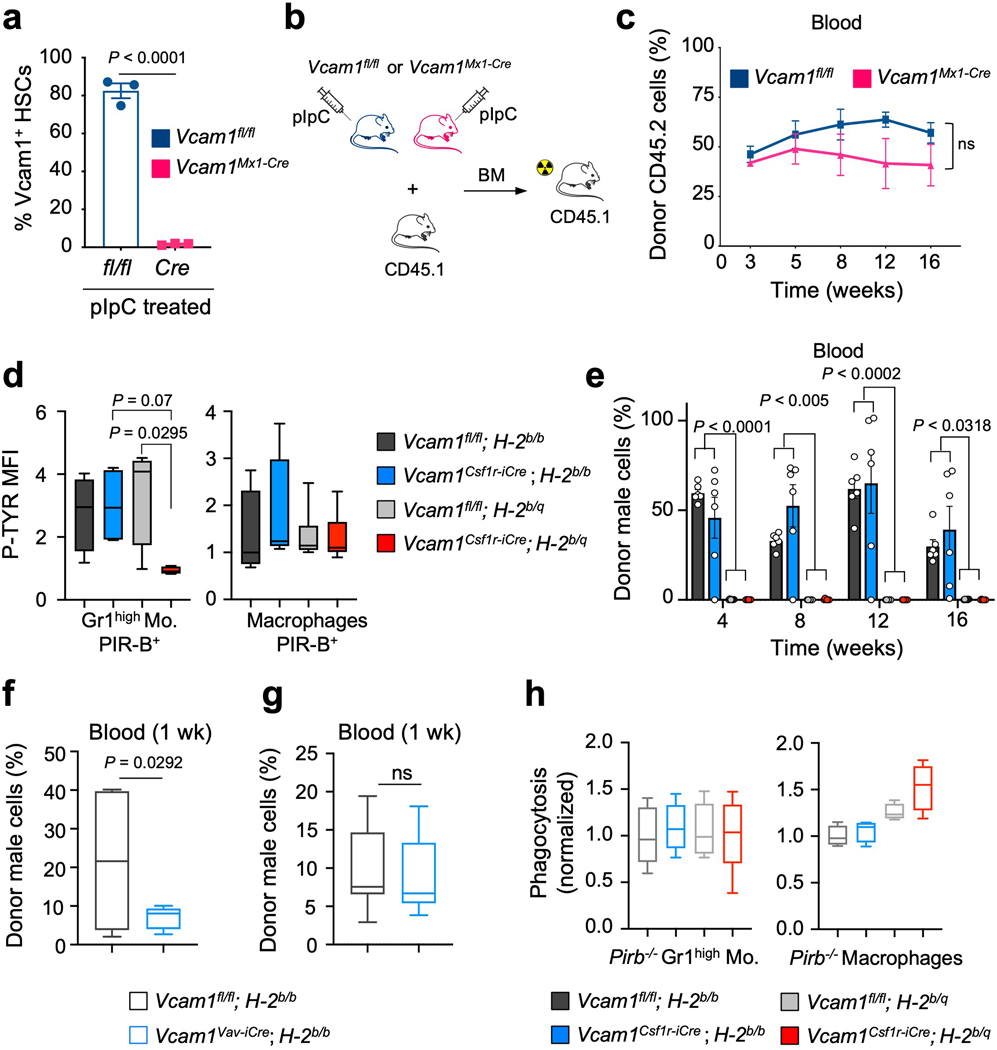
While investigating the mechanism underlying the engraftment failure of Vcam1-deficient HSCs, we noticed that Vcam1Csf1r-iCre mice—where Csf1r-iCre generated in the FVB background were backcrossed over 10 generations into the C57BL/6 background—remained heterozygote for the MHC haplotypes H-2q (FVB) and H-2b (C57BL/6) (Extended Data Fig. 5a). Indeed, we found that the Csf1r-iCre transgene was genetically linked to the MHC locus with a frequency of recombination ~7.87% (Extended Data Fig. 5b). We thus bred extensively Vcam1Csf1r-iCre and Vcam1fl/fl mice to generate either syngeneic (H-2b/b) or haplotype-mismatched (H-2b/q) MHC status and evaluated VCAM1’s function on engraftment in the context of syngeneic or haplotype-mismatched transplantation (Fig. 2a). Vcam1 deletion led to striking defects in engraftment only in the context of haplotype-mismatched transplantation (donor H-2b/q—recipient H-2b/b; Fig. 2a–d and Extended Data Fig. 5c). Whereas haplotype-mismatched Vcam1fl/fl cells exhibited engraftment and survival like syngeneic counterparts, those Vcam1-deficient haplotype-mismatched did not engraft and ~76% of the recipients died (Fig. 2a,b). Phagocytosis assays using freshly sorted Gr1low monocytes, Gr1high monocytes, or macrophages revealed that Gr1low monocytes were the most active in the clearance of Vcam1-null haplotype-mismatched HSPCs (Fig. 2e and Extended Data Fig. 5d). Consistent with the notion that phagocytes were sufficient to detect the MHC mismatch, CD8+ cells depletion did not rescue the survival defect of Vcam1Csf1r-iCre;H-2b/q recipients, suggesting that CD8+ T cells were dispensable (Extended Data Fig. 5e,f). Next, we generated Vcam1-deficient mice using the C57BL/6 syngeneic Mx1-Cre line. Transplantation of syngeneic Vcam1-null or control BM from Vcam1Mx1-Cre (Extended Data Fig. 6a–c) revealed similar capacity to engraft, confirming the absence of engraftment defect in the syngeneic setting. To ascertain whether MHC-class I presentation was required, we introduced a β2-microglobulin-null mutation (β2m−/−) by crossing β2m−/− mice16 with Vcam1Csf1r-iCre;H-2b/q animals. The engraftment defect of haplotype-mismatched Vcam1-deficient HSPCs was rescued when MHC-class I expression was defective (Fig. 2f). These results indicate that VCAM1 on HSPCs is required for “don’t-eat-me” vetting by phagocytes to provide BM engraftment.
Figure 2. VCAM1 is essential for HSC engraftment in haplotype-mismatched transplantation.
(a) Vcam1fl/fl and Vcam1Csf1r-iCre syngeneic (H-2b/b) and haplotype-mismatched (H-2b/q) lines used. Survival curves of lethaly irradiated and non-competitively transplanted mice. Vcam1fl/fl;H-2b/b (n=6 biological replicates); Vcam1Csf1r-iCre;H-2b/b (n=13 biological replicates); Vcam1fl/fl;H-2b/q (n=7 biological replicates); Vcam1Csf1r-iCre;H-2b/q (n=19 biological replicates). (b, c) Quantification of long-term haematopoietic reconstitution from syngeneic and haplotype-mismatched Vcam1fl/fl and Vcam1Csf1r-iCre cells by competitive reconstitution assays in the (b) blood and in the (c) BM. Vcam1fl/fl;H-2b/b (n=7 biological replicates); Vcam1Csf1r-iCre;H-2b/b (n=6 biological replicates); Vcam1fl/fl;H-2b/q (n=12 biological replicates); Vcam1Csf1r-iCre;H-2b/q (n=10 biological replicates). (d) Quantification of tri-lineage (My, myeloid; B cell and T cell) engraftment in the mice analysed in (b and c). Vcam1fl/fl;H-2b/b (n=7 biological replicates); Vcam1Csf1r-iCre;H-2b/b (n=6 biological replicates); Vcam1fl/fl;H-2b/q (n=12 biological replicates); Vcam1Csf1r-iCre;H-2b/q (n=10 biological replicates). (e) In vitro phagocytosis of syngeneic and haplotype-mismatched control and Vcam1-null Lineage– cells incubated with freshly sorted Gr1low monocytes (n=4 biological replicates). (f) Donor engraftment of Vcam1fl/fl;β2m−/− and Vcam1Csf1r-iCre;β2m−/− cells, competitively transplanted with CD45.1 cells (n=5 biological replicates). Competitor and recipients were depleted of NK cells. (g) Percentage of PIR-B+ BM cells (n=3 biological replicates). (h) Phospho-flow analysis of tyrosine phosphorylation (P-TYR) levels in host CD45.1+ PIR-B+ Gr1low monocytes transplanted with syngeneic and haplotype-mismatched CD45.2 Vcam1fl/fl and Vcam1Csf1r-iCre cells, at day 6. P-TYR levels are represented as median fluorescent intensity (MFI) normalised to the basal P-TYR levels of phagocytic cells in Pirb−/− mice (n=5 biological replicates). (i) Haematopoietic reconstitution from syngeneic and haplotype-mismatched Vcam1fl/fl and Vcam1Csf1r-iCre cells after competitive transplantation assays into Pirb−/− mice (n=6 biological replicates). Engraftment was evaluated by detecting the levels of donor male DNA in the female recipient blood, by qPCR. (j) In vitro phagocytosis of syngeneic and haplotype-mismatched control and Vcam1-null Lineage– cells incubated with freshly sorted Pirb−/− Gr1low monocytes (n=6 biological replicates). Error bars, mean ± s.e.m. Box plots: media, whiskers: minimum and maximum. Unpaired two-tailed student’s t test (b, f). One-way ANOVA analyses followed by Tukey’s multiple comparison tests (c, d, e, h, i, j). Log-rank analysis was used for the Kaplan-Meier survival curves in (a). Significant P values are indicated in the figure.
The PIR-B receptor, expressed by myeloid phagocytes and B cells17 provides negative regulation of immune cells upon recognition of MHC-I18. We thus hypothesized that PIR-B might cooperate in the anti-phagocytic activity of VCAM1 and MHC-I. FACS analysis of PIR-B expression shows that >70% of monocytes express PIR-B (Fig. 2g). PIR-B inhibitory signalling correlates with the tyrosine phosphorylation (P-TYR) status of its immunoreceptor tyrosine-based inhibitory motifs17, 18. After transplantation of Vcam1Csf1ri-Cre;H-2b/q cells, the P-TYR levels in host CD45.1;H-2b/b PIR-B monocytes were significantly reduced compared to controls (Fig. 2h and Extended Data Fig. 6d). Next, we transplanted syngeneic and haplotype-mismatched Vcam1Csf1r-iCre and Vcam1fl/fl cells into Pirb−/− mice19. As expected from the hyper-responsiveness of Pirb−/− immune cells18, 20–24, both haplotype-mismatched cohorts failed to engraft (Extended Data Fig. 6e). However, Vcam1 deletion led to significant reductions (~60%) in the early (1 week) engraftment of syngeneic Vcam1Csf1r-iCre;H-2b/b cells compared to Vcam1fl/fl;H-2b/b cells (Fig. 2i), suggesting that syngeneic Vcam1-deficient HSPCs, but not Vcam1-sufficient HSPCs, can be cleared by Pirb−/− phagocytes. This result was confirmed using the Vcam1Vav-iCre model, which also revealed a 67% reduction in the early engraftment of syngeneic Vcam1Vav-iCre cells (Extended Data Fig. 6f,g). However, the engraftment levels subsequently recovered (Extended Data Fig. 6e), indicating that additional mechanisms may be at play. Phagocytosis assays with Pirb−/− phagocytes further suggested a role for PIR-B+ Gr1low monocytes in the transmission of VCAM1 “don’t-eat-me” signals as in the absence of PIR-B, either haplotype-mismatched or syngeneic Vcam1-null cells were eliminated (Fig. 2j and Extended Data 6h). Altogether, these results suggest that PIR-B on phagocytes contributes to supress the immune response triggered by Vcam1-deficient HSPCs.
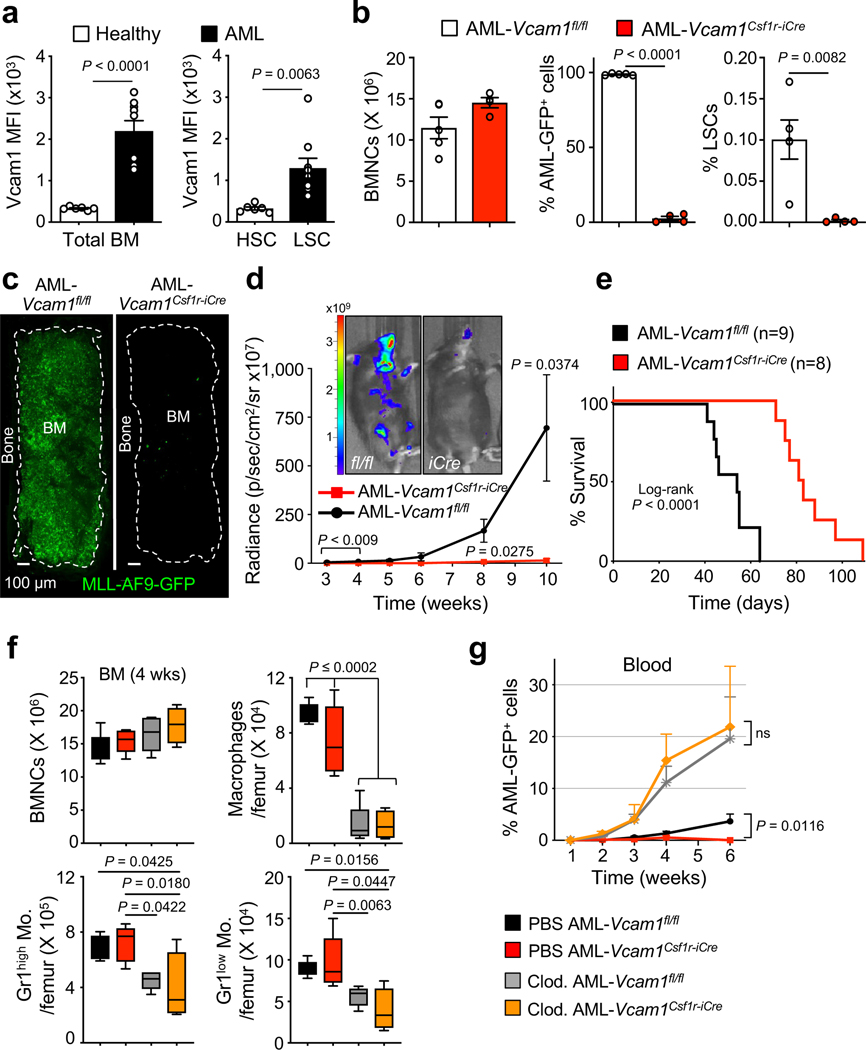
That VCAM1 expression would provide immune tolerance indicated that this pathway may be used by cancer. Upregulation in VCAM1 expression has been reported in various cancers, including gastric25, renal26, hepatocellular27, acute promyelocytic leukaemia28, and breast cancer29, 30. Moreover, VCAM1 expression on endothelial and stromal cells may mediate in part leukaemia resistance to chemotherapy31–34. Our results suggest that VCAM1 cell-autonomous expression may also confer immune evasion. In an immunocompetent mouse model of AML driven by MLL-AF9REF35 (Extended Data 7a), we have found that VCAM1 expression on AML cells was 7-fold higher than healthy hematopoietic cells, and that expression on GMP-like leukaemic cells (L-GMP) enriched in LSCs35 was 4-fold higher than healthy HSCs (Fig. 3a).
Figure 3. Loss of Vcam1 inhibits the establishment and progression of MLL-AF9-induced AML and markedly improved survival in mouse model.
(a) Median fluorescence intensity (MFI) of VCAM1 on bulk control healthy (n=6 biological replicates) and leukaemic MLL-AF9 BM cells (n=9 biological replicates, left panel), and healthy HSCs (n=6 biological replicates) and LSCs (n=9 biological replicates, right panel). LSCs were defined as Lineage− IL7Rα− Sca1− MLL-AF9 GFP+ c-Kithigh CD34+ FcγRII/IIIhigh cells35. (b) Analysis of AML primary recipients transplanted with haplotype-mismatched Vcam1fl/fl (n=5 biological replicates) and Vcam1Csf1r-iCre-transduced MLL-AF9-GFP LSKs (n=4 biological replicates), after 55 days. BM cellularity and percentage of AML-GFP+ cells and LSCs. (c) Representative images of a sternal BM segment from the mice analysed in (b), (n=2 randomly selected BM sternums from each group in (b) were analysed by confocal microscopy). (d) Pre-leukaemic haplotype-mismatched Vcam1fl/fl and Vcam1Csf1r-iCre luciferase-expressing AML cells were transplanted into sublethally irradiated mice and leukaemia progression was quantified by bioluminescence (n=5 biological replicates). Luciferase imaging of representative mice from each group is shown at week 10 post-transplant. (e) Kaplan-Meier survival analysis of secondary recipient mice receiving 20,000 GFP+ leukaemia cells from haplotype-mismatched Vcam1fl/fl (n=9 biological replicates) and Vcam1Csf1r-iCre (n=8 biological replicates) primary recipients. (f) BM cellularity and absolute number of phagocytes per femur in C57BL/6 mice treated with PBS or clodronate liposomes and transplanted with Vcam1fl/fl and Vcam1Csf1r-iCre pre-leukaemic cells, at week 4 (n=5 and n=4 for Clo. AML-Vcam1Csf1r-iCre biological replicates). (g) Percentage of haplotype-mismatched AML-Vcam1fl/fl or AML-Vcam1Csf1r-iCre GFP+ cells in the blood of recipients treated with PBS or clodronate liposomes (PBS AML-Vcam1fl/fl wk 1 n=5, wk 2–4 n=9, wk 6 n=4; PBS AML- Vcam1Csf1r-iCre wk 1 n=5, wk 2–4 n=11, wk 6 n=6; Clod. AML-Vcam1fl/fl wk 1,6 n=5, wk 2–4 n=10; Clod. AML- Vcam1Csf1r-iCre wk 1,6 n=5, wk 2,4 n=10, wk 3 n=8; all biological replicates). Error bars, mean ± s.e.m. Box plots: media, whiskers: minimum and maximum. Unpaired two-tailed student’s t test (a, b, d, g). Log-rank analysis was used for the Kaplan-Meier survival curves in (e). One-way ANOVA analyses followed by Tukey’s multiple comparison tests (f). Significant P values are indicated in the figure.
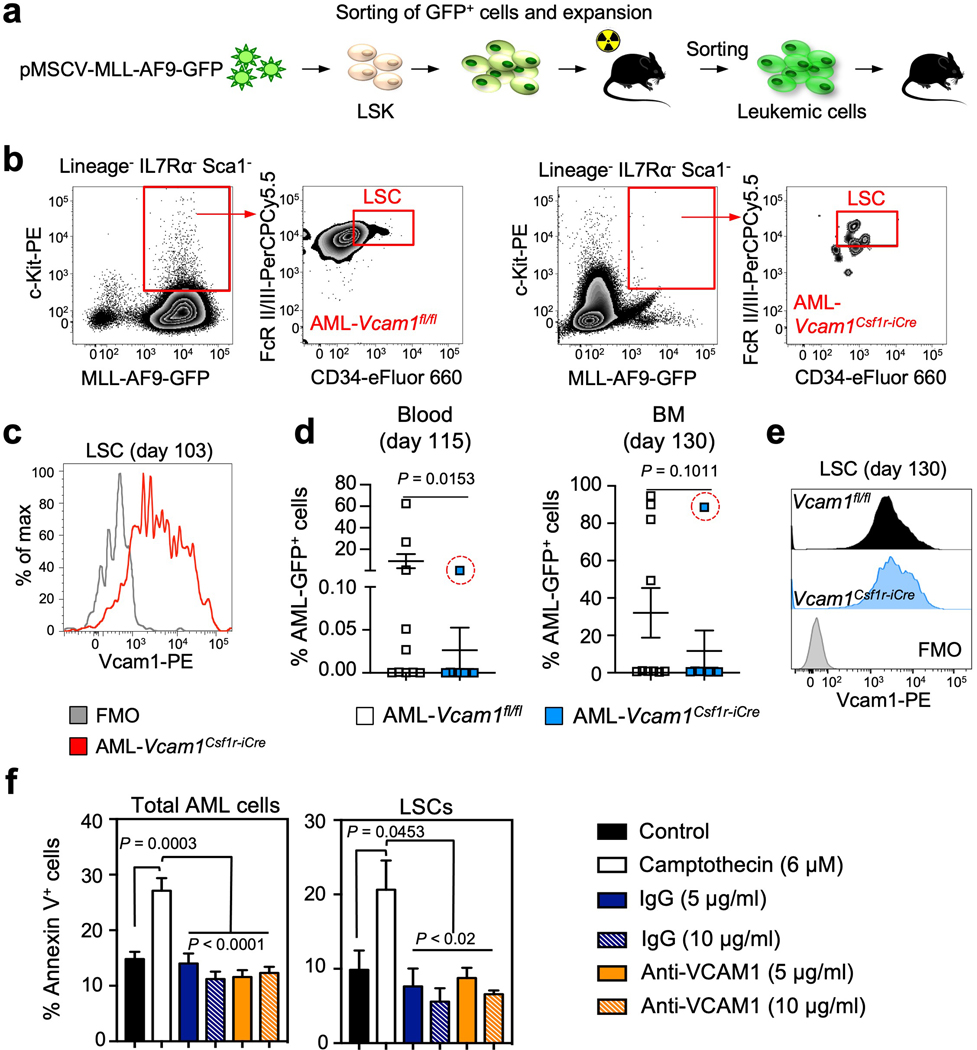
Leukaemic cells can upregulate CD47REF36, 37 or MHC class-I38 molecules to avoid phagocytosis or aberrantly express pro-phagocytic signals including AML-specific neo-antigens and AML-associated antigens that can elicit anti-leukaemia responses if the balance between anti-phagocytic and phagocytic signals is perturbed39. To test the effect of Vcam1 deletion and MHC-mismatch on AML progression, we transduced Vcam1Csf1r-iCre;H-2b/q and Vcam1fl/fl;H-2b/q cells with the pMSCV-MLL-AF9-GFP oncogene. FACS analysis of primary AML recipient BM revealed a >99% reduction of Vcam1Csf1r-iCre L-GMPs compared to Vcam1fl/fl (Fig. 3b and Extended Data Fig. 7b). Moreover, whole-mount sternum imaging showed little leukaemia infiltration of Vcam1Csf1r-iCre AML compared to Vcam1fl/fl AML (Fig. 3c). We further confirmed these results in a luciferase-expressing MLL-AF9 line (Fig. 3d). Accordingly, the survival of secondary leukaemia recipients was prolonged in mice harbouring Vcam1Csf1r-iCre AML cells relative to Vcam1fl/fl AML (Fig. 3e). Remarkably, >85% of L-GMPs from moribund Vcam1Csf1r-iCre AML mice expressed VCAM1 at day 103 post-injection (Extended Data Fig. 7c), suggesting that incomplete Cre recombination in the Csf1r-iCre model may have allowed rare VCAM1+ LSCs to escape and colonize the marrow of secondary recipients. Notably, we found similar results using syngeneic Vcam1Csf1r-iCre;H-2b/b AML which revealed little (<1%) leukaemia infiltration (Extended Data Fig. 7d–e), with the exception of one animal in which incomplete Cre recombination allowed VCAM1+ LSCs to escape. These data thus indicate that Vcam1 ablation significantly impairs AML progression.
To investigate the requirements of phagocytic cells in the clearance of MHC-mismatched Vcam1Csf1r-iCreAML, we depleted phagocytes by injection of clodronate liposomes (Fig. 3f). Leukaemia progression was markedly enhanced following mononuclear phagocyte depletion, and the defect of Vcam1Csf1r-iCreAML cells was rescued (Fig. 3g), confirming the critical role of phagocytes in recognizing VCAM1-mediated ‘don’t-eat-me’ signals from AML. To evaluate whether phagocytic removal was preceded by the induction of apoptosis, we incubated AML cells with IgG, anti-VCAM1 blocking antibody or camptothecin (an inducer of AML apoptosis). We found no difference in the percentage of apoptotic L-GMPs between control and anti-VCAM1 treated groups (Extended Data Fig. 7f). These results indicate that clodronate-sensitive phagocytes play a key role in AML clearance and that phagocyte recognition does not require AML cell apoptosis.
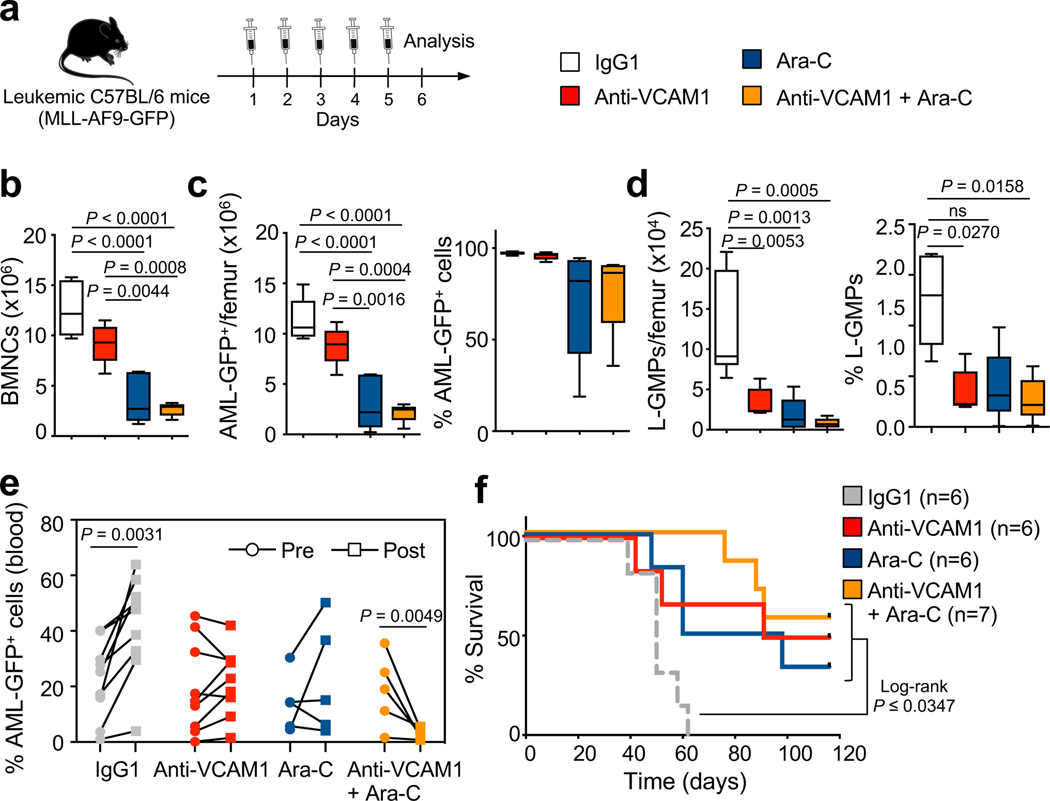
To evaluate the safety and efficacy of VCAM1 inhibition in a pre-clinical scenario, we allowed C57BL/6 syngeneic AML to develop (>50% circulating AML-GFP+ cells) in C57BL/6 recipients, and then initiated therapy with a daily injection of IgG1, anti-VCAM1, the chemotherapeutic drug cytarabine (Ara-C), or a combination of anti-VCAM1/Ara-C for 5 days (Fig. 4a). This short-treatment with anti-VCAM1 antibody preferentially reduced the frequency and number of phenotypic L-GMPs in vivo (Fig. 4b–d). Next, we used a similar strategy in mice less sick. While AML progressed in IgG1-treated mice, it was stabilized by anti-VCAM1 and reduced in mice treated with anti-VCAM1/Ara-C (Fig. 4e), significantly extending their survival (Fig. 4f). Anti-VCAM1 treatment appeared safe for healthy unmutated HSCs since it did not deplete their numbers, altered progenitors’ differentiation or HSC engraftment capacity, altered blood counts, or affect healthy mice survival (Extended Data Fig. 8).
Figure 4. Blockade of VCAM1 reduces the number of LSCs enriched L-GMPs and synergizes with cytarabine in vivo.
(a) Outline of experimental strategy. Moribund sick secondary-recipient leukaemic mice were daily injected with IgG1 control (100 μg), anti-VCAM1 antibody (100 μg), cytarabine (Ara-C; 100 mg/kg) or a combination of anti-VCAM1/Ara-C for 5 days. Mice were analysed by FACS 1 day after the last injection. (b) BM cellularity per femur, (c) absolute number and percentage of bulk MLL-AF9-GFP+ cells and (d) L-GMPs in the BM of control and treatment groups (IgG1 n=6; anti-VCAM1, Ara-C, anti-VCAM1/Ara-C n=5 biological replicates; representative experiment). (e) Percentage of bulk MLL-AF9-GFP+ cells in the blood of leukaemic mice comparing pre- and post-treatment (IgG1 and anti-VCAM1 n=9, Ara-C and anti-VCAM1/Ara-C n=5 biological replicates). (f) Survival curves of leukaemic mice after prolonged (10 days) treatment (IgG1, anti-VCAM1, Ara-C n=6; anti-VCAM1/Ara-C n=7 biological replicates). Error bars, mean ± s.e.m. Box plots: media, whiskers: minimum and maximum. One-way ANOVA analyses followed by Tukey’s multiple comparison tests were in (b, c, d). Paired student’s t test (e). Log-rank analysis was used for the Kaplan-Meier survival curves in (f); ns non-significant. Significant P values are indicated in the figure.
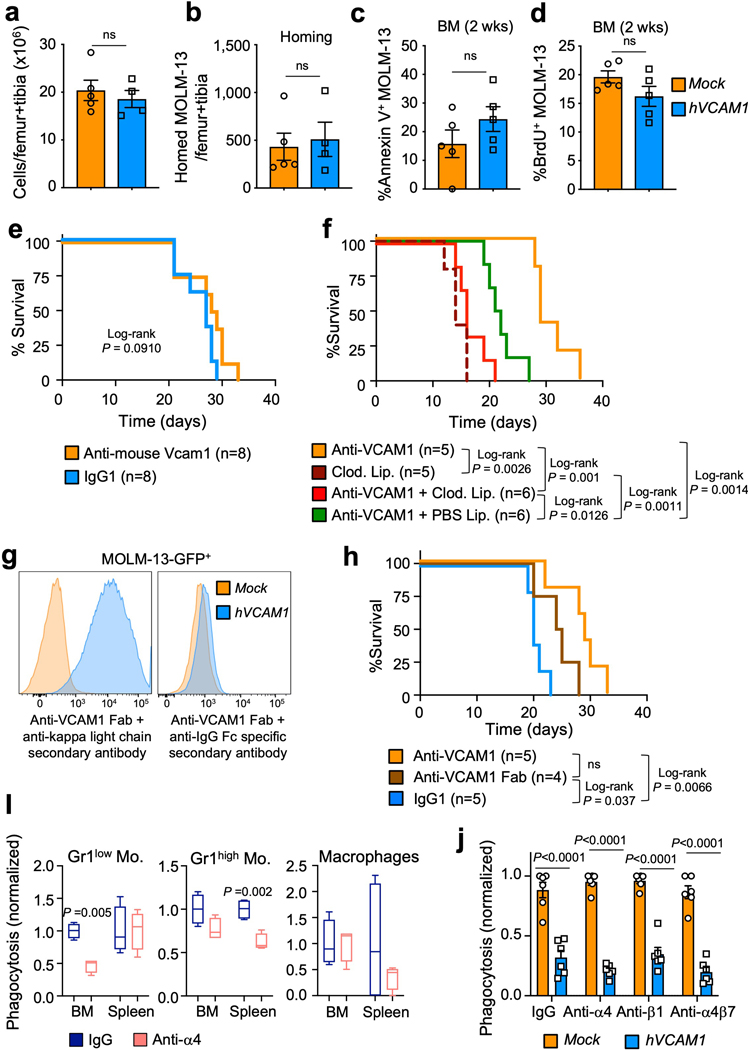
As high VCAM1 expression is associated with reduced survival of AML patients (Fig. 5a), we assessed the significance of elevated VCAM1 in human AML. We overexpressed VCAM1 in MOLM-13 AML cells, which are VCAM1 negative (Fig. 5b,c), and transplanted hVCAM1-ZsGreen-transduced and ZsGreen-control (Mock)-transduced MOLM-13 cells into NSG mice. hVCAM1-MOLM-13 showed rapid disease progression compared to Mock-MOLM-13 (Fig. 5d), leading to a significant reduction in the survival of mice (Fig. 5e). We found no difference in homing capacity of hVCAM1-MOLM-13 cells, cell viability or cycling (Extended Data Fig. 9a–d). Importantly, anti-human VCAM1 administration significantly extended the survival of hVCAM1-MOLM-13 transplanted animals (Fig. 5f), while anti-mouse VCAM1 blockade in the recipient microenvironment did not (Extended Data Fig. 9e). In vitro incubation of either Mock- or hVCAM1-MOLM-13 cells with human monocyte-derived macrophages revealed that hVCAM1 expression alone was sufficient to protect AML from phagocytosis, while anti-human VCAM1 promoted phagocytosis of hVCAM1-MOLM-13 cells (Fig. 5g). Furthermore, phagocytosis inhibition (via liposomes saturation) or phagocytes depletion (via clodronate liposomes) in xenografts reduced the survival of anti-VCAM1-treated mice, further confirming the critical role mononuclear phagocytes in VCAM1 “don’t-eat-me” activity (Extended Data Fig. 9f). The protective effects of anti-VCAM1 antibody likely occurred by receptor inhibition since the administration of anti-VCAM1 Fab fragments also improved the survival of leukaemic mice (Extended Data Fig. 9g,h), although it remains possible that antibody-dependent cellular cytotoxicity and/or cellular phagocytosis may amplify this effect. Interestingly, the in vivo inhibition of α4 integrin did not increase haplotype-mismatched phagocytosis (Extended Data Fig. 9i), suggesting that α4β1REF40 and α4β7REF41 may not participate in the transmission of VCAM1 inhibitory signal. Accordingly, the in vitro inhibition of α4, β1 or α4β7 did not trigger phagocytosis of hVCAM1-MOLM13 cells (Extended Data Fig. 9j). While further studies will be needed to identify the VCAM1 binding partner, altogether, these results suggest that VCAM1 overexpression increases the tumorigenicity of AML cells.
Figure 5. High VCAM1 expression correlates with poor prognosis in human AML.
(a) Kaplan-Meier survival of AML patients with high (red) and low (blue) VCAM1 expression (mRNA expression z-Score threshold ±2; TCGA Research Network). (b) Experimental strategy. MOLM-13 cells were transduced with a human VCAM1-ZsGreen-expressing (hVCAM1) or ZsGreen control (Mock) lentivirus and transplanted into NOD-scid Il2rg−/− (NSG) mice. (c) Human VCAM1 expression on Mock- and hVCAM1-MOLM-13 cells. (d) Percentage of human CD45+ AML cells in the blood of MOLM-13 transplanted mice (Mock n=8; hVCAM1 n=10 biological replicates). (e) Survival analysis of mice receiving Mock- (n=9 biological replicates) and hVCAM1-MOLM-13 cells (n=10 biological replicates). (f) Survival analysis of mice with established hVCAM1-MOLM-13 AML (>1% peripheral human CD45+ cells) and treated with IgG1 (n=6 biological replicates) and anti-human VCAM1 monoclonal antibody (n=9 biological replicates) for 10 days. (g) In vitro phagocytosis of Mock-MOLM-13 and hVCAM1-MOLM13 cells, in the presence of anti-VCAM1 blocking antibody or IgG1. Values were normalized to the maximum number of events across technical replicates (n=5 biological replicates). (h) In vitro phagocytosis of 3 VCAM1+ human primary AML samples in the presence of anti-VCAM1 blocking antibody or IgG1. Values were normalized to the maximum number of events across technical replicates (n=3 for #V6 and n=6 for #V7–8 patient samples). (i) NSG mice were transplanted with primary human AML and upon disease establishment were daily injected with IgG1 (n=10 biological replicates) or anti-human VCAM1 antibody (n=9 biological replicates) for 10 days. Mice went through two rounds of treatment. Percentage of human CD45+ AML cells in the blood of leukaemic mice comparing pre- and post-treatment. (j) Survival of leukaemic mice treated in (i). (k) Cooperative anti-phagocytic activity of VCAM1 and MHC-I enabling “don’t-eat-me” or “kill-me” activity. VCAM1-mediated interactions between HSCs/LSCs and phagocytes allow PIR-B engagement and immune recognition as self. Error bars, mean ± s.e.m. Box plots: media, whiskers: minimum and maximum. Unpaired two-tailed student’s t test (d, h). Two-way ANOVA with multiple comparisons correction (g). Paired t test (i). Log-rank analysis was used for the Kaplan-Meier survival curves in (a, e, f, j). Significant P values are indicated in the figure.
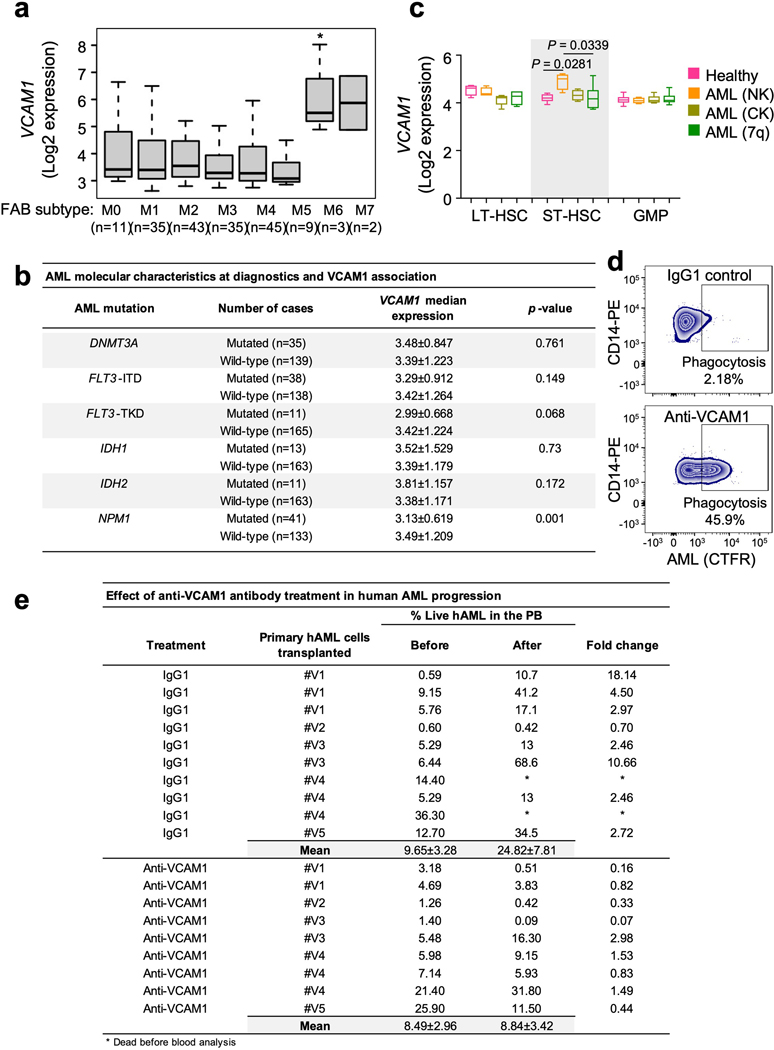
To investigate VCAM1 expression across morphologic, and molecular subgroups of human AML, gene expression data from a published patients’ cohort42 were analysed. VCAM1 is broadly expressed among all FAB (French-American-British) subtypes with the highest expression on the M6 subgroup (Extended Data Fig. 10a). No association was found between VCAM1 expression and mutations in DNMT3A, FLT3-ITD, FLT3-TKD, IDH1, IDH2. However, lower levels of VCAM1 were correlated with mutated NPM1, which associates with a favourable prognosis in the absence of FLT3-ITD43 (Extended Data Fig. 10b). These results indicate that VCAM1 potentially represents a broad mechanism of leukaemia immune evasion. Next, we assessed VCAM1 expression in highly purified primary human AML HSPCs relative to healthy controls from published data of AML patients with normal karyotype, complex karyotype, and deletion of chromosome 7REF44, 45, and found that VCAM1 was significantly overexpressed in short-term repopulating HSCs (ST-HSCs), the compartment most enriched in functional LSCs, in normal AML karyotype (Extended Data Fig. 10c). Next, we examined whether direct monoclonal antibody blockade of VCAM1 could enhance phagocytosis of VCAM1+ human AML patient samples. In vitro phagocytosis assays revealed that human AML cells treated with anti-VCAM1 were readily engulfed by human CD45+CD14+ monocytes, as compared to IgG1 (Fig. 5h and Extended Data Fig. 10d). Next, we transplanted primary human AML samples into NSG mice. Upon disease establishment, mice were treated with 2 courses of anti-human VCAM1 or IgG1, and found that VCAM1 inhibition impaired AML progression (Fig. 5i and Extended Data Fig. 10e) and prolonged mice survival (Fig. 5j). These results thus suggest that VCAM1 blockade is safe in pre-clinical models to reduce the leukaemic burden in vivo and may synergize with Ara-C to clear LSCs while sparing healthy HSCs.
The therapeutic outcomes in AML remain poor, with relapses representing the major cause of treatment failure. The immune system is critical to prevent tumour initiation and control tumour growth36, 37,38, 46, 47. Our results reveal an unknown function for VCAM1 on HSC and LSC by acting cell-autonomously as a “don’t-eat-me” signal in the context of MHC-I presentation. VCAM1 regulates a critical vetting process by resident BM phagocytes to allow the entry of healthy or malignant cells. This vetting requires parallel checkpoints by VCAM1 and MHC-I on the stem cells and their counter-receptors on phagocytes, where the absence or blockade of VCAM1 combined with MHC mismatch instruct phagocytes to kill (Fig. 5k).
In the context of leukaemia, we speculate that VCAM1 inhibition appears sufficient to give the green-light to kill tumour cells, even in the setting of a syngeneic host, likely due to the presence of tumour neoantigens which may be perceived by host phagocytes as non-self. Our studies suggest that anti-VCAM1 therapy may synergise with conventional chemotherapy, highlighting the potential of combination treatments to enhance the innate immunity response to cancer.
Methods
All animal experiments were approved by the Animal Care and Use Committees of Albert Einstein College of Medicine and performed in compliance with all relevant ethical regulations. Human samples from patients with AML were obtained after written informed consent, from Montefiore Medical Center/Albert Einstein Cancer Center. Samples were de-identified, without age or gender preferences and not specifically collected for this study.
Mice.
FVB-Tg(Csf1r-icre)1Jwp/J (Csf1r-iCre) mice were a gift from Dr. Jeffrey W. Pollard, and B6.129(C3)-Vcam1tm2Flv/J (Vcam1floxed) mice were kindly provided by Dr. Thalia Papayannopoulou. Csf1r-iCre and Vcam1floxed lines were backcrossed to C57BL/6 background for 10 generations. Pirb−/− mice were kindly provided by Dr. Toshiyuki Takai, via Dr. Marc Rothenberg. B6.Cg-Gt(ROSA)26Sortm14(CAG-tdTomato) Hze/J, Beta 2-microglobulin-KO, B6.Cg-Tg(Mx1-Cre)1Cgn/J mice, B6.Cg-Commd10Tg(Vav1-iCre)A2Kio/J and BALB/c mice were purchased from the Jackson laboratory. C57BL/6 (CD45.2) and Bl6-Ly5.1 (CD45.1) mice were purchased from the National Cancer Institute or the Jackson laboratory (B6.SJL-Ptprca Pepcb/BoyJ). NOD-scid Il2Rg−/−(NSG) mice were bred and used at the Albert Einstein College of Medicine. PolyI:C (Invivogen) was administered intraperitoneally (i.p.) every other day at 5mg/kg for 3 doses for Mx1-Cre induction. Unless indicated otherwise, 8–12-week-old male and female mice were used. No randomization or blinding was used to allocate experimental groups.
Bone marrow transplantation and homing experiments.
Competitive and non-competitive repopulation assays were performed using the CD45.1/CD45.2 congenic system. Recipient mice were lethally irradiated (12 Gy, two split doses) in a Cesium Mark 1 irradiator (JL Shepherd & Associates). For competitive repopulation assays 0.3 × 10⁶ donor nucleated BM cells (CD45.2+) were transplanted into irradiated CD45.1+ recipients together with 0.3 × 10⁶ competitor CD45.1+ BMNCs. CD45.1/CD45.2 chimaerism of recipient blood was analysed up to 4 months after transplantation using FACS. Mice showing more than 1% donor reconstitution in the myeloid (CD11b+), B-cell (B220+) and T-cell (CD4+ CD8+) lineages after 16 weeks were considered engrafted. To evaluate the engraftment chimaerism of Vcam1fl/fl;β2m−/− and Vcam1Csf1r-iCre;β2m−/− cells both competitor and recipients were depleted of NK cells (200 μg/injection anti-NK1.1 clone PK136 antibody Bio X Cell) at day −2 and −1 before transplantation and once per week after transplantation to avoid killing of donor cells in response to “missing-self” mechanism48. The engraftment chimaerism into Pirb−/− mice was monitored by performing real-time PCR analyses of the recipients blood, as previously described49. Non-competitive repopulation assays were done by transplanting 2 × 10⁶ donor BMNCs (CD45.2+) into irradiated CD45.1+ recipients. Recipient mice survival was monitored for 4 months. The engraftment chimaerism of sorted HSCs was achieved by intravenously transplant HSCs together with equivalent number of competitor CD45.1+ BMNCs. Before transplantation, dead cells and debris were excluded by FSC, SSC and DAPI (4’,6-diamino-2-phenylindole) staining profiles. Homing assays were performed using the CD45.1/CD45.2 congenic system. Recipient CD45.1 mice were lethally irradiated and transplanted with 10 × 106 donor BMNCs from Control or Vcam1Csf1r-iCre mice. After 3 hours, animals were sacrificed, and the BM of recipient animals tested for the presence of donor HSCs and progenitors using FACS.
Antibodies for FACS and Immunofluorescence.
The following antibodies were used in this study: anti-CD3e (145–2C11; 47–0031-80), anti-Ly6A/E (D7; 25–5981-82; 11–5981-82), anti-CD117 (2B8; 12–1171-82), anti-CD48 (HM48–1; 17–0481-82; 46–0481-82), anti-Flt3 (A2F10; 12–1351-81), anti-CD34 (RAM34; 50–0341-82), anti-CD127 (A7R34; 47–1271-80), anti-CD45.2 (104; 45–0454-82; 12–0454-82), anti-B220 (RA3–6B2; 47–0452-80), anti-CD11b (M1/70; 47–0112-82; 17011281), anti-Ter119 (TER-119; 47–5921-82), anti-Vcam1 at 1:50 dilution (429; 13–1061-82), anti-CD115 (AFS98; 17–1152-82), anti-Gr-1 (RB6–8C5; 47–5931-82; 11–5931-82), anti-CD45 (30-F11; 47–0451-80; 12–0451-82), anti-CD41 (MWReg30, 13–0411-81 at 1:2500 dilution), anti-VE-cadherin (BV13; 138006), anti-phosphor-Tyrosine (pY20; 46–5001-42), anti-H-2Db (28–14-8; 11–5999-82), anti-I-Aq (KH116; 115208), anti-Ki-67 (SolA15; 17–5698-82), anti-NK1.1 (PK136; 48–5941-82), anti-human CD33 (WM-53(WM53); 12–0338-42), anti-human VCAM1 (STA; 25–1069-42), anti-human CD45 (HI30; MHCD4520; 17–0459-42) and anti-PIR-B (326414) were all from eBioscience/ThermoFisher. Anti-CD16/32 (93; 101324), anti-CD4 (GK1.5; 100422), anti-CD8 (53–6.7; 100722), anti-CD150 (TC15–12F12.2; 115904; 115926), anti-CD117 (2B8; 105828), anti-CD31 (MEC13.3; 102516), anti-CD45.1 (A20; 110733; 110706; 110716), anti-CD34 (MEC14.7; 119321) anti-F4/80 (BM8; 123110; 123116), anti-H-2Kb (AF6–88.5; 116522; 116510), anti-H-2Kq (KH114; 115106), anti-I-Ab (AF6–120.1; 116408), anti-H-2Kb/H-2Db (28–8-6; 114603), anti-human CD11b (ICRF44; 25–0118-42), anti-human CD14 (M5E2; 301806), and anti-human CD3 (HIT3a; 11–0039-42) were from Biolegend. Anti-Lineage panel cocktail (TER-119, RB6–8C5, RA3–6B2, M1/70, 145–2C11 at 1:50 dilution; 558074; 559971), and anti-H-2Dq/H-2Lq (KH117; 558969) were from BD Biosciences. Hoechst 33342 (Sigma-Aldrich). Unless otherwise specified, all antibodies were used at a 1:100 dilution.
Flow cytometry and cell sorting.
Flow cytometric analyses were carried out in single-cell suspensions of nucleated cells enriched from the peripheral blood, spleen or flushed BM using an LSRII flow cytometer (BD Biosciences). Cell sorting experiments were performed using a FACSAria Cell Sorter (BD Biosciences). Dead cells and debris were excluded by FSC, SSC and DAPI (4’,6-diamino-2-phenylindole) staining profiles. For phospho-flow, cells were kept on ice upon isolation and immediately fixed in 1.5% PFA for 10 min. Cells were then washed and stained for cell surface markers. After surface staining, the cells were permeabilized with ice-cold acetone for 10 minutes on ice, washed and stained with phosphor-Tyrosine (pY20) from eBioscience. Data were analysed with FlowJo (Tree Star) or FACS Diva 6.1 software (BD Biosciences).
Cell cycle and cell viability analyses.
Cell cycle analysis using Ki-67 was performed as described previously50. Viable cells were assessed by double-negative staining of DAPI and Annexin V (BD Biosciences) following the manufacturer’s instructions.
Complete blood count analysis.
Blood was harvested by retro-orbital sampling of mice anesthetized with isoflurane or by submandibular route and collected in polypropylene tubes containing EDTA. Blood was diluted 1:10 in PBS and blood parameters determined with the Advia 120 Hematology System (Siemens).
Immunofluorescence staining and imaging of whole-mount sternum tissues and frozen sections.
Whole-mount tissue preparation, immunofluorescence staining and imaging of the sternum, and spleen were performed as described previously50.
RNA isolation and quantitative real-time-PCR (Q-PCR).
Sorted cells were collected in lysis buffer, and RNA isolation was performed using the Dynabeads mRNA DIRECT Micro kit (Invitrogen). Reverse transcription was performed using the RNA to cDNA EcoDry Premix system (Takara BioInc.) according to the manufacturer’s recommendations. The relative mRNA abundance was calculated using the ΔCt method and gene expression data normalized to Gapdh. Primer sequences are as follows: Gapdh: TGTGTCCGTCGTGGATCTGA and CCTGCTTCACCACCTTCTTGA; Vcam1: GACCTGTTCCAGCGAGGGTCTA and CTTCCATCCTCATAGCAATTAAGGTG.
In vitro colony forming assay.
BMNCs isolated from Control or Vcam1Csf1r-iCre mice or wild-type mice daily injected with IgG1 or anti-VCAM1 (100 μg/day) for 5 days were plated in methylcellulose media (Methocult M3434, Stem Cell Technologies) following the manufacturer’s instructions. Colonies were scored for CFU-G, CFU-M, CFU-GM, CFU- GEMM, and BFU-E.
Parabiosis.
Parabionts were generated by first making an incision from the elbow to the knee of each mouse on opposite sides. A 3.0 suture was used to attach the elbows and knees of the mice and then to attach the skin of one mouse to the skin of the other mouse, enclosing the joined elbow and knee inside the sutured skin. One Vcam1fl/fl and Vcam1Csf1r-iCre CD45.2 mouse was parabiosed to an age and sex matched wild-type CD45.1 mouse. After one week, mobilization was induced in parabionts by G-CSF (Neupogen, 250 μg/kg/day) injection during five days. Mice were allowed to recover another week and analysed by FACs.
5-FU challenge.
Mice were injected with one dose of 5-FU (Sigma-Aldrich, 250 mg/kg body weight) i.v. under isoflurane anaesthesia.
In vivo and in vitro phagocytosis assay.
For in vivo phagocytosis assay, 1.2 × 10⁶ Control and Vcam1Δ/Δ Lineage− cells were isolated by MACS column (Miltenyi Biotec) depletion, labelled with carboxy-fluorescein diacetate succinimidyl ester (CFDA-SE, Invitrogen) and transplanted competitively into CD45.1 lethally irradiated mice. Recipient mice were sacrificed after 4 days, and the percentage of recipient CD45.1 CFDA-SE+ phagocytic cells: Gr-1high monocytes (Gr-1+ CD115+), Gr-1low monocytes (Gr-1− CD115+) and macrophages (Gr-1− CD115intermediate F4/80+ SSCintermediate/low) analysed by FACS in the BM and spleen or by immunofluorescence staining of splenic F4/80+ macrophages. To address whether the blockade of α4 integrin could phenocopy the effect of VCAM1 deletion, we transplanted CFDA-SE labelled control Vcam1fl/fl haplotype-mismatched cells along with syngeneic CD45.1 competitor cells. As α4 integrin inhibition blocks homing and lodgement of HSPCs to the BM7, we initiated the treatment of recipient mice with an anti-α4 integrin (100μg, clone R1–2) and corresponding isotype-matched control at 24h post-transplantation and additional doses were administered at 48h and 72h post-transplant. Mice were analysed on day 4 by FACS. For in vitro phagocytosis assays Lineage− cells were isolated and labelled with CFDA-SE as above described. Phagocytes were freshly sorted and cells were mixed at a ratio of 1:2 (Lineage− : Phagocytes) and incubated 2 h at 37ºC in ultra-low attachment 96-well U-bottom plates (Corning) in serum-free IMDM (Life Technologies). Cells were washed 1X and analysed by FACS. In each independent experiment phagocytosis was normalized to the control syngeneic sample. For human AML MOLM-13-GFP phagocytosis assays, cells were incubated with human monocyte-derived macrophages (MDMs) from 2 different healthy donors (Lonza), for 4h in the presence of anti-human VCAM1 (10μg/ml), or isotype control (MOPC21). Human MDMs were derived from freshly isolated peripheral blood mononuclear cells (PBMCs) cultured with M-CSF at 50 ng/ml for 7 days. Assays were analysed by flow cytometry and phagocytosis measured as the number of CD11b+ GFP+ MDMs. For human primary AML cells phagocytosis assays, cells were stained with Cell Trace Far Red (CTFR, Thermo Fisher) according to manufacturer’s instructions and incubated with freshly isolated CFDA-SE+ human PBMCs from 2 different healthy donors, for 4h. Phagocytosis was determined as the % of CFDA-SE+ CD45+ CD14+ CTFR+ cells by flow cytometry. To account for innate variability in raw phagocytosis levels among human donor-derived phagocytes, phagocytosis was normalized to the highest technical replicate per donor.
Lentiviral vector generation and concentration.
HEK-293T cells (ATCC) were transfected by mixing 45 μl of Mirus TransIT-X2 reagent (Mirus Bio) in 500 μl of OPTI-MEM containing 12 μg pHIV-EF1-Luciferase-IRES-Tomato, 1.2 μg VSV-g, 0.6 μg Gag-Pol, 0.6 μg Tat, 0.6 μg Rev and incubated at room temperature for 30 min before it was added to the cells. Viral supernatants were collected for 3 days and filtered using a 0.45 μm cellulose acetate filter. Viral concentration was achieved by transferring the viral supernatants into a polypropylene centrifuge tube and spun at 20,000 RPM at 4°C for 2 hours using a Beckman XL-90 Ultracentrifuge. For overexpression of human VCAM1, we recombined pOTB7/VCAM1 vector (Open Biosystems Library - Einstein Molecular Cytogenetics Core) with pDONR221 vector (Thermo Fisher Scientific) by BP reaction of Gateway cloning System (Thermo Fisher Scientific). The resulting plasmids were recombined with pHIV-IRES-ZsGreen vector (a kind gift from Chan-Jung Chang at Mount Sinai School of Medicine and Eric E. Bouhassira at Albert Einstein College of Medicine) by LR reaction of Gateway cloning System to generate a pHIV-ZsGreen/VCAM1 vector. Lentiviruses were generated by transfecting 12μg of pHIV-ZsGreen/VCAM1 or empty control vector, and packaging vectors (0.6μg tat vector, 0.6μg rev vector, 0.6μg gag/pol vector, and 1μg vsv-g vector) into HEK-293T cells using 45μl TransIT-X2 transfection reagent. Supernatant was collected and filtered as described above.
AML generation and in vivo treatments.
AML cells harbouring the MLL-AF9 fusion protein were generated as previously described35. Briefly, LSK cells were sorted from Control or Vcam1Csf1r-iCre mice, transduced with pMSCV-MLL-AF9-GFP for 40 hours. GFP+ cells were then FACS-sorted again and grown in methylcellulose (M3234, Stem Cell Technologies) supplemented with IL-3 for six passages. For primary transplantation, mice were sublethally irradiated with 600 cGy in a Cesium Mark 1 irradiator (JL Shepherd & Associates) and transplanted retro-orbitally under isoflurane anaesthesia with 5 × 10⁵ pre-leukaemic cells from in vitro culture. Mice undergoing serial transplantations were injected with 20,000-sorted GFP+ cells from control or Vcam1Csf1r-iCre primary AML recipients, or with 20,000 total BMNCs from control AML mice with no prior irradiation. MLL-AF9-GFP-LUCIFERASE-TOMATO cells were generated by transducing pre-leukaemic AML-Vcam1fl/fl and AML-Vcam1Csf1r-iCre cells with pHIV-EF1-Luc-IRES-Tomato for 40 hours and GFP+ Tomato+ cells sorted and processed as described above. For in vivo AML therapy, immunocompetent C57BL/6 mice were transplanted with 20,000 total BMNCs from C56BL/6 wild-type (H-2b) AML. Treatment started when disease was fully established, and animals presented 20–50% circulating AML-GFP+ cells. Mice received a daily i.p. injection of IgG from rat serum (100 μg/day, Sigma-Aldrich), anti-VCAM1 blocking antibody (100 μg/day, clone M/K2.7 Bio X Cell), the chemotherapeutic agent cytarabine (100 mg/kg, Sigma-Aldrich), or a combination of anti-VCAM1/cytarabine for 5 days. MOLM-13 cells were obtained from the Deutsche Sammlung von Mikroorganismen und Zellkulturen GmbH (DSMZ), via Dr. Ulrich Steidl (Albert Einstein College of Medicine). Cells were transduced with a lentivirus harbouring pHIV-ZsGreen/VCAM1, generated as above described. ZsGreen+ cells were sorted on day 5 post-transduction and maintained in IMDM plus 10% FBS and 1% penicillin-streptomycin. For xenotransplantation experiments non-irradiated NSG mice were transplanted with 1 million cells. For human primary AML xenotransplantation experiments, NSG mice were sub-lethally irradiated (200 cGy) 24h before transplantation. Human mononuclear cells, derived from patients with the initial diagnosis of AML, were depleted of CD3+ and CD56+ cells and transplanted via retro-orbital route in NSG mice. Human AML samples were obtained from patients at the Montefiore Medical Center according to IRB-approved protocols. Patients diagnosed with AML presented the following characteristics: patient #V1 with AML: very high blast count and NRAS, SF3B1, DNMT3A, RUNX1 and BCOR mutations; patient #V2 with refractory AML and KRAS, NRAS and SRSF2 mutations; patient #V3 with AML from JAK2-negative MPN that evolved into AML; patient #V4 with AML; patient #V5 with high risk MDS/AML and NRAS, TET2, ASXL1 and RAD21 mutations; patient #V6 with AML normal karyotype; #V7 with AML and NPM1 mutation; #V8 with AML and FLT3, DNMT3A, NPM1 and WT1 mutations. No personal information is available for the samples. Treatment started when disease was established, and animals presented >1% circulating human CD45+ cells. Mice received a daily i.p. injection of IgG1 (100 μg/day, Sigma-Aldrich) or anti-VCAM1 blocking antibody (100 μg/day, clone V64/8, produced in our laboratory), for 10 days and the treatment was repeated 1 month later.
Generation of anti-hVCAM1 mAb.
BALB/c mice were immunized with recombinant human VCAM1 protein (R&D systems). Hybridomas producing monoclonal antibodies (mAbs) against human VCAM1 were generated by standard techniques from splenocytes fused to Ag8.653 or NSObcl2 myeloma cells. Clone V64 (IgG1) was firstly selected by an enzyme-linked immunosorbent assay screen as its mAb recognized VCAM1 peptide/protein, but not human IgG. Subclone V64/8 was further selected and validated by FACS staining and in vitro cell adhesion studies. mAbs were then concentrated and purified from hybridoma supernatant.
Generation of anti-hVCAM1 Fab fragments.
Fab fragments from anti-human VCAM1 V64/8 antibody were generated using the Fabulous Fab kit (Genovis) following the manufacturer’s instructions. Fragments were tested by FACS analysis using anti-mouse kappa light chain specific (Invitrogen) and anti-mouse IgG Fc specific secondary antibodies (Sigma) at 0.2 ug/1 million cells.
Bioluminescence imaging.
In vivo bioluminescence imaging was performed and analysed using an IVIS imaging system 200 series (Xenogen). Bioluminescent signal was induced by i.v. injection of D-luciferin (PerkinElmer, 150 mg/kg in PBS) 2 min before in vivo imaging.
Phagocytes and CD8+ T cells depletion.
Phagocytic cells were depleted by injecting i.v. 200 μl of clodronate- or PBS-encapsulated liposomes (ClodronateLiposomes.org) 48 hours prior to AML cell injections. Mice were further injected with 100 μl every week thereafter to maintain phagocyte depletion. CD8+ T cells were depleted by two injections of 200 μg of anti-CD8 monoclonal antibody (clone 2.43, BioXcell) or control rat IgG (Sigma-Aldrich) i.p. on days −2 and −1 before BM transplantation.
Statistics & Reproducibility.
All data are represented as mean ± s.e.m. Comparisons between two samples were done using the paired and unpaired Student’s t tests or Mann-Whitney test. Log-rank analyses were used for Kaplan-Meier survival curves. Two-way ANOVA with multiple comparisons correction and one-way ANOVA analyses followed by Tukey’s multiple comparison tests were used for multiple group comparisons. Two-sample Kolmogorov–Smirnov tests were used for comparisons of distribution patterns. Statistical analyses were performed with GraphPad Prism. No statistical method was used to predetermine sample size. No data were excluded from the analyses. Mice with the correct genotypes were randomly assigned to control or treated groups. The investigators were not blinded to allocation during experiments and outcome assessment.
Data availability
Previous published data that were re-analysed here are available under accession codes: GSE1035842 and GSE35008/GSE35010 REF44, 45. Human AML survival data were derived from the TCGA Research Network: http://cancergenome.nih.gov/ and re-analysed via the cBioPortal for Cancer Genomics from the Memorial Sloan Kettering Cancer Center https://cbioportal.mskcc.org. Source data are provided with this paper. All other data supporting the findings of this study are available from the corresponding author on reasonable request.
Extended Data
Extended Data Fig. 1. VCAM1 is expressed on HSCs and progenitor cells.
(a, b) Gating strategies for the analyses of HSC and progenitor populations. (c) Representative histograms of VCAM1 expression levels in the populations represented. (d) Percentage of VCAM1 positive cells within progenitor cell populations from the bone marrow (BM) and spleen (n=3 biological replicates). (e) FACS analysis of the BM and spleen of Csf1r-iCre;loxp-TdTomato transgenic mice showing the recombination efficiency of Csf1r-iCre in phagocytes, HSC and MPP (n=3 biological replicates). Error bars, mean ± s.e.m. LMPP (lymphoid primed MPPs, LSK Flt3+); GMP (granulocyte macrophage progenitors, Lineage- c-Kit+ Sca1- CD34+ FcγRII/III+); CMP (common myeloid progenitors, Lineage- c-Kit+ Sca1- CD34+ FcγR-); MEP (megakaryocytic erythroid progenitors, Lineage- c-Kit+ Sca1- CD34- FcγR-) and CLP (common lymphoid progenitors, Lineage- c-Kitlow Sca1low Flt3+ IL7Rα+).
Extended Data Fig. 2. Vcam1-deficient HSCs exhibit normal viability, cell cycle and proliferation.
(a) Outline of experimental strategy. (b) Survival curve of recipient mice given lethal radiation and transplanted with 2 million BM nuclear cells (BMNCs) from Vcam1fl/fl (Control, n=7) and Vcam1Csf1r-iCre (n=8) mice, non-competitive transplantation. (c) Donor engraftment following secondary competitive reconstitution assay of BM from mice that survived the primary transplantation shown in (b) (Vcam1fl/fl n=4; Vcam1Csf1r-iCre n=5 mice). (d) Outline of experimental strategy. (e) Donor engraftment following competitive reconstitution assay from Vcam1fl/fl (n=9) and Vcam1Csf1r-iCre (n=10) mice. (f) Contribution of 200 sorted DAPI– LSK CD48– CD150+ VCAM1+ and VCAM1– HSCs to peripheral blood following competitive reconstitution. (n=6 biological replicates) (g) Absolute number of BMNCs, and (h) HSCs and MPPs per femur in Vcam1fl/fl and Vcam1Csf1r-iCre mice (n=5 biological replicates). (i) Colony output on day 7 of BM colony-forming unit in culture from Vcam1fl/fl and Vcam1Csf1r-iCre mice. GEMM: granulocyte, macrophage, erythroid and megakaryocyte; GM: granulocyte and macrophage; M: macrophage; G: granulocyte; BFU-E: erythroid (n=3 biological replicates). (j) Concentration of white blood cells (WBC), erythrocytes (RBC) and platelets (PLTs) in the blood of Vcam1Csf1r-iCre mice as compared to littermate Vcam1fl/fl (n=12 biological replicates). (k) Percentage of viable (Annexin V- DAPI-) HSC and MPP in the BM of Vcam1fl/fl and Vcam1Csf1r-iCre mice. (n=3 biological replicates) (l) Cell cycle analysis, using anti-Ki67 and Hoechst 33342 staining, of HSCs from Vcam1fl/fl and Vcam1Csf1r-iCre mice (n=4 biological replicates). Error bars, mean ± s.e.m. Box plots: media, whiskers: minimum and maximum. Log-rank analysis was used for the Kaplan-Meier survival curves in (b). Unpaired two-tailed student’s t test (c-l). Significant P values are indicated in the figure.
Extended Data Fig. 3. The distribution of HSCs in the mouse BM is not altered after Vcam1 deletion in Csf1r-iCre+ cells.
(a) Representative whole-mount images of the sternal BM of Control and Vcam1Csf1r-iCre mice and magnified high power view. The dashed outline denotes bone-BM border. Arterioles (Art) are identified by CD31+ CD144+ Sca1+ expression. Phenotypic HSCs are identified by Lineage- CD41- CD48- CD150+ expression, and megakaryocytes (Mk) are distinguished by their size, morphology and CD41+ CD150+ expression. Representative images of n=8 independent sternum segments (b, c) Localization of HSCs relative to (b) arterioles and (c) Mks in Vcam1fl/fl and Vcam1Csf1r-iCre mice. (n=104 HSCs in Vcam1fl/fl, n=90 HSCs in Vcam1Csf1r-iCre) (d) Number of BMNCs, MPP and HSC per femur in Vcam1fl/fl and Vcam1Csf1r-iCre mice after 5-FU injection (Vcam1fl/fl day 0 n=5, day 5 n=2, day 8–20 n=3, day 25 n=4; Vcam1Csf1r-iCre day 0 n=5, day 5–15 n=2, day 20–25 n=4 biological replicates). (e) Spleen cellularity, and (f) number of HSCs and MPPs per spleen in Vcam1fl/fl and Vcam1Csf1r-iCre mice (n=5 biological replicates). Error bars, mean ± s.e.m. Two-sample Kolmogorov–Smirnov tests were used for comparisons of distribution patterns in (b) and (c). Unpaired two-tailed student’s t test (d,e,f). Significant P values are indicated in the figure.
Extended Data Fig. 4. VCAM1 is a “don’t-eat-me” signal.
(a) Contribution of 300 sorted DAPI– LSK CD48– CD150+ Vcam1+ (n=8 biological replicates) or Vcam1– (n=7 biological replicates) HSCs to peripheral blood following competitive reconstitution. (b) Quantification of tri-lineage (myeloid, B lymphoid, and T lymphoid cells) engraftment 16 weeks post-transplantation. Vcam1+ (n=8 biological replicates), Vcam1– (n=7 biological replicates). (c) Representative BM FACS plots showing donor HSC contribution to recipient CD45.2+ LSK CD48– CD150+ Vcam1+ and Vcam1– HSCs compartment, at 16 weeks from the mice analysed in (a) and (b). (d) Absolute number of donor (CD45.2) Vcam1fl/fl and Vcam1Csf1r-iCre cells that homed to the BM of lethally irradiated CD45.1 recipients, 3 hours after injection (n=5 biological replicates). (e) Representative FACS plots of the in vivo phagocytosis assay in Fig. 1e. (f) Outline of experiment strategy. Lethally irradiated CD45.1 recipients were transplanted competitively with 2 million of Vcam1Csf1r-iCre or Vcam1fl/fl BMNCs. At day 6 the BM of recipient mice were analysed by FACS and the number of host phagocytic Gr1high monocytes, Gr1low monocytes and macrophages quantified. (n=4 mice). Error bars, mean ± s.e.m. Box plots: media, whiskers: minimum and maximum. Unpaired two-tailed student’s t test. Significant P values are indicated in the figure.
Extended Data Fig. 5. Csf1r-iCre transgene is genetically linked to the MHC locus.
(a) Representative FACS plots of DAPI− BMNCs cells from the same H-2b/q MHC-haplotype heterozygous mouse. Cells were stained with antibodies against MHC-I and II subclasses corresponding to the H-2b (C57BL/6 strain) and H-2q (FVB/N strain) haplotypes. (b) Calculation of the frequency of recombination between the Csf1r-iCre transgene and the MHC locus. (c) Quantification of tri-lineage (myeloid, B cell and T cell) engraftment in the blood of mice analyzed in Fig. 2b–d (Vcam1fl/fl;H-2b/b (n=7); Vcam1Csf1r-iCre;H-2b/b (n=6); Vcam1fl/fl;H-2b/q (n=12); Vcam1Csf1r-iCre;H-2b/q (n=10 biological replicates) ). (d) Quantification of the in vitro phagocytosis of syngeneic and haplotype-mismatched control and Vcam1-null Lineage– cells incubated with freshly sorted phagocytes (Macrophages n=6, Gr1high Monocytes n=5 biological replicates). (e-f) Recipient mice were treated with a monoclonal anti-CD8 antibody or IgG control, lethally irradiated, and transplanted with 1 million BMNCs from haplotype-mismatched control Vcam1fl/fl or Vcam1Csf1r-iCre mice. (e) Representative FACS plots and percentage of T cell populations in the peripheral blood of mice treated with anti-CD8 antibody or IgG control before transplantation. (f) Survival curves of recipient mice depleted of CD8+ T cells and BM transplanted (n=5 biological replicates). Error bars, mean ± s.e.m. Box plots: media, whiskers: minimum and maximum. Log-rank analysis was used for the Kaplan-Meier survival curves in (f) and one-way ANOVA analyses followed by Tukey’s multiple comparison tests (c, d). Significant P values are indicated in the figure.
Extended Data Fig. 6. Vcam1 “don’t-eat-me” activity is partially regulated by PIR-B.
(a) Vcam1 is efficiently depleted in Vcam1Mx1-Cre bone marrow HSCs, as seen by FACS (n=3 biological replicates), 3 weeks after the first poly I:C (pIpC) injection. PolyI:C was administered intraperitoneally (i.p.) every other day at 5mg/kg to a total of 3 doses. (b) Outline of competitive bone marrow transplantation experimental strategy. (c) Quantification of long-term reconstituting HSCs from syngeneic Vcam1fl/fl and Vcam1Mx1-Cre mice after poly I:C treatment by competitive reconstitution assay in the blood (Vcam1fl/fl n=5, Vcam1Mx1-Cre n=3 biological replicates). (d) Phospho-flow analysis of tyrosine phosphorylation (P-TYR) levels in host CD45.1+ PIR-B+ phagocytic cells transplanted with syngeneic and haplotype-mismatched CD45.2 Vcam1fl/fl and Vcam1Csf1r-iCre cells, at day 6. P-TYR levels are represented as median fluorescent intensity (MFI) normalised to the basal P-TYR levels of phagocytic cells in Pirb−/− mice (n=5 biological replicates). (e) Donor haematopoietic cell engraftment following competitive reconstitution from syngeneic and haplotype mismatch Vcam1fl/fl and Vcam1Csf1r-iCre cells into Pirb−/− recipients (n=6 biological replicates). (f, g) Donor haematopoietic reconstitution of syngeneic Vcam1fl/fl and Vcam1Vav-iCre cells following competitive reconstitution assays into (f) Pirb−/− (Vcam1fl/fl n=6, Vcam1Vav-iCre n=8 biological replicates) or (g) wild-type mice (Vcam1fl/fl n=7, Vcam1Vav-iCre n=9 biological replicates), 1-week post-transplantation. Donor cell engraftment was evaluated by detecting the levels of donor male DNA in the female recipient blood, by real-time PCR (e-g). (h) Quantification of the in vitro phagocytosis of syngeneic and haplotype-mismatched control and Vcam1-null Lineage– cells incubated with freshly sorted Pirb−/− phagocytes (macrophages n=4, Gr1high monocytes n=5 biological replicates). Error bars, mean ± s.e.m. Box plots: media, whiskers: minimum and maximum. Unpaired two-tailed student’s t test (a, c, f, g) and one-way ANOVA analyses followed by Tukey’s multiple comparison tests (d, e, h). Significant P values are indicated in the figure.
Extended Data Fig. 7. Loss of Vcam1 inhibits the establishment and progression of haplotype–mismatched and syngeneic MLL-AF9-induced AML.
(a) Outline of experimental strategy. (b) Representative FACS plots of BM leukaemic stem cells (LSCs) from control AML-Vcam1fl/fl (top) and AML-Vcam1Csf1r-iCre (bottom) primary recipients, 55 days after transplantation. (c) Histogram showing the presence of leukaemic VCAM1+ LSCs derived from Vcam1Csf1r-iCre mice in the BM of moribund secondary recipient mice, 103 days post-transplant. (d-e) Analysis of blood (left graph) and BM aspirates (right graph) from primary recipients transplanted with syngeneic Vcam1fl/fl or Vcam1Csf1r-iCre-transduced MLL-AF9-GFP LSKs, after 115 and 130 days. The red circle shows a leukemic mouse in which AML was derived from an escaped VCAM1+ clone. Left panel: P=0.0153 (P=0.003 if the VCAM1+ highlighted mouse is excluded); right panel: P=0.1011 (P=0.03 if the VCAM1+ highlighted mouse is excluded) (Vcam1fl/fl n=10, Vcam1Csf1r-iCre n=8 biological replicates) (e) Histogram showing the presence of leukaemic VCAM1+ LSCs in the BM of the sick primary recipient mouse of syngeneic Vcam1Csf1r-iCre AML, highlighted with red circle in (d). (f) MLL-AF9-GFP+ cells were incubated in the presence of anti-VCAM1 blocking antibody, isotype control or camptothecin-positive control. After 4.5 hours incubation, apoptotic cells were identified by Annexin V staining, as determined by FACS (n=4 biological replicates). Error bars, mean ± s.e.m. Mann-Whitney tests (d) and one-way ANOVA analyses followed by Tukey’s multiple comparison tests (f). Significant P values are indicated in the figure.
Extended Data Fig. 8. Treatment of wild-type mice with a blocking anti-VCAM1 monoclonal antibody.
(a) Wild-type mice were daily injected with IgG control or blocking rat anti-mouse VCAM1 antibody for 5 days. Mice were analyzed 1 day after the last injection. BM cells from treated groups were incubated with an anti-rat antibody and after washing stained for phenotypic HSCs and probed for VCAM1 expression. (b) BM cellularity and (c) absolute number of HSC, MPP and LSK per femur and (d) per ml of blood in healthy C57BL/6 mice treated for 5 days with daily injections of either anti-VCAM1 or IgG control antibody (n=5 biological replicates). (e) Peripheral blood was drawn post-treatment and hematology lab analysis was performed. White blood cell (WBC), red blood cell (RBC), hemoglobin (HGB), hematocrit (HCT), platelets (PLT), neutrophils (Neut.), lymphocytes (Lymph.), reticulocytes (Retic.) (n=5 biological replicates). (f) Colony-forming unit (CFU) in culture from the BM of wild-type mice injected with IgG1 or anti-VCAM1 antibody for 5 days. GEMM: granulocyte, macrophage, erythroid and megakaryocyte; GM: granulocyte and macrophage; BFU-E: erythroid (n=3 biological replicates). (g) Contribution of 200 sorted DAPI– LSK CD48– CD150+ HSCs isolated from wild-type mice 1 day after IgG1 or anti-VCAM1 antibody treatment as in (a) to the peripheral blood following competitive reconstitution (n=6 biological replicates). (h) Quantification of tri-lineage (myeloid, B lymphoid, and T lymphoid cells) engraftment from the mice in (g) (n=6 biological replicates). (i) Survival curve of wild-type mice daily injected with IgG control or blocking anti-mouse VCAM1 antibody for 10 days. (n=6 biological replicates). Error bars, mean ± s.e.m. Unpaired two-tailed student’s t test (b-h), and log-rank analysis was used for the Kaplan-Meier survival curves in (i). Significant P values are indicated in the figure.
Extended Data Fig. 9. Mechanisms of VCAM1 antibody inhibition in leukemogenesis.
(a) BM cellularity and (b) number of MOLM-13 cells that homed to the BM of recipient mice (n=5 Mock, n=4 hVCAM1 biological replicates). (c) Percentage of Annexin V+ apoptotic (n=5 biological replicates) and (d) proliferating BrdU+ MOLM-13 cells in the BM of recipients (n=5 biological replicates). (e) Survival analysis of mice with established MOLM-13 AML (>1% peripheral human CD45+ cells) and treated with daily injections (for 10 days) of IgG1 and anti-mouse Vcam1 monoclonal antibody which does not cross-react with human VCAM1. (f) Survival analysis of mice with established hVCAM1-MOLM-13 AML (>1% peripheral human CD45+) treated with daily injections (10 days) of anti-human VCAM1 monoclonal antibody or with PBS or clodronate liposomes. (g) Human Mock- and hVCAM1-MOLM-13 cells incubated with anti-human VCAM1 Fab fragments and with secondary antibodies specific against mouse IgG kappa light chain (left) or against mouse IgG Fc portion. (h) Survival analysis of mice with established hVCAM1-MOLM-13 AML and treated with anti-human VCAM1 monoclonal antibody, anti-human VCAM1 Fab fragments or with IgG1 for 5 days. (i) In vivo phagocytosis assay testing the effect of integrin alpha 4 blocking antibody in the clearance of transplanted haplotype-mismatched cells (n=4 biological replicates). (j) In vitro phagocytosis of Mock-MOLM-13 and hVCAM1-MOLM13 cells, in the presence of anti-alpha4, anti-beta1, anti-alpha4-beta7 blocking antibodies, compared with IgG. Values were normalized to the maximum number of events measured across technical replicates (n=6). Error bars, mean ± s.e.m. Box plots: media, whiskers: minimum and maximum. Unpaired two-tailed student’s t test (a-d, i). Log-rank analysis was used for the Kaplan-Meier survival curves in (e, f, h). Two-way ANOVA with multiple comparisons correction (j). ns, non-significant. Significant P values are indicated in the figure.
Extended Data Fig. 10. VCAM1 is broadly expressed across human AML subgroups.
(a-b) Published gene expression microarray data from 183 patients (GSE10358) was analyzed for the expression of VCAM1 across French-American-British (FAB) subgroups of human AML. (a) VCAM1 is broadly expressed across all FAB AML subgroups with the highest expression on the M6 subgroup. (b) Association between VCAM1 expression and human AML mutations. The only statistically significant difference detected was a lower expression of VCAM1 in NPM1 mutated AML compared to the others. DNMT3A, mutation of the DNMT3A gene; FLT3-ITD, internal tandem duplication of the FLT3 gene; FLT3-TKD, tyrosine kinase domain mutation of the FLT3 gene; IDH1 and 2, mutation of the IDH1 and 2 genes; NPM1, mutation of the NPM1 gene. Box plots: media, whiskers: minimum and maximum. Mann-Whitney test (a, b). (c) VCAM1 gene expression data from sorted human AML BM samples and healthy controls (GSE35008 and GSE35010). Lineage− CD34+ CD38− CD90+ cells (referred to as LT-HSCs), Lineage− CD34+ CD38− CD90− cells (referred to as ST-HSCs), and Lineage− CD34+ CD38+ CD123+ CD45RA+ cells (referred to as GMPs). Cytogenetic abnormalities are depicted as: NK, normal karyotype; CK, complex karyotype; 7q, deletion of chromosome 7 (LT-HSCs healthy, NK, 7q n=4, CK n=5; ST-HSCs healthy,7q n=6, NK, CK n=4; GMP healthy, 7q n=6, NK n=4, CK n=5 human samples). Box plots: media, whiskers: minimum and maximum. One-way ANOVA analyses followed by Tukey’s multiple comparison tests (c). (d) Representative flow-cytometry plots depicting the phagocytosis of human #V6 AML sample by human CD14+ monocytes when treated with anti-VCAM1, compared with the IgG1 control. CTFR, cell trace far red. (e) Percentage of live human CD45+ AML cells in the blood of leukaemic mice comparing pre- and post-treatment (IgG1 control (n=10 biological replicates) or anti-human VCAM1 antibody (n=9 biological replicates). Data from the mice in Fig. 5i and 5j. Significant P values are indicated in the figure.
Supplementary Material
Acknowledgements
We thank J.W. Pollard for providing Csf1r-iCre mice, T. Papayannopoulou for providing Vcam1floxed mice, T. Takai and M. Rothenberg for providing Pirb−/− mice and S.A. Armstrong for providing the MLL-AF9 construct. We thank C. Prophete, C. Cruz, P. Ciero, G. Amatuni and A. Landeros for technical assistance; the University of Illinois and the Einstein Flow Cytometry Core Facility for cell sort assistance; U. Steidl, A. Zahalka and K. Chronis for scientific discussions. S.V. Buhl and M.D. Scharff of the Macromolecule Therapeutics Core at Einstein for technical assistance and guidance with VCAM1 mAb generation. S.P. and M.M were supported by a New York Stem Cell Foundation-Druckenmiller Fellowship; J.C.B by a Pew Latin America Fellowship and CONACYT (México); H.P. by a Training Program in Cellular and Molecular Biology and Genetics (T32 GM007491); D.K.B. by a NIH training Grant (T32GM007288) and F.N. by the Japanese Society for the Promotion of Science. We thank the NIH (DK056638, HL069438, HL116340), the Leukemia and Lymphoma Society (LLS-TRP 6475-15) and the New York State Department of Health (NYSTEM IIRP C029570 and C029154) for support of the P.S.F laboratory and the Cancer Center, University of Illinois Cancer Biology Targeted Grant for support of S.P..
S.P, Q.W. and P.S.F. are co-inventors on a patent application using anti-VCAM1 antibodies (W02017205560A1). P.S.F. serves as consultant for Pfizer, has received research funding from Ironwood Pharmaceuticals and is shareholder of Cygnal Therapeutics.
Footnotes
Competing interests
The remaining authors declare no competing interests.
References
- 1.Miyake K. et al. A VCAM-like adhesion molecule on murine bone marrow stromal cells mediates binding of lymphocyte precursors in culture. J Cell Biol 114, 557–565 (1991). [DOI] [PMC free article] [PubMed] [Google Scholar]
- 2.Simmons PJ et al. Vascular cell adhesion molecule-1 expressed by bone marrow stromal cells mediates the binding of hematopoietic progenitor cells. Blood 80, 388–395 (1992). [PubMed] [Google Scholar]
- 3.Ulyanova T. et al. VCAM-1 expression in adult hematopoietic and nonhematopoietic cells is controlled by tissue-inductive signals and reflects their developmental origin. Blood 106, 86–94 (2005). [DOI] [PMC free article] [PubMed] [Google Scholar]
- 4.Pinho S. & Frenette PS Haematopoietic stem cell activity and interactions with the niche. Nat Rev Mol Cell Biol 20, 303–320 (2019). [DOI] [PMC free article] [PubMed] [Google Scholar]
- 5.Gurtner GC et al. Targeted disruption of the murine VCAM1 gene: essential role of VCAM-1 in chorioallantoic fusion and placentation. Genes & development 9, 1–14 (1995). [DOI] [PubMed] [Google Scholar]
- 6.Frenette PS, Subbarao S, Mazo IB, von Andrian UH & Wagner DD Endothelial selectins and vascular cell adhesion molecule-1 promote hematopoietic progenitor homing to bone marrow. Proceedings of the National Academy of Sciences of the United States of America 95, 14423–14428 (1998). [DOI] [PMC free article] [PubMed] [Google Scholar]
- 7.Papayannopoulou T, Craddock C, Nakamoto B, Priestley GV & Wolf NS The VLA4/VCAM-1 adhesion pathway defines contrasting mechanisms of lodgement of transplanted murine hemopoietic progenitors between bone marrow and spleen. Proceedings of the National Academy of Sciences of the United States of America 92, 9647–9651 (1995). [DOI] [PMC free article] [PubMed] [Google Scholar]
- 8.Craddock CF, Nakamoto B, Andrews RG, Priestley GV & Papayannopoulou T. Antibodies to VLA4 integrin mobilize long-term repopulating cells and augment cytokine-induced mobilization in primates and mice. Blood 90, 4779–4788 (1997). [PubMed] [Google Scholar]
- 9.Papayannopoulou T, Priestley GV & Nakamoto B. Anti-VLA4/VCAM-1-induced mobilization requires cooperative signaling through the kit/mkit ligand pathway. Blood 91, 2231–2239 (1998). [PubMed] [Google Scholar]
- 10.Koni PA et al. Conditional vascular cell adhesion molecule 1 deletion in mice: impaired lymphocyte migration to bone marrow. The Journal of experimental medicine 193, 741–754 (2001). [DOI] [PMC free article] [PubMed] [Google Scholar]
- 11.Deng L. et al. A novel mouse model of inflammatory bowel disease links mammalian target of rapamycin-dependent hyperproliferation of colonic epithelium to inflammation-associated tumorigenesis. Am J Pathol 176, 952–967 (2010). [DOI] [PMC free article] [PubMed] [Google Scholar]
- 12.Wei Q. et al. Maea expressed by macrophages, but not erythroblasts, maintains postnatal murine bone marrow erythroblastic islands. Blood 133, 1222–1232 (2019). [DOI] [PMC free article] [PubMed] [Google Scholar]
- 13.Miyamoto T. et al. Myeloid or lymphoid promiscuity as a critical step in hematopoietic lineage commitment. Dev Cell 3, 137–147 (2002). [DOI] [PubMed] [Google Scholar]
- 14.Sarrazin S. et al. MafB restricts M-CSF-dependent myeloid commitment divisions of hematopoietic stem cells. Cell 138, 300–313 (2009). [DOI] [PubMed] [Google Scholar]
- 15.Dutta P. et al. Macrophages retain hematopoietic stem cells in the spleen via VCAM-1. The Journal of experimental medicine 212, 497–512 (2015). [DOI] [PMC free article] [PubMed] [Google Scholar]
- 16.Koller BH, Marrack P, Kappler JW & Smithies O. Normal development of mice deficient in beta 2M, MHC class I proteins, and CD8+ T cells. Science 248, 1227–1230 (1990). [DOI] [PubMed] [Google Scholar]
- 17.Kubagawa H. et al. Biochemical nature and cellular distribution of the paired immunoglobulin-like receptors, PIR-A and PIR-B. The Journal of experimental medicine 189, 309–318 (1999). [DOI] [PMC free article] [PubMed] [Google Scholar]
- 18.Takai T. Paired immunoglobulin-like receptors and their MHC class I recognition. Immunology 115, 433–440 (2005). [DOI] [PMC free article] [PubMed] [Google Scholar]
- 19.Ujike A. et al. Impaired dendritic cell maturation and increased T(H)2 responses in PIR-B(−/−) mice. Nature immunology 3, 542–548 (2002). [DOI] [PubMed] [Google Scholar]
- 20.Nakamura A, Kobayashi E. & Takai T. Exacerbated graft-versus-host disease in Pirb−/− mice. Nature immunology 5, 623–629 (2004). [DOI] [PubMed] [Google Scholar]
- 21.Pereira S, Zhang H, Takai T. & Lowell CA The inhibitory receptor PIR-B negatively regulates neutrophil and macrophage integrin signaling. Journal of immunology 173, 5757–5765 (2004). [DOI] [PubMed] [Google Scholar]
- 22.Nakayama M. et al. Paired Ig-like receptors bind to bacteria and shape TLR-mediated cytokine production. Journal of immunology 178, 4250–4259 (2007). [DOI] [PubMed] [Google Scholar]
- 23.Munitz A. et al. Paired immunoglobulin-like receptor B (PIR-B) negatively regulates macrophage activation in experimental colitis. Gastroenterology 139, 530–541 (2010). [DOI] [PMC free article] [PubMed] [Google Scholar]
- 24.Ma G. et al. Paired immunoglobin-like receptor-B regulates the suppressive function and fate of myeloid-derived suppressor cells. Immunity 34, 385–395 (2011). [DOI] [PMC free article] [PubMed] [Google Scholar]
- 25.Ding YB et al. Association of VCAM-1 overexpression with oncogenesis, tumor angiogenesis and metastasis of gastric carcinoma. World J Gastroenterol 9, 1409–1414 (2003). [DOI] [PMC free article] [PubMed] [Google Scholar]
- 26.Lin KY et al. Ectopic expression of vascular cell adhesion molecule-1 as a new mechanism for tumor immune evasion. Cancer Res 67, 1832–1841 (2007). [DOI] [PMC free article] [PubMed] [Google Scholar]
- 27.Huang J. et al. Exome sequencing of hepatitis B virus-associated hepatocellular carcinoma. Nat Genet 44, 1117–1121 (2012). [DOI] [PubMed] [Google Scholar]
- 28.Yuan W. et al. Commonly dysregulated genes in murine APL cells. Blood 109, 961–970 (2007). [DOI] [PMC free article] [PubMed] [Google Scholar]
- 29.Chen Q, Zhang XH & Massague J. Macrophage binding to receptor VCAM-1 transmits survival signals in breast cancer cells that invade the lungs. Cancer Cell 20, 538–549 (2011). [DOI] [PMC free article] [PubMed] [Google Scholar]
- 30.Lu X. et al. VCAM-1 promotes osteolytic expansion of indolent bone micrometastasis of breast cancer by engaging alpha4beta1-positive osteoclast progenitors. Cancer Cell 20, 701–714 (2011). [DOI] [PMC free article] [PubMed] [Google Scholar]
- 31.Damiano JS, Cress AE, Hazlehurst LA, Shtil AA & Dalton WS Cell adhesion mediated drug resistance (CAM-DR): role of integrins and resistance to apoptosis in human myeloma cell lines. Blood 93, 1658–1667 (1999). [PMC free article] [PubMed] [Google Scholar]
- 32.Jacamo R. et al. Reciprocal leukemia-stroma VCAM-1/VLA-4-dependent activation of NF-kappaB mediates chemoresistance. Blood 123, 2691–2702 (2014). [DOI] [PMC free article] [PubMed] [Google Scholar]
- 33.Matsunaga T. et al. Interaction between leukemic-cell VLA-4 and stromal fibronectin is a decisive factor for minimal residual disease of acute myelogenous leukemia. Nature medicine 9, 1158–1165 (2003). [DOI] [PubMed] [Google Scholar]
- 34.Carlson P. et al. Targeting the perivascular niche sensitizes disseminated tumour cells to chemotherapy. Nat Cell Biol 21, 238–250 (2019). [DOI] [PMC free article] [PubMed] [Google Scholar]
- 35.Krivtsov AV et al. Transformation from committed progenitor to leukaemia stem cell initiated by MLL-AF9. Nature 442, 818–822 (2006). [DOI] [PubMed] [Google Scholar]
- 36.Jaiswal S. et al. CD47 is upregulated on circulating hematopoietic stem cells and leukemia cells to avoid phagocytosis. Cell 138, 271–285 (2009). [DOI] [PMC free article] [PubMed] [Google Scholar]
- 37.Majeti R. et al. CD47 is an adverse prognostic factor and therapeutic antibody target on human acute myeloid leukemia stem cells. Cell 138, 286–299 (2009). [DOI] [PMC free article] [PubMed] [Google Scholar]
- 38.Barkal AA et al. Engagement of MHC class I by the inhibitory receptor LILRB1 suppresses macrophages and is a target of cancer immunotherapy. Nature immunology 19, 76–84 (2018). [DOI] [PMC free article] [PubMed] [Google Scholar]
- 39.Austin R, Smyth MJ & Lane SW Harnessing the immune system in acute myeloid leukaemia. Crit Rev Oncol Hematol 103, 62–77 (2016). [DOI] [PubMed] [Google Scholar]
- 40.Freedman AS et al. Adhesion of human B cells to germinal centers in vitro involves VLA-4 and INCAM-110. Science 249, 1030–1033 (1990). [DOI] [PubMed] [Google Scholar]
- 41.Walsh GM, Symon FA, Lazarovils AL & Wardlaw AJ Integrin alpha 4 beta 7 mediates human eosinophil interaction with MAdCAM-1, VCAM-1 and fibronectin. Immunology 89, 112–119 (1996). [DOI] [PMC free article] [PubMed] [Google Scholar]
- 42.Tomasson MH et al. Somatic mutations and germline sequence variants in the expressed tyrosine kinase genes of patients with de novo acute myeloid leukemia. Blood 111, 4797–4808 (2008). [DOI] [PMC free article] [PubMed] [Google Scholar]
- 43.Falini B, Sciabolacci S, Falini L, Brunetti L. & Martelli MP Diagnostic and therapeutic pitfalls in NPM1-mutated AML: notes from the field. Leukemia (2021). [DOI] [PMC free article] [PubMed] [Google Scholar]
- 44.Barreyro L. et al. Overexpression of IL-1 receptor accessory protein in stem and progenitor cells and outcome correlation in AML and MDS. Blood 120, 1290–1298 (2012). [DOI] [PMC free article] [PubMed] [Google Scholar]
- 45.Schinke C. et al. IL8-CXCR2 pathway inhibition as a therapeutic strategy against MDS and AML stem cells. Blood 125, 3144–3152 (2015). [DOI] [PMC free article] [PubMed] [Google Scholar]
- 46.Havel JJ, Chowell D. & Chan TA The evolving landscape of biomarkers for checkpoint inhibitor immunotherapy. Nat Rev Cancer 19, 133–150 (2019). [DOI] [PMC free article] [PubMed] [Google Scholar]
- 47.Woo SR, Corrales L. & Gajewski TF Innate immune recognition of cancer. Annual review of immunology 33, 445–474 (2015). [DOI] [PubMed] [Google Scholar]
Methods References
- 48.Bix M. et al. Rejection of class I MHC-deficient haemopoietic cells by irradiated MHC-matched mice. Nature 349, 329–331 (1991). [DOI] [PubMed] [Google Scholar]
- 49.An N. & Kang Y. Using quantitative real-time PCR to determine donor cell engraftment in a competitive murine bone marrow transplantation model. J Vis Exp, e50193 (2013). [DOI] [PMC free article] [PubMed] [Google Scholar]
- 50.Pinho S. et al. Lineage-Biased Hematopoietic Stem Cells Are Regulated by Distinct Niches. Dev Cell 44, 634–641 e634 (2018). [DOI] [PMC free article] [PubMed] [Google Scholar]
Associated Data
This section collects any data citations, data availability statements, or supplementary materials included in this article.
Supplementary Materials
Data Availability Statement
Previous published data that were re-analysed here are available under accession codes: GSE1035842 and GSE35008/GSE35010 REF44, 45. Human AML survival data were derived from the TCGA Research Network: http://cancergenome.nih.gov/ and re-analysed via the cBioPortal for Cancer Genomics from the Memorial Sloan Kettering Cancer Center https://cbioportal.mskcc.org. Source data are provided with this paper. All other data supporting the findings of this study are available from the corresponding author on reasonable request.


