

Abstract
Hangzhou Bay is facing severe anthropogenic perturbation because of its geographic position. We studied species-specific bioaccumulation of metals in commercially important fishes and shellfishes, and calculated the potential human health hazards through their consumption, which has not been reported earlier from this area. The hierarchy of metal concentration in organisms was in the decreasing order of Zn (10.32 ± 7.13) > Cu (2.40 ± 2.66) > As (0.42 ± 0.26) > Cr (0.11 ± 0.08) > Cd (0.07 ± 0.07) > Pb (0.05 ± 0.02) > Hg (0.012 ± 0.009). Except for Cd and As concentrations in fishes, metal concentrations have not exceeded the national and international guideline values. P. laevis and P. trituberculatus were the most bioaccumulative of the species studied. According to the non-carcinogenic risk assessment, children were more susceptible to metal contamination than adults. The carcinogenic risk (CR) values indicated that children were likely to experience carcinogenic threats for taking cancer-causing agents As and Cd through fish consumption. In terms of organisms, intake of two crab species, P. trituberculatus and E. sinensis, as well as the oyster species P. laevis, could be detrimental to consumers.
Subject terms: Ecology, Natural hazards
Introduction
Heavy metal contamination in aquatic biological systems has become very common in recent years because of agrarian and mining practices and waste disposal from metallurgical and associated industries1–3. Due to the rapid industrial and agronomical advancement worldwide, including in China, numerous organic and inorganic contaminants have been discharged into the environment posing a significant adverse effect to biological and human life4–6. Owing to the center of intensive social and economic development, coastal bays and estuaries are suffering from severe disturbance7–9 as the sink of anthropogenic pollutants, including trace metals and metalloids7,9–11. As of now, major rivers, lakes, bays and reservoirs of China face several degrees of heavy metal pollution12. Mercury is the primary metal pollutant in Chinese waters, but copper, nickel, thallium, beryllium, and other contaminants are also severe12. In addition, industrial wastes, mining, metropolitan sewage, and waste created by metal smelting discharges excessive amounts of heavy metals in water bodies and seriously affecting the water quality12. After discharge into the waterbodies, the heavy metal can be accumulated by planktons, then aggregated in the aquatic organisms like fish, crustaceans and shellfish, and lastly, assert risks through human consumption9,13,14.
Aquatic organisms offer various health advantages since they possess high protein content and low saturated fats15–18, therefore an easily accessible source of nutrients for local inhabitants17,19,20. Because of their nutritional and healthful advantages, the overall fish utilisation has recently expanded a few times21. As an essential source of the human diet, fish quality and safety are crucial concerns for human health6,22. Heavy metal pollutants in the aquatic foodstuffs have become of particular interest, as they can accumulate in the diet sources from the surrounding environment23–25. Generally, fish can accumulate toxic elements from the contaminated water26,27, ingestion of suspended solids from water, ingestion of food material, adsorption through tissue or skin, and the lipophilic tissues like gills23,28. Some of these elements like Cu, Fe, Co and Zn are important for fish growth and metabolism29, but can be toxic when their concentrations increase and exceed the toxicity threshold30. However, non-essential elements such as Cd, As, Hg and Pb are not only poisonous to aquatic organisms but also being linked to human health problem even at low concentration21,31. Different metals are accumulated in fish body in various concentrations. In general, the metal concentration in live fishes follow the ranking: Fe > Zn > Pb > Cu > Cd > Hg32. However, many factors may impact metal uptake and accumulation like sex, age, size, reproductive cycle, swimming pattern, feeding behavior, and geographical location33. Besides, different affinity of metals to fish tissues, different uptake, deposition and excretion rates causes the difference of bioaccumulation in the fish body32. Among the different ways of metal accumulation (ingestion, inhalation, skin contact), dietary intake is the potential principle pathway of commencement to trace elements for the vast majority23,34. Therefore, heavy metals' uptake of long endured contaminated organisms causes severe diseases including food poisoning, liver damage, cardiovascular disorder, and even fatality21,35. Besides, fishes act as bio-indicators to assess the aquatic ecosystem's status as they are easily accessible in huge quantities and susceptible to accumulating trace elements21,36. Human health hazard assessment can also provide factual information to management authorities to take necessary steps23. Therefore, many local and worldwide monitoring projects have been established to evaluate the status of fish for human consumption and to assess the health of aquatic ecosystem33,37. Besides, there are several guidelines follows worldwide for the maximum permitted concentration of certain metals in specified foods. These national or international standards for the heavy metals in aquatic organisms serve as the scale of the degree of contamination level.
As the world's largest developing economy38, China has experienced a tremendous industrial bloom since 197839, hence confronting severe unsettling of the estuarine and coastal environment38. Among China's coastal region, the health status of Hangzhou Bay (HB) is deteriorating day by day as the areas surrounding HB has undergone rapid development in the last few decades40. For example, the gross domestic product depicts economic growth, which has increased in this region from 197.7 billion to 1959.6 billion RMB from 1996 to 201639,41. Therefore, the marine environment of HB has been deteriorated due to enhanced anthropogenic activities30. Besides, the HB is one of the most significant areas for the country's fisheries production41,42. Such as Zhoushan Islands, an islands city of HB, is China's most significant fisheries production, processing, and marketing base43. Hence, the assessment of ecosystems and organism’s health, and relevant human health risk is indispensable in this area. There are several studies on major and trace elements and their harmful effects, but mainly focused on either sediment or water40,44–46 or their transport and transformation mechanism47. Yet, human health risk evaluation from those heavy metals through consumption of common fishes has not been associated in the Hangzhou Bay. Although in our recently published paper48 we drew a brief overview of the metal contamination in water, sediment and higher trophic groups in this area, there is scanty information about the metal bioaccumulation status in common aquatic species and the consequent human health hazard.
Therefore, the aim of this research was to determine the accumulation level of heavy metals (Zn, Cu, Pb, Cd, Cr, Hg and As) in commercially important aquatic species from the Hangzhou Bay, and relevant human health risk for different age groups. Besides, this will set up a baseline information about the metal contamination level in the common fisheries species in this area.
Materials and methods
Study area
The Hangzhou Bay, a typical funnel-shaped macrotidal estuary47,49, is located in the northern Zhejiang province, covering about 8500 km240. This area is surrounded by six megacities and nine industrial parks (Fig. 1). Generally, industrials parks are the major contributors to the country's economy38; hence hundreds of millions of m3 wastewater are discharged into this area from those industries38,50. Moreover, except for the megacity Shanghai, there are 22 economic-technological development zones (ETDZ) and high-tech industry development zones (HIDZ) in this area (Fig. 1)39. Among these development zones (DZ), different areas are famous for distinguished industrial and economic activities. For example, Ningbo is a port city that handles millions of tons of cargo and ranks the world's first39. The logistics industry is famous in the City of Zhoushan, and the textile industry in the City of Shaoxing supports a considerable contribution to the regional economy. Besides, Shanghai city, located at the north bank of HB (Fig. 1), is one of the largest cities in the world, covering an area of 6430 km2 and the most prominent economic hub in China51. Because of this geographical setting, the HB faces severe anthropogenic disturbance and acts as the ultimate sink of pollutants from these DZ.
Figure 1.

Sampling locations and the study area of the Hangzhou Bay. The development zones (DZ), bridges and ports were graphically presented following previous literature39.
Sampling parameters, methods and analysis
This report is the sequel of our recently published paper from this area48. Therefore, for the detailed sampling methods and analysis, the paper mentioned above is referred to. In brief, samples were collected from 33 sites during four seasons (Spring—May 2018, Summer—July 2018, Autumn—October 2018, Winter—January 2019) to analyze Cd, Cu, Pb, Zn, Hg, As and Cr in the organism's muscles. The bottom trawling collected four types of organisms, including six fish species, two crabs, two prawns, and an oyster species (Table 1). The sampled organisms were identified following existing literature52–54 based on their key characteristics. The edible muscles from these organisms we cut and stored in – 20 °C. All procedures strictly followed the specification of marine organism's analysis in China55. In brief, the muscle tissue samples were freeze-dried in the laboratory. An amount of 0.5 g samples were then placed in nitric acid (10 ml) and perchloric acid (1 ml). The solution was then put into a microwave digester for 2 h. After that for each samples the total concentrations of metals were analyzed using the Flameless Graphite Furnace Atomic Absorption Spectrometry, Flame Atomic Absorption Spectrometry and Atomic Fluorescence Spectrometry (Supplementary Table 1). Moreover, the Chinese National certified reference material (BW-HZ001 quality control sample of heavy metals in organisms) was used for the validation and accuracy. The detection level, recovery range of all metals are given in Supplementary Table 1. All the chemicals we used for this study were of analytical quality grade (Merck, Germany).
Table 1.
Heavy metal concentrations (mg/kg) in targeted species, their feeding behavior, comparison with guideline values and related studies (values in bold denote the exceeded permissible limit).
| Groups | Spcies name | N | Feeding behavior | Cu | Pb | Cd | Zn | Hg | As | Cr | References |
|---|---|---|---|---|---|---|---|---|---|---|---|
| Fish | Coilia nasus | 34 | Pelagic | 0.48 ± 0.52 | 0.06 ± 0.06 | 0.02 ± 0.02 | 6.94 ± 3.50 | 0.02 ± 0.01 | 0.22 ± 0.10 | 0.09 ± 0.05 | Present study |
| Collichthys lucidus | 45 | Demarsal | 0.36 ± 0.13 | 0.06 ± 0.05 | 0.02 ± 0.02 | 4.93 ± 0.69 | 0.01 ± 0.01 | 0.21 ± 0.09 | 0.07 ± 0.03 | ||
| Cynoglossus joyneri | 4 | Demarsal | 0.44 ± 0.04 | 0.06 ± 0.004 | 0.01 ± 0.001 | 6.18 ± 0.75 | 0.003 ± 0.0004 | 0.35 ± 0.06 | 0.05 ± 0.004 | ||
| Harpadon nehereus | 16 | Benthopelagic | 0.35 ± 0.17 | 0.07 ± 0.06 | 0.06 ± 0.01 | 4.80 ± 1.17 | 0.01 ± 0.001 | 0.15 ± 0.02 | 0.07 ± 0.04 | ||
| Lophiogobius ocellicauda | 7 | Demarsal | 0.65 ± 0.53 | 0.05 ± 0.02 | 0.04 ± 0.01 | 6.16 ± 2.14 | 0.01 ± 0.004 | 0.20 ± 0.13 | 0.06 ± 0.02 | ||
| Miichthys miiuy | 4 | Demarsal | 0.48 ± 0.04 | 0.03 ± 0.01 | 0.04 ± 0.002 | 4.77 ± 0.38 | 0.01 ± 0.005 | 0.19 ± 0.05 | 0.09 ± 0.004 | ||
| Crab | Eriocheir sinensis | 3 | Demarsal | 1.14 ± 0.08 | 0.07 ± 0.01 | 0.06 ± 0.002 | 17.00 ± 9.48 | 0.02 ± 0.02 | 0.73 ± 0.48 | 0.17 ± 0.09 | |
| Portunus trituberculatus | 5 | Demarsal | 6.62 ± 1.72 | 0.07 ± 0.01 | 0.13 ± 0.10 | 14.43 ± 4.18 | 0.01 ± 0.002 | 0.87 ± 0.15 | 0.20 ± 0.08 | ||
| Prawn | Exopalaemon annandalei | 3 | Benthopelagic | 3.90 ± 3.17 | 0.02 ± 0.03 | 0.09 ± 0.01 | 9.98 ± 1.19 | 0.004 ± 0.01 | 0.35 ± 0.11 | 0.06 ± 0.01 | |
| Exopalaemon carinicauda | 3 | Benthopelagic | 5.20 ± 3.55 | 0.01 ± 0.001 | 0.07 ± 0.06 | 8.89 ± 5.50 | 0.01 ± 0.01 | 0.41 ± 0.26 | 0.03 ± 0.03 | ||
| Oyster | Potamocorbula laevis | 4 | Demarsal | 7.30 ± 4.79 | 0.08 ± 0.01 | 0.24 ± 0.29 | 28.56 ± 11.85 | 0.03 ± 0.03 | 0.72 ± 0.53 | 0.28 ± 0.34 | |
| Guideline values | |||||||||||
| Fish | National standard | 20 | 2 | 0.6 | 40 | 0.3 | – | 1.5 | 80 | ||
| FAO/WHO | 30 | 1 | 0.2 | 30 | 0.6 | 0.26 | 81 | ||||
| Crustacean | National standard | 100 | 2 | 2 | 150 | 0.2 | – | 1.5 | 80 | ||
| Shellfish | National standard | 10 | 0.1 | 2 | 20 | 0.05 | 1 | 0.5 | 80 | ||
| FAO | 30 | 0.5 | 2 | 30 | – | – | – | 82 | |||
| Comparison with recent reports | |||||||||||
| Fish | Meiliang Bay,China | 0.336 | 0.636 | 0.173 | – | – | – | 0.118 | 83 | ||
| Shellfish | 1.27 | 1.49 | 0.19 | – | – | – | 0.60 | ||||
| Fish | Pearl River, China | 5.21 | 6.80 | 4.61 | 40.3 | – | – | 2.14 | 72 | ||
| Fish | Taihu Lake, China | 0.64 | 0.24 | 0.03 | 14.42 | – | – | 0.12 | 73 | ||
| Fish | Daya Bay, China | 0.9 | 2.2 | 0.011 | 18.9 | 0.23 | 0.10 | 0.36 | 74 | ||
| Fish | Karnaphuli estuary, Bangladesh | 12.10 | 13.88 | 0.39 | – | – | 4.89 | 3.36 | 66 | ||
| Fish | Santa Maria Bay, Mexico | 0.059 | 0.086 | 0.2 | 1.161 | – | – | 0.175 | 76 | ||
| Fish | Palk Bay, India | 0.9–8.86 | 0.1–0.12 | 0.02–0.28 | 18.80–55.14 | 75 | |||||
| Shellfish | Taihu Lake, China | 1.6 | 0.1 | 1.7 | 127 | – | 1.9 | – | 77 | ||
| Crustacean (Crab) | Xiangshan Bay, China | 10.6 | 0.10 | 0.06 | 40.7 | 0.07 | 2.55 | 0.08 | 11 | ||
| Crustacean (Prawn) | 5.30 | 0.07 | 0.01 | 13.5 | 0.03 | 1.30 | 0.05 | ||||
Bioaccumulation factor
Bioaccumulation factor (BAF) is generally calculated as the ratio between metal concentrations in muscles and water56,57 and considered as the degree of metal concentrations in the organism57,58.
Here Cm is the metal concentration in the organism's muscle, Cw is the metal concentration in water. Further, BAF was classified as less bioaccumulative (BAF < 1000), bioaccumulative (1000 < BAF < 5000) and highly bioaccumulative (BAF > 5000)59.
Human health risk assessment
Estimated daily intake (EDI)
EDI was assessed based on the metal concentrations in food and their daily consumption amount and calculated by the following equation:
where C is the metal concentration in an organism's muscle (mg/kg, wet weight); IR- acceptable ingestion rate (0.296 kg/person/day); EF is the exposure frequency (365 days/year); ED is the exposure duration (74.8 years, which is expected average lifetime); BW is the average body weight (60 kg for adult, 15 kg for children); AT is the average exposure time for non-carcinogenic element (EF × ED)60,61.
Targeted hazard quotient (THQ)
Targeted Hazard Quotient (THQ) is the way of determining non-carcinogenic risk to the local inhabitants provided by USEPA62,63. THQ was calculated as the ratio of EDI and oral reference dose (Rfd)64,65 following the equation below:
The RfDvalues for all the metals are given in Supplementary Table 2. The ratio < 1 reveals no non-carcinogenic risk effects, and the ratio > 1 implies that the community is likely to have a non-carcinogenic risk.
Hazard index (HI)
HI is calculated as the sum of individual non-carcinogenic risk (THQ) for all the metals (Cd, Cu, Cr, Pb. As, Hg, Zn) following the equation:
If the HI value exceeds the threshold value (10), the exposed consumer will face significant non-carcinogenic health risk23,66,67.
Carcinogenic risk (CR)
The carcinogenic risk (CR) was assessed to evaluate the possibility of cancer in an individual over the lifetime for the exposure of cancer-causing agents28,57,68. The acceptable range of the carcinogenic risk is 10–4 to 10–6, and the CR values higher than 10–4 will probably build the likelihood of cancer-causing hazard impact69–71. CR was calculated as follows;
Here, CSF is the oral slope factor of cancer causing agents (mg/kg/day)69, which is only available for Pb (0.0085) , Cd (6.3), As (1.5) and Cr (0.5)69.
Statistical analysis
The mean metal concentrations and their standard deviation (SD) in the organism's muscles were calculated using Microsoft excel. The Shapiro–Wilk tests were conducted using PAST (version 3.0) normality test, and dataset were square root transformed before further multivariate analysis. Analysis of Variance (ANOVA) and Kruskal–Wallis tests (when ANOVA did not appear) were applied with the Origin pro for the non-parametric test. Levene's test of homogeneity in terms of ANOVA was adopted to calculate the homogeneity of variance. Pearson correlation through PAST was analysed to identify the relationship between heavy metals in the organism's muscle. Principle component analysis (PCA) was implemented (by Origin pro) to show the association of heavy metals in the organism's muscles. The hierarchical cluster analysis based on Euclidean distance and the Ward-Linkage method was investigated to determine the connection between metal concentration and potential sources.
Ethics approval and consent to participate
This study involves fish, crab, shrimp, and oyster animal testing approved by the Laboratory Animal Ethics Committee of the Second Institute of Oceanography of the Chinese Ministry of Natural Resources, and all methods were carried out in accordance with relevant guidelines and regulations.
Results and discussion
Metal concentrations in fishes and shellfishes
The concentrations of selected seven metals from 11 species are presented in Table 1. The mean metal concentrations (wet weight) of Cu, Pb, Zn, Cd, Hg, As and Cr in selected fishes varied as 2.40 ± 2.66, 0.05 ± 0.02, 10.32 ± 7.13, 0.07 ± 0.07, 0.012 ± 0.009, 0.42 ± 0.26 and 0.11 ± 0.08 mg/kg, respectively. The hierarchy of mean metal concentrations was Zn > Cu > As > Cr > Cd > Pb > Hg. Among different species groups, all the metal concentrations were higher in crab, prawn and oyster than the fish species but not exceeded the national and international guideline values. Some species of fish exceeded the guideline values of Cd and As concentrations (Table 1).
Overall the concentrations of Zn were highest compared to all metals in all species. The maximum concentrations of Zn were recovered from P laevis. They maintained the following decreasing trend: P. laevis > E. sinensis > P. trituberculatus > E. annandalei > E. carinicauda > C. nasus > C. joyneri > L. ocellicauda > C. lucidus > H. nehereus > M. miiuy (Table 1). In our study, the concentrations of Zn ranged from 2.66 to 41.5 mg/kg (mean 7.15 mg/kg), and the average concentration of Zn was 4.3, 187, 133, 860, 24 and 93 folds higher than the average concentrations of Cu, Pb, Cd, Hg, As and Cr respectively. The mean concentrations of Zn in fish, crab and prawn were within the national and FAO/WHO guideline values. But the Zn concentrations in oyster exceeded the national first limit standard. The concentrations of Zn in oysters varied from 41.5 to 16.52 mg/kg (average 28.56 ± 11.85 mg/kg). Besides, the Zn concentrations in all fish species were lower than the related studies at the Pearl River72, the Taihu Lake73, the Daya Bay74 and the Palk Bay75; but higher than the concentration recovered from the Santa Maria Bay, Mexico76. Similarly, in crabs, prawns and oysters, the Zn concentrations were lower than the previous study at the Xiangshan Bay11 and the Taihu Lake77 (Table 1). Invertebrates like oysters and barnacles accumulate specific metals (Cu and Zn) to phenomenally high concentrations78. Along with the metal characteristics and organisms bioaccumulation capability, the various environmental processes might be essential to regulate the bioavailability79. Such as, significant correlations were observed between the sediment and oysters heavy metal concentrations78. In the previous report, it was discerned that most of the heavy metal concentrations in the sediment of this area were within the national and international standard48. Besides, high metal concentrations are sometimes found in the sediment but not in the oyster’s tissue79. The high particulate matter in the sediment and body size of the oysters may cause a tremendous difference between the metal concentrations78,79. Moreover, a high amount of metal can be found in the gills, mantle and viscera78, which was not focused in this study.
According to the national guideline value of China, the permissible limit for Cu concentrations is 20, 100 and 10 mg/kg, respectively, in fish, crustaceans and shellfish. FAO assigned that 30 mg/kg is the permissible limit of Cu concentrations for fish and shellfish82. The concentrations of Cu in our study varied from 0.07 to 14 mg/kg (mean 2.40 mg/kg) among all species. The maximum concentrations of Cu recovered from the collected oyster species P. laevis. Among the fish species, the maximum concentration of Cu found in L. ocellicauda and minimum in H. nehereus (Table 1). Comparing with the fish species, crab, prawn and oyster comprised considerably higher Cu concentrations. Cu is a vital element for the body as it forms hemoglobin and other essential enzymes, but excess Cu consumption is responsible for the malfunction of the liver and kidney23,84,85. However, in our study, none of the species contained a higher concentration of Cu than the national and international guideline values. The mean Cu concentrations in fishes (0.45 mg/kg) were higher than the concentrations recovered from the Meiliang bay83 and Santa Maria Bay76 but lower than most of the other related studies66,72–75. However, the concentrations of Cu in crustaceans was lower than the reported value in the Xiangshan Bay11, whereas, in oysters it was higher than the previous report77,83 (Table 1).
In comparison with Zn and Cu, the concentrations of Pb, Cd, Hg and Cr concentrations were very lower in all the species. Among them, the concentrations of Pb ranged from 0.006 to 0.3 mg/kg (mean 0.059 mg/kg); and the maximum concentrations of Pb found in P. laevis (mean 0.08 ± 0.01 mg/kg) and minimum in E. carinicauda (0.01 ± 0.001 mg/kg) (Table 1). The national permissible limit for Pb concentrations is 2, 2 and 0.1, respectively, for fish, crustaceans and shellfish. FAO set up the guideline values as 1 and 0.5 mg/kg for fish and shellfish, respectively. Therefore, the Pb concentrations in our study were not only within the guideline values, but also lower than the national and international reports6,11,66,72,74–77,85. The concentrations of Hg did not vary largely among the tested species, though the maximum concentrations recovered from P. laevis. Similar to other metals, the concentration of Cr was maximum in P. laevis followed by P. trituberculatus and E. sinensis. Both of the elements' concentrations were within the national and international standard values set up by FAO81,82 (Table 1).
Cd concentration was maximum in P. laevis and minimum in C. joyneri. According to the Chinese national standard, the guideline value for Cu concentration in fish is 0.06 mg/kg, 2 mg/kg for both crustacean and shellfish. According to FAO, the permissible limit for Cd concentrations is 0.2 and 2 mg/kg for fish and shellfish. In our study, H. nehereus, L. ocellicauda and M. miiuy crossed the FAO permissible limit, whereas other species were in line with the standard criteria. The mean Cd concentration in fish (0.023 mg/kg) was almost similar to the values reported from the Taihu lake (0.03 mg/kg)73, higher than the Daya bay (0.011); but much lower than Meiliang Bay (0.173 mg/kg)83, Pearl River (4.61 g/kg)72, and Karnafuli estuary (0.39 mg/kg)66. Besides, the Cd concentrations in shellfish exceeded the value reported earlier from the Meiliang bay (0.19 mg/kg)83 but were lower than the Taihu lake (1.7 mg/kg)77. In terms of crustacean, both crab species, especially P. trituberculatus had higher concentrations of Cd than the similar study in the Xiangshan bay11; and both of the prawn species had higher Cd concentrations of that report (Table 1).
In terms of As, the concentrations ranged from 0.04 to 1.48 mg/kg (mean 0.42 ± 0.26 mg/kg), and the mean concentration was higher in crab and prawn than in other groups. P. trituberculatus comprised the maximum As concentrations, and the hierarchy of spices in terms of As concentration was as follows: P. trituberculatus > E. sinensis > P. laevis > E. carinicauda > E. annandalei > C. joyneri > C. nasus > C. lucidus > L. ocellicauda > M. miiyu > H. nehereus. FAO set up the maximum permissible limit of As is 0.26 mg/kg in fish and 1 mg/kg in shellfish81,82. In our study, C. joyneri exceeded the permissible limit of As concentration, but other species was within the permissible limit. The inorganic As is more deadly than the organic form and can act as a cancer-causing agent for human beings if they consume the inorganic arsenic for a longer period84. But, it is a matter of satisfaction that most of the As concentrations in seafood are in organic form and can be directly excreted through the urine66,84,86. Our finding is comparable with the similar study in the bay and coastal region in China and worldwide (Table 1). The mean As concentration in Daya Bay was reported as 0.10 mg/kg in fish74, which is lower than our study. In Karnafuli estuary Bangladesh, the reported As concentration was 4.89 mg/kg in fish66, and in our study, the concentration was very lower than their findings. Besides, the concentration of As in shellfish, crab and prawn in Taihu lake77 and Xiangshan Bay11 were higher than the concentrations recorded in our study (Table 1).
Three species (C. nasus, C. lucidus, P. laevis) were sampled in four seasons for comparing the seasonal variation of heavy metal concentration. On their muscles, the concentrations of Zn were higher than other metals throughout the year. In C. nasus, the concentrations of Zn were maximum in summer (11.84 mg/kg) followed by spring (8.66 mg/kg), autumn (4.8 mg/kg) and winter (3.50 mg/kg). Cu concentrations were maximum in spring (1.09 mg/kg) followed by winter (0.47 mg/kg), summer (0.32 mg/kg) and autumn (0.21 m/kg) (Supplementary Fig. 1). As concentration in C. nasus followed the trend of spring (0.38 mg/kg) > autumn (0.21 mg/kg) > summer (0.20 mg/kg) > winter (0.12 mg/kg). Pb concentrations were higher in summer (0.117 mg/kg) and spring (0.114 mg/kg) whereas Cr concentrations were higher in summer (0.13 mg/kg) and autumn (0.09 mg/kg). Overall the mean metal concentrations in C. nasus were organised in four seasons as: summer > spring > autumn > winter. In C. lucidus. Zn concentrations relatively higher in winter (5.5 mg/kg) and summer (5.24 mg/kg), and lower in spring (4.67 mg/kg) and autumn (4.3 mg/kg) (Supplementary Fig. 1). Cu concentrations in C. lucidus were higher and almost similar in winter (0.46 mg/kg) and spring (0.43 mg/kg) and lower in summer (0.27 mg/kg) and autumn (0.25 mg/kg). In terms of As, the concentrations on the C. lucidus, in spring (0.3 mg/kg) the concentrations were maximum followed by summer (0.21 mg/kg), winter (0.19 mg/kg) and autumn (0.12 mg/kg). The hierarchy of mean metal concentrations in C. lucidus in four seasons was winter > summer > spring > autumn. In the tested oyster species, P. laevis, Zn and Cu concentrations were higher in four seasons than other metals. In spring (41.5 mg/kg) and summer (35.47 mg/kg), the Zn concentrations were higher than autumn (20.74 mg/kg) and winter (16.52 mg/kg) (Supplementary Fig. 1). But, the concentrations of Cu were maximum in autumn (14.03 mg/kg), followed by spring, summer and winter. The As concentrations were considerably higher in autumn (1.48 mg/kg) than in the other three seasons. Other metal concentrations not varied largely on P. laevis. As a result, the average metal concentrations in P. laevis maintained the seasonality as follows: spring > summer > autumn > winter. The findings of our study are comparable with similar regional studies on seasonal pollution in the Meiliang Bay of Taihu Lake6. They reported that higher concentrations of metals were found in summer and winter, but both the fish and oysters showed great seasonality in terms of metal types6. In fact, various species take up various types of metals from both water and foodstuffs, and their physical properties are additionally influenced by ingestion and filtration rates, food quality, physiological states and ecological variables87,88. Therefore, it is not astounding that the seasonality of metals in different species was unique, regardless of having been sampled in the same period87.
In our study, the demersal species comprised the highest metal concentrations, followed by benthopelagic and pelagic species. Demersal species lives close to the bottom89, and many of them possess special features (such as modified fins for fish) to crawl over the bottom (crab, oyster). Those species are bottom feeders, mostly carnivorous and primarily feed on fish, benthic macroinvertebrates and zooplankton, in contrast with the pelagic fishes. Besides, the benthopelagic fishes inhibit just above the bottom and mainly feed on benthos or zooplankton90. Therefore, the demersal fishes had a higher metal concentration as they inhibit near the bottom66.
Source identification of metals
Two-way ANOVA revealed that most metal concentrations were significantly different among the sites and seasons at a 95% confidence level (P < 0.05). In contrast to these findings, Cr concentrations in fish muscles were not significantly different among the sites and seasons. Similarly, the concentrations of Pb and As were not significant among the sites, and Cd was not significantly different among the seasons. One-way ANOVA tested the seasonality of metal concentrations, and all metals in C. nasus and C. lucidus showed significant variation in four different seasons (Supplementary Fig. 1). The Kruskal- Walis test was implemented for P. laevis as the sample size was smaller. It revealed a significant difference in metal concentrations among the seasons (P < 0.01). Levene's test of ANOVA revealed that the metals were not homogenously distributed among the sites and seasons.
As Hangzhou Bay is a complex nature of ecosystems, we have applied both univariate and multivarite approaches i.e., pearson correlation, principal component analysis (PCA) and cluster analysis (CA) to identify the sources of metals. Pearson correlation analysis of metal concentrations in organism's muscles is shown graphically in Supplementary Fig. 2. According to the correlation analysis, strong positive relationships were found between the metals in the organism's muscle. Such correlations between particular elements in nature may depict a similar degree of contamination and discharge from a similar source of contamination23,91. Among them, the strongest relationships were found between Cu–Zn (r = 0.73), Cu–As (r = 0.72), Cu–Cd (r = 0.87) at 95% confidence level. Zn, As, Cr and Cd showed significant positive relationships with all other metals, but Pb did not show any correlations with other metals (Supplementary Fig. 2). Therefore, this correlation reveals that most of the metals which are significantly correlated with each other may originate from the same source, either anthropogenic or natural, whereas Pb might be released from different source.
Among the multivariate analyses, PCA is based on eigenvalue analysis of the correlation matrix which estimates the correlation structure of the variables in a multidimensional data set92. Each variable has a loading which shows how much each variable contributes to the meaningful variation in the data and to interpret variables relationship. Practically, higher number PC components that explain only a small proportion of variance is ignored93. In this study, the association of metals in organisms’ muscles were interpreted through PCA bi-plot (Fig. 2). The first two components of the PCA have explained 77.54% of total variation in metal concentrations and the rest components showed small amount of variation. PC1 was dominated by Cu, Zn, Cd and As with the loadings of 0.41, 0.45, 0.41 and 0.41, respectively. On the other hand, PC2 was highly associated with Pb (loading 0.75) and moderately with Cr (loading 0.42). In addition, partial representation was found for Hg in PC1 (loading 0. 37) and PC3 (loading 0.71). Therefore, analysis of the PCA results interprets that Cu, Zn, Cd and As were originated from similar source i.e. anthropogenic origin as their levels exceed (in some cases) or close to the legal limits, and on the other hand, Pb being the far below of the permissible limit was originated from natural source. Again partial association of Hg in two PCs suggests mixed sources of origin.
Figure 2.
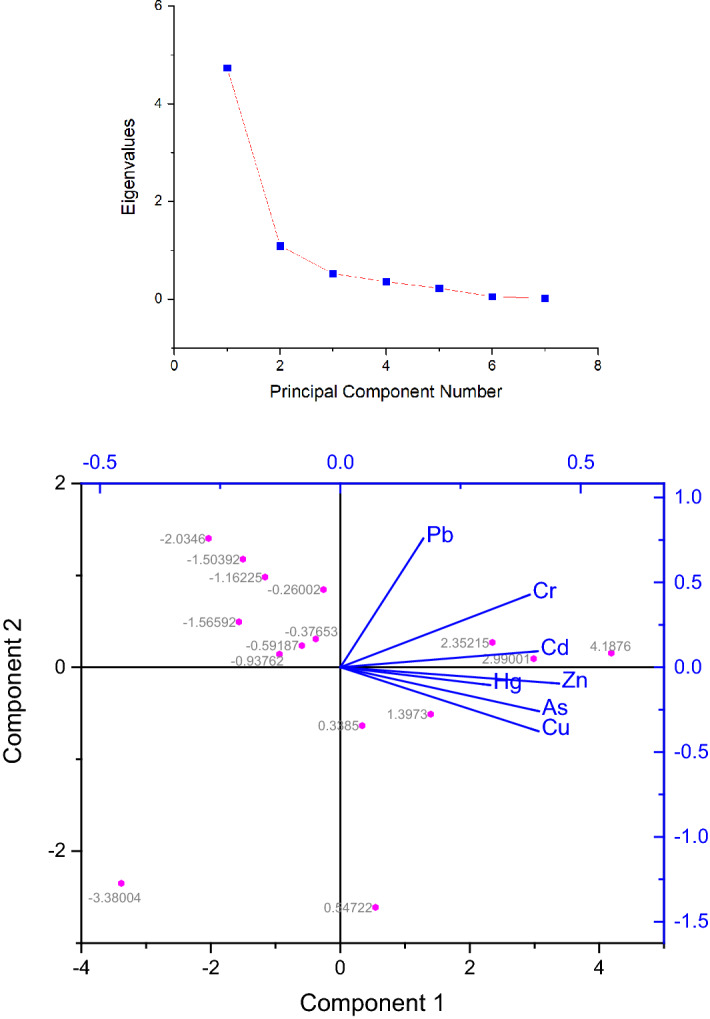
Scree plot and principal component analysis (PCA) loadings plot of seven heavy metals in organism’s samples.
Besides, associations for interdependence among the different metals in the study area were also established by means of the hierarchical cluster analysis based on Euclidean distance. The results demonstrated that among the seven metals, six metals (Cu, As, and Zn in cluster 1; Cd, Cr and Hg in cluster 2) were grouped in two major clusters whereas, Pb showed a clear distinction forming an individual group. This findings also indicated that most of the metals were originated from the same sources excepting Pb. It is reported earlier that the heavy metals in this area originates from similar sources40,94 and are related to anthropogenic activities40. Besides, the transport of terrigenous clastic particles was an unequivocal definitive of the formation and dissemination. At the same time, the transition mechanism of trace elements of various substrates and contamination of marine aquaculture were likewise significant contributors to trace metals' sources in this region94 (Fig. 3).
Figure 3.
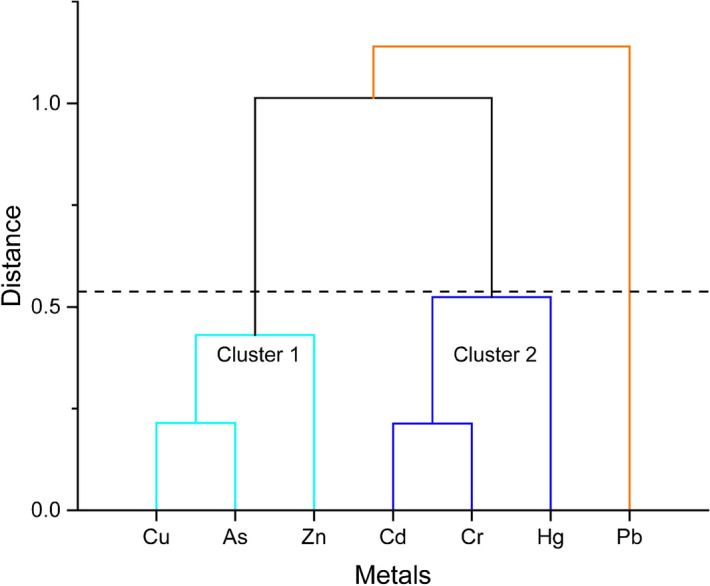
Hierarchical cluster analysis based on the Euclidean distance of the metals in selected species.
Bioaccumulation factor (BAF) of aquatic species
The BAFs of the heavy metals in selected organism's muscles are graphically represented in Fig. 4. BAFs associate the number recovered from the portion of collected concentration in a specific organ of a species and the habitat quickly and effectively23,85,95. In our study, the highest mean BAF was encountered for Cu, lowest for Cr; and followed the decreasing trend of Cu (1640) > Zn (736) > Hg (387) > Cd (366) > As (288) > Pb (173) > Cr (82) in the organism's muscle. Actually, Cu is effectively persistent in an organism's muscles due to being an essential component of living tissue66,96,97. In terms of organisms, all species were bioaccumulative, but P. trituberculatus and P. laevis were extremely bioaccumulative. Among the selected species, the oyster, crab and prawns were more bioaccumulative than the fishes. Among all the species, the BAF value was maximum in P. laevis (13998) and minimum in C. joyneri (1098) (Fig. 4). In fact, the bioaccumulation of an aquatic species relies on its characteristics, metabolism of the inspected tissue, invasion pathways, and habitat condition66,98. Therefore, each species has a specific bioaccumulative receptivity regarding various metals23,69,99,100.
Figure 4.
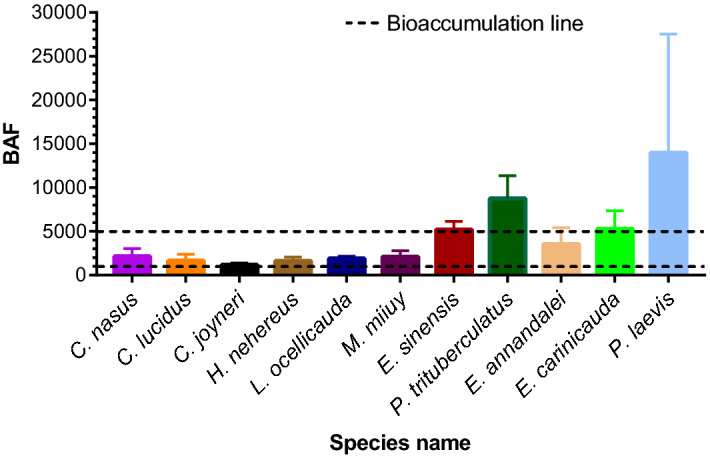
Bioaccumulation factor (BAF) of the selected species from the Hangzhou bay (Dashed line indicates the Bioaccumulation line).
Potential human health risk assessment
Non-carcinogenic risk (EDI, THQ and HI)
Heavy metals poisonous quality could incline people to health hazards through consumption of defiled aquatic food; therefore, it is crucial for assessment87. Based on the oral reference dose RfD, the EDI was calculated to measure both the non-carcinogenic and carcinogenic risk of metal consumption through seafood101. Besides, the EDI value denotes the exposure of heavy metals, which is performed to evade any detrimental impact on human health102. The hazard analysis was conducted for two age groups, children and adults. The calculated EDI of the examined metals associated with fish, crab, prawn and oyster are presented in Supplementary Table 2. For both groups, the EDI of metals through the organism muscles were organised as follows Zn > Cu > As > Cr > Cd > Pb > Hg (Supplementary Table 2). The EDI was higher for the children than the adult, especially for children the EDI value of As, Cd and Zn; and for adults only As had higher EDI values than the Recommended Daily Allowance (RDA) provided by WHO103 (Supplementary Table 2).Therefore, the higher EDI than the RDA guidelines, revealed that here is a possibility of higher health impact associated with As, Cd and Zn to the consumers, mostly children would be more susceptible.
The estimated THQ values (Fig. 5) were higher in the children group than the adult. Particularly the THQ of As was significantly higher in both groups than other metals. For the adult people, the THQ of As for the consumption of E. sinensis, P. trituberculatus, and P. laevis exceeded the threshold value (> 1) suggested by USEPA104. Whereas, for the children, the THQ of As was higher (> 1) for all the species but maximum in three species similar to the adult. For both groups, except for As, all the other metals in all the species possessed lower THQ values, which were far lower than the threshold value (< 1). The accumulated THQ of all metals in the concern of HI, also much higher for the children. Though the HI was within the threshold limit (both for adults and children) for all the organisms, it was much higher for oysters, prawns and crabs (Fig. 5). Therefore, the local consumer can suffer from As contamination for the long term seafood consumption. Moreover, an organism’s age and size could be important factors for metal accumulation and health risks28,105. Though no definite trend of metal accumulation was observed in Capoeta umbla fish species, higher concentrations were found in medium-aged fish compared to the small-sized or older fish106. However, metal concentration is determined by the organism’s feeding rate with the developmental stage rather than age105. Besides, the larger size organisms tend to accumulate more metals105; consequently, they may pose more threat to human health. A previous study reported that the larger-sized Labeo rohita accumulated more metals and had higher hazard potential than smaller fishes like Glossogobius giuris, Puntius sophore and Puntius chola. Our study did not focus on size-based metal accumulation; hence all the fishes sampled were within 200–230 gm and posed little threat to humans (low THQ). However, our results emphasize that the organism’s trophic guild and habitat preferences play significant role in the metal accumulation and consequent health hazard. Many earlier studies reported that the contamination level differ largely on the food habitat of the organisms107–109. Therefore, though the two crab species P. trituberculatus and E. sinensis weighed lower than the fish (200 ± 40 g and 158 ± 42 g, respectively), they accumulated higher metals and hazard potential. Similarly, the oyster species P. laevis was weighed 178 ± 70 g, also showed high bioaccumulation capacity and THQ value for both adults and children, whereas fishes showed low THQ values although weighed more. But, suppose the organisms sampled from the same habitat type and feeding guild, then the organism’s size is an important factor regarding metal accumulation and the hazard potential to their consumers. However, the THQ and HI have no particular dose relationship that's why they are not considered as an immediate estimation of hazard concern110.
Figure 5.
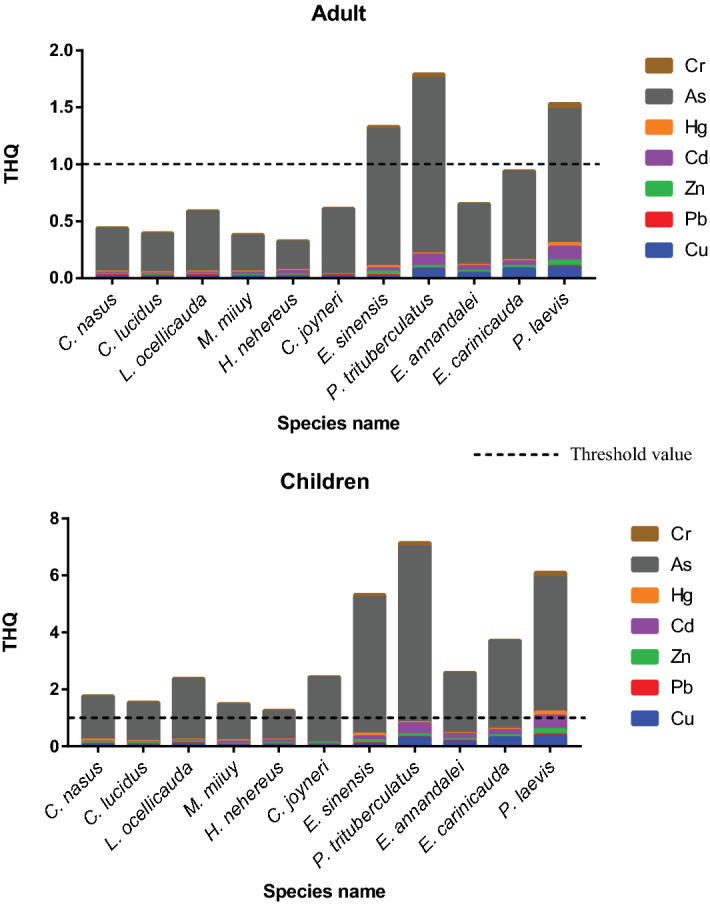
Targeted hazard quotient (THQ) for the children and adult consumer of targeted species.
Carcinogenic risk (CR)
The estimated CR of several elements (Pb, Cd, As, Cr) for adults and children are addressed in Table 2. CR values lower than 10–6 denote the metals' negligible exposure, whereas 10–6 to 10–4 means the acceptable range, and higher than 10–4 indicates the terrible exposure84,111. For the adults, all the metals possessed the CR values within the limit of 10–4–10–6, though the As showed high carcinogenic risk than other elements. In line with the previous studies, children were more susceptible for CR exposure23,101,112. For the children, both the As and Cd showed high CR values than the permissible limit for several species. As showed terrible CR exposure for the children through the consumption C. joyneri, E. sinensis, P. trituberculatus, E. carinicauda and P. laevis. Whereas, besides those species, E. annandalei showed terrible CR exposure for children in terms of Cd (Table 2). For both groups, CR values of Pb were negligible, and the metal exposure for the seafood consumption was organised as As > Cd > Cr > Pb. Therefore, the local consumers are at carcinogenic risk associate with the toxic As, and for children, Cd is an additional matter of carcinogenic concern. It was reported in the Persian Gulf that carcinogenic risk in terms of As could be detrimental to local consumers, though it did not show any non-carcinogenic risk. Actually, 90% of the carcinogenic risk has been found in the As polluted seafood66. However, the inorganic form of As is more deadly than the organic form57,113, and around 90% of the aggregated As can be evaluated as organic form84. Chronic exposure of inorganic As to human lead to various malfunctions114 including the organ failure such as respiratory tract, circulatory system, digestive system, nervous system and liver115. Besides, Cd is also responsible for endocrine malfunctioning, which can cause the failure of the essential organ such as the kidney and brain116. Moreover, long term contamination of Cd may cause the dysfunction of the blood circulatory system117, bone softening and prostate cancer118. Therefore, the USEPA categorized Cd as a priority contaminant and considered as "carcinogenic to humans" (Carcinogenic classification–B)23. However, the tissue samples in this study were digested by nitric acid and perchloric acid system, and total heavy metal concentrations were used in the health risk assessment. The use of total heavy metal in health risk assessment is seen to overestimate the risks calculated and cause uncertainties119. Besides, the total metal consumption depends on the gross quantity of dietary intake besides the aquatic foods and their metal concentration. Therefore, the health risk of heavy metal should be considered the bioavailability of metal concentration and the total dietary intake along with seafood in future.
Table 2.
Human carcinogenic risks (CR) through the consumption of targeted species. (Values in bold denote the terrible CR exposure).
| Spcies name | CR (adult) | CR (child) | |||||||
|---|---|---|---|---|---|---|---|---|---|
| Pb | Cd | As | Cr | Pb | Cd | As | Cr | ||
| Fish | Coilia nasus | 2.83E−07 | 7.04E−05 | 1.69E−04 | 2.23E−05 | 1.13E−06 | 2.81E−04 | 6.76E−04 | 8.93E−05 |
| Collichthys lucidus | 2.76E−07 | 6.16E−05 | 1.51E−04 | 1.75E−05 | 1.10E−06 | 2.46E−04 | 6.03E−04 | 6.99E−05 | |
| Lophiogobius ocellicauda | 2.75E−07 | 7.78E−05 | 2.40E−04 | 1.39E−05 | 1.10E−06 | 3.11E−04 | 9.59E−04 | 5.54E−05 | |
| Miichthys miiuy | 1.08E−07 | 1.19E−04 | 1.42E−04 | 2.23E−05 | 4.32E−07 | 4.75E−04 | 5.69E−04 | 8.90E−05 | |
| Cynoglossus joyneri | 2.64E−07 | 2.89E−05 | 2.58E−04 | 1.13E−05 | 1.06E−06 | 1.15E−04 | 1.03E−03 | 4.53E−05 | |
| Harpadon nehereus | 2.65E−07 | 1.77E−04 | 1.13E−04 | 1.46E−05 | 1.06E−06 | 7.09E−04 | 4.50E−04 | 5.83E−05 | |
| Crab | Eriocheir sinensis | 2.80E−07 | 1.97E−04 | 5.40E−04 | 4.30E−05 | 1.12E−06 | 7.89E−04 | 2.16E−03 | 1.72E−04 |
| Portunus trituberculatus | 2.73E−07 | 6.16E−04 | 6.94E−04 | 6.16E−05 | 1.09E−06 | 2.47E−03 | 2.78E−03 | 2.47E−04 | |
| Prawn | Exopalaemon annandalei | 1.29E−07 | 2.77E−04 | 2.38E−04 | 1.49E−05 | 5.16E−07 | 1.11E−03 | 9.51E−04 | 5.95E−05 |
| Exopalaemon carinicauda | 3.35E−08 | 2.77E−04 | 3.50E−04 | 1.04E−05 | 1.34E−07 | 1.11E−03 | 1.40E−03 | 4.14E−05 | |
| Oyster | Potamocorbula laevis | 3.50E−07 | 7.41E−04 | 5.31E−04 | 6.86E−05 | 1.40E−06 | 2.96E−03 | 2.13E−03 | 2.74E−04 |
Conclusions
The concentrations of seven heavy metals in the 11 aquatic organism's muscles were analysed from the HB area. Overall, the hierarchy of mean metal concentrations was Zn > Cu > As > Cr > Cd > Pb > Hg. Among different species groups, metal concentrations were higher in shellfishes (crab, prawn, and oyster) than finfish. Notably, the demersal species P. laevis, P. trituberculatus and E. sinensis possessed the maximum metal concentrations, while the pelagic species had several degrees of lower metal concentrations. Though most of the species contained the less metal concentrations than national and international guideline values, As concentrations in C. joyneri and Cd concentrations in H. nehereus, L. ocellicauda and M. miiuy exceeded the FAO permissible limit. Seasonally, the metal concentrations varied with both metal and species types. Most of the metals (except Pb) showed a positive relationship, and Cu–Zn, Cu–As and Cu–Cd showed the strongest correlation. All the species possessed bioaccumulative capability, but P. laevis and P. trituberculatus were highly bioaccumulative. In terms of health risks, both adults and children may experience a high risk for As contamination through seafood consumption. All the fish species asserts non-carcinogenic risks (EDI, THQ and HI) to children, whereas for the adult people E. sinensis, P. laevis and P. trituberculatus consumption would be harmful. However, the CR index values depicted that children are susceptible to carcinogenic risk of AS and Cd contamination, hence unsafe for consumption. Mostly the demersal species of crab, prawn and oyster (especially P. laevis, P. trituberculatus and E. sinensis) may pose a high risk to the consumer for both carcinogenic and non-carcinogenic risk. Therefore, it is highly recommended to thoroughly examine all the aquatic organisms consumed by human including the metal concentration in various organs. The management authorities and policymakers should take in consideration the current metal and metalloids status in the HB area to provide a healthful environment.
Supplementary Information
Author contributions
M.A.N. structured and wrote the paper, W.F. supported with the data, G.Z. planned the sampling and analysis, M.B.H. revised and modified the paper, Y.C. helped in analysis, H.Z. helped in sampling, J.S. funded the project.
Funding
This research was financially supported by the National Key Research and Development Project of China (2019YFC1407805), the National Natural Science Foundation of China (41776119), the Key Project of Natural Science Foundation for Tianjin (No. 17JCZDJC40000), the University Innovation Team Training Program for Tianjin (TD12-5003), the Tianjin 131 Innovation Team Program (20180314), and the Changjiang Scholar Program of Chinese Ministry of Education (T2014253) to Jun Sun.
Data availability
The datasets generated during and/or analysed during the current study are available from the corresponding author on reasonable request.
Competing interests
The authors declare no competing interests.
Footnotes
The original online version of this Article was revised: The original version of this Article contained an error in the spelling of the author M Belal Hossain which was incorrectly given as MBelal Hossain.
Publisher's note
Springer Nature remains neutral with regard to jurisdictional claims in published maps and institutional affiliations.
Change history
4/28/2022
A Correction to this paper has been published: 10.1038/s41598-022-11186-9
Supplementary Information
The online version contains supplementary material available at 10.1038/s41598-022-08471-y.
References
- 1.Okogwu OI, Nwonumara GN, Okoh FA. Evaluating heavy metals pollution and exposure risk through the consumption of four commercially important fish species and water from cross river ecosystem, Nigeria. Bull. Environ. Contam. Toxicol. 2019;102:867–872. doi: 10.1007/s00128-019-02610-4. [DOI] [PubMed] [Google Scholar]
- 2.Fuentes-Gandara F, Pinedo-Hernández J, Marrugo-Negrete J, Díez S. Human health impacts of exposure to metals through extreme consumption of fish from the Colombian Caribbean Sea. Environ. Geochem. Health. 2018;40:229–242. doi: 10.1007/s10653-016-9896-z. [DOI] [PubMed] [Google Scholar]
- 3.Liu X, et al. Human health risk assessment of heavy metals in soil–vegetable system: A multi-medium analysis. Sci. Total Environ. 2013;463:530–540. doi: 10.1016/j.scitotenv.2013.06.064. [DOI] [PubMed] [Google Scholar]
- 4.Lelieveld J, Evans JS, Fnais M, Giannadaki D, Pozzer A. The contribution of outdoor air pollution sources to premature mortality on a global scale. Nature. 2015;525:367–371. doi: 10.1038/nature15371. [DOI] [PubMed] [Google Scholar]
- 5.Huang R-J, et al. High secondary aerosol contribution to particulate pollution during haze events in China. Nature. 2014;514:218–222. doi: 10.1038/nature13774. [DOI] [PubMed] [Google Scholar]
- 6.Rajeshkumar S, et al. Studies on seasonal pollution of heavy metals in water, sediment, fish and oyster from the Meiliang Bay of Taihu Lake in China. Chemosphere. 2018;191:626–638. doi: 10.1016/j.chemosphere.2017.10.078. [DOI] [PubMed] [Google Scholar]
- 7.Gao X, Chen C-TA. Heavy metal pollution status in surface sediments of the coastal Bohai Bay. Water Res. 2012;46:1901–1911. doi: 10.1016/j.watres.2012.01.007. [DOI] [PubMed] [Google Scholar]
- 8.Naser HA. Assessment and management of heavy metal pollution in the marine environment of the Arabian Gulf: A review. Mar. Pollut. Bull. 2013;72:6–13. doi: 10.1016/j.marpolbul.2013.04.030. [DOI] [PubMed] [Google Scholar]
- 9.Zhang Y, et al. Heavy metals in aquatic organisms of different trophic levels and their potential human health risk in Bohai Bay, China. Environ. Sci. Pollut. Res. 2016;23:17801–17810. doi: 10.1007/s11356-016-6948-y. [DOI] [PubMed] [Google Scholar]
- 10.Wei M, Yanwen Q, Zheng B, Zhang L. Heavy metal pollution in Tianjin Bohai bay, China. J. Environ. Sci. 2008;20:814–819. doi: 10.1016/S1001-0742(08)62131-2. [DOI] [PubMed] [Google Scholar]
- 11.Zhao B, et al. Spatiotemporal variation and potential risks of seven heavy metals in seawater, sediment, and seafood in Xiangshan Bay, China (2011–2016) Chemosphere. 2018;212:1163–1171. doi: 10.1016/j.chemosphere.2018.09.020. [DOI] [PubMed] [Google Scholar]
- 12.Wang Y, Fang X. Analysis of the impact of heavy metal on the Chinese aquaculture and the ecological hazard. GuangDong. 2016;836:156.152. [Google Scholar]
- 13.Pini J, Richir J, Watson G. Metal bioavailability and bioaccumulation in the polychaete Nereis (Alitta) virens (Sars): The effects of site-specific sediment characteristics. Mar. Pollut. Bull. 2015;95:565–575. doi: 10.1016/j.marpolbul.2015.03.042. [DOI] [PubMed] [Google Scholar]
- 14.Amoozadeh E, et al. Marine organisms as heavy metal bioindicators in the Persian Gulf and the Gulf of Oman. Environ. Sci. Pollut. Res. 2014;21:2386–2395. doi: 10.1007/s11356-013-1890-8. [DOI] [PubMed] [Google Scholar]
- 15.Gu Y-G, Huang H-H, Liu Y, Gong X-Y, Liao X-L. Non-metric multidimensional scaling and human risks of heavy metal concentrations in wild marine organisms from the Maowei Sea, the Beibu Gulf, South China Sea. Environ. Toxicol. Pharmacol. 2018;59:119–124. doi: 10.1016/j.etap.2018.03.002. [DOI] [PubMed] [Google Scholar]
- 16.Kennedy A, Martinez K, Chuang C-C, LaPoint K, McIntosh M. Saturated fatty acid-mediated inflammation and insulin resistance in adipose tissue: Mechanisms of action and implications. J. Nutr. 2008;139:1–4. doi: 10.3945/jn.108.098269. [DOI] [PubMed] [Google Scholar]
- 17.Hao Z, et al. Heavy metal distribution and bioaccumulation ability in marine organisms from coastal regions of Hainan and Zhoushan, China. Chemosphere. 2019;226:340–350. doi: 10.1016/j.chemosphere.2019.03.132. [DOI] [PubMed] [Google Scholar]
- 18.Golden CD, et al. Nutrition: Fall in fish catch threatens human health. Nat. News. 2016;534:317. doi: 10.1038/534317a. [DOI] [PubMed] [Google Scholar]
- 19.Bosch AC, O'Neill B, Sigge GO, Kerwath SE, Hoffman LC. Heavy metals in marine fish meat and consumer health: A review. J. Sci. Food Agric. 2016;96:32–48. doi: 10.1002/jsfa.7360. [DOI] [PubMed] [Google Scholar]
- 20.Burger J, Gochfeld M, Jeitner C, Pittfield T, Donio M. Heavy metals in fish from the Aleutians: Interspecific and locational differences. Environ. Res. 2014;131:119–130. doi: 10.1016/j.envres.2014.02.016. [DOI] [PMC free article] [PubMed] [Google Scholar]
- 21.Anandkumar A, Nagarajan R, Prabakaran K, Chua Han B, Rajaram R. Human health risk assessment and bioaccumulation of trace metals in fish species collected from the Miri coast, Sarawak, Borneo. Mar. Pollut. Bull. 2018;133:655–663. doi: 10.1016/j.marpolbul.2018.06.033. [DOI] [PubMed] [Google Scholar]
- 22.Murtala BA, Abdul WO, Akinyemi AA. Bioaccumulation of heavy metals in fish (Hydrocynus forskahlii, Hyperopisus bebe occidentalis and Clarias gariepinus) organs in downstream Ogun coastal water, Nigeria. J. Agric. Sci. 2012;4:51. [Google Scholar]
- 23.Ahmed ASS, Rahman M, Sultana S, Babu SMOF, Sarker MSI. Bioaccumulation and heavy metal concentration in tissues of some commercial fishes from the Meghna River Estuary in Bangladesh and human health implications. Mar. Pollut. Bull. 2019;145:436–447. doi: 10.1016/j.marpolbul.2019.06.035. [DOI] [PubMed] [Google Scholar]
- 24.Sun X, et al. Source identification, geochemical normalization and influence factors of heavy metals in Yangtze River Estuary sediment. Environ. Pollut. 2018;241:938–949. doi: 10.1016/j.envpol.2018.05.050. [DOI] [PubMed] [Google Scholar]
- 25.Dadar M, Adel M, NasrollahzadehSaravi H, Fakhri Y. Trace element concentration and its risk assessment in common kilka (Clupeonella cultriventris caspia Bordin, 1904) from southern basin of Caspian Sea. Toxin Rev. 2017;36:222–227. [Google Scholar]
- 26.Chakraborty P, Raghunadh Babu PV, Acharyya T, Bandyopadhyay D. Stress and toxicity of biologically important transition metals (Co, Ni, Cu and Zn) on phytoplankton in a tropical freshwater system: An investigation with pigment analysis by HPLC. Chemosphere. 2010;80:548–553. doi: 10.1016/j.chemosphere.2010.04.039. [DOI] [PubMed] [Google Scholar]
- 27.Handy R. Seminar Series-Society for Experimental Biology. Cambridge University Press; 1997. pp. 29–60. [Google Scholar]
- 28.Ahmed MK, et al. Human health risks from heavy metals in fish of Buriganga river, Bangladesh. Springerplus. 2016;5:1–12. doi: 10.1186/s40064-015-1659-2. [DOI] [PMC free article] [PubMed] [Google Scholar]
- 29.WHO. Heavy metals-environmental aspects. Environment Health Criteria. No. 85. (1989).
- 30.Xu H, et al. Long-term study of heavy metal pollution in the northern Hangzhou Bay of China: Temporal and spatial distribution, contamination evaluation, and potential ecological risk. Environ. Sci. Pollut. Res. 2021;28:10718–10733. doi: 10.1007/s11356-020-11110-6. [DOI] [PubMed] [Google Scholar]
- 31.El-Moselhy KM, Othman AI, AbdEl-Azem H, El-Metwally MEA. Bioaccumulation of heavy metals in some tissues of fish in the Red Sea, Egypt. Egypti. J. Basic Appl. Sci. 2014;1:97–105. doi: 10.1016/j.ejbas.2014.06.001. [DOI] [Google Scholar]
- 32.Jezierska B, Witeska M. Soil and Water Pollution Monitoring, Protection and Remediation. Springer; 2006. pp. 107–114. [Google Scholar]
- 33.Bawuro AA, Voegborlo RB, Adimado AA. Bioaccumulation of heavy metals in some tissues of fish in Lake Geriyo, Adamawa State, Nigeria. J. Environ. Public Health. 2018;2018:1854892. doi: 10.1155/2018/1854892. [DOI] [PMC free article] [PubMed] [Google Scholar]
- 34.Zhuang P, McBride MB, Xia H, Li N, Li Z. Health risk from heavy metals via consumption of food crops in the vicinity of Dabaoshan mine, South China. Sci. Total Environ. 2009;407:1551–1561. doi: 10.1016/j.scitotenv.2008.10.061. [DOI] [PubMed] [Google Scholar]
- 35.Hosseini M, Nabavi SMB, Nabavi SN, Pour NA. Heavy metals (Cd Co, Cu, Ni, Pb, Fe, and Hg) content in four fish commonly consumed in Iran: Risk assessment for the consumers. Environ. Monit. Assess. 2015;187:237. doi: 10.1007/s10661-015-4464-z. [DOI] [PubMed] [Google Scholar]
- 36.Prabhakaran K, Nagarajan R, MerlinFranco F, AnandKumar A. Biomonitoring of Malaysian aquatic environments: A review of status and prospects. Ecohydrol. Hydrobiol. 2017;17:134–147. doi: 10.1016/j.ecohyd.2017.03.001. [DOI] [Google Scholar]
- 37.Meche A, et al. Determination of heavy metals by inductively coupled plasma-optical emission spectrometry in fish from the Piracicaba River in Southern Brazil. Microchem. J. 2010;94:171–174. doi: 10.1016/j.microc.2009.10.018. [DOI] [Google Scholar]
- 38.Zhang Y, et al. Temporal and spatial changes of microbial community in an industrial effluent receiving area in Hangzhou Bay. J. Environ. Sci. 2016;44:57–68. doi: 10.1016/j.jes.2015.11.023. [DOI] [PubMed] [Google Scholar]
- 39.Huang L, et al. Quantifying the spatiotemporal dynamics of industrial land uses through mining free access social datasets in the Mega Hangzhou Bay Region, China. Sustainability. 2018;10:3463. doi: 10.3390/su10103463. [DOI] [Google Scholar]
- 40.Pang H-J, et al. Contamination, distribution, and sources of heavy metals in the sediments of Andong tidal flat, Hangzhou bay, China. Continental Shelf Res. 2015;110:72–84. doi: 10.1016/j.csr.2015.10.002. [DOI] [Google Scholar]
- 41.National Bureau of Statstics . Zhejiang Statistical Yearbook-2017. China Statistics Press; 2017. [Google Scholar]
- 42.Chen W, Zheng Y, Chen Y, Mathews C. An assessment of fishery yields from the East China Sea ecosystem. Mar. Fish. Rev. 1997;59:1–7. [Google Scholar]
- 43.Zhejiang Provincial Development and Reform Commission. Zhejiang Zhoushan Islands New Area Development Plan (In Chinese). (2021).
- 44.Che Y, He Q, Lin W-Q. The distributions of particulate heavy metals and its indication to the transfer of sediments in the Changjiang Estuary and Hangzhou Bay, China. Mar. Pollut. Bull. 2003;46:123–131. doi: 10.1016/S0025-326X(02)00355-7. [DOI] [PubMed] [Google Scholar]
- 45.Li R, et al. Environmental health and ecological risk assessment of soil heavy metal pollution in the coastal cities of Estuarine Bay—a case study of Hangzhou Bay, China. Toxics. 2020;8:75. doi: 10.3390/toxics8030075. [DOI] [PMC free article] [PubMed] [Google Scholar]
- 46.Bergami E, Manno C, Cappello S, Vannuccini ML, Corsi I. Nanoplastics affect moulting and faecal pellet sinking in Antarctic krill (Euphausia superba) juveniles. Environ. Int. 2020;143:105999. doi: 10.1016/j.envint.2020.105999. [DOI] [PubMed] [Google Scholar]
- 47.Fang H, Huang L, Wang J, He G, Reible D. Environmental assessment of heavy metal transport and transformation in the Hangzhou Bay, China. J. Hazard. Mater. 2016;302:447–457. doi: 10.1016/j.jhazmat.2015.09.060. [DOI] [PubMed] [Google Scholar]
- 48.Zhu G, et al. Evaluation of ecosystem health and potential human health hazards in the Hangzhou Bay and Qiantang Estuary region through multiple assessment approaches. Environ. Pollut. 2020;264:114791. doi: 10.1016/j.envpol.2020.114791. [DOI] [PubMed] [Google Scholar]
- 49.Li F, et al. Distribution and risk assessment of trace metals in sediments from Yangtze River estuary and Hangzhou Bay, China. Environ. Sci. Pollut. Res. 2018;25:855–866. doi: 10.1007/s11356-017-0425-0. [DOI] [PubMed] [Google Scholar]
- 50.Liu L, Huang X, Cao W, Yang Y. Pollution load characteristics of the Hangzhou Bay and its surrounding areas. Ocean Dev. Manage. 2012;5:108–112. [Google Scholar]
- 51.He Z, Li F, Dominech S, Wen X, Yang S. Heavy metals of surface sediments in the Changjiang (Yangtze River) Estuary: Distribution, speciation and environmental risks. J. Geochem. Explor. 2019;198:18–28. doi: 10.1016/j.gexplo.2018.12.015. [DOI] [Google Scholar]
- 52.Jin X, Zhao X, Meng T, Cui Y. The Fishery Resources and the Environment of the Bohai Sea and Yellow Sea. Science Press; 2005. [Google Scholar]
- 53.Huang Z. The Species and Distribution of Marine Organisms of China. Beijing: Ocean Press; 1994. [Google Scholar]
- 54.Schram FR. Checklist of Marine Biota of China Seas. J. Crustac. Biol. 2010;30:339–339. doi: 10.1651/09-3228.1. [DOI] [Google Scholar]
- 55.AQSIQ, P. in GB 17378.6–2007 (General Administration of Quality Supervision, Inspection and Quarantine of People's Republic of China, 2007).
- 56.Zhang L, et al. Distribution and bioaccumulation of heavy metals in marine organisms in east and west Guangdong coastal regions, South China. Mar. Pollut. Bull. 2015;101:930–937. doi: 10.1016/j.marpolbul.2015.10.041. [DOI] [PubMed] [Google Scholar]
- 57.Zhong W, et al. Health risk assessment of heavy metals in freshwater fish in the central and eastern North China. Ecotoxicol. Environ. Saf. 2018;157:343–349. doi: 10.1016/j.ecoenv.2018.03.048. [DOI] [PubMed] [Google Scholar]
- 58.Wang Q, et al. Bioaccumulation and biomagnification of emerging bisphenol analogues in aquatic organisms from Taihu Lake, China. Sci. Total Environ. 2017;598:814–820. doi: 10.1016/j.scitotenv.2017.04.167. [DOI] [PubMed] [Google Scholar]
- 59.Arnot JA, Gobas FA. A review of bioconcentration factor (BCF) and bioaccumulation factor (BAF) assessments for organic chemicals in aquatic organisms. Environ. Rev. 2006;14:257–297. doi: 10.1139/a06-005. [DOI] [Google Scholar]
- 60.Duan X, Zhao X, Wang B, Chen Y, Cao S. Exposure Factors Handbook of Chinese Population (Adults) China Environmental Science Press; 2013. [Google Scholar]
- 61.Chauhan G, Chauhan U. Human health risk assessment of heavy metals via dietary intake of vegetables grown in wastewater irrigated area of Rewa, India. Int. J. Sci. Res. Publ. 2014;4:1–9. [Google Scholar]
- 62.USEPA. (Philadelphia PA; Washington, DC, 2007).
- 63.Wang X, Sato T, Xing B, Tao S. Health risks of heavy metals to the general public in Tianjin, China via consumption of vegetables and fish. Sci. Total Environ. 2005;350:28–37. doi: 10.1016/j.scitotenv.2004.09.044. [DOI] [PubMed] [Google Scholar]
- 64.USEPA. (2015).
- 65.FAO/WHO. Wastewater Use in Agriculture. 988 (World Health Organization).
- 66.Ahmed ASS, et al. Bioaccumulation of heavy metals in some commercially important fishes from a tropical river estuary suggests higher potential health risk in children than adults. PLoS One. 2019;14:e0219336. doi: 10.1371/journal.pone.0219336. [DOI] [PMC free article] [PubMed] [Google Scholar]
- 67.Saha N, Mollah MZI, Alam MF, Safiur Rahman M. Seasonal investigation of heavy metals in marine fishes captured from the Bay of Bengal and the implications for human health risk assessment. Food Control. 2016;70:110–118. doi: 10.1016/j.foodcont.2016.05.040. [DOI] [Google Scholar]
- 68.Yin S, Feng C, Li Y, Yin L, Shen Z. Heavy metal pollution in the surface water of the Yangtze Estuary: A 5-year follow-up study. Chemosphere. 2015;138:718–725. doi: 10.1016/j.chemosphere.2015.07.060. [DOI] [PubMed] [Google Scholar]
- 69.USEPA. Risk-based concentration table. United States Environmental Protection Agency, Washington DC, Philadelphia (2000).
- 70.Hu B, et al. Assessment of heavy metal pollution and health risks in the soil-plant-human system in the Yangtze River Delta, China. Int. J. Environ. Res. Public Health. 2017;14:1042. doi: 10.3390/ijerph14091042. [DOI] [PMC free article] [PubMed] [Google Scholar]
- 71.USEPA. in United States Environmental Protection Agency, Washington DC, Philadelphia (2010).
- 72.Kwok CK, et al. Bioaccumulation of heavy metals in fish and Ardeid at Pearl River Estuary, China. Ecotoxicol. Environ. Saf. 2014;106:62–67. doi: 10.1016/j.ecoenv.2014.04.016. [DOI] [PubMed] [Google Scholar]
- 73.Yu T, Zhang Y, Hu X, Meng W. Distribution and bioaccumulation of heavy metals in aquatic organisms of different trophic levels and potential health risk assessment from Taihu lake, China. Ecotoxicol. Environ. Saf. 2012;81:55–64. doi: 10.1016/j.ecoenv.2012.04.014. [DOI] [PubMed] [Google Scholar]
- 74.Qiu Y-W, Lin D, Liu J-Q, Zeng EY. Bioaccumulation of trace metals in farmed fish from South China and potential risk assessment. Ecotoxicol. Environ. Saf. 2011;74:284–293. doi: 10.1016/j.ecoenv.2010.10.008. [DOI] [PubMed] [Google Scholar]
- 75.Arulkumar A, Paramasivam S, Rajaram R. Toxic heavy metals in commercially important food fishes collected from Palk Bay, Southeastern India. Mar. Pollut. Bull. 2017;119:454–459. doi: 10.1016/j.marpolbul.2017.03.045. [DOI] [PubMed] [Google Scholar]
- 76.Jonathan MP, et al. Metal concentrations in demersal fish species from Santa Maria Bay, Baja California Sur, Mexico (Pacific coast) Mar. Pollut. Bull. 2015;99:356–361. doi: 10.1016/j.marpolbul.2015.07.032. [DOI] [PubMed] [Google Scholar]
- 77.Liu H, Yang J, Gan J. Trace element accumulation in bivalve mussels Anodonta woodiana from Taihu Lake, China. Arch. Environ. Contam. Toxicol. 2010;59:593–601. doi: 10.1007/s00244-010-9521-6. [DOI] [PubMed] [Google Scholar]
- 78.Wang WX, et al. Copper and zinc contamination in oysters: Subcellular distribution and detoxification. Environ. Toxicol. Chem. 2011;30:1767–1774. doi: 10.1002/etc.571. [DOI] [PubMed] [Google Scholar]
- 79.de FreitasRebelo M, do Amaral MCR, Pfeiffer WC. High Zn and Cd accumulation in the oyster Crassostrea rhizophorae, and its relevance as a sentinel species. Mar. Pollut. Bull. 2003;46:1354–1358. doi: 10.1016/S0025-326X(03)00244-3. [DOI] [PubMed] [Google Scholar]
- 80.AQSIQ, P. in GB 18421–2001 (General administration of quality supervision, inspection and quarantine of People's Republic of China, 2001).
- 81.FAO/WHO. in Fifth Session [displayed 10 February 2014]. ftp://ftp.fao.org/codex/meetings/CCCF/cccf5/cf05_INF.pdf.
- 82.Nauen, C. E. Compilation of legal limits for hazardous substances in fish and fishery products. FAO Fisheries Circular (FAO). no. 764. (1983).
- 83.Rajeshkumar S, Li X. Bioaccumulation of heavy metals in fish species from the Meiliang Bay, Taihu Lake, China. Toxicol. Rep. 2018;5:288–295. doi: 10.1016/j.toxrep.2018.01.007. [DOI] [PMC free article] [PubMed] [Google Scholar]
- 84.Baki MA, et al. Concentration of heavy metals in seafood (fishes, shrimp, lobster and crabs) and human health assessment in Saint Martin Island, Bangladesh. Ecotoxicol. Environ. Saf. 2018;159:153–163. doi: 10.1016/j.ecoenv.2018.04.035. [DOI] [PubMed] [Google Scholar]
- 85.Vu CT, Lin C, Yeh G, Villanueva MC. Bioaccumulation and potential sources of heavy metal contamination in fish species in Taiwan: Assessment and possible human health implications. Environ. Sci. Pollut. Res. 2017;24:19422–19434. doi: 10.1007/s11356-017-9590-4. [DOI] [PubMed] [Google Scholar]
- 86.Sharma B, Singh S, Siddiqi NJ. Biomedical implications of heavy metals induced imbalances in redox systems. BioMed Res. Int. 2014;20:14. doi: 10.1155/2014/640754. [DOI] [PMC free article] [PubMed] [Google Scholar] [Retracted]
- 87.Feng W, Wang Z, Xu H, Chen L, Zheng F. Trace metal concentrations in commercial fish, crabs, and bivalves from three lagoons in the South China Sea and implications for human health. Environ. Sci. Pollut. Res. 2020 doi: 10.1007/s11356-019-06712-8. [DOI] [PubMed] [Google Scholar]
- 88.Ruiz-Fernández AC, et al. A comparative study on metal contamination in Estero de Urias lagoon, Gulf of California, using oysters, mussels and artificial mussels: Implications on pollution monitoring and public health risk. Environ. Pollut. 2018;243:197–205. doi: 10.1016/j.envpol.2018.08.047. [DOI] [PubMed] [Google Scholar]
- 89.Bergstad OA. In: Encyclopedia of Ocean Sciences (Second Edition) Steele JH, editor. Academic Press; 2009. pp. 458–466. [Google Scholar]
- 90.Mauchline J, Gordon J. Foraging strategies of deep-sea fish. Mar. Ecol. Prog. Ser. 1986;27:227–238. doi: 10.3354/meps027227. [DOI] [Google Scholar]
- 91.Li J, He M, Han W, Gu Y. Analysis and assessment on heavy metal sources in the coastal soils developed from alluvial deposits using multivariate statistical methods. J. Hazard. Mater. 2009;164:976–981. doi: 10.1016/j.jhazmat.2008.08.112. [DOI] [PubMed] [Google Scholar]
- 92.Yu P. Applications of hierarchical cluster analysis (CLA) and principal component analysis (PCA) in feed structure and feed molecular chemistry research, using synchrotron-based Fourier transform infrared (FTIR) microspectroscopy. J. Agric. Food Chem. 2005;53:7115–7127. doi: 10.1021/jf050959b. [DOI] [PubMed] [Google Scholar]
- 93.Kara D. Evaluation of trace metal concentrations in some herbs and herbal teas by principal component analysis. Food Chem. 2009;114:347–354. doi: 10.1016/j.foodchem.2008.09.054. [DOI] [Google Scholar]
- 94.Chai X, et al. Distribution, sources and assessment of heavy metals in surface sediments of the Hangzhou Bay and its adjacent areas. Acta Sci. Circum. 2015;35:3906–3916. [Google Scholar]
- 95.Mackay D, Fraser A. Bioaccumulation of persistent organic chemicals: Mechanisms and models. Environ. Pollut. 2000;110:375–391. doi: 10.1016/S0269-7491(00)00162-7. [DOI] [PubMed] [Google Scholar]
- 96.ATSDR, T. ATSDR (Agency for toxic substances and disease registry). Prepared by Clement International Corp., under contract205, 88–0608 (2000).
- 97.Traina A, et al. Heavy metals concentrations in some commercially key species from Sicilian coasts (Mediterranean Sea): Potential human health risk estimation. Ecotoxicol. Environ. Saf. 2019;168:466–478. doi: 10.1016/j.ecoenv.2018.10.056. [DOI] [PubMed] [Google Scholar]
- 98.Ozmen M, Ayas Z, Güngördü A, Ekmekci GF, Yerli S. Ecotoxicological assessment of water pollution in Sariyar Dam Lake, Turkey. Ecotoxicol. Environ. Saf. 2008;70:163–173. doi: 10.1016/j.ecoenv.2007.05.011. [DOI] [PubMed] [Google Scholar]
- 99.Jeffrey, B. & Alison, G. Guidance for assessing chemical contaminant data for use in fish advisories. v. 1. Fish sampling and analysis-v. 4. Risk communication. (1993).
- 100.Regulations, U. S. E. P. A. O. o. W. Assessing Human Health Risks from Chemically Contaminated Fish and Shellfish: A Guidance Manual. (US Environmental Protection Agency, 1989).
- 101.Liu Q, Liao Y, Shou L. Concentration and potential health risk of heavy metals in seafoods collected from Sanmen Bay and its adjacent areas, China. Mar. Pollut. Bull. 2018;131:356–364. doi: 10.1016/j.marpolbul.2018.04.041. [DOI] [PubMed] [Google Scholar]
- 102.Abtahi M, et al. Heavy metals (As, Cr, Pb, Cd and Ni) concentrations in rice (Oryza sativa) from Iran and associated risk assessment: A systematic review. Toxin Rev. 2017;36:331–341. doi: 10.1080/15569543.2017.1354307. [DOI] [Google Scholar]
- 103.WHO. WHO Technical Report Series. Evaluation of Certain Food Additives and Contaminants. Fifty-Third Report of the Joint FAO/WHO Expert Committee on Food Additives (JECFA). http://www.Who.Int/foodsafety/publications/jecfa-reports/en/ (2000).
- 104.USEPA. USEPA Regional Screening Level (RSL) summary table: November 2011. (2011).
- 105.Farkas A, Salánki J, Specziár A. Age-and size-specific patterns of heavy metals in the organs of freshwater fish Abramis brama L. populating a low-contaminated site. Water Res. 2003;37:959–964. doi: 10.1016/S0043-1354(02)00447-5. [DOI] [PubMed] [Google Scholar]
- 106.Canpolat Ö, Çalta M. Heavy metals in some tissues and organs of Capoeta capoeta umbla(Heckel, 1843) fish species in relation to body size, age, sex and seasons. Fresenius Environ. Bull. 2003;12:961–966. [Google Scholar]
- 107.Hosseini M, Nabavi SMB, Nabavi SN, Pour NA. Heavy metals (Cd Co, Cu, Ni, Pb, Fe, and Hg) content in four fish commonly consumed in Iran: Risk assessment for the consumers. Environ. Monit. Assess. 2015;187:1–7. doi: 10.1007/s10661-014-4167-x. [DOI] [PubMed] [Google Scholar]
- 108.Jiang X, et al. Assessment of heavy metal accumulation in freshwater fish of Dongting Lake, China: Effects of feeding habits, habitat preferences and body size. J. Environ. Sci. 2022;112:355–365. doi: 10.1016/j.jes.2021.05.004. [DOI] [PubMed] [Google Scholar]
- 109.Yi Y, Tang C, Yi T, Yang Z, Zhang S. Health risk assessment of heavy metals in fish and accumulation patterns in food web in the upper Yangtze River, China. Ecotoxicol. Environ. Saf. 2017;145:295–302. doi: 10.1016/j.ecoenv.2017.07.022. [DOI] [PubMed] [Google Scholar]
- 110.USEPA. Assessing Human Health Risks from Chemically Contaminated Fish and Shellfish: A Guidance Manual. (US Environmental Protection Agency, 1989).
- 111.Means, B. Risk-assessment guidance for superfund. Volume 1. Human health evaluation manual. Part A. Interim report (Final). (Environmental Protection Agency, Washington, DC (USA). Office of Solid Waste …, 1989).
- 112.Raknuzzaman M, et al. Trace metal contamination in commercial fish and crustaceans collected from coastal area of Bangladesh and health risk assessment. Environ. Sci. Pollut. Res. 2016;23:17298–17310. doi: 10.1007/s11356-016-6918-4. [DOI] [PubMed] [Google Scholar]
- 113.Kalantzi I, et al. Metals in tissues of seabass and seabream reared in sites with oxic and anoxic substrata and risk assessment for consumers. Food Chem. 2016;194:659–670. doi: 10.1016/j.foodchem.2015.08.072. [DOI] [PubMed] [Google Scholar]
- 114.Sarkar S, Mukherjee S, Chattopadhyay A, Bhattacharya S. Differential modulation of cellular antioxidant status in zebrafish liver and kidney exposed to low dose arsenic trioxide. Ecotoxicol. Environ. Saf. 2017;135:173–182. doi: 10.1016/j.ecoenv.2016.09.025. [DOI] [PubMed] [Google Scholar]
- 115.Mandal BK, Suzuki KT. Arsenic round the world: A review. Talanta. 2002;58:201–235. doi: 10.1016/S0039-9140(02)00268-0. [DOI] [PubMed] [Google Scholar]
- 116.Kibria G, Hossain MM, Mallick D, Lau TC, Wu R. Trace/heavy metal pollution monitoring in estuary and coastal area of Bay of Bengal, Bangladesh and implicated impacts. Mar. Pollut. Bull. 2016;105:393–402. doi: 10.1016/j.marpolbul.2016.02.021. [DOI] [PubMed] [Google Scholar]
- 117.Fang Y, et al. Concentrations and health risks of lead, cadmium, arsenic, and mercury in rice and edible mushrooms in China. Food Chem. 2014;147:147–151. doi: 10.1016/j.foodchem.2013.09.116. [DOI] [PubMed] [Google Scholar]
- 118.Vannoort R, Thomson B. New Zealand Total Diet Study—Agricultural Compound Residues. Selected Contaminant and Nutrient Elements. Ministry for Primary Industries; 2009. [Google Scholar]
- 119.Praveena SM, Pradhan B, Ismail SNS. Spatial assessment of heavy metals in surface soil from Klang District (Malaysia): An example from a tropical environment. Hum. Ecol. Risk Assess. Int. J. 2015;21:1980–2003. doi: 10.1080/10807039.2015.1017872. [DOI] [Google Scholar]
Associated Data
This section collects any data citations, data availability statements, or supplementary materials included in this article.
Supplementary Materials
Data Availability Statement
The datasets generated during and/or analysed during the current study are available from the corresponding author on reasonable request.