

Summary
Our protocol combines Maximum Parsimony and Phylogenetic Networks approaches to understand the phylogenetic relationships and evolutionary processes of hominin species that might have shared inheritance from multiple ancestors. By addressing the questions of pattern and process in human phylogeny, the protocol can be used to clarify the taxonomic definition(s) of diverse hominin groups and ascertain whether or not the mode of evolution of genus Homo is reticulate. Using high quality and informative phenotypic data sets is necessary to yield meaningful results.
For complete details on the use and execution of this protocol, please refer to Caparros and Prat (2021).
Subject areas: Bioinformatics, Earth sciences, Evolutionary biology
Graphical abstract

Highlights
-
•
Combine Maximum Parsimony and Phylogenetic Networks in human phylogenetic research
-
•
Maximum Parsimony (MP) is used to clarify taxonomic definitions of hominin groups
-
•
MP results are validated by comparing them with alternative statistical analysis
-
•
Phylogenetic Networks approach used to make inferences about modes of evolution
Our protocol combines Maximum Parsimony and Phylogenetic Networks approaches to understand the phylogenetic relationships and evolutionary processes of hominin species that might have shared inheritance from multiple ancestors. By addressing the questions of pattern and process in human phylogeny, the protocol can be used to clarify the taxonomic definition(s) of diverse hominin groups and ascertain whether or not the mode of evolution of genus Homo is reticulate. Using high quality and informative phenotypic data sets is necessary to yield meaningful results.
Before you begin
Conceptual background
Human evolution is often portrayed as a phyletic linear anagenetic process with each species changing over time into another one (Mayr and Ashlock, 1991). This popular misrepresentation has been substituted by a branching cladogenetic approach with species sharing common ancestors evolving by a dichotomous process of speciation (Cela-Conde and Ayala, 2007). In that respect, methods of phylogeny reconstruction assume an evolutionary tree-like model represented by an optimal rooted phylogenetic cladogram (tree) with internal nodes symbolizing hypothetical last common ancestors (LCAs) emerging from speciation events, and are in general geared at clarifying an underlying evolutionary pattern, but not its process. This dichotomous approach does not fully capture the complexity of evolutionary processes, particularly if the optimal solution is not unique as illustrated in many Maximum Parsimony phylogenetic studies where a run generates more than one most parsimonious tree.
Methods of phylogeny reconstruction can be divided into statistical methods requiring an explicit model of evolution, such as for example Bayesian phylogenetic methods based on Monte Carlo Markov chains (BMCMC) used by Dembo et al. (2016), and non-statistical methods such as cladistic Maximum Parsimony (MP) used by Caparros and Prat (2021) that do not require a model of evolution. MP is the most commonly used method of phylogenetic reconstruction in Paleoanthropology (Strait et al., 2015), and is an integral part of the Phylogenetic Systematics school of thoughts in taxonomy, commonly known as cladistics (Hennig, 1966). In essence, cladistics is the analysis of individual characters (anatomical or genetic) free to evolve independently with the application of the principle of maximization of the number of evolutionary novelties on the cladogram (tree), and the consequent discovery of the hierarchical order of the various groups of species of the data set.
MP is the initial focal point of the protocol we are presenting. It is a method of mathematical programming based on graph theory with optimization of an objective function subject to linear constraints (Darlu and Tassy, 2019). Its aim is to find out of millions of tree combinations, the one(s) that maximize(s) the number of one-time character-state changes (apomorphies) subject to these constraints. When multiple most parsimonious trees possess a number of similar branches (monophyletic sister groups), these are retained as such in a consensus tree, while distinct branches not in agreement are expressed as polytomous branches (polytomies) in the consensus tree. The explanatory power of consensus trees comes from the fact that they identify informative coherent subgroups of taxa and provide a good indication of the information content of the data set (Anderberg and Tehler, 1990). However, the amalgamation of conflicting hypotheses from incompatible multiple trees into a consensus tree is deemed to represent a loss of phylogenetic information emanating from polytomies. In order to decipher this loss of information, we recommend using the method of Phylogenetic Networks (Huson et al., 2010), method extensively employed in molecular biology to represent evolutionary relationships when the history of a set of taxa includes inheritance from multiple ancestors (Morrison, 2011).
Initial Data S1
The initial complete data set will be called Data S1. For a paleoanthropological study of human evolution, gather a Data S1 made up of discrete anatomical coded characters of hominin species. Since the characters are coded subjectively, the choice of characters and their coding should be consistent with already published studies by authoritative authors to avoid observational biases.
CRITICAL:Data S1 ought to minimize the percentage of missing data, but in many instances missing data are unavoidable due to the fragmentary nature of some specimens. Compile Data S1 with the largest degree of universality possible, i.e., that encompasses the greatest number of fossil hominin taxa or taxonomic units, and ensure that the outgroup is made up of the oldest extinct, or extant, species preferably belonging to the closest taxonomic subfamily homininae. This will enable to obtain more informative results and enhance the comparison with studies based on alternative methodologies. Morphological data inputs ought to be in NEXUS format (Maddison et al., 1997), format used in most phylogenetic reconstruction analysis softwares (https://evolution.genetics.washington.edu/phylip/software.html#Parsimony) such as PAUP, PHYLIP, Mr Bayes and Mesquite.
Note: Some authors use continuous variables such as for example craniodental measurements and angles between anatomical landmarks as proxy of characters. The coding of these pseudo-characters generally normalized is arguable for phylogenetic reconstruction. This type of continuous data is better treated with conventional morphometric multivariate statistical techniques (Sokal and Rohlf, 1995), or agglomerative techniques such as UPGMA or Neighbor-Joining (Rohlf and Sokal, 1981; Saitou, 1991) emphasizing overall phenetic similarities based on distance metrics (Sokal and Sneath, 1963).
Required software packages
Two software packages are required to process the data sets of the protocol: PAUP and SplitsTree. The MacClade software can be used as an option to visualize the results of the tree-based MP analysis using the complete character Data S1 executed with PAUP.
Prior use of the protocol
We used the present protocol with its specific steps in a study offering a new perspective on reticulate evolution of the genus Homo (Caparros and Prat, 2021) based on a morphological paleoanthropological data set of pre-defined hominin species compiled by Dembo et al. (2016). Our methodological approach followed the three steps of the phylogenetic protocol illustrated in Figure 1.
Figure 1.

Protocol combining tree-based Maximum Parsimony and web-like Phylogenetic Networks analyses
The three Major Steps of the protocol are as follows:
(A) Tree-based MP analysis.
(B) Intermediate tree-based MP analysis.
(C) Reticulate PN analysis.
Key resources table
All software packages used for the analyses are publicly available.
| REAGENT or RESOURCE | SOURCE | IDENTIFIER |
|---|---|---|
| Deposited data | ||
| Data S1 | Dryad Digital Repository (https://doi.org/10.5061/dryad.d7r4g.2) and this paper. | Data S1. Complete character data set from Dembo_et_al_2016_JHE, related to step 1. |
| Data S2 | This paper. | Data S2. MPMAX 74 apomorphous characters, related to step 6. |
| Data S3 | This paper. | Data S3. MMPT trees, related to step 11. |
| Software and algorithms | ||
| Phylogenetic Analysis Using Parsimony (PAUP) Version 4.0a. | Swofford (2020). Phylogenetic Analysis Using Parsimony (PAUP), Version 4.0a. | https://paup.phylosolutions.com |
| MacClade v. 4.08a. | Maddison and Maddison (2005). MacClade software v. 4.08a, Sinauer Associates, Sunderland Massachusetts. | http://www.macclade.org/download.html |
| SplitsTree 4. | Huson and Bryant (2006). Application of Phylogenetic Networks in Evolutionary Studies. Mol. Biol. Evol. 23, 254–267. | https://software-ab.informatik.uni-tuebingen.de/download/splitstree4/welcome.html |
Step-by-step method details
Tree-based MP analysis
Timing: 1 day to a few days
Note: Timing depends on the size and complexity of the data set matrix, and also of PAUP software execution times of 16 MP and 16 bootstrap runs.
For the MP analysis with the complete initial Data S1, take into consideration three kinds of constraints in the execution of the runs: the type of characters, the presence of polymorphic characters in multistate taxa, and with regard to the weighing of characters use two options, i.e., initially apply same weights and reweigh characters after the initial runs.
Once a most parsimonious evolutionary scenario is selected, the supporting derived characters (apomorphies and eventually informative homoplasies) at the nodes of the cladogram (LCAs) ought to be visualized such as for example in Figures S9 and S10 of Caparros and Prat (2021) showing graphically the apomorphies listed in Tables S2 and S3 of that paper. The visualization will facilitate the discussion of the anatomic modifications of an adaptive nature or the result of epigenetic processes that come in support of the evolutionary changes.
Finally, the most parsimonious evolutionary scenario must be validated by comparing a bootstrap simulation based on the same MP parsimony settings with an alternative statistical method such as for example BMCMC.
-
1.
Execute 16 MP runs and 16 corresponding bootstrap runs
With Data S1 and the PAUP software execute 16 MP runs corresponding to 16 different evolutionary tree scenarios with two settings for weights (equal weight and Rescaled Consistency Index RC reweight), four character types (Fitch, Wagner, Camin-Sokal or Dollo), and two settings for multistate taxa (uncertainty or polymorphism). The runs can be executed with a search algorithm in two phases: one phase with equal weights and one with characters reweighed. We show below the relevant dropdown menus used to execute the 2 phases.Note: With regard to the computational MP tree search methods, there exists three algorithms available in PAUP:Exhaustive Search: exact algorithm that evaluates every possible tree and can be used for a maximum of 12 terminal taxa. Branch-and-Bound Search: also an exact search option that can be used for more than 12 taxa; however, this algorithm works computationally for data sets of a limited size.
 Heuristic search: when the processing with the branch-and-bound algorithm is not feasible with a large data set, the only alternative to process the data is by heuristic search that operates by hill-climbing methods, and is computationally effective. In Caparros and Prat (2021) all the runs were conducted by heuristic search with simple stepwise addition and TBR branch swapping.
 For further explanations of the search parameters consult the PAUP manual (http://phylosolutions.com/paup-documentation/paupmanual.pdf).
-
a.MP runs corresponding to 8 scenarios with initial equal character weightsIn a first phase, execute 8 equal weight runs with the appropriate search method and the following parameters:
-
i.Equal character weights.

-
ii.Four character-types.
 Runs are executed with the four character types optimality criteria (Fitch-unordered, Wagner-ordered, Camin-Sokal-irreversible or Dollo-reversible). For Dollo and Irrev types two modes are available: Up (normal) and Down (reversed); these modes are related to the polarity of the coded observed states, with Up starting with the lowest observed ancestral state and Down the highest. We used Up polarity in Caparros and Prat (2021).Note: There are four main character type options to choose from PAUP to conduct MP analysis runs . The four parsimony optimality criteria represent four models of evolutionary paths applied to character changes, subject to constraints as to the polarity or reversibility of the characters. If one does not want any constraint, one then uses unordered Fitch setting (Fitch, 1971) which permits any state of a character to transform directly to any other state. If one wants to impose a constraint as to the direction (polarity) of the state changes, one uses Wagner ordered setting (Farris, 1970; Swofford and Maddison, 1987) which is bidirectional, i.e., in a three states 0,1,2 character there is no requirement that 0 be the ancestral state, only the resulting tree will determine which state is ancestral after orienting the tree (graph) with an outgroup. Wagner parsimony makes convergence and reversion possible, as in Fitch parsimony. If one considers that evolution is irreversible as suggested by Simpson (1953), then one chooses the Camin-Sokal criterion (Camin and Sokal, 1965) which is equivalent to ordered characters with the additional constraint of irreversibility, or unidirectionality from a plesiomorphic state or less derived state to a more derived state. Finally, if one assumes that a derived character can change only once from the plesiomorphic state to the derived state, and can revert more than once to the plesiomorphic state, then the Dollo criterion (Farris, 1977), which only allows homoplasy under the form of reversal, is required. For a more comprehensive description of these four main choices we refer to Caparros and Prat (Caparros and Prat, 2021 - Supplemental Information/Transparent Methods 1. Maximum Parsimony (MP) optimality criteria), and show below their graphical representation.
 CRITICAL: In most MP published studies in Paleoanthropology, authors commonly use the unordered character type (Fitch parsimony) or ordered type (Wagner parsimony), or a combination of both (Collard and Wood, 2000; Strait and Grine, 2004), whereas the ones favoring convergent homoplasies (Camin-Sokal parsimony) or reversals (Dollo parsimony) are never selected. The use of Fitch and/or Wagner character types would indicate that authors make a priori assumptions about the process of evolution with regard to character-state changes. Thus, to avoid any bias with regard to which model of evolutionary path a character type should follow, we strongly recommend that the four character types be used in the analysis runs.
 -
iii.Uncertainty or polymorphism setting for multistate taxaFor each of the 4 character types execute runs with uncertainty and polymorphism settings for multistate taxa.
 CRITICAL: Many authors tend to discard polymorphic characters in multistate taxa. Ignoring polymorphism results in a loss of information (Wiens, 1999); this is the reason why we recommend that polymorphic characters in multistate taxa be coded and kept in the data set. For further discussion of the multistate taxa choices (uncertainty or polymorphism), we refer to Caparros and Prat (Caparros and Prat, 2021 - Supplemental Information/Transparent Methods 2. Treatment of multistate taxa).Note: Caution is required in interpreting the results with regard to uncertainty or polymorphism setting for multistate taxa. After running the parsimony algorithm, PAUP assigns one of the states of a multistate character to the terminal taxon, i.e., the algorithm treats the multistate character as an ambiguity, and by optimization assigns one of the features to the terminal in the output. Conceptually one may construe the selected chosen state in the output terminal as if the polymorphism had resulted in the monomorphic dominant fixation of the trait in the concerned species.Thus, using the distinct character types (4) and multistate settings (2), 8 runs will be executed in total with equal character weights.
-
i.
-
b.MP runs corresponding to 8 scenarios with reweighed charactersIn a second phase, execute 8 runs with characters reweighed by the respective Rescaled Consistency indices (RC) obtained from the previous corresponding equal weight runs, with the same character types and multistate settings. The relevant parameters are as follows:
-
i.RC reweighed characters.
 CRITICAL: Weighing of characters in cladistics is a controversial issue, one argument being that reweighing characters after an initial run leads to unparsimonious hypotheses (Kluge, 1997). However, Farris (1983) considered that characters with more homoplasy are less reliable and suggested that parsimony is not equivalent to equal weights; he argued on the basis that some characters represent stronger evidence than others, that consequently they should be weighed. Reweighing of morphological data sets produces substantial increases in jackknife frequencies, and results compared to equal weighing become more stable with lower error rates (Goloboff et al., 2008). This supports the affirmation that “it is not that parsimony does not preclude weighing, but rather that it requires weighing" (Goloboff, 1993). Successive weighing is successful when cladistically reliable characters such as apomorphies are outnumbered by homoplasies (Farris, 1969), which is generally the case in most studies. Thus, should the characters originally with equal weight be reweighed after a first run? The answer is definitely yes as is evident in Caparros and Prat (Caparros and Prat, 2021, Table 1) showing that reweighing produces higher tree Retention Indices RIs. Higher tree RIs imply a more coherent degree of overall synapomorphy and a more consistent phylogenetic information signal. The use of the character rescaled consistency index rc = retention index (ri) x consistency index (ci) from the first phase runs is recommended as a weighing criterion (Farris, 1989a) of the respective characters.
 -
ii.Four character-types (Fitch-unordered, Wagner-ordered, Camin-Sokal-irreversible or Dollo-reversible) are used as in step 1, a, ii.
-
iii.Uncertainty or polymorphism settings for multistate taxa are used as in step 1, a, iii.Thus, using the distinct character types (4) and multistate settings (2), 8 runs will be executed in total with character RC reweighing.
-
i.
-
c.Execute 16 bootstrap runsTo assess the branch support of the 16 MP tree scenarios individually, execute bootstrap runs concurrently to the MP runs with the same parsimony settings used in each MP run.
 CRITICAL: Bootstrapping, a random resampling method developed by Efron (1979) to evaluate the accuracy of statistical estimates, was proposed by Felsenstein (1985) to assess the confidence intervals in phylogenetic analyses. There seems to exist some confusion with regard to the use of bootstrap simulation in MP analysis. In some phylogenetic studies, the MP bootstrap consensus tree is used as a final result and considered as an end in itself, without relating it to or showing the relevant MP tree it is supposed to evaluate. For comparative purposes, it is imperative to show graphically the 50% majority rule bootstrap consensus tree with its relevant bootstrap branch replicate values along with the corresponding tree figure (single or consensus) of the MP scenario, as for example in Figures S3–S6 of Caparros and Prat (2021).Note: Bootstrap values in general are negatively affected by the number of characters, the number of non-informative characters, the number of missing characters in some taxa, and by the sample size and the nature of the search algorithms (Soltis and Soltis, 2003). One should not exclude the possibility that a tree topography with very low support values of an extensive and complex data set might still be phylogenetically closer to the "true" tree than a tree topology with higher support values from a limited and related data set. It is thus paradoxical that the more extensive a data set is, the lower the support values may be.Note: Since the bootstrap analysis is a random resampling method, it is not certain that the resulting bootstrapping consensus tree will be exactly identical to the MP tree (single or consensus) obtained with the same settings, and various bootstrapping runs might generate slightly different results. Refer to troubleshooting problem 1 for a potential solution.
 -
d.OutputAfter an MP run PAUP provides two types of output:
-
i.Tree(s)-cladogram(s). The run may generate one most parsimonious tree or multiple trees that are also most parsimonious. A run producing more than one most parsimonious tree can be expressed for analytical purposes under the form of a consensus tree (see troubleshooting problem 2). We recommend to use the 50% majority rule consensus tree of the resulting minimal trees, the most robust commonly used method that allows one to retain all groups found in over half of the rival trees.
-
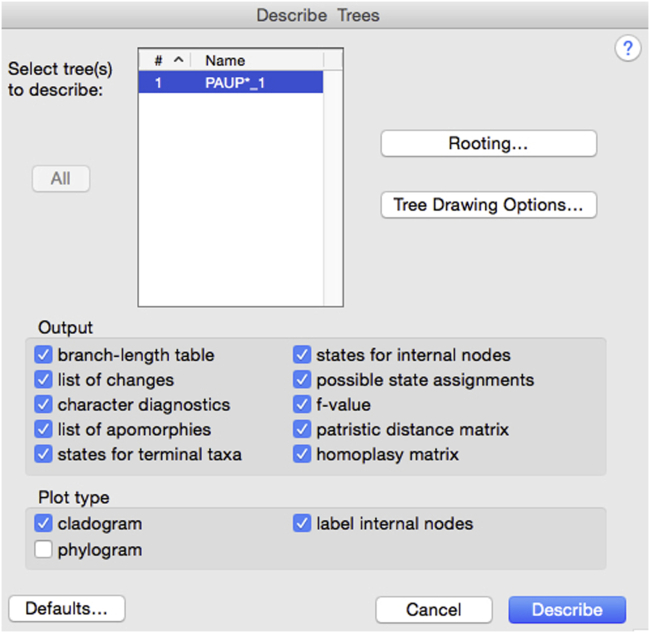
ii.Analytical descriptive parameters. In addition to the most parsimonious tree(s) and eventual consensus tree resulting from the analysis, extensive descriptive output data are available for each run from the Describe Trees menu. The following information is available to conduct an in-depth analysis of the results: main result parameters (along with the cladogram, number of most parsimonious trees, number of steps, tree Retention Index and Consistency Index; these may be summarized in a table for all the 16 runs as for example in (Caparros and Prat, 2021, Table 1), branch lengths and linkages of terminal taxa and nodes (LCAs) to other nodes, possible character-state assignments to internal nodes, data matrix and reconstructed states for internal nodes on the basis of the optimization algorithm selected to resolve ambiguities (ACCTRAN or DELTRAN), character change lists showing at which nodes/terminal taxa each character changes, apomorphy lists showing for every branch which characters change and how, and character diagnostics list providing for each character the Minimum, Actual and Maximum number of steps (changes) allowing the computation of character consistency indices (ci), retention indices (ri) and rescaled consistency indices (rc). From this last list you will select the apomorphies with character retention index ri = 1 that will compose Data S2 for the intermediate MP analysis.
-
i.
-
a.


-
2.Selection of the most parsimonious tree scenario
-
a.Why do apomorphies matter?An apomorphy is the sharing of an anatomical novelty by two species as a sign of close relatedness (Hennig, 1966). By contrast, a novelty not shared by an immediate common ancestor is designated as an homoplasy such as convergence or reversal (Simpson, 1961). For further information on the concepts of apomorphy and homoplasy refer to Caparros and Prat (Caparros and Prat, 2021 - Transparent Methods. Foundations of the phylogenetic concept of Maximum Parsimony). As a general rule if a character shows n states, an apomorphous character will result in n-1 one-time character state changes in the cladogram, and for a homoplastic character there will be at least n character-states changes. The most parsimonious tree(s) that you are searching is(are) the one(s) that reveals the maximum number of apomorphies or equivalently minimizes the number of homoplasies inherent to the tree.
-
b.How to identify apomorphies?The discovery of apomorphies (synapomorphies shared downstream in a tree or autapomorphies specific to a branch) represents an important aim of the MP analysis because before conducting the analysis the researcher does not know which character-state changes are apomorphous. An apomorphy is not a declaration ex ante of a character-state derived change; an apomorphy emerges from the results of the run, and the easiest and most elegant way to identify apomorphies after a PAUP run is to select characters with a retention index ri = 1 from the "character diagnostics" list of the Describe Trees output menu, as shown for example in Table S1 of Caparros and Prat (2021).
-
c.The character retention indexThe character retention index ri is "the fraction of apparent synapomorphy in the character that is retained as synapomorphy on the tree" (Farris, 1989b). We illustrate graphically in Figure 2 reproduced from Figure S8 (Caparros and Prat, 2021) the ri character retention index's behavior related to the coherence of the MP tree; it expresses the degree of a posteriori homology apparent in the character, i.e., its information content. If ri = 1 the character change represents an apomorphy while values of 0 < ri < 1 represent homoplasies. The lower this index the more homoplastic the character is; thus, the quantity 1- ri represents the degree of homoplasy inherent to this character in the MP tree.
-
d.From the character retention index to the tree retention indexA distinction should be made between a single character retention index ri and an overall tree retention index RI. The tree Retention Index RI is the sum over all the individual-character retention indices ri calculated as per the formula (∑ g − ∑ s) / (∑ g − ∑ m) with g, s and m as defined in Figure 2.
-
e.Metric to select the most parsimonious scenarioThe tree RI is the best metric to select the most informative run because it measures accurately the overall degree of synapomorhy of the MP tree (Farris, 1989a, 1989b; Caparros, 1997), i.e., the scenario with the highest tree RI is the most coherent and phylogenetically informative. The tree RI is a better indicator of the level of synapomorphy than the Consistency Index CI, and represents a robust proxy for confidence and accuracy estimate in the selection of the most informative and coherent MP scenario (Caparros, 1997; Farris, 1989a, 1989b; Mounier and Caparros, 2015; Mounier et al., 2016). In essence, a high value of the RI index is indicative of a high degree of overall synapomorphy inherent to the tree, and thus of its phylogenetic information content. In Caparros and Prat (Caparros and Prat, 2021 - Figure 1, Table 1) we called MPMAX the scenario with the highest RI.Note: Some workers may object to the use of the tree RI to select the most parsimonious scenario. In such eventuality, refer to troubleshooting problem 3.Note: The total number of steps of a PAUP run is not a reliable parameter to select the most parsimonious scenario due to the fact that the constraints (models of character type, equal weight or reweighing, and multistate taxa settings) affect the scale of the number of steps as evidenced in Table 1 of Caparros and Prat (2021).
-
a.
-
3.Visualization of the most parsimonious scenario results and character support
-
a.Elliptic graphic representationThe results of an MP run are normally expressed as a tree (single or consensus) where the nodes of the branches represent the hypothetical LCAs. Hennig (Hennig, 1966 Figure 18, p.71) was the first to present an elliptic phylogenetic graphic representation equivalent to a cladogram. For illustrative purposes we show in Figure 3 the similarities between an elliptic representation and the MP cladogram from Caparros and Prat (Caparros and Prat, 2021 - Figures 1 and S7). The identifying node numbers of the LCAs of the cladogram are expressed as numbered stem species elliptic boundaries. The difference between the cladogram and the elliptic representation is the way the phylogenetic relationship is expressed between the stem species and its successor sister groups. In the cladogram, it is represented by the nodes (hypothetical ancestors) linking the dichotomous branches to its successors (two other nodes, or a node and a terminal, or two terminals) whereas in the elliptic representation, the boundary lines of the stem species are drawn around their successor species. The elliptic boundaries illustrate more accurately than the tree-based representation the formation of higher taxa monophyletic groups in conformity with the hierarchic system of Phylogenetic Systematics, and facilitate the interpretation of the ancestor-descendant relationships among the various species under study.Note: The elliptic representation applies only to a fully resolved tree, i.e., it cannot be used with a tree that has polytomies. No software exists for the elliptic representation which must be done manually, with the character state changes coming in support of the branches (as illustrated for example in Figure 4 reproduced from Figure S9 (Caparros and Prat, 2021)) obtained from the PAUP run Describe Trees output.
-
b.Visualization of apomorphies in support of LCAsContrary to probability-based methods of phylogeny reconstruction, MP identifies clearly the character-state changes that support the various clades, e.g., in Caparros and Prat (Caparros and Prat, 2021 - Tables S1 and S2) 74 apomorphies in support of the LCAs were identified from the MPMAX run output with character retention index ri = 1. We show in Figure 4 the one-time character-state changes (apomorphies) in support of stem species elliptic boundaries 40 to 26 (tree nodes - LCAs) of this scenario that encompasses the Homo genus species definitions.CRITICAL: We strongly recommend that the apomorphies in support of the various clades be graphically visualized as a prior step to the discussion of the anatomical significance regarding the appearance of morphological novelties.Note: In Figure 4 the character changes highlighted for nested elliptic boundaries (stem taxa) A, B, C, D, E, F, 34 and terminal Hsap (H. sapiens) are synapomorphies, i.e., morphological novelties passed on to succeeding nested monophyletic groups, whereas the novelties of the remaining lower sister groups J, I, H, G and stem boundaries 26, 31 and 33 are autapomorphies specific to these groups.
-
c.Projection of individual characters on to the cladogramThe PAUP software after conducting a run provides extensive detailed output data from the Describe Trees menu which are very useful in analyzing the anatomical features of individual character state changes and their relevant phylogenetic significance. However, PAUP does not provide an easy way to visualize synthetically this rich output material. In our opinion, the best software to visualize these results is MacClade which happens to be compatible with PAUP. Both the MacClade software (Maddison and Maddison, 2005) and the PAUP software (Swofford, 2020) use the NEXUS format, e.g., one can set up a character data matrix in MacClade and execute the MP run in PAUP with this matrix, or vice-versa visualize with MacClade the tree output of a PAUP run from a given outsourced data set.CRITICAL: The freely available MacClade software works well only on old PowerPC Mac computers under a classic operating environment and on Intel Macs under operating systems up to MacOS 10.6. Unfortunately, it does not work under MacOS X 10.7 or later versions of the MacOS, and cannot run under Windows; thus, to benefit from this very helpful visualization tool one needs to use an old Mac computer with one of the operating systems just mentioned. We are not aware of any other phylogenetic software having the versatile features of MacClade for visualizing and rendering with high precision the results obtained from PAUP.
-
i.Setting up a data matrix in MacCladeThis is done easily with the data editor, with the possibility of entering additionally the character state names along with the coded symbols if necessary.


-
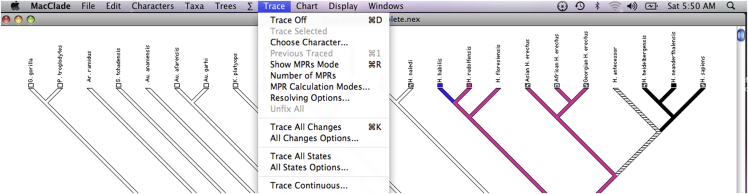
ii.Projection of individual characters on to the cladogramOne attractive feature of MacClade is the possibility to project individual characters on to the cladogram from the resulting PAUP analysis run. To use this feature, read in MacClade Data S1 and the relevant resolved tree saved from the PAUP run. This projection allows one to verify graphically for each character its status either as an apomorphy or homoplasy, and in the case of homoplasy to ascertain its status as convergence or reversal provided one insures that the projection is unconstrained by selecting an unordered mode. These projections are useful to explain the anatomical changes that took place along the evolutionary path of the tree. Below are four examples of character state projections (Figure 5) from the MPMAX output of Caparros and Prat (Caparros and Prat, 2021 - Figure S8) with (B) example of synapomorphy of mandibular fossa position character, (C) example of autapomorphy in Paranthropus clade of lingual shape of maxillary canine character, (D) example of convergence homoplasy of suprameatal spine character, and (E) example of reversal homoplasy of external auditory meatus size character.Note: To project the characters on to the cladogram with MacClade, use the Trace menu and scroll through them one at a time to visualize them. Should a character be ambiguous with several possible most parsimonious reconstructions (MPRs), as shown for H. antecessor in the illustration below, it is possible to view each ambiguity using the "Show MPRs Mode" in the menu. To find a resolved state based on ACCTRAN or DELTRAN optimization option see troubleshooting problem 4.
-
i.
-
a.


-
4.Validation of the most parsimonious scenario by statistical comparison
-
a.Comparison of non-statistical MP and statistical BMCMC results with same data setAn empirical objective for a better interpretation of the data in studies of human phylogenetic reconstruction requires that MP, a non-statistical numerical method based on mathematical graph theory (Darlu and Tassy, 2019), be compared with a statistical one such as for example BMCMC (Goloboff and Pol, 2005; Cummings et al., 2003). However, the two methods are not directly comparable since the measure of coherence of MP such as the tree RI is unrelated to the posterior probabilities produced by the BMCMC analysis. An indirect way of comparing the two methods is to execute a bootstrap run with the same settings as the MP run, and compare the proportions of bootstrap replicates values Pboot of the bootstrap tree to the posterior probability values Ppost of the BMCMC tree resulting from the Bayesian analysis with the same data set.
-
b.Are Pboot and Ppost comparable?The question is, are the values of Pboot and Ppost comparable? The proportion of bootstrap replicate value Pboot in which a clade is identified is subject to various interpretations in phylogenetic analysis (Soltis and Soltis, 2003). Some view Pboot as a measure of repeatability, others as a measure of accuracy, i.e., closeness to the true tree, or a measure of statistical confidence. Most systematists view bootstrap values as a relative assessment of clade support rather than a strict statistical confidence statement of the nodes, or joint confidence for the entire tree. Simulations of maximum likelihood bootstrap and BMCMC analyses performed on the same sequence data set show that over various model spaces values Pboot and Ppost are not significantly different (Cummings et al., 2003). These findings are corroborated in a set of simulations showing that Ppost estimated by Mr Bayes software and Pboot calculated by PAUP software were almost exactly the same (Goloboff and Pol, 2005). Thus, the search method with the highest support values will indicate relatively a higher coherence level in the relationships expressed phylogenetically by the clades.
-
c.Example of scenario validation further to the comparisonCaparros and Prat (2021) compared the bootstrap values Pboot of MPMAX to the Ppost probabilities of a BMCMC analysis from Dembo et al. (2016) executed with the same data set. Figure 6 shows the results of the comparison by means of an elliptic phylogenetic representation. The MPMAX scenario had a systematically higher support in practically all of the sister groups with a higher resolution concordant with paleoanthropological paradigms, and the conclusion was that the bootstrap tree identical to the MPMAX tree with the same settings validated this most phylogenetically informative and coherent evolutionary scenario.
-
a.
Figure 2.

Character retention index ri formula and description of how it behaves as a function of changes in character state variables
Yellow color: three variables m, s and g provided in the character diagnostic output of the first PAUP run.
Pink color: homoplasy definitions based on variables m, s and g.
Green color: behavior standardized from 0 to 1 of character retention index ri and its complement d observed homoplasy index.
Blue color: inference interpretations drawn from behavior from 0 to 1 of character retention index ri.
Reproduced from Figure S8 of Caparros and Prat (2021).
Figure 3.

MPMAX cladogram and its elliptic representation
MPMAX cladogram (A) and its elliptic representation (B) reproduced from Figures 1 and S7 of Caparros and Prat (2021). The nodes of the tree are indicated in black numbers with arrows. In the elliptic representation the LCA nodes are expressed as equivalent elliptic boundaries. Refer to the legend of Caparros and Prat (2021) Figure 1 for sister group definitions.
Figure 4.

Character-state changes (apomorphies) in support of stem species elliptic boundaries 40 to 26 (tree nodes - LCAs) of MPMAX scenario
Meaning of symbols are as follows: numbered stem boundaries correspond to nodes of equivalent tree, arrows from boxes to stem boundaries indicate supporting apomorphous character-state changes, ==> unambiguous characters and --> ACCTRAN resolved ambiguous characters. ACCTRAN optimization (Agnarsson and Miller, 2008) was used for the treatment of ambiguities. Reproduced from Caparros and Prat (2021) Figure S9.
Figure 5.

Four examples of character state projections with MacClade based on the MPMAX cladogram
Reproduced from Caparros and Prat (2021) Figure S8
Figure 6.

Phylogenetic support comparison between MPMAX scenario and best BMCMC Dembo scenario
(A) MPMAX bootstrap elliptic representation with replicate Pboot values (B) BMCMC Dembo elliptic representation with posterior probability values Ppost. Pboot and Ppost are shown in red and expressed in %. Reproduced from Caparros and Prat (2021) Figure 2.
Intermediate MP analysis
-
5.
Is the most parsimonious scenario MPMAX indicative of a process of reticulate evolution?
Could a sequential hierarchical order in the most parsimonious MPMAX cladogram be indicative of a process of reticulate evolution among some of the species of this scenario? Prior to answering this question, you need to verify the phylogenetic signal related to the various sister groups by following the fundamental principle of Phylogenetic Systematics. This principle stipulates that the evolutionary history of taxa is reconstituted from characters by the sharing of apomorphies while homoplasies, resemblance not due to inheritance from a close common ancestor, represent features of an adaptive nature and are therefore phylogenetically less informative; in other words, "The more characters certainly interpretable as apomorphous (not characters in general) are present in a number of different species, the better founded is the assumption that these species form a monophyletic group (Hennig, 1966)".
-
6.
Re-run the parsimony analysis with apomorphous characters as prior step to the PN analysis
In keeping with the Hennigian principle that only apomorphies are relevant in finding monophyletic groups, re-run the MP analysis with apomorphies (and if necessary add informative homoplasies as per troubleshooting problem 5 below) resulting from the most parsimonious scenario MPMAX. Select apomorphous characters with retention index ri = 1 to make up Data S2 from the MPMAX character diagnostics output. With Data S2 execute an MP run with the same settings as the most parsimonious scenario from Data S1 selected with the highest tree RI. In Caparros and Prat (Caparros and Prat, 2021, Table S1) apomorphies of the MPMAX scenario (Dollo type algorithm, RC reweighing and uncertainty setting for multistate taxa) were selected with character retention index ri = 1, and generated a reduced Data S2 of 74 apomorphous characters. There was no need to execute a second run with reweighed characters since the selected apomorphies of Data S2 had an ri = 1 and ci = 1, with a reweighing parameter rc (ri x ci) = 1 identical to the initial run equal weights. We reproduce below Table S1 of Caparros and Prat (2021) showing character diagnostics from output of MPMAX run. The list shows for each informative character its consistency index ci, retention index ri and rescaled consistency index rc = ci x ri. Apomorphies for the subsequent intermediate MP analysis were selected on the basis of their character ri = 1.

-
7.
Example - Intermediate MP analysis results from Caparros and Prat (2021)
The run with 74 apomorphous characters generated a set of 3213 MP trees called MMPT (multiple most parsimonious trees) which make up Data S3, with perfect tree congruence indices RI = 1 and CI = 1 for all the trees. The 50% majority consensus tree of MMPT trees resulting from the analysis based on Data S2 is reproduced in Figure 7; it confirmed the existence of four highly resolved ancestral monophyletic sister groups identified in the MPMAX scenario (PreHs, Her, NalSed and Par in Figure 3 - elliptic representation) and showed four polytomies that regroup incompatible parts of the multiple trees.
Note: More polytomies become apparent when the number of homoplastic character decreases in the executed Data S2, while the number of most parsimonious trees increases substantially, as observed in Caparros (1997). Polytomies may be construed as background noise defined as N = (1 - RI∗), RI∗ being the tree retention index of the MPMAX scenario from analysis with the full Data S1 and the value 1 representing the perfect tree retention index from the intermediate analysis with the apomorphous Data S2. Conceptually N represents the contribution of removing homoplastic characters to the diminution of the RI between the two types of analyses, and may be considered as a loss of phylogenetic information.
Figure 7.

50% majority consensus tree from MP run with apomorphous Data S2 that generated 3213 Dollo MP trees (MMPT) with RI=1 and CI=1 for all trees
Reproduced from Caparros and Prat (2021) Figure 3.
As shown below, polytomies thought to be generally uninformative resulted in being of utmost importance in the PN analysis, i.e., deciphering this apparent loss of information embedded in the polytomies allowed to conduct the PN analysis with Data S3 composed of the MMPT multiple most parsimonious trees.
Phylogenetic Networks analysis
-
8.
Transition from a tree to a network to explain human evolution
Phylogenetic trees may not be the best tool to represent phylogenetic history in light of the complex biological processes such as hybridization that may generate evolutionary reticulation; networks are therefore the solution if one conceives that a network is a tree with reticulations. The question methodologically is how do we make the transition from a tree to a network to explain evolution. In a hybrid species, its genome comes partly from one parent and partly from the other, so the resulting hybrid genome will have different evolutionary histories; therefore, the analysis will endeavor to reconstruct and blend the different phylogenetic trees of the genomes. In the construction of a hybridization network the conflicting gene trees will be processed, and not the original genomic data. More generally, the question becomes how do we represent evolutionary relationships when the history of a set of taxa includes inheritance from multiple ancestors across hybridized taxa.
-
9.
Empirical assumptions to link MP and PN analyses
Based on the analogy of hybrid species sharing multiple ancestral evolutionary histories, in Caparros and Prat (2021) we used a Phylogenetic Networks conceptual approach extensively employed in molecular biology to test the hypothesis of phenotypic hominin evolutionary reticulation. To establish a link between the MP and the PN analyses, we made two empirical assumptions: 1) apomorphous character-state changes represent analogous proxies of gene sequence changes evolving from common ancestors, and 2) the 3213 MP trees (MMPT) making up Data S3 (resulting from the parsimony PAUP run with apomorphies of Data S2) are methodologically analogous to gene trees from a set of species, and are thus used as input in the PN analysis.
-
10.
Types of phylogenetic networks
Huson and Bryant (2006) distinguish three main types of phylogenetic networks:-
a.Phylogenetic trees used to summarize taxonomic relationships between biological entities.
-
b.Splits networks used to represent incompatibilities in data sets reflected for example by polytomies in consensus trees.
-
c.Reticulate networks used to explain evolutionary histories with edges representing lineages of descent or reticulate events, and internal nodes representing hypothetical ancestors.In Caparros and Prat (2021), to shed some further light on the taxonomic threshold between the genus Homo and other hominin sister groups, we tested the hypothesis of phenotypic hominin evolutionary reticulation based on these three types of phylogenetic networks.Note: For a review of Phylogenetic Networks methods, we refer to the comprehensive syntheses of the field by Huson et al. (2010) along with the freely available application software SplitsTree (Huson and Bryant, 2006), and Morrison (2011).
-
a.
-
11.
Steps used in Caparros and Prat (2021) as example of PN analysis
With the MMPT Data S3 and using the SplitsTree software (Huson and Bryant, 2006), we computed the majority consensus tree, the consensus network and the reticulate network which we reproduce here in Figure 8.
Read the MMPT Data S3 nexus file with the SplitsTree software and hit Apply. The sequence of steps with the dropdown menus to produce the 3 panels of Figure 8 are illustrated as follows:-
a.Consensus tree
-
i.Screenshot for Consensus Tree run.

-
ii.Screenshot of resulting Consensus Tree.

-
i.
-
b.Consensus network
-
i.Screenshot for Consensus Splits of trees.

-
ii.Screenshot of resulting Consensus Network with EqualAngle.

-
iii.Screenshot for splits graph obtained with ConvexHull.
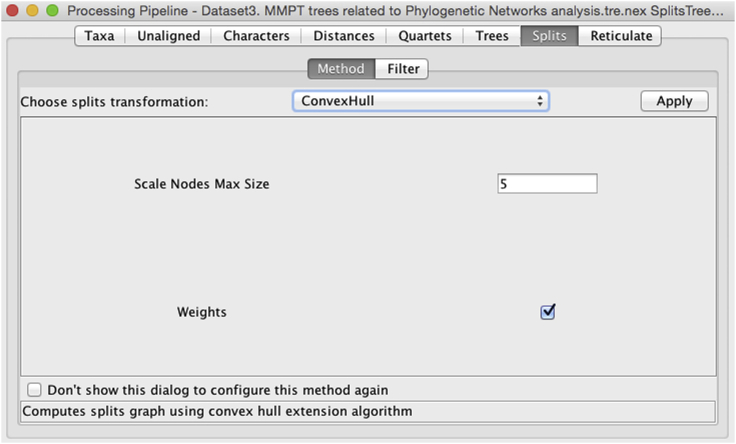
-
iv.Screenshot of resulting Consensus Network obtained with ConvexHull.

-
i.
-
c.Reticulate network
-
i.Screenshot for Reticulate Network.

-
ii.Screenshot of resulting Reticulate Network.

-
i.
-
a.


Figure 8.

Phylogenetic networks graphical results
Tree and network computations were executed with the program SplitsTree (Huson and Bryant, 2006) based on Data S3 (MMPT = 3213 trees) obtained from the Intermediate MP analysis with Data S2.
(A) Unrooted majority consensus tree with mean edge weights (pipeline Taxa=24 [Trees > ConsensusTree > EqualAngle]).
(B) Consensus network computed with threshold = 0.10, mean edge weights and splits convex hull transformation (pipeline Taxa=24 [Trees > ConsensusNetwork > ConvexHull]).
(C) Rooted reticulate network with first taxon as outgroup and 180 equal angle (pipeline Taxa=24 [Trees > ConsensusNetwork > ReticulateNetwork]).
Reproduced from Figure 4 in Caparros and Prat (2021).
Expected outcomes
As indicated graphically in Figure 1 of Huson and Bryant (2006) showing the different types of Phylogenetic Networks concepts and inputs required, our suggested Phylogenetic Networks approach is not based on characters per se but on the multiple most parsimonious trees (MMPT) resulting from the tree-based MP analysis with apomorphous characters, in the same way that gene trees from a set of species are used to generate consensus networks and reticulate networks in molecular biology.
Note: It is generally thought that polytomies have no value-added information in tree-based MP phylogenetic reconstruction, but the reverse is true in PN methods. Polytomies in a consensus tree represent conflicting patterns of incompatible trees; however, the information embedded in them allows the construction of consensus and reticulate networks along with the stable sister groups. This is precisely illustrated in Figure 9 reproduced from (Caparros and Prat, 2021) where one can observe in the consensus tree that the parts of the multiple trees that are incompatible are expressed as polytomies of unresolved nodes, while the consensus network focuses on these conflicting patterns by means of split parallelograms that may cause reticulation.
Figure 9.

Highlight of multiple trees conflicting patterns expressed as polytomies in consensus tree, and expressed in the consensus network by means of split parallelograms that may induce reticulation
Reproduced from Caparros and Prat (2021) Figure 4.
The expected outcome from a reticulate network analysis is to detect phylogenetic hierarchical patterns among the species under study that may allow inferences about evolutionary processes that gave rise to their diversity. The evolutionary reticulate network displays evolutionary events that have a causal relationship, the cause being subject to varying interpretation.
Note: By way of inferential example, in Figure 10 reproduced from Caparros and Prat (2021), reticulation in coexisting taxa may be thought as resulting from biological processes expressed by phenotypic morphological apomorphies. Three types of inferences with regard to the modes of evolution were drawn from this reticulate network. Among the late Miocene - Pliocene hominin taxa up to Australopithecus africanus there is no apparent evidence of ancestral radiations but rather a process of anagenesis, that is to say phyletic gradualism. One may observe probable cladogenetic events at the root of the network and further upstream from Australopithecus africanus. Most significantly, evolutionary events that gave rise to the diverse species of the genus Homo are represented by a rooted hybridization subnetwork.
Figure 10.

Inferences drawn with regard to the modes of evolution of the group of hominin species covering the period Late Miocene to the Holocene
Reproduced from Caparros and Prat (2021) Figure 4.
Numerous paleogenomics studies have shown that hybridization by means of gene exchanges between divergent taxonomic groups might be the rule rather than the exception in human evolution, particularly as it relates to the origin of Homo sapiens (Ackermann et al., 2016). Furthermore, interbreeding with parental back crossing between individuals of genetically differentiated but not too distant taxa, a process known as introgressive hybridization, may be the principal cause of the appearance of phenotypic novelties and the evolutionary emergence of new species (Arnold, 1992, 1997). Thus, the web-like hybridization subnetwork in Figure 10 may be interpreted most probably as events of multiple introgressive speciations that led to the emergence of the only surviving extant species, Homo sapiens. We hope that our present protocol will be of help to further research in the study of reticulate human evolution.
Limitations
Our protocol relying on phenotypic features represents a first attempt in the study of human evolution to combine a tree-based Maximum Parsimony phylogenetic reconstruction method with a Phylogenetic Networks approach. The interpretation of the resulting most parsimonious tree scenario and phylogenetic network may be subject to debate if one is to argue with the quality of the initial Data S1. To carry out the study in Caparros and Prat (2021), we selected among already published large data sets of craniodental morphological features, the one which in our opinion as of today is the most comprehensive, and was analyzed using Bayesian phylogenetic methods (Dembo et al., 2016). These authors compiled a supermatrix of 391 morphological characters from craniodental matrices used in 14 previous studies, and made some alterations to a mix of trait observations as described in their publication. It is clear that this data set has a high information content across parsimony character types as reflected in Caparros and Prat (Caparros and Prat, 2021 - Table 1) where for the reweighed runs the tree RIs vary between 0.7936 and 0.8805, which translate into a very high apomorphous content. This is confirmed by the fact that the MPMAX scenario provided an unusually high number of 74 apomorphies which allowed to conduct effectively the intermediate tree-based MP analysis with Data S2 and the subsequent PN analysis with Data S3. The main limitation of the protocol therefore is the quality of the initial Data S1. Having tried the protocol with data sets of a recent publication, it becomes apparent that its applicability is hindered by the number of apomorphies that can be generated and the apomorphous content of the data set further to MP runs as explained in troubleshooting problem 5.
Troubleshooting
Problem 1
Since the bootstrap analysis is a random resampling method, it is not absolutely certain that the resulting majority-rule bootstrapping consensus tree will be exactly identical to the MP tree (single or consensus) obtained with the same settings, and various bootstrapping runs might generate slightly different results.
Potential solution 1
We suggest that the bootstrap analysis be rerun several times, with different number of replicates, to ascertain with a high degree of confidence the repeatability of the results as compared with the results of the MP analysis. In the eventuality of an extensive data set with a bootstrap simulation that might computationally be heavy and time constraining, we suggest to run a "Fast" stepwise-addition search instead of a heuristic search.
Problem 2
Oftentimes an MP run generates more than one parsimonious tree.
Potential solution 2
To analyze the significance of this run, one must rely on a consensus tree that graphically retains in a dichotomous manner the similar branches of the numerous most parsimonious trees representing monophyletic sister groups while showing distinct branches not in agreement as polytomous branches. Consensus trees summarize the concordance of trees of minimal length, and theoretically should not be interpreted as a phylogenetic scenario. In PAUP there are four types of consensus trees: Strict, Semistrict, Adams and Majority-rule as shown below. We recommend the use of the 50% majority rule consensus tree.

Problem 3
Some workers may object to the use of the tree RI to select the most parsimonious scenario.
Potential solution 3
If the tree RI is objectionable to select the most parsimonious scenario, which to our knowledge is without foundation, an alternative empirical approach is to implement a selection procedure that follows the scientific method advocated by Popper (1963) of falsification based on scrutiny of all the available evidence from the 16 scenarios. Such an approach, which might be subject to debate, would focus on identifying phylogenetic inconsistencies by blending low bootstrap support of tree scenarios with some paleoanthropological commonly accepted paradigms as conducted in Caparros and Prat (Caparros and Prat, 2021 - Table 2 and Transparent Methods 4. Criteria to select the most parsimonious tree). In Caparros and Prat (2021) the popperian approach yielded the same result for the selection of the most parsimonious scenario as the RI approach.
Problem 4
Further to a numerical PAUP run, some apomorphies and homoplasies may be subject to ambiguities regarding the possible assignment of character-state changes at some nodes of the MP tree.
Potential solution 4
Ambiguities may be resolved by a process of selective arguments, or as illustrated in Figure 4 by one commonly used optimization algorithm, such as ACCTRAN or DELTRAN (Agnarsson and Miller, 2008). The character state assignments to the internal nodes are provided in the "possible state assignments" option of the Describe Trees menu output of PAUP based on the chosen optimization algorithm (ACCTRAN or DELTRAN) used to resolve ambiguities and selected before the run. In MacClade, for unordered and ordered character types, the Trace menu allows also one to choose either DELTRAN or ACCTRAN as optimization option for ambiguous character state changes and to visualize the projection of the resolved state accordingly (Screenshot to resolve ambiguities, step 3cii in step-by-step method details). The ambiguity of the character at the level of H. antecessor shown in screenshot for trace show MPRs mode is resolved by DELTRAN.

Note: A word of caution is required given that ACCTRAN or DELTRAN may result in numerous equivocal resolutions when there is substantial amount of missing data, as illustrated for example in Figure S10 of Caparros and Prat (2021).
Problem 5
To conduct a proper Intermediate MP analysis, one way to measure the quality of an initial data set is to be able, in our opinion, to generate with Data S1 a most parsimonious tree RI after reweighing of at least 0.80, and to get after this first run a number of apomorphies of at least twice the number of terminal taxa. Short of these two hurdles, it is very probable that the resolution of the most parsimonious scenario will be suboptimal to conduct a significant PN analysis given the poor quality of the initial data set.
Potential solution 5
If the number of apomorphies to make up Data S2 generated from a most parsimonious run with Data S1 does not meet the above target, there is an alternative approach for the Intermediate tree-based MP analysis. It would consist, in addition to a limited number of apomorphies with ri = 1, to add to Data S2 a certain number of homoplasies from the output with character retention index threshold for example of at least ri = 0.75. To be able to execute a meaningful PN analysis, it is up to the researcher conducting the study to build a Data S2 composed of a limited number of apomorphies supplemented by informative homoplasies that eventually will hopefully provide some significant result as far as the tree RI of the intermediate tree-based MP analysis is concerned. Short of this, it is most likely that a PN analysis cannot be implemented.
Resource availability
Lead contact
Further information and requests for resources should be directed to and will be fulfilled by Miguel Caparros, capmig@aol.com.
Materials availability
No materials were newly generated for this paper.
Acknowledgments
We thank Mana Dembo and Arne Mooers for providing the workable Nexus file of the data set employed in the analyses of Caparros and Prat (2021), the findings of which are used as examples in the text. We thank Josephine Herbelin/atelier Nous Travaillons Ensemble for her help in the graphic design of Figure 22. We express our thanks to professor Pascal Tassy from the Muséum national d'Histoire naturelle for his teaching and numerous published works on cladistics which inspired our research in human Phylogenetic Systematics. We would also like to express our appreciation to the editor of iScience Dr. Alessio Bolognesi for his guidance during the review process of Caparros and Prat (2021). We thank Dr. Shawnna Buttery and her colleagues of STAR Protocols for guiding us through the editing and publishing process, and the three anonymous reviewers of the present paper for their comments, queries, and very helpful suggestions. S.P. is partly supported by Agence Nationale de la Recherche (France) ANR-17-CE27-0005. One of us (MC) would like to pay homage and express his thanks to the late professors Pierre Rosenstiehl and Gérard Worms who taught him the intricacies of operations research and graph theory during his years as undergraduate at HEC.
Author contributions
M.C. designed the protocol, conducted all analyses, and wrote the manuscript. M.C. and S.P. conceived the study, interpreted the results, and wrote the manuscript of Caparros and Prat (2021), which is used as an example.
Declaration of interests
The authors declare no competing interests.
Footnotes
Supplemental information can be found online at https://doi.org/10.1016/j.xpro.2022.101191.
Supplemental information
Data and code availability
The data supporting the findings of Caparros and Prat (2021), used as example in the text, are available as follows:
Fossil hypodigms, character matrix and nexus file of the original Data S1 (Dembo et al., 2016) are freely available at Dryad Digital Repository https://doi.org/10.5061/dryad.d7r4g.2. The nexus matrix file Data S1 is made available here. Characters, character definitions, and character states are available from Supplementary Material (Dembo et al., 2016) at https://doi.org/10.1016/j.jhevol.2016.04.008.
Data S2 and S3 generated and analyzed in the study are available here: Data S2 in NEXUS format represents the 74 apomorphous characters selected from the most parsimonious scenario MPMAX executed with Data S1, while Data S3 represents the multiple MP trees (MMPT) that result from the intermediate MP run based on Dollo type characters and uncertainty setting for multistate taxa executed with the 74 apomorphies of Data S2.
Code availability. All software packages used for the analyses are publicly available as follows:
PAUP http://phylosolutions.com/paup-test/, SplitsTree https://software-ab.informatik.uni-tuebingen.de/download/splitstree4/welcome.html
References
- Ackermann R.R., Mackay A., Arnold M.L. The hybrid origin of "modern humans. Evol. Biol. 2016;43:1–11. [Google Scholar]
- Agnarsson I., Miller J.A. Is ACCTRAN better tha DELTRAN. Cladistics. 2008;24:1–7. doi: 10.1111/j.1096-0031.2008.00229.x. [DOI] [PubMed] [Google Scholar]
- Anderberg A., Tehler A. Consensus trees, a necessity in taxonomic practice. Cladistics. 1990;6:399–402. doi: 10.1111/j.1096-0031.1990.tb00556.x. [DOI] [PubMed] [Google Scholar]
- Arnold M.L. Natural hybridization as an evolutionary process. Annu. Rev. Ecol. Syst. 1992;23:237–261. [Google Scholar]
- Arnold M.L. Oxford University Press; 1997. Natural Hybridization and Evolution. [Google Scholar]
- Camin J.H., Sokal R.R. A method for deducing branching sequences in phylogeny. Evolution. 1965;19:311–326. [Google Scholar]
- Caparros M. Muséum National d'Histoire Naturelle; 1997. Homo sapiens archaïques : un ou plusieurs taxons (espèces) ? Analyse cladistique et morphométrique. PhD dissertation. [Google Scholar]
- Caparros M., Prat S. A Phylogenetic Networks perspective on reticulate human evolution. iScience. 2021;24:102359. doi: 10.1016/j.isci.2021.102359. [DOI] [PMC free article] [PubMed] [Google Scholar]
- Cela-Conde C.J., Ayala F.J. Oxford University Press; 2007. Human Evolution. Trails from the Past. [Google Scholar]
- Collard M., Wood B.A. How reliable are human phylogenetic hypotheses? PNAS. 2000;97:5003–5006. doi: 10.1073/pnas.97.9.5003. [DOI] [PMC free article] [PubMed] [Google Scholar]
- Cummings M.P., Handley S., Myers S.D., Reed D., Rokas A., Winka K. Comparing bootstrap and posterior probability values in the four-taxon case. Syst. Biol. 2003;52:477–487. doi: 10.1080/10635150390218213. [DOI] [PubMed] [Google Scholar]
- Darlu P., Tassy P. Editions Matériologiques; 2019. La reconstruction phylogénétique: Concepts et méthodes. [Google Scholar]
- Dembo M., Radovčić D., Garvin H., Laird M., Schroeder L., Scott J., Brophy J., Ackermann R., Musiba C., de Ruiter D.J., et al. The evolutionary relationships and age of Homo naledi: an assessment using dated Bayesian phylogenetic methods. J. Hum. Evol. 2016;97:17–26. doi: 10.1016/j.jhevol.2016.04.008. [DOI] [PubMed] [Google Scholar]
- Efron B. Bootstrapping methods: another look at the jackknife. Ann. Stat. 1979;7:1–26. [Google Scholar]
- Farris J.S. A successive approximations approach to character weighting. Syst. Zool. 1969;18:374–385. [Google Scholar]
- Farris J.S. Methods for computing wagner. Trees. Syst. Zool. 1970;19:83–92. [Google Scholar]
- Farris J.S. Phylogenetic analysis under Dollo's law. Syst. Zool. 1977;26:77–88. [Google Scholar]
- Farris J.S. In: Advances in Cladistics 2: Proceedings of the Second Meeting of the Willi Hennig Society. Platnick N.I., Funk V.A., editors. Columbia University Press; 1983. The logical basis of phylogenetic analysis; pp. 7–36. [Google Scholar]
- Farris J.S. The retention index and the rescaled consistency index. Cladistics. 1989;5:417–419. doi: 10.1111/j.1096-0031.1989.tb00573.x. [DOI] [PubMed] [Google Scholar]
- Farris J.S. The retention index and homoplasy excess. Syst. Zool. 1989;38:406–407. [Google Scholar]
- Felsenstein J. Confidence limits on phylogenies: an approach using the bootstrap. Evolution. 1985;39:783–791. doi: 10.1111/j.1558-5646.1985.tb00420.x. [DOI] [PubMed] [Google Scholar]
- Fitch W.M. Toward defining the course of evolution: minimal change for a specific tree topology. Syst. Zool. 1971;20:406–416. [Google Scholar]
- Goloboff P.A. Estimating character weights during tree search. Cladistics. 1993;9:83–91. doi: 10.1111/j.1096-0031.1993.tb00209.x. [DOI] [PubMed] [Google Scholar]
- Goloboff P.A., Pol D. In: Parsimony, Phylogeny, and Genomics. Albert V.A., editor. Oxford University Press; 2005. Parsimony and Bayesian phylogenetics; pp. 148–159. [Google Scholar]
- Goloboff P.A., Carpenter J.M., Arias J.S., Esquivel D.R.M. Weighing against homoplasy improves phylogenetic analysis of morphological data sets. Cladistics. 2008;24:758–773. [Google Scholar]
- Hennig W. University of Illinois Press; 1966. Phylogenetic Systematics. Translated by D. Davis and R. Zangerl. [Google Scholar]
- Huson D.H., Bryant D. Application of phylogenetic networks in evolutionary studies. Mol. Biol. Evol. 2006;23:254–267. doi: 10.1093/molbev/msj030. [DOI] [PubMed] [Google Scholar]
- Huson D.H., Rupp R., Scornavacca C. Cambridge University Press; 2010. Phylogenetic Networks: Concepts, Algorithms and Applications. [Google Scholar]
- Kluge A. Sophisticated falsification and research cycles: consequences for differential character weighting in phylogenetic systematics. Zool. Scr. 1997;26:349–360. [Google Scholar]
- Kolaczkowski B., Thornton J.W. Performance of maximum parsimony and likelihood phylogenetics when evolution is heterogeneous. Nature. 2004;431:980–984. doi: 10.1038/nature02917. [DOI] [PubMed] [Google Scholar]
- Maddison D.R., Swofford D.L., Maddison W.P. NEXUS: an extensible file format for systematic information. Syst. Biol. 1997;46:590–621. doi: 10.1093/sysbio/46.4.590. [DOI] [PubMed] [Google Scholar]
- Maddison D.R., Maddison W.P. Sinauer Associates; 2005. MacClade Software V. 4.08a. [Google Scholar]
- Mayr E., Ashlock P.D. McGraw-Hil; 1991. Principle of Systematic Zoology. [Google Scholar]
- Morrison D.A. RJR Productions; 2011. An Introduction to Phylogenetic Networks. [Google Scholar]
- Mounier A., Caparros M. The phylogenetic status of Homo heidelbergensis - a cladistic study of middle pleistocene hominins. BMSAP. 2015;27:110–134. [Google Scholar]
- Mounier A., Balzeau A., Caparros M., Grimaud-Hervé D. Brain, calvarium, cladistics: a new approach to an old question, who are modern humans and Neandertals? J. Hum. Evol. 2016;92:22–36. doi: 10.1016/j.jhevol.2015.12.006. [DOI] [PubMed] [Google Scholar]
- Popper K. Routledge; 1963. Conjectures and Refutations: The Growth of Scientific Knowledge. [Google Scholar]
- Rohlf F.J., Sokal R.R. Comparing numerical taxonomic studies. Syst. Zool. 1981;30:459–490. [Google Scholar]
- Saitou N. In: Rao R., Chakraborty R., editors. Vol. 8. Elsevier; 1991. Statistical methods for phylogenetic tree reconstruction; pp. 317–346. (Handbook of Statistics). [Google Scholar]
- Simpson G.G. Columbia University Press; 1953. The Major Features of Evolution. [Google Scholar]
- Simpson G.G. Columbia University Press; 1961. Principles of Animal Taxonomy. [DOI] [PubMed] [Google Scholar]
- Sokal R.R., Rohlf F.J. W. H. Freeman and Company; 1995. Biometry. [Google Scholar]
- Sokal R.R., Sneath P.H.A. Freeman; 1963. Principles of Numerical Taxonomy. [Google Scholar]
- Soltis P.S., Soltis D.E. Applying the bootstrap in phylogeny reconstruction. Stat. Sci. 2003;18:256–267. [Google Scholar]
- Strait D.S., Grine F.E., Fleagle J.G. In: Handbook of Paleoanthropology. Henke W., Tattersall I., editors. Springer-Verlag; 2015. Analyzing hominin phylogeny: cladistic approach; pp. 1989–2014. [Google Scholar]
- Strait D.S., Grine F.E. Inferring hominoid and early hominid phylogeny using craniodental characters: the role of fossil taxa. J. Hum. Evol. 2004;47:399–452. doi: 10.1016/j.jhevol.2004.08.008. [DOI] [PubMed] [Google Scholar]
- Swofford D.L. 2020. Phylogenetic Analysis Using Parsimony (PAUP) Version 4.0a. [Google Scholar]
- Swofford D.L., Maddison W.P. Reconstructing ancestral character states under Wagner parsimony. Math. Biosci. 1987;87:199–229. [Google Scholar]
- Wiens J.J. Polymorphism in systematics and comparative biology. Ann. Rev. Ecol. Syst. 1999;30:327–362. [Google Scholar]
- Wright A.M., Hillis D.M. Bayesian analysis using a simple likelihood model outperforms parsimony for estimation of phylogeny from discrete morphological data. PLoS One. 2014;9:e109210. doi: 10.1371/journal.pone.0109210. [DOI] [PMC free article] [PubMed] [Google Scholar]
Associated Data
This section collects any data citations, data availability statements, or supplementary materials included in this article.
Supplementary Materials
Data Availability Statement
The data supporting the findings of Caparros and Prat (2021), used as example in the text, are available as follows:
Fossil hypodigms, character matrix and nexus file of the original Data S1 (Dembo et al., 2016) are freely available at Dryad Digital Repository https://doi.org/10.5061/dryad.d7r4g.2. The nexus matrix file Data S1 is made available here. Characters, character definitions, and character states are available from Supplementary Material (Dembo et al., 2016) at https://doi.org/10.1016/j.jhevol.2016.04.008.
Data S2 and S3 generated and analyzed in the study are available here: Data S2 in NEXUS format represents the 74 apomorphous characters selected from the most parsimonious scenario MPMAX executed with Data S1, while Data S3 represents the multiple MP trees (MMPT) that result from the intermediate MP run based on Dollo type characters and uncertainty setting for multistate taxa executed with the 74 apomorphies of Data S2.
Code availability. All software packages used for the analyses are publicly available as follows:
PAUP http://phylosolutions.com/paup-test/, SplitsTree https://software-ab.informatik.uni-tuebingen.de/download/splitstree4/welcome.html