

Abstract
The epidermis plays an indispensable barrier function in animals. Some species have evolved unique epidermal structures to adapt to different environments. Aquatic and semi‐aquatic mammals (cetaceans, manatees, and hippopotamus) are good models to study the evolution of epidermal structures because of their exceptionally thickened stratum spinosum, the lack of stratum granulosum, and the parakeratotic stratum corneum. This study aimed to analyze an upstream regulatory gene transient receptor potential cation channel, subfamily V, member 3 (TRPV3) of epidermal differentiation so as to explore the association between TRPV3 evolution and epidermal changes in mammals. Inactivating mutations were detected in almost all the aquatic cetaceans and several terrestrial mammals. Relaxed selective pressure was examined in the cetacean lineages with inactivated TRPV3, which might contribute to its exceptionally thickened stratum spinosum as the significant thickening of stratum spinosum in TRPV3 knock‐out mouse. However, functional TRPV3 may exist in several terrestrial mammals due to their strong purifying selection, although they have “inactivating mutations.” Further, for intact sequences, relaxed selective constraints on the TRPV3 gene were also detected in aquatic cetaceans, manatees, and semi‐aquatic hippopotamus. However, they had intact TRPV3, suggesting that the accumulation of inactivating mutations might have lagged behind the relaxed selective pressure. The results of this study revealed the decay of TRPV3 being the genomic trace of epidermal development in aquatic and semi‐aquatic mammals. They provided insights into convergently evolutionary changes of epidermal structures during the transition from the terrestrial to the aquatic environment.
Keywords: inactivating mutations, land‐to‐sea transition, epidermal structure, mammals, relaxed selective pressure, TRPV3
Inactivating mutations were detected in TRPV3 of almost all the aquatic cetaceans and several terrestrial mammals. The loss of TRPV3 may contribute to its exceptionally thickened stratum spinosum in the cetacean lineages. Relaxed selective constraints on TRPV3 gene were convergently detected in three clades (cetaceans, manatees, and hippopotamus) with similar epidermis structure, which may promote adaptation to the aquatic environment.

1. INTRODUCTION
The epidermis acts as a stable environmental barrier. In most mammals, the epidermis includes stratum basale, stratum spinosum, stratum granulosum, and stratum corneum (Simpson et al., 2011). It performs multiple protective functions in organisms, such as preventing water loss, excluding toxins, resisting mechanical stresses, and participating in immune responses. Multiple mammalian lineages have independently evolved specialized epidermal structures to adapt to different habitats. Terrestrial mammals generally evolved a hair coat to protect the skin from mechanical insults and facilitate homeothermy. Hence, the epidermis of these animals is fairly thin. As completely aquatic mammals, cetaceans have exceptionally thickened stratum spinosum that results in significantly increased thickness of the whole epidermis. However, they lack stratum granulosum and develop distinctive parakeratotic stratum corneum with flattened cells retaining pyknotic nuclei (Japha, 1905; Spearman, 1972). Similarly, a granular layer was not found in the fully aquatic manatee (Jarrett et al., 1965). The parakeratotic stratum corneum is rich in phospholipid in cetaceans and manatees, which probably helps waterproof the epidermis (Cane & Spearman, 1969; Spearman, 1970). Also, the thickening of the stratum spinosum enhances their immunity and wound‐healing ability (Simpson et al., 2011). For these aquatic mammals, the keratin layer is perhaps not needed for protection from the wound. In contrast, for the semi‐aquatic hippopotamus (Hippopotamus amphibius), the stratum granulosum is ill‐defined. Few cells contain the typical granules and are seldom densely packed (Luck & Wright, 1964), similar to that in cetaceans. Another semi‐aquatic marine carnivorans, pinnipeds, have dense coats and do not show parakeratosis (Sokolov, 1960). The epidermis structure of pinnipeds does not differ from that of land mammals, which is perhaps associated with the fact that they have to come ashore to mate, give birth, molt, or escape from predators. However, the molecular mechanisms underlying the evolutionary changes in the epidermal structure in different mammals have not been well addressed so far.
The TRP superfamily has more than 20 members in mammals, most of which are ion channels with temperature‐sensitive functions expressed on neurons being not associated with epidermal development (Saito and Shingai, 2006). However, the transient receptor potential cation channel, subfamily V, member 3 (TRPV3), is known to be highly expressed in keratinocytes (Chung et al., 2004; Peier et al., 2002; Xu et al., 2002). Actually, TRPV3 is not only a thermosensitive TRP channel but also related to epidermal development (Cheng et al., 2010). Humans with TRPV3 mutations had abnormal keratinization disease. For example, a mutation of TRPV3 or membrane‐bound transcription factor protease site 2 (MBTPS2) could lead to Olmsted syndrome, described by bilateral mutilating palmoplantar keratoderma (PPK) and periorificial keratotic plaques (Gatault et al., 2020). TRPV3 regulated by mutated MBTPS2 or directly mutated TRPV3 might function in a dominant‐positive manner to increase constitutive TRPV3 activity and elevate Ca2+ in keratinocytes, leading to severe keratoderma (Lin et al., 2012; Nemer et al., 2017). In addition, this gene could affect epidermal development by regulating the epidermal growth factor receptor (EGFR) signaling pathway (Cheng et al., 2010).
A total of 142 mammalian TRPV3 sequences were analyzed in this study to investigate the potential association between TRPV3 gene evolution and phenotypic changes in the epidermal structure. Inactivating mutations were found in cetaceans and relaxed selection pressure was detected in some species with the analogously specialized epidermis (including cetaceans, manatees, and hippopotamus) (Figure 1). These findings could provide some novel insights into the evolutionary mechanisms underlying the epidermis evolution of mammals.
FIGURE 1.

Inactivating mutations were detected in TRPV3 of almost all the cetaceans. Relaxed selective constraints on the TRPV3 gene were convergently detected in three clades (cetaceans, manatees, and hippopotamus) with similar epidermis structure, such as parakeratotic stratum corneum, loss of stratum granulosum, and thickened stratum spinosum. These results suggested that the decay of TRPV3 might be the genomic trace of epidermal structure changes in the land‐to‐sea transition of mammals
2. MATERIALS AND METHODS
2.1. Sequence mining and BLAST searches
The present study used 142 mammals (covering 4 superorders and 19 orders) with high‐quality genomes (Table S1). TRPV3‐coding DNA sequences (CDS) from National Center for Biotechnology Information (NCBI, https://www.ncbi.nlm.nih.gov/) for five representative species with annotated genomes, that is, human (Homo sapiens), mouse (Mus musculus), cow (Bos taurus), nine‐banded armadillo (Dasypus novemcinctus), and African elephant (Loxodonta africana), were first extracted. About 50‐bp flanking sequences of each exon from these species were used as reference sequences to BLAST against other mammals. The longest predicted version from the NCBI database was downloaded for species with low‐quality sequences from local BLAST. In addition, the TRPV3 sequence of the bowhead whale (Balaena mysticetus) was downloaded from http://www.bowhead‐whale.org/. The sequences were aligned in MEGA7 with the MUSCLE (Edgar, 2004) plug‐in and minor adjustments by eye.
2.2. Identification of inactivating mutations
The existence of inactivation mutations was an interesting discovery during the comparative analysis of the sequences. TRPV3 sequences of 142 mammals were inspected for inactivating mutations, including mutation of initiation codons and stop codons, frameshift insertions and deletions, premature stop codons, splice site mutation of intron/exon boundary [GT/AG], and so forth. In addition, the ancestral sequences were reconstructed using PRANK (Löytynoja, 2014) with the “‐showanc” parameter to test the presence of inactivating mutations in the sequence of cetacean ancestors.
Moreover, putative inactivating mutations were further verified by raw sequencing reads using the method described in Jebb and Hiller (2018). Briefly, the scaffolds containing a mutation were extracted; these sequences were aligned against sequencing reads stored in Sequence Read Archive (SRA) (Kodama et al., 2012), which included skin transcriptomes data, resequencing data, and raw sequencing data. After downloading the SRA data using SRAtoolkit, the original data were converted into FASTQ format files using the fastq software with “‐split‐3” parameter. A library of scaffolds with inactivated mutations and map reads was constructed using the Burrows–Wheeler Alignment Tool (BWA) (Li, 2013). The Samtools software was used to obtain the file in BAM format (Li et al., 2009). Finally, IGV software was used for sequence alignment visualization (Thorvaldsdóttir et al., 2013).
These inactivating mutations were further confirmed by polymerase chain reaction (PCR) amplification. Three types of mutations, including splice sites mutation, premature stop codons, and deletions, were separately amplified in three representative species of cetaceans, that is, baiji (Lipotes vexillifer, AG‐AA), common minke whale (B. acutorostrata, AAA‐TAA), and Yangtze finless porpoise (Neophocaena asiaeorientalis, 6‐bp deletion). Genomic DNA extraction, PCR amplification, and sequencing were conducted as described by S. Xu et al. (2012). The primers are listed in Table S2.
2.3. Phylogenetic analysis
A supermatrix approach was used by IQ‐TREE for the maximum‐likelihood (ML) tree inference of TRPV3 (Nguyen et al., 2015). The ‐m MFP option that could cause the ModelFinder program to select the best model was used (Kalyaanamoorthy et al., 2017). Bootstrap analyses with 1000 pseudo‐replicates were conducted. All other options were set to their default values in IQ‐TREE.
2.4. Selection analyses
The nonsynonymous (d N)/synonymous substitution (d S) rate (ω = d N/d S) was used to evaluate the selective pressure, with values of ω > 1, =1, and <1 indicating positive, neutral, and purifying selection, respectively. The ω values were calculated using the codon‐based ML models implemented in the CODEML program of PAML 4.9e (Yang, 2007). The well‐acknowledged phylogenetic tree was downloaded from http://www.timetree.org/ as an input tree for PAML analysis.
The free‐ratio model that assumed an independent ω for each branch was compared with the null one‐ratio model that allowed the same ω for all branches to evaluate the selective pressure in different branches with intact TRPV3. The likelihood ratio test statistic approximated to a chi‐square distribution and was used to compare nested likelihood models. The average ω of each order or superorder was calculated according to the result of the free‐ratio model.
The branch model implemented in CODEML was used to test whether TRPV3 was under relaxed selective pressure in species with inactivating mutations. Two different datasets were used in the study. All species with intact TRPV3 but without specialization of the epidermal structure were included in both datasets: Dataset I including additional 12 cetaceans with inactivating mutations and dataset Ⅱ consisting of additional 6 terrestrial mammals with inactivating mutations. Further, the relaxed selection was also detected using the program RELAX (Wertheim et al., 2015), which computed the values and distribution of three ω using a branch‐site model, the convergence of the three ω values toward one in a lineage being a signature of relaxed purifying selection. The magnitude of convergence depended on a parameter K, which tended to zero as the selection tended to be completely relaxed.
2.5. Time estimations for gene inactivation
The method described by Chou et al. (2002) and Mu et al. (2021) was used to estimate when TRPV3 was inactivated in lineages of cetaceans. This method presumed that the branches along which the genes became pseudogenes went through two periods. The gene that evolved under selective pressure (ωs ) was similar to that in other species until it was inactivated. Then, this gene was presumed to accumulate both nonsynonymous and synonymous mutations at an equal rate (ωn = 1). Thus, the following equations were used:
to calculate the Tn value, where T is the time since the split from the last common ancestor. The lower and upper bounds of the confidence interval for the species divergence time T were obtained from http://www.timetree.org/. The ωa value was assessed for the entire branch.
3. RESULTS
3.1. Sequence alignment and phylogenetic analysis
A total of 131 species examined in this study possessed complete TRPV3 CDS and 11 species with incomplete sequences, but more than or approximately equal to 90% of CDS, except for the naked mole‐rat (Heterocephalus glaber) having 78% of CDS (Table S3). However, not all complete genes were intact; inactivating mutations were detected in most lineages of cetaceans and several terrestrial lineages. A phylogenetic tree of the TRPV3 gene was reconstructed, with 78% of nodes having bootstrap values >0.70 (Figure 2). Almost all orders and superorders (Laurasiatheria, Euarchontoglires, Xenarthra, and Afrotheria) were consistent with the widely recognized phylogenetic tree, except for Afrosoricida (Figure 2). However, the phylogenetic relationship within several orders differed from the well‐accepted tree. For example, Scandentia was sister to the Primates + Dermoptera clade in the recognized phylogenetic tree but formed a sister group with the clade including Rodentia and Lagomorpha in the gene tree. Carnivora, Pholidota, and Eulipotyphla were clustered forming a clade, but the recognized tree was not.
FIGURE 2.

Phylogenetic tree of TRPV3. Using 142 mammalian TRPV3 coding sequences as materials, the phylogenetic tree was reconstructed by the maximum‐likelihood (ML) method using IQ‐TREE. Inconsistencies were found in the clades highlighted in brown when comparing the species tree. The bootstrap values of 78% of nodes were >0.70, which suggested that the TRPV3 gene tree was well supported
3.2. Inactivating mutations
Inactivating mutations were identified in 18 species after assessing reliability by matching with available sequencing reads (Sharma et al., 2020) and further PCR (Figure 3 and Table S4). Premature stop codons were detected in eight baleen whales (fin whale Balaenoptera physalus, common minke whale, Antarctic minke whale B. bonaerensis, blue whale B. musculus, bowhead whale Balaena mysticetus, gray whale Eschrichtius robustus, North Pacific right whale Eubalaena japonica, and humpback whale Megaptera novaeangliae), with one premature stop codon sheared among these species. Through ancestral sequences reconstruction, TRPV3 was found to be lost in the lineage of crown Mysticeti due to the shared premature stop codon. The initial codon mutation was detected in the blue whale (n. ATG → ATA, p. M → I) and Indus River dolphin (Platanista minor, n. ATG → GTG, p. M → V). Splice site mutations were found in three toothed whales (sowerby's beaked whale Mesoplodon bidens, cuvier's beaked whale Ziphius cavirostris, and baiji). No inactivating mutation was found in the most recent common ancestor of all cetaceans. Moreover, 3‐ and 6‐bp deletions were found to be shared by 11 toothed whales (Figure 3). The inactivating mutations of baiji and common minke whale and the deletions of the Yangtze finless porpoise TRPV3 gene were verified using PCR. Splice site mutations were found in five terrestrial species (sheep Ovis aries, bighorn sheep O. canadensis, American beaver Castor canadensis, sunda flying lemur Galeopterus variegatus, and lesser Egyptian jerboa Jaculus jaculus), and frameshift indels were detected in wild Bactrian camel (Camelus ferus). For 11 incomplete TRPV3 sequences, no signal of pseudogenization was detected.
FIGURE 3.

Inactivating mutations of TRPV3 in multiple mammalian lineages. Left: Phylogeny of 142 placental mammals, in which red font represents species with inactivating mutations and under the relaxed selection pressure of TRPV3, while blue font represents species with inactivating mutations but not under the relaxed selection pressure of TRPV3. The red solid circle represents species (cetaceans, manatees, and hippopotamus) under the relaxed selection pressure of TRPV3 in the placental mammal range. Right: The intact TRPV3 gene model is visualized at the top, superimposed with multiple specific inactivated mutations. Different colors represent different types of mutations. The inactivating mutations were validated by SRA reads and PCR amplification reaction. The alignments of reads are highlighted with gray background, and each inactivating mutation corresponds to a serial number. Sequences in red font represent the mutated sites, while sequences in blue font represent the sequences of humans used as a reference. Notably, the deletions of 3 and 6 bp cover 11 toothed whales, including common bottlenose dolphin Tursiops truncates, Indo‐Pacific bottlenose dolphin Tursiops aduncus, Indo‐Pacific humpback dolphin Sousa chinensis, Pacific white‐sided dolphin Lagenorhynchus obliquidens, long‐finned pilot whale Globicephala melas, killer whale Orcinus orca, harbor porpoise Phocoena phocoena, vaquita Phocoena sinus, Yangtze finless porpoise, beluga whale Delphinapterus leucas, and narwhal Monodon monoceros
3.3. Selective pressure detection on TRPV3
The one‐ratio model revealed that the ω of mammals with intact TRPV3 sequences was 0.07188. The likelihood ratio tests suggested that the free‐ratio model was better than the one‐ratio model (p < .001). The most average ω of order or superorder was below 0.1 or around 0.1 (Figure 4a). Interestingly, only the ω for Cetacea significantly increased (ω = .47); particularly, the ω of some whales was close to 1. This result suggested that selective pressure was relaxed in cetacean lineages, although they had an intact TRPV3.
FIGURE 4.
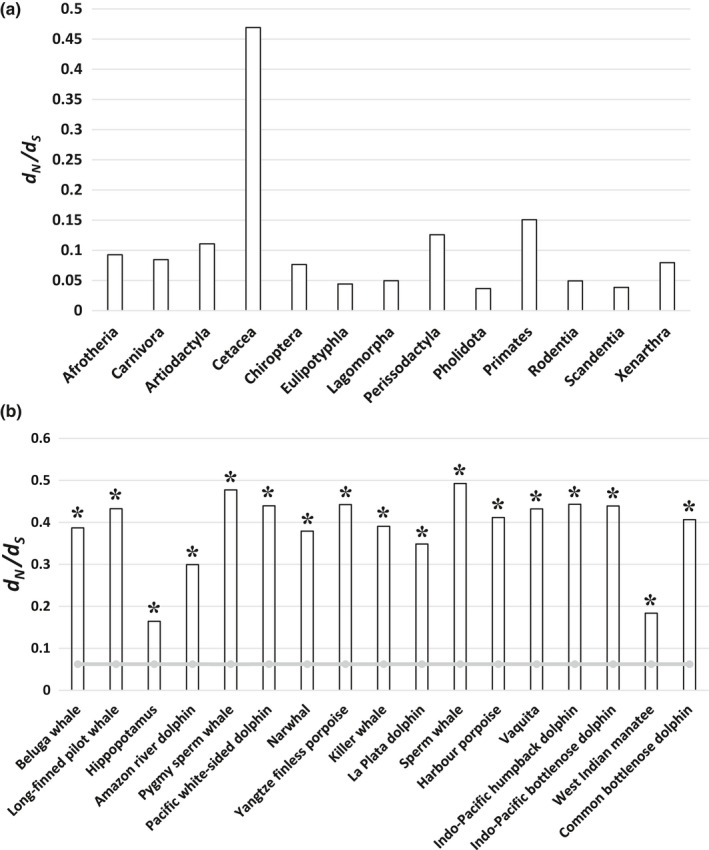
Results of the selection test. (a) Average evolution rate value (ω) of each branch in mammals. The y‐coordinate represents the value of ω. All ω values of order or superorder are averagely below 0.1 or around 0.1, except the ω of Cetacea near 0.5. Clearly, the amino acid substitution rate in cetaceans was much higher than that in other mammalian groups, suggesting the relaxed selection pressure of cetaceans. (b) Evolution rate value (ω) of species with intact TRPV3 but changed epidermal structure. The y‐coordinate represents the value of ω. The ω of terrestrial mammals (background species) is represented by a gray curve. The ω of species with intact TRPV3 but changed epidermal structure (tested species) is represented by a column. The asterisk represents a significantly improved ω value for the tested species compared with the ω of background species. This indicated that some aquatic or semi‐aquatic mammals (cetaceans, manatees, and hippopotamus) were under relaxed selection pressure, although their sequences of TRPV3 were intact
Relaxed selective pressure was further detected in cetacean lineages with inactivating mutations (Table 1). In dataset I, the average ω across the tree was estimated to be 0.06834 in Model A, assuming that all branches had the same ω, which was significantly <1 (Model B), indicating strong purifying selection on TRPV3 (p = 0; Table 1). Model C that allowed cetacean lineages with pseudogenized TRPV3 having ω2 (ω2 = 0.25874), whereas others had ω1 (ω1 = 0.06586), was used to test the presence of relaxed selective pressure on the pseudogenized cetacean branches, which fit the data significantly better than Model A (p = 2.55e−15, Table 1). Next, Model C and Model D were compared, in which the pseudogenized branches were fixed at ω2 = 1. The result showed that the selective pressure on TRPV3 was not completely relaxed in 12 pseudogenized cetaceans (p = 1.10e−14 in Model C vs D). Finally, Model E, which allowed different branches to have their own ω, significantly fitted the data compared with Model C (p = 0 in Model C vs E), indicating a divergence in the selective pressure across the tree. The relaxed selective pressure on cetacean pseudogenized lineages was further corroborated by the results of RELAX when cetaceans with inactivating mutations were used as test branches (K = 0.28, p < .0001, Figure S1). However, in dataset Ⅱ, relaxed selection pressure was not detected in six terrestrial mammals with inactivating mutations using PAML (ω1 = 0.06238, ω2 = 0.05961 in Model C, p = 7.71e−01) and RELAX (Figure S1).
TABLE 1.
Likelihood ratio test of selection on the TRPV3 gene with inactivating mutations
| Models | ω (d N/d S) | lnL a | np b | Models compared | 2Δ (ln L) c | p value | |
|---|---|---|---|---|---|---|---|
| Dataset I: | 119 sequences (107 background species d plus 12 cetaceans with inactivating mutations) | ||||||
| All branches have one ω (A) | 0.06834 | –39769.38 | 238 | ||||
| All branches have one ω = 1 (B) | 1 | –45248.02 | 237 | B vs. A | 10957.28 | 0 | |
| Branches with pseudogenized TRPV3 have ω2; others have ω1 (C) |
ω1 = 0.06586 ω2 = 0.25874 |
–39738.10 | 239 | A vs. C | 62.56 | 2.55E−15 | |
| Branches with pseudogenized TRPV3 have ω2 = 1; others have ω1 (D) |
ω1 = 0.06584 ω2 = 1 |
–39767.96 | 238 | D vs. C | 59.72 | 1.10E−14 | |
| Each branch has its own ω (E) | Variable ω by branch | –39473.34 | 473 | C vs. E | 529.52 | 0 | |
| Dataset II: | 113 sequences (107 background species and 6 terrestrial mammals with inactivating mutations) | ||||||
| All branches have one ω (A) | 0.06227 | –39175.69 | 226 | ||||
| All branches have one ω = 1 (B) | 1 | –44932.98 | 225 | B vs. A | 11514.58 | 0 | |
| Branches with pseudogenized TRPV3 have ω2; others have ω1 (C) |
ω1 = 0.06238 ω2 = 0.05961 |
–39175.65 | 227 | A vs. C | 0.08 | 7.71E−01 | |
| Branches with pseudogenized TRPV3 have ω2 = 1; others have ω1 (D) |
ω1 = 0.06179 ω2 = 1 |
–39383.37 | 226 | D vs. C | 415.44 | 0 | |
| Each branch has its own ω (E) | Variable ω by branch | –38990.45 | 449 | C vs. E | 370.40 | 0 | |
The natural logarithm of the likelihood value.
Number of parameters.
Twice the difference in lnL between the two models compared.
107 background branches including species with intact TRPV3 but without specialization of epidermal structures.
Finally, the selective pressure in three clades (cetaceans, hippopotamus, and manatees) with intact TRPV3 that shared similar changes in the epidermal structure was detected. The result showed that all three clades had significantly higher ω value, suggesting the relaxation of selective constraints in the three clades (Figures 3 and 4b). Also, the RELAX analysis showed that lineages of cetaceans (K = 0.24, p < .0001), hippopotamus (K = 0.56, p < .0001), and manatees (K = 0.55, p < .0001) were under relaxed selection relative to reference lineages (species without inactivating mutations or specialized epidermal structures) after comparing the alternative model with the null model (Figure S1).
3.4. TRPV3 inactivation date
It was estimated that the TRPV3 gene was inactivated 5.4–4.2 million years ago (Ma) in the baiji and 9.6–8.0 Ma in the Indus River dolphin. The mean estimate for the inactivating time of TRPV3 on the beaked whale clade was 8.0–6.6 Ma. For baleen whales (Mysticeti), the inactivation on the ancestral lineage dated from 34 to 25.9 Ma according to the TimeTree website.
4. DISCUSSION
The skin is the first barrier in mammals. Phenotypic changes in the skin have been found in lineages inhabiting different habitats. For an extreme example, aquatic or semi‐aquatic mammals have evolved extremely thickened skin to deal with the complicated external environment. This study found that the TRPV3 gene, which was related to the regulation of epidermal development, was inactivated in multiple lineages of mammals and was under relaxed selective pressure in all aquatic or semi‐aquatic mammals. In contrast, it was under purifying selection in other groups of terrestrial mammals. Signals of evolution analysis were reflected in species with specialized epidermal structures rather than in other phenotypes, such as temperature sensing of the nervous system. The molecular decay of TRPV3, therefore, could be regarded as the genomic trace corresponding to the epidermis structure evolution. Although some terrestrial mammals, such as elephants and pangolins, also have thicker skin structures, their thick epidermis is due to the thickening of the stratum corneum. Consistently, no similar molecular bases were found between them and cetaceans, at least in TRPV3.
4.1. Association between inactivated TRPV3 and epidermal specialization in cetaceans
Previous anatomical studies suggested that cetaceans evolved the exceptionally thickened stratum spinosum, the lack of stratum granulosum, and the parakeratotic stratum corneum to adapt to a completely aquatic environment (Reeb et al., 2007; Spearman, 1972; Springer et al., 2021). This study found that the TRPV3 gene was inactivated in almost all the cetaceans, including baleen whales and several toothed whales. Cetacean TRPV3 genes were detected to have higher ω values, suggesting a relaxed selective pressure. TRPV3 participates in keratinocyte differentiation by forming a signaling complex with TGF‐a/EGFR (Cheng et al., 2010), which is known to have at least two distinct functions in the epidermis: promoting keratinocyte proliferation in the basal layer (Schneider et al., 2008) and promoting late terminal differentiation in suprabasal cells (Ballarò et al., 2005; Wakita & Takigawa, 1999). TRPV3 knock‐out mice exhibited a significant increase in the thickness of the stratum spinosum, and defective stratum granulosum and stratum corneum (Cheng et al., 2010), which perfectly matched with the epidermal phenotype of cetaceans. Therefore, the present finding of molecular decay in TRPV3 might contribute to the specialization of epidermal structures in cetaceans in response to the completely aquatic environment. The cost of the functional loss of sensing warm temperatures of TRPV3 could be compensated by other genes such as TRPV4. After all, a phenotype is usually not determined by a single gene.
4.2. Convergence in relaxed selection pressure of TRPV3 in different aquatic or semi‐aquatic mammals
During the mammalian evolution, several deeply diverged lineages, such as cetaceans, manatees, and hippopotamus, independently returned to the aquatic environment. These lineages have convergent increased thickness of stratum spinosum to cope with increased difficulties in wound healing and different pathogenic environments. In addition, stratum granulosum was lost in cetaceans and manatees and ill‐defined in hippopotamus (Jarrett et al., 1965; Luck & Wright, 1964; Spearman, 1972). Further, a distinctive parakeratotic stratum corneum with flattened cells was found in cetaceans, providing protection from water penetration.
The results of this study revealed that TRPV3 was inactivated in almost all the cetaceans, whereas it was intact in manatees and hippopotamuses. However, all three clades revealed relaxed selection pressure in this gene. In the cases of manatees and hippopotamuses, the accumulation of inactivating mutations might have lagged behind the relaxed selective pressure. This was similar to MC5R, a gene regulating the development of sebaceous glands, which was intact but under relaxed selection pressure in the hippopotamus and naked mole‐rat (Heterocephalus glaber). However, the relaxed selection pressure on MC5R was interpreted as a proxy for the loss of sebaceous glands in both species (Springer & Gatesy, 2018). The molecular convergence in the relaxed selection on TRPV3 in different aquatic or semi‐aquatic mammals suggested that they might have evolved similar mechanisms driving the independent specialization of the epidermal structure in different mammalian lineages.
4.3. Functional adaptation of terrestrial mammals with inactivated TRPV3
During the mammalian evolution, inactivated mutations in TRPV3 were also examined in six terrestrial mammals. However, selective pressure was not relaxed in these six lineages. In humans, splice site mutations could cause some genetic diseases, suggesting that this mutation pattern could result in functional changes (López‐Bigas et al., 2005). Thus, a splicing site mutation shared by sheep and bighorn sheep might be related to the incomplete cytolysis in the horny layers (Jarrett et al., 1965) and result in the epidermis only two or three cells thick (Lyne, 1957; Parakkal et al., 1962). Moreover, in both species, wool probably provided better protection against the cold than the normal skin of animals living at high altitudes. In American beavers, the splice site mutation of TRPV3 might be associated with their scaly stratum corneum in the tail (Jenkins, & Busher, 1979). In addition, inactivating mutations were identified in the sequences of the lesser Egyptian jerboa (splice site mutation), sunda flying lemur (splice site mutation), and wild Bactrian camel (1‐bp insertion), all of which inhabited hot stressful environments. These mutations might be related to the tolerance against high temperatures because of the thermosensation function of TRPV3 (Moqrich et al., 2005; Saito et al., 2011).
5. CONCLUSIONS
In this study, a comprehensive comparative analysis of mammalian TRPV3 gene evolution was conducted, and its association with the diversity of epidermal developments in mammals was highlighted. Inactivated mutations and relaxed selective pressure on TRPV3 were examined in almost all the cetacean lineages, which might contribute to its exceptionally thickened stratum spinosum in response to the completely aquatic environment. Relaxed selective pressure was also detected in aquatic manatees and semi‐aquatic hippopotamuses, although both clades had intact TRPV3. Therefore, a similar mechanism driving the independent specialization of the epidermal structure in the three clades to adapt to the aquatic environment was suggested. The study added TRPV3 to the epidermal specialization‐related gene pool and provided some new insights into mammalian epidermal evolution. The findings will be verified in the future.
CONFLICT OF INTEREST
The authors declare no conflicts of interest.
AUTHOR CONTRIBUTIONS
Tianzhen Wu: Conceptualization (equal); Data curation (lead); Formal analysis (lead); Investigation (lead); Validation (lead); Visualization (lead); Writing – original draft (lead). Luoying Deme: Validation (equal). Zhenhua Zhang: Validation (equal). Xin Huang: Formal analysis (equal). Shixia Xu: Conceptualization (equal); Formal analysis (equal); Project administration (equal); Writing – review & editing (equal). Guang Yang: Conceptualization (equal); Data curation (equal); Formal analysis (equal); Funding acquisition (equal); Project administration (equal); Writing – review & editing (equal).
Supporting information
Appendix S1
ACKNOWLEDGMENTS
The authors thank members of the Jiangsu Key Laboratory for Biodiversity and Biotechnology, Nanjing Normal University, for their contributions to this manuscript. They also thank Dr. Ran Tian, Dr. Simin Chai, Dr. Na Liang, Dr. Zhenpeng Yu, and Dr. Daiqing Yin for helpful discussion. Many thanks to Xu Zhou and Xing Liu for their literature assistance and important advice. Special thanks to Dr. Weijian Guo and Fangfang Yu for technical support. Thanks to the reviewers for valuable comments. Thanks to MJEditor (www.mjeditor.com) for linguistic assistance.
Wu, T. , Deme, L. , Zhang, Z. , Huang, X. , Xu, S. , & Yang, G. (2022). Decay of TRPV3 as the genomic trace of epidermal structure changes in the land‐to‐sea transition of mammals. Ecology and Evolution, 12, e8731. 10.1002/ece3.8731
Funding information
This study was supported by the National Natural Science Foundation of China (grant nos. 32030011, 31630071, 32070409, 31772448, and 31900321), the National Key Programme of Research and Development, Ministry of Science and Technology of China (grant no. 2016YFC0503200), the Qing Lan Project of Jiangsu Province, and the Priority Academic Program Development of Jiangsu Higher Education Institutions.
Contributor Information
Shixia Xu, Email: xushixia78@163.com.
Guang Yang, Email: gyang@njnu.edu.cn.
DATA AVAILABILITY STATEMENT
All data supporting this study are provided as Appendix S1 accompanying this manuscript.
REFERENCES
- Ballarò, C. , Ceccarelli, S. , Tiveron, C. , Tatangelo, L. , Salvatore, A. M. , Segatto, O. , & Alemà, S. (2005). Targeted expression of RALT in mouse skin inhibits epidermal growth factor receptor signalling and generates a Waved‐like phenotype. EMBO Reports, 6(8), 755–761. 10.1038/sj.embor.7400458 [DOI] [PMC free article] [PubMed] [Google Scholar]
- Cane, A. , & Spearman, R. (1969). The keratinized epithelium of the house‐mouse (Mus musculus) tongue: Its structure and histochemistry. Archives of Oral Biology, 14(7), 829–841. 10.1016/0003-9969(69)90173-3 [DOI] [PubMed] [Google Scholar]
- Cheng, X. , Jin, J. , Hu, L. , Shen, D. , Dong, X.‐P. , Samie, M. A. , Knoff, J. , Eisinger, B. , Liu, M.‐L. , Huang, S. M. , Caterina, M. J. , Dempsey, P. , Michael, L. E. , Dlugosz, A. A. , Andrews, N. C. , Clapham, D. E. , & Xu, H. (2010). TRP channel regulates EGFR signaling in hair morphogenesis and skin barrier formation. Cell, 141(2), 331–343. 10.1016/j.cell.2010.03.013 [DOI] [PMC free article] [PubMed] [Google Scholar]
- Chou, H.‐H. , Hayakawa, T. , Diaz, S. , Krings, M. , Indriati, E. , Leakey, M. , Paabo, S. , Satta, Y. , Takahata, N. , & Varki, A. (2002). Inactivation of CMP‐N‐acetylneuraminic acid hydroxylase occurred prior to brain expansion during human evolution. Proceedings of the National Academy of Sciences, 99(18), 11736–11741. 10.1073/pnas.182257399 [DOI] [PMC free article] [PubMed] [Google Scholar]
- Chung, M.‐K. , Lee, H. , Mizuno, A. , Suzuki, M. , & Caterina, M. J. (2004). TRPV3 and TRPV4 mediate warmth‐evoked currents in primary mouse keratinocytes. Journal of Biological Chemistry, 279(20), 21569–21575. 10.1074/jbc.M401872200 [DOI] [PubMed] [Google Scholar]
- Edgar, R. C. (2004). MUSCLE: A multiple sequence alignment method with reduced time and space complexity. BMC Bioinformatics, 5(1), 1–19. 10.1186/1471-2105-5-113 [DOI] [PMC free article] [PubMed] [Google Scholar]
- Gatault, S. , Kirby, B. , & Danso‐Abeam, D. (2020). Comment on “Olmsted syndrome”. Case Reports in Dermatological Medicine, 2020, 1–2. 10.1155/2020/8024981 [DOI] [PMC free article] [PubMed] [Google Scholar]
- Japha, A. (1905). Über den Bau der Haut des Seihwales (Balaenoptera borealis Lesson). 29(14), 442–445. Zoologischer Anzeiger. [Google Scholar]
- Jarrett, A. , Spearman, R. , Riley, P. , & Cane, A. (1965). The distribution of epidermal phospholipids and their relation to the alkaline phosphate activity of the granular layer. Journal of Investigative Dermatology, 44(5), 311–319. 10.1038/jid.1965.55 [DOI] [PubMed] [Google Scholar]
- Jebb, D. , & Hiller, M. (2018). Recurrent loss of HMGCS2 shows that ketogenesis is not essential for the evolution of large mammalian brains. Elife, 7, e38906. 10.7554/eLife.38906 [DOI] [PMC free article] [PubMed] [Google Scholar]
- Jenkins, S. H. , & Busher, P. E. (1979). Castor canadensis. Mammalian Species, 120, 1–8. 10.2307/3503787 [DOI] [Google Scholar]
- Kalyaanamoorthy, S. , Minh, B. Q. , Wong, T. K. , Von Haeseler, A. , & Jermiin, L. S. (2017). ModelFinder: Fast model selection for accurate phylogenetic estimates. Nature Methods, 14(6), 587–589. 10.1038/nmeth.4285 [DOI] [PMC free article] [PubMed] [Google Scholar]
- Kodama, Y. , Shumway, M. , & Leinonen, R. (2012). The sequence read archive: Explosive growth of sequencing data. Nucleic Acids Research, 40(D1), D54–D56. 10.1093/nar/gkr854 [DOI] [PMC free article] [PubMed] [Google Scholar]
- Li, H. (2013). Aligning sequence reads, clone sequences and assembly contigs with BWA‐MEM. arXiv preprint arXiv:1303.3997. https://arxiv.org/abs/1303.3997v2 [Google Scholar]
- Li, H. , Handsaker, B. , Wysoker, A. , Fennell, T. , Ruan, J. , Homer, N. , Marth, G. , Abecasis, G. , & Durbin, R. (2009). The sequence alignment/map format and SAMtools. Bioinformatics, 25(16), 2078–2079. 10.1093/bioinformatics/btp352 [DOI] [PMC free article] [PubMed] [Google Scholar]
- Lin, Z. , Chen, Q. , Lee, M. , Cao, X. U. , Zhang, J. , Ma, D. , Chen, L. , Hu, X. , Wang, H. , Wang, X. , Zhang, P. , Liu, X. , Guan, L. , Tang, Y. , Yang, H. , Tu, P. , Bu, D. , Zhu, X. , Wang, K. W. , … Yang, Y. (2012). Exome sequencing reveals mutations in TRPV3 as a cause of Olmsted syndrome. The American Journal of Human Genetics, 90(3), 558–564. 10.1016/j.ajhg.2012.02.006 [DOI] [PMC free article] [PubMed] [Google Scholar]
- López‐Bigas, N. , Audit, B. , Ouzounis, C. , Parra, G. , & Guigó, R. (2005). Are splicing mutations the most frequent cause of hereditary disease? FEBS Letters, 579(9), 1900–1903. 10.1016/j.febslet.2005.02.047 [DOI] [PubMed] [Google Scholar]
- Löytynoja, A. (2014). Phylogeny‐aware alignment with PRANK. In Multiple sequence alignment methods (pp. 155–170). Springer. 10.1007/978-1-62703-646-7_10 [DOI] [PubMed] [Google Scholar]
- Luck, C. , & Wright, P. (1964). Aspects of the anatomy and physiology of the skin of the hippopotamus (H. amphibius). Quarterly Journal of Experimental Physiology and Cognate Medical Sciences: Translation and Integration, 49(1), 1–14. 10.1113/expphysiol.1964.sp001695 [DOI] [PubMed] [Google Scholar]
- Lyne, A. (1957). The development of the epidermis and hair canals in the merino sheep foetus. Australian Journal of Biological Sciences, 10(3), 390–397. 10.1071/BI9570390 [DOI] [Google Scholar]
- Moqrich, A. , Hwang, S. W. , Earley, T. J. , Petrus, M. J. , Murray, A. N. , Spencer, K. S. R. , Andahazy, M. , Story, G. M. , & Patapoutian, A. (2005). Impaired thermosensation in mice lacking TRPV3, a heat and camphor sensor in the skin. Science, 307(5714), 1468–1472. 10.1126/science.1108609 [DOI] [PubMed] [Google Scholar]
- Mu, Y. , Huang, X. , Liu, R. , Gai, Y. , Liang, N. , Yin, D. , & Yang, G. (2021). ACPT gene is inactivated in mammalian lineages that lack enamel or teeth. PeerJ, 9, e10219. 10.7717/peerj.10219 [DOI] [PMC free article] [PubMed] [Google Scholar]
- Nemer, G. , Safi, R. , Kreidieh, F. , Usta, J. , Bergqvist, C. , Ballout, F. , Btadini, W. , Hamzeh, N. , Abbas, O. , Kibbi, A. G. , Shimomura, Y. , & Kurban, M. (2017). Understanding the phenotypic similarities between IFAP and Olmsted syndrome from a molecular perspective: The interaction of MBTPS2 and TRPV3 . Archives of Dermatological Research, 309(8), 637–643. 10.1007/s00403-017-1762-z [DOI] [PubMed] [Google Scholar]
- Nguyen, L.‐T. , Schmidt, H. A. , Von Haeseler, A. , & Minh, B. Q. (2015). IQ‐TREE: A fast and effective stochastic algorithm for estimating maximum‐likelihood phylogenies. Molecular Biology and Evolution, 32(1), 268–274. 10.1093/molbev/msu300 [DOI] [PMC free article] [PubMed] [Google Scholar]
- Parakkal, P. , Montagna, W. , & Ellis, R. A. (1962). The skin of primates XI. The skin of the white‐browed gibbon (Hylobates Hoolock). The Anatomical Record, 143(2), 169–177. 10.1002/ar.1091430210 [DOI] [PubMed] [Google Scholar]
- Peier, A. M. , Reeve, A. J. , Andersson, D. A. , Moqrich, A. , Earley, T. J. , Hergarden, A. C. , Story, G. M. , Colley, S. , Hogenesch, J. B. , McIntyre, P. , Bevan, S. , & Patapoutian, A. (2002). A heat‐sensitive TRP channel expressed in keratinocytes. Science, 296(5575), 2046–2049. 10.1126/science.1073140 [DOI] [PubMed] [Google Scholar]
- Reeb, D. , Best, P. B. , & Kidson, S. H. (2007). Structure of the integument of southern right whales, Eubalaena australis. The Anatomical Record: Advances in Integrative Anatomy and Evolutionary Biology, 290(6), 596–613. 10.1002/ar.20535 [DOI] [PubMed] [Google Scholar]
- Saito, S. , Fukuta, N. , Shingai, R. , & Tominaga, M. (2011). Evolution of vertebrate transient receptor potential vanilloid 3 channels: Opposite temperature sensitivity between mammals and western clawed frogs. PLoS Genetics, 7(4), e1002041. 10.1371/journal.pgen.1002041 [DOI] [PMC free article] [PubMed] [Google Scholar]
- Saito, S. , & Shingai, R. (2006). Evolution of thermotrp ion channel homologs in vertebrates. Physiological Genomics, 27(3), 219–230. 10.1152/physiolgenomics.00322.2005 [DOI] [PubMed] [Google Scholar]
- Schneider, M. R. , Werner, S. , Paus, R. , & Wolf, E. (2008). Beyond wavy hairs: The epidermal growth factor receptor and its ligands in skin biology and pathology. The American Journal of Pathology, 173(1), 14–24. 10.2353/ajpath.2008.070942 [DOI] [PMC free article] [PubMed] [Google Scholar]
- Sharma, V. , Hecker, N. , Walther, F. , Stuckas, H. , & Hiller, M. (2020). Convergent losses of TLR5 suggest altered extracellular flagellin detection in four mammalian lineages. Molecular Biology and Evolution, 37(7), 1847–1854. 10.1093/molbev/msaa058 [DOI] [PubMed] [Google Scholar]
- Simpson, C. L. , Patel, D. M. , & Green, K. J. (2011). Deconstructing the skin: Cytoarchitectural determinants of epidermal morphogenesis. Nature Reviews Molecular Cell Biology, 12(9), 565–580. 10.1038/nrm3175 [DOI] [PMC free article] [PubMed] [Google Scholar]
- Sokolov, W. (1960). The skin structure in Pinnipedia of the USSR fauna. Journal of Morphology, 107(3), 285–296. 10.1002/jmor.1051070304 [DOI] [Google Scholar]
- Spearman, R. (1970). Some light microscopical observations on the stratum corneum of the guinea‐pig, man and common seal. British Journal of Dermatology, 83(5), 582–590. 10.1111/j.1365-2133.1970.tb15745.x [DOI] [PubMed] [Google Scholar]
- Spearman, R. (1972). The epidermal stratum corneum of the whale. Journal of Anatomy, 113(Pt 3), 373. [PMC free article] [PubMed] [Google Scholar]
- Springer, M. S. , & Gatesy, J. (2018). Evolution of the MC5R gene in placental mammals with evidence for its inactivation in multiple lineages that lack sebaceous glands. Molecular Phylogenetics and Evolution, 120, 364–374. 10.1016/j.ympev.2017.12.010 [DOI] [PubMed] [Google Scholar]
- Springer, M. S. , Guerrero‐Juarez, C. F. , Huelsmann, M. , Collin, M. A. , Danil, K. , McGowen, M. R. , Oh, J. W. , Ramos, R. , Hiller, M. , Plikus, M. V. , & Gatesy, J. (2021). Genomic and anatomical comparisons of skin support independent adaptation to life in water by cetaceans and hippos. Current Biology, 31(10), 2124–2139. 10.1016/j.cub.2021.02.057 [DOI] [PMC free article] [PubMed] [Google Scholar]
- Thorvaldsdóttir, H. , Robinson, J. T. , & Mesirov, J. P. (2013). Integrative Genomics Viewer (IGV): High‐performance genomics data visualization and exploration. Briefings in Bioinformatics, 14(2), 178–192. 10.1093/bib/bbs017 [DOI] [PMC free article] [PubMed] [Google Scholar]
- Wakita, H. , & Takigawa, M. (1999). Activation of epidermal growth factor receptor promotes late terminal differentiation of cell‐matrix interaction‐disrupted keratinocytes. Journal of Biological Chemistry, 274(52), 37285–37291. 10.1074/jbc.274.52.37285 [DOI] [PubMed] [Google Scholar]
- Wertheim, J. O. , Murrell, B. , Smith, M. D. , Kosakovsky Pond, S. L. , & Scheffler, K. (2015). RELAX: detecting relaxed selection in a phylogenetic framework. Molecular Biology and Evolution, 32(3), 820–832. 10.1093/molbev/msu400 [DOI] [PMC free article] [PubMed] [Google Scholar]
- Xu, H. , Ramsey, I. S. , Kotecha, S. A. , Moran, M. M. , Chong, J. A. , Lawson, J. , & Xie, Y. (2002). TRPV3 is a calcium‐permeable temperature‐sensitive cation channel. Nature, 418(6894), 181–186. [DOI] [PubMed] [Google Scholar]
- Xu, S. , Chen, Y. , Cheng, Y. , Yang, D. , Zhou, X. , Xu, J. , Zhou, K. , & Yang, G. (2012). Positive selection at the ASPM gene coincides with brain size enlargements in cetaceans. Proceedings of the Royal Society B: Biological Sciences, 279(1746), 4433–4440. 10.1098/rspb.2012.1729 [DOI] [PMC free article] [PubMed] [Google Scholar]
- Yang, Z. (2007). PAML 4: phylogenetic analysis by maximum likelihood. Molecular Biology and Evolution, 24(8), 1586–1591. 10.1093/molbev/msm088 [DOI] [PubMed] [Google Scholar]
Associated Data
This section collects any data citations, data availability statements, or supplementary materials included in this article.
Supplementary Materials
Appendix S1
Data Availability Statement
All data supporting this study are provided as Appendix S1 accompanying this manuscript.