Abstract
Background/Aim: The aim of this study was to evaluate the mechanical performance and the effect on dose distribution and deliverability of volumetric modulated arc therapy (VMAT) plans for prostate cancer created with the commercial knowledge-based planning (KBP) system (RapidPlan™).
Materials and Methods: Three institutions, A, B, and C were enrolled in this study. Each institution established and trained a KBP model with their own cases. CT data and structures for 45 patients at institution B were utilized to validate the dose-volume parameters (D2(%), D95(%), and D98(%) for target, and V50(%), V75(%), and V90(%) for rectum and bladder), and the following mechanical performance parameters and gamma passing rates of each KBP model: leaf sequence variability (LSV), aperture area variability (AAV), total monitor unit (MU), modulation complexity score for VMAT (MCSv), MU/control point (CP), aperture area (AA)/CP, and MU×AA/CP.
Results: Significant differences (p<0.01) in dosimetric parameters such as D2 and D98 for target and V50, V75, and V90 for bladder were observed among the three institutions. The means and standard deviations of MCSv were 0.31±0.03, 0.29±0.02, and 0.32±0.03, and the angles of maximum and minimum MU×AA/CP were 269˚ and 13˚, 269˚ and 13˚, and 273˚ and 153˚ at institutions A, B, and C, respectively. The mean gamma passing rate (1%/1 mm.) was >95% for all cases in each institution. Dose distribution and mechanical performance significantly differed between the three models.
Conclusion: Each KBP model had different dose distributions and mechanical performance but could create an acceptable plan for deliverability regardless of mechanical performance.
Keywords: Knowledge-based planning, multi models, MCSv, RapidPlan
Volumetric modulated arc therapy (VMAT) is an intensity-modulated technique delivered with dynamic gantry motion, while varying multi leaf collimators (MLC), dose rates, and gantry speeds (1) and can be used to create a steep dose gradient and complement dose distribution (2). It utilizes inverse planning to improve target conformity and organ at risk (OAR) sparing (3) and has often been used for prostate and head and neck cancer (4,5). However, one of the disadvantages of VMAT is that the plan quality, such as target coverage and OAR sparing, depends on the planner’s skill and experience or institution’s plan policy during optimization (6,7).
VMAT plans require more complex parameters related to treatment equipment such as gantry, linear accelerator, and MLC than conformal plans; therefore, it is recommended that patient-specific quality assurance (QA) be performed prior to initiating treatment to ensure deliverability. Complexity is associated with gantry speed, MU and sequence and aperture of MLC, which we defined as mechanical performance. One of the complex plans includes high MU, variable gantry speed and sequence and small aperture of MLC. Nowadays, various metrics to quantify mechanical performance have been developed, and it has been reported that some metrics relate to deliverability and indicate the possibility of passing QA for delivered plans (1,8).
Knowledge-based planning (KBP) has an important role in standardizing plan quality. RapidPlan™ (Varian Medical Systems, Palo Alto, CA, USA) is a commercial KBP tool incorporated in the Eclipse treatment planning system. By learning the dosimetric and geometric information of the registered cases, RapidPlan™ predicts an achievable dose-volume histogram for the organ at risk and provides the optimal dose distribution for the new patients (9). If the institutions share better KBP models, the plan quality will improve and be standardized. Some studies have shown that KBP plans are acceptable for clinical use in various treatment sites (10-12). In one study, Tamura et al. evaluated the mechanical performance and dose accuracy of plans generated with a KBP model by comparing clinical plans, and found that the KBP system of VMAT for prostate cancer could create plans clinically acceptable for dose accuracy without any major problems (13).
When comparing the dosimetric parameters calculated by each KBP model for prostate cancer in multiple institutions, the performance in sparing OAR varied by the enrolled model (6,14,15). However, Kubo et al. found that MU and MLC sequence complexity calculated with RapidPlan were higher than the clinical plan, and the possibility of passing QA may depend on the KBP model (9). There has been no study comparing mechanical performances calculated with multi-models in KBP. Moreover, we suggest quantifying the effect of MLC aperture and MU at every angle during one full arc on dose distribution as new metrics in evaluating whether to share the KBP model between institutions. This study aimed to evaluate mechanical performances and the effect on deliverability and dose distribution using the KBP models for prostate cancer of three institutions in VMAT.
Materials and Methods
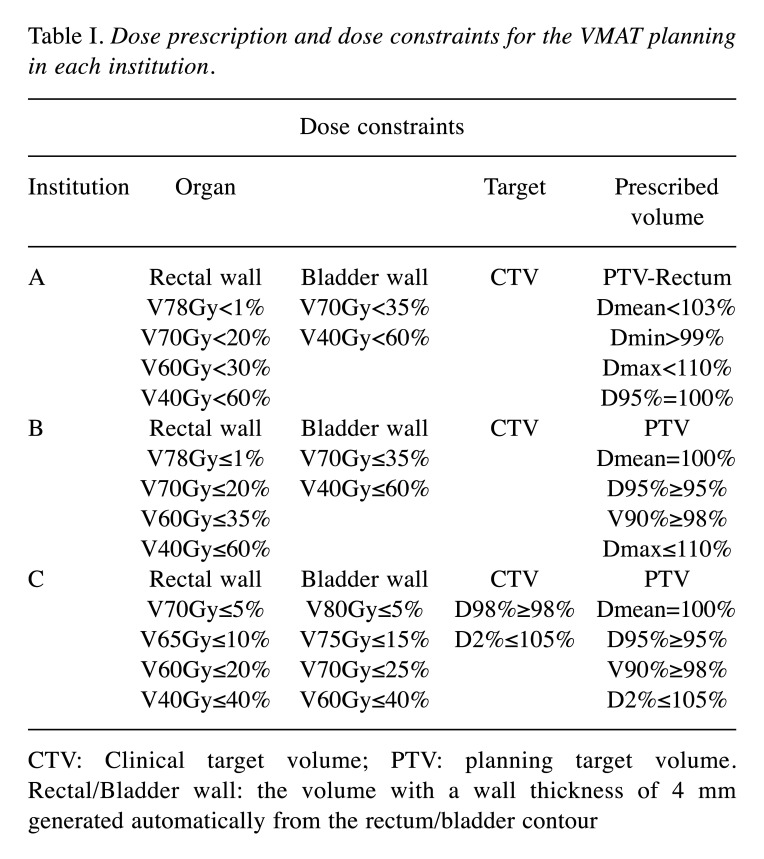
Definitions of structures and planning design at each institution. Three institutions (Institutions A, B, and C) were enrolled in this study. Each KBP model was configured using clinical plans for patients with T1-T2c prostate cancer VMAT in each institution, which had different contouring definitions. The definitions of the clinical target volume (CTV) were the prostate and 15 mm of seminal vesicle (SV), the prostate and half of the SV, and the prostate and 10 mm of SV at institutions A, B, and C, respectively. The planning target volume (PTV) was generated by adding an 8-mm, 8-mm, and 6-mm margin around the CTV in all dimensions, except posteriorly, where 5-mm, 6-mm, and 4-mm margins were used, at institutions A, B, and C, respectively. The definition for the rectum was up to 1.0 cm above and below the PTV, 1.5 cm above the seminal vesicles to 1.5 cm below the prostate, and the tissue extending from the rectosigmoid junction to the anus at institutions A, B, and C, respectively. Table I shows dose prescription and dose constraints for the VMAT planning in each institution.
Table I. Dose prescription and dose constraints for the VMAT planning in each institution.
CTV: Clinical target volume; PTV: planning target volume. Rectal/Bladder wall: the volume with a wall thickness of 4 mm generated automatically from the rectum/bladder contour
In each institution, the model for KBP was created using that institution’s VMAT plans for clinical use before April 2017. At institution A, the PTV minus the rectum was used as the prescribed volume (PV). In institutions B and C, the PTV was used as the PV. The prescription dose was a mean PTV dose of 78 Gy at institutions B and C, and a minimum dose to 95% (D95) of the PTV minus the rectum at institution A. The number of registered cases in institution A, B, and C was 50, 100, and 20, respectively. Each model was clinically accepted at each institution and sent to institution B.
Validation plans for KBP. To validate the performance of KBP at each institution, 45 prostate cancer cases who were clinically treated from May 2017 to April 2018 at institution B were used in a single optimization with the RapidPlan™ system. For these validation plans (VP), a beam energy of 6 MV photons from a TrueBeam STx linear accelerator equipped with a high definition 120-leaf multileaf collimator (MLC) (Varian Medical Systems) was utilized. The treatment field was one full arc rotating counterclockwise from 179˚ to 181˚, with a collimator rotation of 30˚. Institution B accepts one full arc for prostate cancer because dose distribution and time efficiency in one full arc are comparable to and better than that in two - three arc. After calculation, MLC leaf position, gantry speed, and dose rate were defined by each control point (CP) and CPs were spaced 2˚ apart in one full arc. The optimization and calculation algorithms used were the Anisotropic Analytical Algorithm and Photon Optimizer 13.0 (Varian Medical Systems) with Eclipse ver. 13.5, and the grid size was 2.5 mm. The prescription setting for the VP of each model was the same as that of the clinical plan in each institution. Written informed consent was obtained from all patients, and the Institutional Ethics Committee approved this study (Osaka International Cancer Institute review board number: 1611119172).
Dosimetric data analysis. The dose–volume relationship, represented by the dose as a percentage of the prescribed dose to 2.0%, 95%, and 98% of the PV (D2, D95, and D98, respectively) and the volume ratio as receiving 50%, 75%, and 90% of the prescribed dose (V50, V75, and V90, respectively) for the rectum and bladder, was extracted from dose-volume histogram data for VP with each model.
Mechanical performance. To analyze the mechanical performance of the VP, leaf sequence variability (LSV), aperture area variability (AAV), modulation complexity score for VMAT (MCSv), and total monitor units (MU) during one full arc were calculated using in-house software created by MATLAB R2016a (MathWorks, Natick, MA, USA). MCSv is a normalized sum over all CPs of LSV and AAV. The MCSv, LSV, and AAV values range from 0 to 1 and a small value indicates that the MLC motion is complex (1). When the value of LSV and AAV is 1, the field shape is rectangular, and the aperture area equals the maximum aperture area in one full arc. On the other hand, when the value of LSV and AAV is approximately 0, the differences in position between adjacent MLC leaves are large and the aperture area is much smaller than the maximum aperture area in one full arc. In this study, we adopted the mean of these values during one full arc.
In each plan, changes in MU, area aperture (AA) and the product of MU and AA (MU×AA) at each CP were evaluated and represented as MU/CP, AA/CP and MU×AA/CP. Using 45 cases in each institution, the means at every CP, along with the mean and standard deviation (SD) considering all CPs were calculated.
Gamma analysis. We measured the dose response of the three institutions’ plans with an electronic portal imaging device (EPID) detector, aS1200, equipped with a TrueBeam STx linear accelerator. The total area and matrix size of the EPID were 40×40 cm2 and 1,190×1,190 pixels, respectively. All EPID images were acquired in the integrated acquisition mode with a source-to-imager distance of 160 cm. Measured dose responses were compared with planned dose responses using global gamma analysis. The gamma analysis was performed with a criterion of 1%/1 mm (dose difference and distance to agreement) and a threshold at 10% using the commercial software PerFraction (SUN Nuclear corporation, Melbourne, FL, USA) because all plans in the three institutions are 100% in conditions 3%/3 mm and 2%/2 mm.
Statistical analysis. The paired Wilcoxon signed rank test was used to compare dosimetric parameters, mechanical performance, and passing rate of gamma analysis between two of the three institutions. A p-value of <0.05 was considered significant.
Results
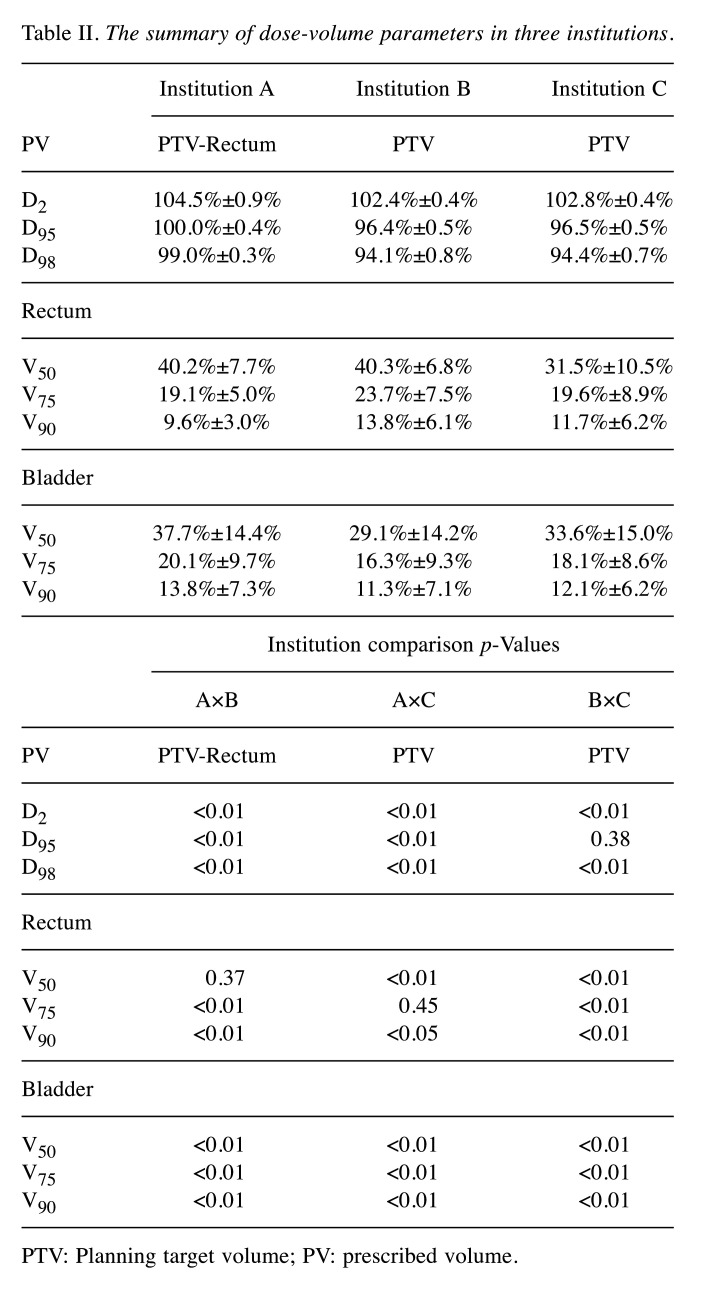
Table II summarizes the results comparing D2, D95, and D98 for the PV and V50, V75, and V90 for the rectum and bladder across the three institutions. For PV, there was a significant difference (p<0.01) between each paired institution, except for D95 between institutions B and C. Institution A had the highest PV among the three institutions, whereas institution B had the lowest.
Table II. The summary of dose-volume parameters in three institutions.
PTV: Planning target volume; PV: prescribed volume.
In the dosimetric parameters for the rectum, there was a significant difference (p<0.01 or 0.05) between each paired institution, except for V50 between institutions A and B, and V75 between institutions A and C. V75 and V90 for institution A, and V50 for institution C were the lowest among the three institutions for the rectum. Regarding the dosimetric parameters for the bladder, there were significant differences (p<0.01) between all pairs. Institution B had the lowest bladder results, whereas institution C had the highest.
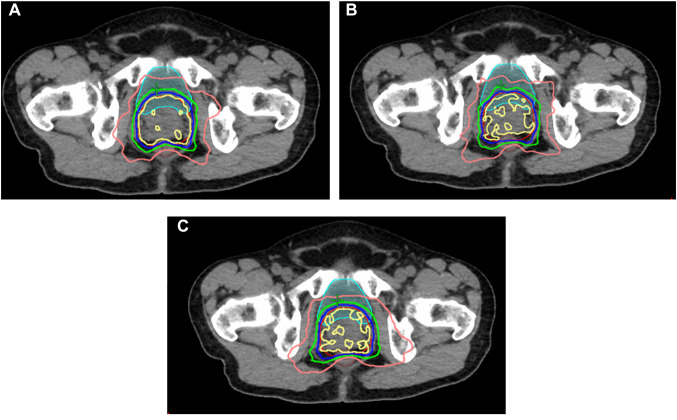
Figure 1 shows the dose distribution in each institution. Institution A had the highest uniformity for a 100% PTV isodose. The lower line of a 50% isodose for institution C expanded the most widely horizontally, especially on the left side. Considering this fact, each model created a characteristic dose distribution.
Figure 1. Comparison of the dose distribution from three institutions’ plans. (A), (B) and (C) show the dose distributions of institutions A, B, and C. Yellow, blue, green, and pink curves indicate 100%, 90%, 75%, and 50% isodose curves, respectively. Red, brown, and light blue curves indicate planning target volume, rectum, and bladder, respectively.
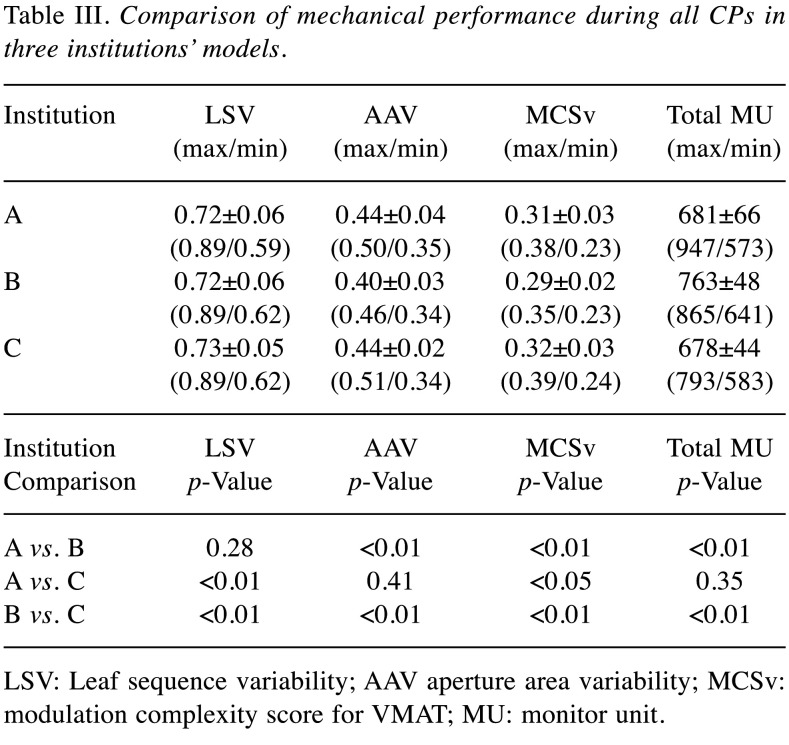
Table III shows the mean, SD and range (max/min) of the LSV, AAV, total MU, and MCSv, as well as the p-value of each mechanical performance in the three groups. Institution C had the highest LSV and there were significant differences in the group that comprises institution C (A vs. C and B vs. C). Institution B had the lowest AAV and MCSv and the highest total MU. There were significant differences (p<0.01 or 0.05) in the group that comprises institution B (A vs. B and B vs. C) for AAV and total MU, and in all groups for MCSv. We found institution B used the closest area of MLC and the most complex modulation.
Table III. Comparison of mechanical performance during all CPs in three institutions’ models.
LSV: Leaf sequence variability; AAV aperture area variability; MCSv: modulation complexity score for VMAT; MU: monitor unit.
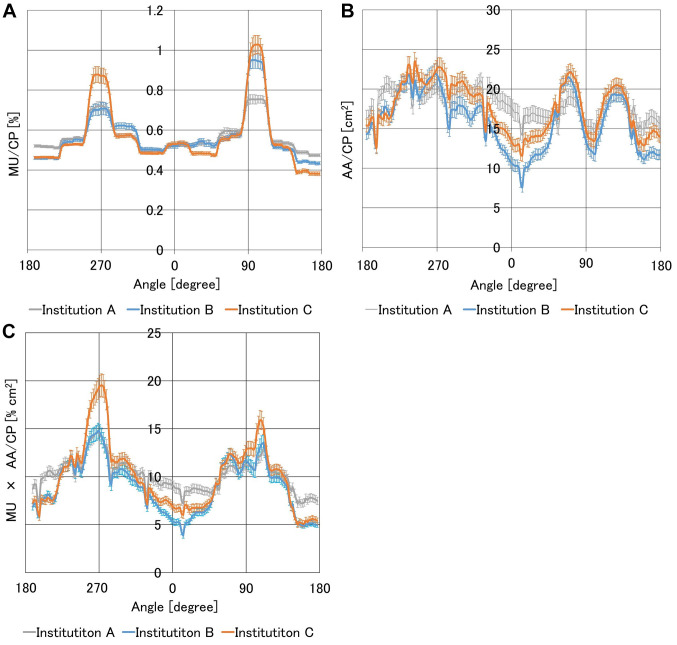
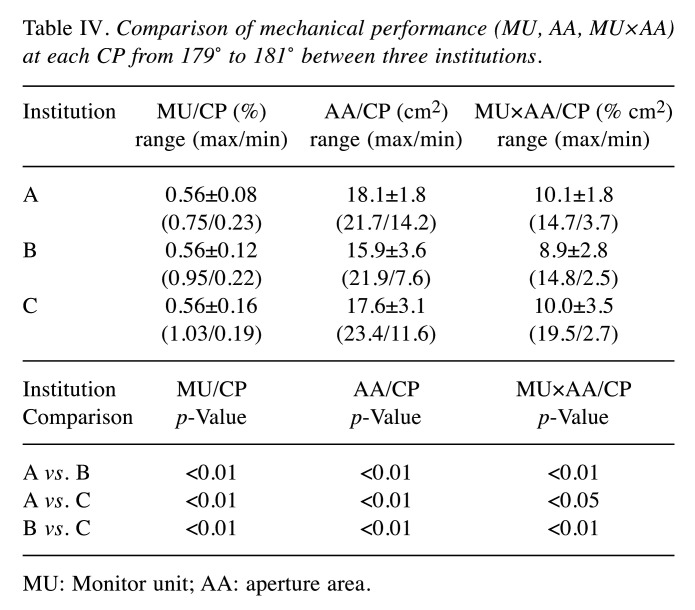
Figure 2 shows the MU/CP, AA/CP, and MU×AA/CP of the three institutions to investigate variation. Table IV shows the mean, SD, and range (max/min) of the MU/CP, AA/CP, and MU×AA/CP among the three institutions from 179˚ to 181˚ and the p values of the three groups. The mean value for the MU/CP in each institution was the same. Institution A had the highest SD and the narrowest range for MU/CP in any parameter. Institution B had the lowest AA/CP and MU×AA/CP. The SD and maximum value for MU×AA/CP in institution C were the highest of the three institutions. Significant differences (p<0.01 or 0.05) were observed in all parameters across institutions.
Figure 2. Comparison of (A) MU/CP, (B) area aperture (AA)/CP, (C) MU×AA/CP as a function of gantry angle in three institutions. The vertical axis represents the MU and the horizontal axis represents the gantry angle. MU, AA, or MU×AA of each CP averaged across 45 plans was plotted for each institution. Error bars represent the standard error. MU: Monitor unit; CP: control point; AA: aperture area.
Table IV. Comparison of mechanical performance (MU, AA, MU×AA) at each CP from 179˚ to 181˚ between three institutions.
MU: Monitor unit; AA: aperture area.
The angle of maximum MU/CP was 101˚, 99˚, and 101˚ for institutions A, B, and C, respectively. The angle of minimum AA/CP was 13˚ for all institutions. The angles of maximum and minimum MU×AA/CP were 269˚ and 13˚ for institution A, 269˚ and 13˚ for institution B, and 273˚ and 153˚ for institution C. In addition to minimum MU×AA/CP, 179˚ and 181˚ were not considered because MU/CP was much lower there. The maximum differences of MU/CP, AA/CP, and MU×AA/CP at each angle were calculated among three institutions. The angle at which the maximum difference was the highest in 1 full arc was 99˚ (0.27%), 1˚ (7.0 cm2) and 275˚ (5.7% cm2), respectively.
For institution A, B, and C, the gamma passing rate was 99.4%±0.6%, 98.9%±1.0% and 99.5%±0.7% (mean±SD), respectively, and was >95% for all cases with a criterion of 1%/1 mm. There were significant differences (p<0.01) in gamma passing rate between the groups pairing institution B (A vs. B and B vs. C).
Discussion
In this study, we evaluated mechanical performance using prostate cancer models in VMAT and compared the complexity of MLC motion and dose distribution across three institutions. Regarding complexity, significant differences in MCSv were observed, but the plans were deemed clinically acceptable despite MCSv affecting gamma passing rate (1). The dose distribution of each institution met institution B’s dose constraint and significant differences in dosimetric parameters of the target and OAR were observed. By quantifying MLC motion in each CP, through MU/CP, AA/CP and MU×AA/CP, it was found that the tendencies of the beam irradiation in each gantry angle varied between models and might link to OAR sparing. In summary, KBP model plans were clinically acceptable for deliverability regardless of the structure set. However, there is a need to select models considering individual institutional plan design because it affects dose distribution to the target and OAR by MLC motion.
Institution B obtained the lowest result for MCSv and gamma passing rate and the highest result for total MU among the three institutions, thus its model created the most complex plans in which the dosimetric accuracy is the lowest. In one study by Sarah et al., when the modulation complexity of score (MCS) for a step-and-shoot IMRT static beam was greater than 0.35 (MCS >0.35), all gamma passing rates (3%/3 mm) were greater than 95% (16). In this study, the gamma passing rates were >95% for all cases in each institution for the criterion of 1%/1 mm, while some plans had MCSv <0.35, thus KBP plans were applied clinically without any major problem regardless of mechanical performance. It was assumed that the models could create the plans with high dosimetric accuracy (gamma passing rate) because clinically acceptable cases registered in each model in this study had simple MLC aperture. If models consisting of complex cases create the plans, the gamma passing rate may decrease.
Among VP with each model, we compared MU/CP, AA/CP, and MU×AA/CP at each gantry angle. In Figure 2, the standard error of three parameters for each model were small, and the beam irradiation hardly changed in 45 plans. The angle for institutions A and B where MU×AA/CP reached its maximum and minimum was about 270˚ and 10˚, respectively, while the angle for institution C was about 270˚ and 150˚. Each model created plans where the irradiation intensity from lateral direction was higher because of avoiding the rectum. However, focusing on MU×AA/CP for institution A and C, there is a difference in the tendency of the beam irradiation. Institution A irradiated the most evenly at any angle as can be seen from Figure 2 because SD and range for institution A were lower and narrower. On the other hand, institution C also had higher MU×AA/CP at approximately 90˚ and 270˚, and lower MU×AA/CP at approximately 0˚ and 180˚ than institution A. Therefore, the difference in the tendency of the beam irradiation affected model’s sparing performance where the mean of V50 for rectum in institution C was the lowest of the three institutions, and the 50% isodose curve of institution C extended more widely than that of institution A. Evaluating some plans created with a model in order to understand the model feature will serve as a tool for model sharing between institution.
Conclusion
Each KBP model had different dose distributions and mechanical performance but could create an acceptable plan for deliverability regardless of mechanical performance. MLC aperture and MU at every CP indicated institution’s tendency of beam irradiation to understand model feature.
Conflicts of Interest
No conflicts of interest exist regarding this study.
Authors’ Contributions
Software development: Tsuru H, Masaoka A, Ueda Y, Ohira S; Research design: Tsuru H, Ueda Y, Tamura M, Monzen H, Mizuno H, Miyazaki M; Manuscript writing: Tsuru H, Ueda Y, Konishi K, Inui S, Koizumi M.
Acknowledgements
This work was supported by a Grant-in Aid for Scientific Research (C) (grant number JP18K07632) and a JSPS KAKENHI Grant (grant number 21K07728). This study was funded by a Japanese Society of Radiological Technology (JSRT) Research Grant (2019,2020).
References
- 1.Masi L, Doro R, Favuzza V, Cipressi S, Livi L. Impact of plan parameters on the dosimetric accuracy of volumetric modulated arc therapy. Med Phys. 2013;40(7):071718. doi: 10.1118/1.4810969. [DOI] [PubMed] [Google Scholar]
- 2.Otto K. Volumetric modulated arc therapy: IMRT in a single gantry arc. Med Phys. 2008;35(1):310–317. doi: 10.1118/1.2818738. [DOI] [PubMed] [Google Scholar]
- 3.Intensity Modulated Radiation Therapy Collaborative Working Group Intensity-modulated radiotherapy: current status and issues of interest. Int J Radiat Oncol Biol Phys. 2001;51(4):880–914. doi: 10.1016/s0360-3016(01)01749-7. [DOI] [PubMed] [Google Scholar]
- 4.Sale C, Moloney P. Dose comparisons for conformal, IMRT and VMAT prostate plans. J Med Imaging Radiat Oncol. 2011;55(6):611–621. doi: 10.1111/j.1754-9485.2011.02310.x. [DOI] [PubMed] [Google Scholar]
- 5.Studenski MT, Bar-Ad V, Siglin J, Cognetti D, Curry J, Tuluc M, Harrison AS. Clinical experience transitioning from IMRT to VMAT for head and neck cancer. Med Dosim. 2013;38(2):171–175. doi: 10.1016/j.meddos.2012.10.009. [DOI] [PubMed] [Google Scholar]
- 6.Ueda Y, Fukunaga JI, Kamima T, Adachi Y, Nakamatsu K, Monzen H. Evaluation of multiple institutions’ models for knowledge-based planning of volumetric modulated arc therapy (VMAT) for prostate cancer. Radiat Oncol. 2018;13(1):46. doi: 10.1186/s13014-018-0994-1. [DOI] [PMC free article] [PubMed] [Google Scholar]
- 7.Wuthrick EJ, Zhang Q, Machtay M, Rosenthal DI, Nguyen-Tan PF, Fortin A, Silverman CL, Raben A, Kim HE, Horwitz EM, Read NE, Harris J, Wu Q, Le QT, Gillison ML. Institutional clinical trial accrual volume and survival of patients with head and neck cancer. J Clin Oncol. 2015;33(2):156–164. doi: 10.1200/JCO.2014.56.5218. [DOI] [PMC free article] [PubMed] [Google Scholar]
- 8.Tamura M, Monzen H, Matsumoto K, Kubo K, Ueda Y, Kamima T, Inada M, Doi H, Nakamatsu K, Nishimura Y. Influence of cleaned-up commercial knowledge-based treatment planning on volumetric-modulated arc therapy of prostate cancer. J Med Phys. 2020;45(2):71–77. doi: 10.4103/jmp.JMP_109_19. [DOI] [PMC free article] [PubMed] [Google Scholar]
- 9.Kubo K, Monzen H, Ishii K, Tamura M, Kawamorita R, Sumida I, Mizuno H, Nishimura Y. Dosimetric comparison of RapidPlan and manually optimized plans in volumetric modulated arc therapy for prostate cancer. Phys Med. 2017;44:199–204. doi: 10.1016/j.ejmp.2017.06.026. [DOI] [PubMed] [Google Scholar]
- 10.Ueda Y, Miyazaki M, Sumida I, Ohira S, Tamura M, Monzen H, Tsuru H, Inui S, Isono M, Ogawa K, Teshima T. Knowledge-based planning for oesophageal cancers using a model trained with plans from a different treatment planning system. Acta Oncol. 2020;59(3):274–283. doi: 10.1080/0284186X.2019.1691257. [DOI] [PubMed] [Google Scholar]
- 11.Kamima T, Ueda Y, Fukunaga JI, Shimizu Y, Tamura M, Ishikawa K, Monzen H. Multi-institutional evaluation of knowledge-based planning performance of volumetric modulated arc therapy (VMAT) for head and neck cancer. Phys Med. 2019;64:174–181. doi: 10.1016/j.ejmp.2019.07.004. [DOI] [PubMed] [Google Scholar]
- 12.Kubo K, Monzen H, Ishii K, Tamura M, Nakasaka Y, Kusawake M, Kishimoto S, Nakahara R, Matsuda S, Nakajima T, Kawamorita R. Inter-planner variation in treatment-plan quality of plans created with a knowledge-based treatment planning system. Phys Med. 2019;67:132–140. doi: 10.1016/j.ejmp.2019.10.032. [DOI] [PubMed] [Google Scholar]
- 13.Tamura M, Monzen H, Matsumoto K, Kubo K, Otsuka M, Inada M, Doi H, Ishikawa K, Nakamatsu K, Sumida I, Mizuno H, Yoon DK, Nishimura Y. Mechanical performance of a commercial knowledge-based VMAT planning for prostate cancer. Radiat Oncol. 2018;13(1):163. doi: 10.1186/s13014-018-1114-y. [DOI] [PMC free article] [PubMed] [Google Scholar]
- 14.Ueda Y, Monzen H, Fukunaga JI, Ohira S, Tamura M, Suzuki O, Inui S, Isono M, Miyazaki M, Sumida I, Ogawa K, Teshima T. Characterization of knowledge-based volumetric modulated arc therapy plans created by three different institutions’ models for prostate cancer. Rep Pract Oncol Radiother. 2020;25(6):1023–1028. doi: 10.1016/j.rpor.2020.08.011. [DOI] [PMC free article] [PubMed] [Google Scholar]
- 15.Monzen H, Tamura M, Ueda Y, Fukunaga JI, Kamima T, Muraki Y, Kubo K, Nakamatsu K. Dosimetric evaluation with knowledge-based planning created at different periods in volumetric-modulated arc therapy for prostate cancer: a multi-institution study. Radiol Phys Technol. 2020;13(4):327–335. doi: 10.1007/s12194-020-00585-0. [DOI] [PubMed] [Google Scholar]
- 16.Ghandour S, Matzinger O, Pachoud M. Volumetric-modulated arc therapy planning using multicriteria optimization for localized prostate cancer. J Appl Clin Med Phys. 2015;16(3):5410. doi: 10.1120/jacmp.v16i3.5410. [DOI] [PMC free article] [PubMed] [Google Scholar]


